MHD Casson nanofluid flow over a three-dimensional exponentially stretching surface with waste discharge concentration: A revised Buongiorno’s model
-
Kalleshachar Vinutha
 and
Mohammad Yar
and
Mohammad Yar

Abstract
Evaluating the concentration of waste discharge across an exponential stretching surface is crucial for its environmental impact. In both ecological and industrial networks, wastewater management is crucial. The present study focuses on the prevention and analysis of the contamination of fluid assets by harmful chemicals. By analyzing these interactions, the present study examines steady, incompressible Casson fluid circulation under the influence of waste discharge concentration via a three-dimensional exponentially stretching sheet. The influence of thermophoresis, Brownian motion, and magnetic field was also examined. Governing equations can be transformed into the form of ordinary differential equations by utilizing the proper similarity operations. These simplified equations are resolved computationally using Runge–Kutta–Felhberg-45 and the shooting approach. The impacts of dimensionless parameters on each person’s profile are being examined using graphs. Furthermore, certain essential engineering coefficients are being explored. The predominant results are that in both directions, the magnetic and Casson fluid decreases velocities. Buoyancy constraint will increase the velocity while thermophoresis and Brownian contribute to an increase in temperature. An 8.04% increase in temperature is seen for thermophoresis. Skin friction increases with a significant increase in magnetic and Casson parameters, where thermophoresis and local pollutant decreases the rate of mass transmission.
1 Introduction
Many intricate models were put up by researchers to describe various types of fluids that contained non-Newtonian processes. Casson liquid (C-F) was initially shown by Casson in 1959. Casson fluid’s rheological properties in connection to the shear stress–strain relationship make it a non-Newtonian fluid. At lower shear strain, it behaves like a flexible solid, while at a critical stress value, it behaves like a Newtonian fluid. The shear-thinning liquid is the best way to describe a C-F; it possesses zero viscosity at an infinite rate of shear and infinite viscosity at zero shear rates. Human blood, sauce, honey, soup, and fruit juice are a few typical liquids that have C-F properties. C-F is used practically in the fields of crude oil drilling process, polymeric technology, certain separation procedures, and food and paper manufacturing. Additionally, the C-F has crucially important applications in the fields of biology, chemistry, medicine, and technology. Yaseen et al. [1] probed the heat generation/absorption and heat radiation of both nano and hybrid nanoliquid motion across parallel surfaces in a Darcy permeable substrate. Using the finite difference approach, Raza et al. [2] studied entropy formation in Casson nanofluid (C-NF) circulation containing motile gyrotactic microorganisms. Arruna Nandhini et al. [3] probed the influence of the exponential parameter and radiation constraint on a chemically reactive C-F through a sheet that extends exponentially. Lone et al. [4] examined numerically the bioconvective circulation of a hybrid Casson nanoliquid impacted by MHD via a porous exponentially extending sheet using thermophoresis and Brownian movement processes. Afzal et al. [5] scrutinized the behavior of microorganisms in C-F circulation across an elongated surface with a non-uniform source and multilinear regression. Behera et al. [6] probed the influence of thermal and solutal buoyancy on the non-Newtonian C-NF motion across the exponentially expanding sheet embedded with the chemical process, heat radiation, and porous medium.
Conducting fluids with external magnetic fields exhibit distinct behaviors due to the intricate interaction between electromagnetic forces and the flow of fluid in the magnetic field in fluid movement. Magnetic fields have a large impact on fluid movement, especially in fluids that conduct electricity, according to magnetohydrodynamics. Applications for magnetic processes have been found in metallurgical, nuclear fusion reactors, drug delivery systems, the polymers sector, and the enlargement of plastic sheets. Specifically, some metallurgical techniques entail cooling continuous strips by taking them via a quiescent fluid; occasionally, these strips are stretched during the drawing process. Numerous studies have been performed to explore the implications of magnetic fields on fluid circulation concerning its numerous uses. Using computational technique, Kumar et al. [7] scrutinized how magnetohydrodynamic microfluid circulation melts through an ESS (exponentially stretching sheet) in the presence of heat radiation and velocity slip. Madhukesh et al. [8] probed the effect of radiation on the aggregation of magnetized nanoparticles across a Riga plate in nanoliquid circulation. Amjad et al. [9] examined two possibilities of heat transmission in a tangent hyperbolic nanofluid circulation across an ESS with prescribed exponential order heat flux and exponential order surface temperature. Ramesh et al. [10] examined the effects of AE (activation energy), CR (chemical reaction), magnetic field, and HSS (heat generation/absorption) on the mass and temperature circulation of a nanofluid moving toward a lubricated surface. For Darcy–Forchheimer Williamson C-F via an exponentially extending sheet, Saleem et al. [11] studied the effects of thermal radiation, momentum fields, Joule heating, and suction/injection. Hiremath et al. [12] emphasized the sensitivity evaluation of nanofluid circulation in a composite square enclosure with a corrugated surface in the presence of a porous medium and magnetic field.
Convection can be classified into two categories: forced convection and natural convection. Heat transport in fluids that combines the effects of forced and natural convection at the same time is known as mixed convection. There are several applications within the industry for mixed convection boundary layer flows, including heat exchangers, nuclear reactor cooling, electronic device cooling, central solar receivers, and the installation of radiant floor heating in low-velocity situations. Regarding many such applications, a great deal of work has been done to explore the effects of mixed convection on boundary layer motion. There are a few recent findings regarding studies on mixed convection. Chen et al. [13] examined how a porous extended sheet with radiative thermal transmission is affected by an angled magnetic field in an unstable mixed convective stagnation point circulation. Faisal et al. [14] examined the mixed convective flow across flexible porous discs using the thermal performance of dispersed inorganic hybrid nanoparticles. Manigandan and Satya Narayana [15] probed the computational simulation of a continuous mixed convection nanofluid hybrid circulation with slip boundary conditions (BCs) via an ESS with varying thermal conductivities, heat production, and heat radiation. Zainodin et al. [16] probed the impacts of magnetohydrodynamics, velocity slip, and heat generation/absorption on the stagnation point of mixed convection circulation associated with hybrid ferrofluids via an ESS surface. In a permeable media with temperature-dependent fluid characteristics, the mixed convection magnetohydrodynamics boundary layer motion, thermal, and mass movement of a Newtonian liquid composition via an exponentially extended porous sheet was computationally studied by Konwar et al. [17]. Magnetohydrodynamic hybrid nanoliquid circulation via an exponentially extending surface with mixed convection and an irregular heat source/sink was numerically evaluated by Naseem and Ghafoor Kasana [18].
Heat and mass transmission in the fluids are greatly influenced by both thermophoresis and Brownian movement. Brownian motion is the term used to explain the erratic motion of nanoparticles that are suspended in a fluid as a result of their interactions with the fast-moving molecules in the fluid. Numerous requests are made for it in the fields of electrical engineering, astronomy, and the field of nanotechnology plasma experiments. A heat gradient causes different suspended particles to produce a force known as thermophoresis (or thermo-diffusion). Applications include the discovery of drugs, aerosol production, optical fibers, microemulsions, semiconductors, the field of electrostatics, distinguishing different polymer particles, and the distinction of microscopic particles in gas passages. In recent investigations regarding thermophoresis and Brownian motion, Sharma et al. [19] probed the significance of heat radiation and a magnetic field on unsteady circulation in a permeable medium with thermophoresis and Brownian movements via an angled extended sheet when microorganisms and Arrhenius activation are combined. Mehta and Kataria [20] evaluated the strong viscoelastic fluid stream via a stretchy surface with the impact of thermodiffusion, chemical interactions, and Brownian motion. Hussain et al. [21] probed how mass and heat are transferred for magnetohydrodynamic hybrid nanoliquid motion on an extending sheet owing to chemical processes, AE, thermophoresis, Brownian movement, and heat radiation. Gul et al. [22] examined the effect of nonlinear CR, heat radiation, viscous dissipation, and HSS on hybrid nanofluid motion via a bidirectionally extended sheet when subjected to thermophoretic and Brownian motion. Sudarmozhi et al. [23] studied the complex interactions between several variables, which include thermophoresis, AE, and Brownian motion of a Maxwell fluid through an expanding sheet. By using stability analysis of dual solutions, Duguma et al. [24] probed the effects of thermophoresis and Brownian motion, CR, and porous medium of Casson nanofluid circulation via a slippery sheet.
Pollutant concentration affects nature, animals, and living things. It is the quantity of hazardous waste products in the land, water, or air. River pollution is one of the numerous harmful environmental effects that are mostly caused by industrial production. Water consumption limits and a significant loss of aquatic biological variety are just two of the detrimental impacts of pollution concentration on the river system. These contaminants are extremely dangerous to aquatic and terrestrial life because of their cytogenetic and mutagenic effects on reproductive organs, endocrine disturbance, hormonal interference, and allergic responses. A fluid’s viscosity level will be negatively impacted by the presence of impurities, and as a result, there is an alteration in viscosity levels. Initial findings have been produced by research studies regarding the influences of external pollution source properties on pollutant concentrations. Scientists have examined how fluid flow across various geometries is impacted by the quantity of pollutants discharged. The effect of pollutant discharge concentration on fluid movement and concentration has been the subject of recent research. Using the numerical method, Chinyoka and Makinde [25] inspected the influence of the concentration of pollutants on the unstable fluid motion via a rectangular channel. By employing the numerical technique, Li et al. [26] probed how an induced magnetic field affected the concentration of waste discharge impacts and the circulation of hybrid nanoliquids through an expanded surface with an endothermic/exothermic CR. A non-Newtonian Eyring–Powell hybrid nanofluid motion via an extending surface with a magnetic field, an uneven heat sink/source, and the concentration of waste discharge was computationally probed by Yaseen et al. [27]. Vinutha et al. [28] probed the motion of tri-hybrid nanofluids along convergent and divergent channels, taking into account concentration contaminants and irregular heat generation/absorption. Ouyang et al. [29] analyzed the implications of convective BCs and discharge concentration on the circulation of an unstable hybrid nanofluid approaching the stagnation zone in a porous substrate. Xin et al. [30] probed the effects of pollutant discharge concentration and heat radiation on non-Newtonian nanofluid circulation on a Riga sheet.
According to the literature review, there are no studies on how thermophoresis, Brownian motion, and waste discharge concentration affect a Casson fluid flow via a three-dimensional (3D) exponential extended sheet. To close this gap, the current work examines the steady, incompressible, 3D Casson fluid circulation that is influenced by thermophoresis, waste discharge concentration, Brownian movement, and magnetic field through an exponentially extended sheet. Dimensional governing equations are transformed into ordinary differential equations (ODEs) without dimensions by utilizing the appropriate similarity substitutions. Using the shooting approach and Runge–Kutta–Felhberg-45, these reduced equations are numerically solved. Graphs are utilized to analyze the impact of dimensionless factors on each individual’s profile. We presented a comparison of the present work to published work (Table 1). A few important engineering coefficients have also being examined (Table 2).
Comparison of the present work with previous studies
| References | [4] | [31] | [32] | Present work |
|---|---|---|---|---|
| 3D ESS | ✗ | ✓ | ✓ | ✓ |
| Casson fluid | ✓ | ✗ | ✓ | ✓ |
| Magnetic field | ✓ | ✓ | ✓ | ✓ |
| Thermophoresis and Brownian motion | ✓ | ✓ | ✓ | ✓ |
| Mixed convection | ✓ | ✗ | ✗ | ✓ |
| Pollutant concentration | ✗ | ✗ | ✗ | ✓ |
| Skin friction |
|
|
| where
|
||
|
|
|
|
| where
|
||
| Nusselt number |
|
|
| Sherwood number |
|
|
2 Mathematical formulation
Consider the effects of a magnetic field, mixed convection, thermophoresis, and Brownian motion on a constant, incompressible, 3D Casson fluid flow via an ESS (Figure 1). Additionally, the concentration equation took into account the discharge concentration effect. The magnetic field is given by
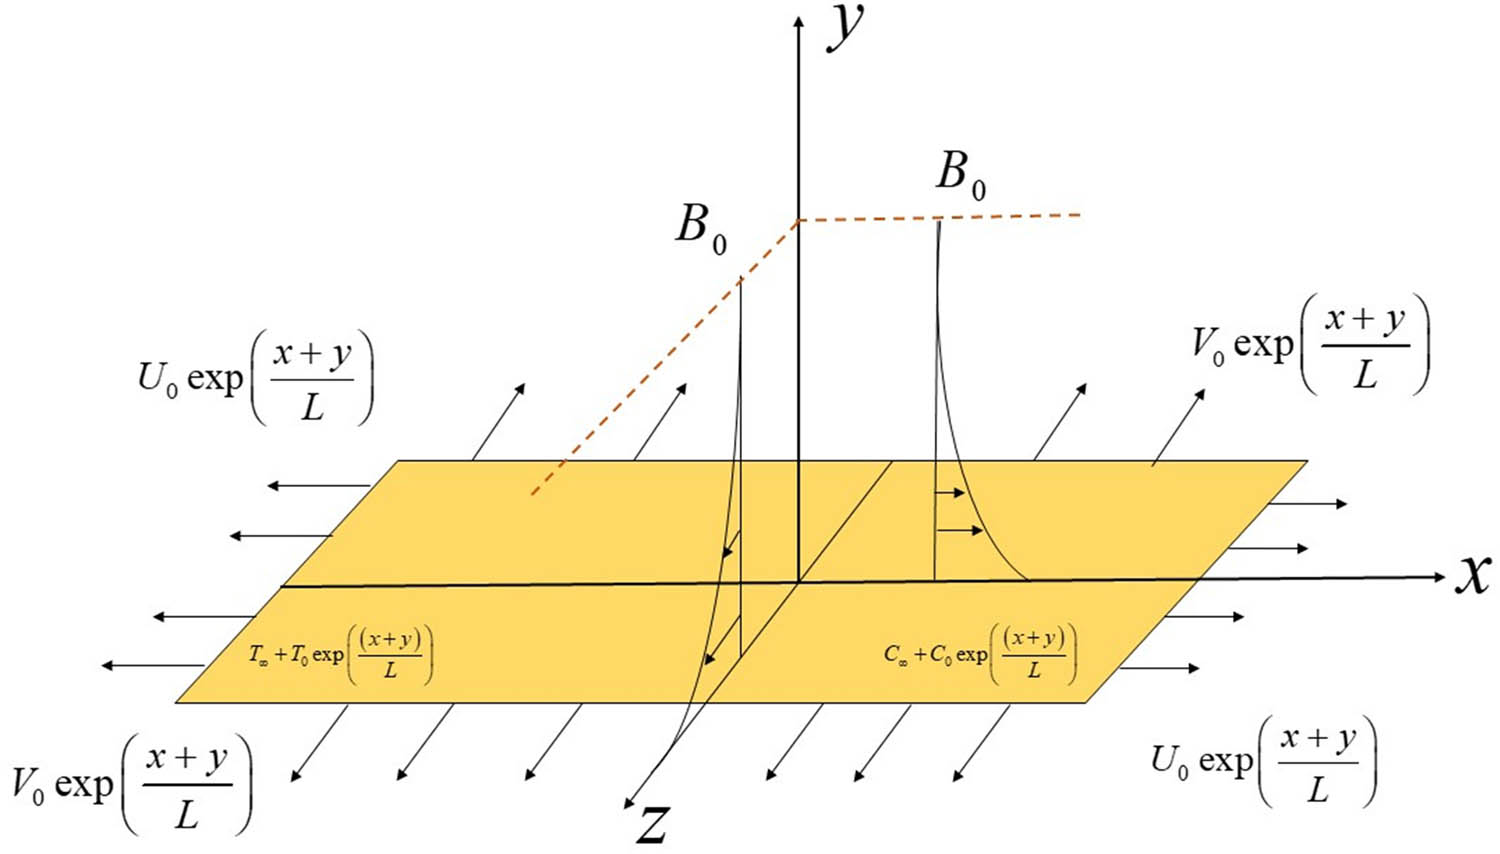
Flow configuration.
The above assumptions are described by the following equations (see [25,34,35]):
Suitable BCs are
The corresponding similarity transformations are (see [35]) as follows:
The simplified forms of equations (2)–(5) are as follows:
Reduced BCs are as follows:
Dimensionless parameters are as follows:
where
Here,
3 Numerical method
Equations (8)–(11) and BCs (12) are resolved by using the Runge–Kutta–Felhberg-45 and the shooting technique. Since these are higher-order equations, solving them is challenging. The following substitutions need to be used to make these equations first order to solve them:
With BCs
Using the RKF-45 method, the transformed equations (15)–(18) and BCs (19) are computationally solved, and the shooting procedure is used to extract the unknowns found in the BCs (19) with a step size of
Validation of
| Casson parameter | Magnetic field | [33] | [36] | Present study |
|---|---|---|---|---|
| 5 | 0 | 1.197426 | 1.197425 | 1.197415 |
|
|
0 | 1.093257 | 1.093252 | 1.093253 |
| 5 | 10 | 3.660730 | 3.660730 | 3.660761 |
|
|
10 | 3.342023 | 3.342020 | 3.342073 |

Flow chart.
4 Results and discussion
The influences of Brownian motion, waste discharge concentration, thermophoresis, and magnetic field on steady, incompressible, 3-D flow for the Casson fluid across an exponential stretched sheet are investigated numerically. The effects of dimensionless characteristics on their profiles are determined using graphs. Also, important engineering coefficients are investigated.
Figures 3 and 4 illustrate

Impact of the Casson parameter on the axial velocity profile.

Impact of the Casson parameter on the transverse velocity profile.
Figures 5 and 6 demonstrate the effect of

Impact of the ratio of stretching velocities on the axial velocity profile.

Impact of the ratio of stretching velocities on the transverse velocity profile.
The estimation of the velocity profile

Impact of the mixed convective parameter on the axial velocity profile.
Figure 8 shows the effect of the concentration buoyancy on

Impact of the concentration buoyancy on axial velocity profile.
Figures 9 and 10 show a visual representation of how

Impact of magnetic field on the axial velocity profile.

Impact of magnetic field on the transverse velocity profile.
The effect of the temperature exponent

Impact of the temperature exponent on the temperature profile.
Figure 12 shows a visual representation of how

Impact of Brownian motion on the temperature profile.
The impact of

Impact of the thermophoresis parameter on the temperature profile.
Figure 14 shows the effect of the ratio of stretching velocities on

Impact of the ratio of stretching velocities on the temperature profile.
Figures 15 and 16 show the effects of

Impact of the external pollutant source variation on the concentration profile.

Impact of the local pollutant source on the concentration profile.
Figure 17 shows the effect of the concentration exponent

Impact of the concentration exponent on the concentration profile.
Figure 18 shows how

Impact of Brownian motion on the concentration profile.
Figure 19 shows the impact of the thermophoresis parameter on

Impact of the thermophoresis parameter on the concentration profile.
Figure 20 shows the effect of

Impact of the ratio of stretching velocities on the concentration profile.
Figures 21 and 22 show the results of

Impact of magnetic field on skin friction (in the

Impact of magnetic field on the skin friction (in the
Nusselt number is affected by changes in

Impact of magnetic field on Nusselt number for changing values of thermophoresis.
The effect of the thermophoresis parameter and the local pollutant source constraint on

Impact of the local pollutant source on Sherwood number for varying values of the thermophoresis parameter.
5 Conclusion
The impacts of magnetic field, thermophoresis, Brownian movement, and waste discharge concentration on steady, incompressible, 3D flow for the Casson fluid model across an exponentially extended sheet are examined in the present study. Additionally, appropriate similarity variables are utilized to convert dimensional equations into a set of non-dimensional ODEs. These equations were resolved by utilizing the Runge–Kutta–Felhberg-45 and the shooting technique and graphs to examine how dimensionless characteristics affected their profiles. In addition, a few major engineering coefficients are studied. Key results are listed as follows:
In both directions
The higher the values of the buoyancy concentration parameter, it increases the velocity from 46.61 and 52.13% (0–1 and 1–2).
The temperature increases with an increase in the Brownian motion and thermophoresis parameter. The thermophoresis shows greater thermal distribution than the Brownian parameter (by about 8.04% for the values ranging from 0.5 to 1).
The concentration increases with an increase in the local pollutant source parameter and external pollutant source variation parameter. More increase in the concentration profile is seen for a small increase in the local pollutant source parameter values (69.56 and 36.74%).
Skin friction is significantly increased when the Casson parameter and the magnetic field parameter are increased together.
The Sherwood number decreases when the thermophoresis parameter and the local pollutant source parameter increase.
The current work is limited to studying the impacts of magnetic field, thermophoresis, Brownian movement, and waste discharge concentration on steady, incompressible, 3D flow for the Casson fluid model across an exponentially extended sheet. The present study can be extended to examine the impacts of different physical phenomena and distinct types of nanoparticles. The study can also be extended to verify the artificial neural network model, and optimization techniques can be conducted to examine the pertinent parameter influences on heat and mass transmission.
The outcomes of the present work are useful in polymer processing and industrial coatings, drug delivery systems, pollution control and treatment of wastewater, electronic gadgets cooling systems, and metallurgical engineering sectors.
-
Funding information: This work received no external funding.
-
Author contributions: K.V.: data curation, writing–original draft; J.K.M.: resources and software; K.V.P.: conceptualization and formal analysis; A.K.: investigation and data curation; N.A.S: methodology and visualization; M.Y.: formal analysis and validation. K. Vinutha and Nehad Ali Shah contributed equally to this work and are co-first authors.
-
Conflict of interest: The authors have no conflicts of disclose.
-
Ethical approval statement: The conducted research is not related to either human or animal use.
-
Data availability statement: The data will be made available from the corresponding author on a reasonable request.
References
[1] Yaseen M, Rawat SK, Shafiq A, Kumar M, Nonlaopon K. Analysis of heat transfer of mono and hybrid nanofluid flow between two parallel plates in a darcy porous medium with thermal radiation and heat generation/absorption. Symmetry. 2022 Sep;14(9):1943.10.3390/sym14091943Search in Google Scholar
[2] Raza Q, Wang X, Ali B, Li S, Shah NA, Yang H. Computational study on entropy generation in Casson nanofluid flow with motile gyrotactic microorganisms using finite difference method. Chaos Solit Fractals. 2025 Jan;190:115758.10.1016/j.chaos.2024.115758Search in Google Scholar
[3] Arruna Nandhini C, Jothimani S, Chamkha AJ. Combined effect of radiation absorption and exponential parameter on chemically reactive Casson fluid over an exponentially stretching sheet. Partial Differ Equ Appl Math. 2023 Dec;8:100534.10.1016/j.padiff.2023.100534Search in Google Scholar
[4] Lone SA, Shamshuddin MD, Shahab S, Iftikhar S, Saeed A, Galal AM. Computational analysis of MHD driven bioconvective flow of hybrid Casson nanofluid past a permeable exponential stretching sheet with thermophoresis and Brownian motion effects. J Magn Magn Mater. 2023 Aug;580:170959.10.1016/j.jmmm.2023.170959Search in Google Scholar
[5] Afzal U, Shah NA, Abdal S, Chung JD. Modeling the behavior of microorganisms in a thermal radiation MHD Casson fluid flow over a stretching sheet using multilinear regression and streamlines analysis with non-uniform source. J Therm Anal Calorim. 2025 Jan.10.1007/s10973-024-13768-3Search in Google Scholar
[6] Behera S, Dash AK, Mishra SR. Illustration of buoyant forces on Casson nanofluid flow through an exponentially stretching sheet with thermal radiation and chemical reaction. Heat Transf. 2022;51(7):6762–81.10.1002/htj.22622Search in Google Scholar
[7] Kumar R, Singh J, Mehta R, Kumar D, Baleanu D. Analysis of the impact of thermal radiation and velocity slip on the melting of magnetic hydrodynamic micropolar fluid-flow over an exponentially stretching sheet. Therm Sci. 2023;27:311–22.10.2298/TSCI23S1311KSearch in Google Scholar
[8] Madhukesh JK, Paramesh SO, Prasanna GD, Prasannakumara BC, Khan MI, Abdullaev S, et al. Impact of magnetized nanoparticle aggregation over a Riga plate with thermal radiation in water-Al2O3 based nanofluid flow. ZAMM - J Appl Math Mech Z Für Angew Math Mech. 2024;e202300270.10.1002/zamm.202300270Search in Google Scholar
[9] Amjad M, Khan MN, Ahmed K, Ahmed I, Akbar T, Eldin SM. Magnetohydrodynamics tangent hyperbolic nanofluid flow over an exponentially stretching sheet: Numerical investigation. Case Stud Therm Eng. 2023 May;45:102900.10.1016/j.csite.2023.102900Search in Google Scholar
[10] Ramesh GK, Madhukesh JK, Hiremath PN, Roopa GS. Thermal transport of magnetized nanoliquid flow over lubricated surface with activation energy and heat source/sink. Numer Heat Transf Part B Fundam. 2024 Jul;85(7):922–39.10.1080/10407790.2023.2257880Search in Google Scholar
[11] Saleem M, Hussain M, Inc M. Significance of Darcy–Forchheimer law and magnetic field on the comparison of Williamson–Casson fluid subject to an exponential stretching sheet. Int J Mod Phys B. 2023 Oct;37(27):2350315.10.1142/S0217979223503150Search in Google Scholar
[12] Hiremath P, Hanumagowda BN, Subray PVA, Sharma N, Varma SVK, Muhammad T, et al. Sensitivity analysis of MHD nanofluid flow in a composite permeable square enclosure with the corrugated wall using Response surface methodology-central composite design. Numer Heat Transf Part Appl [Internet]. 2024;1–18.10.1080/10407782.2024.2350029Search in Google Scholar
[13] Chen H, Rehman MIU, Katbar NM, Hamid A, Duraihem FZ, Qi H. Effect of an inclined magnetic field on unsteady mixed convective stagnation point flow over a permeable stretching sheet with radiative heat transfer. Phys Scr. 2023 Aug;98(9):095255.10.1088/1402-4896/acf1daSearch in Google Scholar
[14] Faisal M, Qureshi MZA, Shah NA. Thermal performance of DispersedInorganic magnetic hybrid nanomaterials into mixed convective flow through flexible porous disks. ZAMM - J Appl Math Mech Z Für Angew Math Mech. 2025;105(1):e202301049.10.1002/zamm.202301049Search in Google Scholar
[15] Manigandan A, Satya Narayana PV. Influence of variable thermal conductivity and mixed convection on hybrid nanofluid (SWCNT + MWCNT/H2O) flow over an exponentially elongated sheet with slip conditions. Indian J Phys. 2024 Apr;98(4):1401–14.10.1007/s12648-023-02912-8Search in Google Scholar
[16] Zainodin S, Jamaludin A, Nazar R, Pop I. MHD mixed convection of hybrid ferrofluid flow over an exponentially stretching/shrinking surface with heat source/sink and velocity slip. Mathematics. 2022 Jan;10(23):4400.10.3390/math10234400Search in Google Scholar
[17] Konwar H, Bendangwapang, Jamir T. Mixed convection MHD boundary layer flow, heat, and mass transfer past an exponential stretching sheet in porous medium with temperature-dependent fluid properties. Numer Heat Transf Part Appl. 2023 Jun;83(12):1346–64.10.1080/10407782.2022.2104581Search in Google Scholar
[18] Naseem A, Ghafoor Kasana A. Numerical assessment of MHD hybrid nanofluid flow over an exponentially stretching surface in the presence of mixed convection and non uniform heat source/sink. Results Eng. 2024 Jun;22:102294.10.1016/j.rineng.2024.102294Search in Google Scholar
[19] Sharma BK, Khanduri U, Mishra NK, Chamkha AJ. Analysis of Arrhenius activation energy on magnetohydrodynamic gyrotactic microorganism flow through porous medium over an inclined stretching sheet with thermophoresis and Brownian motion. Proc Inst Mech Eng Part E J Process Mech Eng. 2023 Oct;237(5):1900–14.10.1177/09544089221128768Search in Google Scholar
[20] Mehta R, Kataria HR. Brownian motion and thermophoresis effects on MHD flow of viscoelastic fluid over stretching/shrinking sheet in the presence of thermal radiation and chemical reaction. Heat Transf. 2022;51(1):274–95.10.1002/htj.22307Search in Google Scholar
[21] Hussain Z, Ayaz M, Islam S. Effects of thermophoresis and Brownian motion on radiative MHD hybrid nanofluid flow over a stretching sheet with convective boundary conditions: A homotopic approach. Proc Inst Mech Eng Part N J Nanomater Nanoeng Nanosyst. 2024 Jan;23977914231225019.10.1177/23977914231225019Search in Google Scholar
[22] Gul H, Ayaz M, Islam S, Ullah A, Ismail EAA, Awwad FA. Impact of the Brownian motion and thermophoretic diffusion during the radiative MHD hybrid nanofluid flow past a stretching sheet. Proc Inst Mech Eng Part E J Process Mech Eng. 2024 Aug;09544089241272751.10.1177/09544089241272751Search in Google Scholar
[23] Sudarmozhi K, Iranian D, Alessa N. Investigation of melting heat effect on fluid flow with brownian motion/thermophoresis effects in the occurrence of energy on a stretching sheet. Alex Eng J. 2024 May;94:366–76.10.1016/j.aej.2024.03.065Search in Google Scholar
[24] Duguma KA, Makinde OD, Enyadene LG. Stability analysis of dual solutions of convective flow of casson nanofluid past a shrinking/stretching slippery sheet with thermophoresis and brownian motion in porous media. J Math. 2023;2023(1):5954860.10.1155/2023/5954860Search in Google Scholar
[25] Chinyoka T, Makinde OD. Analysis of nonlinear dispersion of a pollutant ejected by an external source into a channel flow. Math Probl Eng. 2010;2010(1):827363.10.1155/2010/827363Search in Google Scholar
[26] Li S, Saadeh R, Madhukesh JK, Khan U, Ramesh GK, Zaib A, et al. Aspects of an induced magnetic field utilization for heat and mass transfer ferromagnetic hybrid nanofluid flow driven by pollutant concentration. Case Stud Therm Eng. 2024 Jan;53:103892.10.1016/j.csite.2023.103892Search in Google Scholar
[27] Yaseen M, Rawat SK, Khan U, Sarris IE, Khan H, Negi AS, et al. Computational analysis of heat and mass transfer flow of wall jet hybrid nanofluid with irregular heat source/sink effects and waste discharge concentration. J Magn Magn Mater. 2023 Dec;588:171434.10.1016/j.jmmm.2023.171434Search in Google Scholar
[28] Vinutha K, Sunitha M, Madhukesh JK, Khan U, Zaib A, Sherif ESM, et al. Computational examination of heat and mass transfer induced by ternary nanofluid flow across convergent/divergent channels with pollutant concentration. Water. 2023 Jan;15(16):2955.10.3390/w15162955Search in Google Scholar
[29] Ouyang Y, Md Basir MF, Naganthran K, Pop I. Effects of discharge concentration and convective boundary conditions on unsteady hybrid nanofluid flow in a porous medium. Case Stud Therm Eng. 2024 Jun;58:104374.10.1016/j.csite.2024.104374Search in Google Scholar
[30] Xin X, Ganie AH, Alwuthaynani M, Bonyah E, El-Wahed Khalifa HA, Fathima D, et al. Parametric analysis of pollutant discharge concentration in non-Newtonian nanofluid flow across a permeable Riga sheet with thermal radiation. AIP Adv. 2024 Apr;14(4):045018.10.1063/5.0200401Search in Google Scholar
[31] Suleman M, Ramzan M, Zulfiqar M, Bilal M, Shafee A, Chung JD, et al. Entropy analysis of 3D non-newtonian MHD nanofluid flow with nonlinear thermal radiation past over exponential stretched surface. Entropy. 2018 Dec;20(12):930.10.3390/e20120930Search in Google Scholar PubMed PubMed Central
[32] Senapati M, Swain K, Parida SK. Numerical analysis of three-dimensional MHD flow of Casson nanofluid past an exponentially stretching sheet. Karbala Int J Mod Sci. 2020 Mar;6(1):13.10.33640/2405-609X.1462Search in Google Scholar
[33] Mahanta G, Shaw S. 3D Casson fluid flow past a porous linearly stretching sheet with convective boundary condition. Alex Eng J. 2015 Sep;54(3):653–9.10.1016/j.aej.2015.04.014Search in Google Scholar
[34] Arshad M, Hussain A, Hassan A, Haider Q, Ibrahim AH, Alqurashi MS, et al. Thermophoresis and brownian effect for chemically reacting magneto-hydrodynamic nanofluid flow across an exponentially stretching sheet. Energies. 2022 Jan;15(1):143.10.3390/en15010143Search in Google Scholar
[35] Nayak MK, Pandey VS, Tripathi D, Akbar NS, Makinde OD. 3D MHD cross flow over an exponential stretching porous surface. Heat Transf. 2020;49(3):1256–80.10.1002/htj.21661Search in Google Scholar
[36] Sulochana C, Ashwinkumar GP, Sandeep N. Similarity solution of 3D Casson nanofluid flow over a stretching sheet with convective boundary conditions. J Niger Math Soc. 2016 Apr;35(1):128–41.10.1016/j.jnnms.2016.01.001Search in Google Scholar
© 2025 the author(s), published by De Gruyter
This work is licensed under the Creative Commons Attribution 4.0 International License.
Articles in the same Issue
- Research Articles
- Lie symmetry analysis of bio-nano-slip flow in a conical gap between a rotating disk and cone with Stefan blowing
- Mathematical modelling of MHD hybrid nanofluid flow in a convergent and divergent channel under variable thermal conductivity effect
- Advanced ANN computational procedure for thermal transport prediction in polymer-based ternary radiative Carreau nanofluid with extreme shear rates over bullet surface
- Effects of Ca(OH)2 on mechanical damage and energy evolution characteristics of limestone adsorbed with H2S
- Effect of plasticizer content on the rheological behavior of LTCC casting slurry under large amplitude oscillating shear
- Studying the role of fine materials characteristics on the packing density and rheological properties of blended cement pastes
- Deep learning-based image analysis for confirming segregation in fresh self-consolidating concrete
- MHD Casson nanofluid flow over a three-dimensional exponentially stretching surface with waste discharge concentration: A revised Buongiorno’s model
- Rheological behavior of fire-fighting foams during their application – a new experimental set-up and protocol for foam performance qualification
- Viscoelastic characterization of corn starch paste: (II) The first normal stress difference of a cross-linked waxy corn starch paste
- An innovative rheometric tool to study chemorheology
- Effect of polymer modification on bitumen rheology: A comparative study of bitumens obtained from different sources
- Rheological and irreversibility analysis of ternary nanofluid flow over an inclined radiative MHD cylinder with porous media and couple stress
- Rheological analysis of saliva samples in the context of phonation in ectodermal dysplasia
- Analytical study of the hybrid nanofluid for the porosity flowing through an accelerated plate: Laplace transform for the rheological behavior
- Brief Report
- Correlations for friction factor of Carreau fluids in a laminar tube flow
- Special Issue on the Rheological Properties of Low-carbon Cementitious Materials for Conventional and 3D Printing Applications
- Rheological and mechanical properties of self-compacting concrete with recycled coarse aggregate from the demolition of large panel system buildings
- Effect of the combined use of polyacrylamide and accelerators on the static yield stress evolution of cement paste and its mechanisms
- Special Issue on The rheological test, modeling and numerical simulation of rock material - Part II
- Revealing the interfacial dynamics of Escherichia coli growth and biofilm formation with integrated micro- and macro-scale approaches
- Construction of a model for predicting sensory attributes of cosmetic creams using instrumental parameters based on machine learning
- Effect of flaw inclination angle and crack arrest holes on mechanical behavior and failure mechanism of pre-cracked granite under uniaxial compression
- Special Issue on The rheology of emerging plant-based food systems
- Rheological properties of pea protein melts used for producing meat analogues
- Understanding the large deformation response of paste-like 3D food printing inks
- Seeing the unseen: Laser speckles as a tool for coagulation tracking
- Composition, structure, and interfacial rheological properties of walnut glutelin
- Microstructure and rheology of heated foams stabilized by faba bean isolate and their comparison to egg white foams
- Rheological analysis of swelling food soils for optimized cleaning in plant-based food production
- Multiscale monitoring of oleogels during thermal transition
- Influence of pea protein on alginate gelation behaviour: Implications for plant-based inks in 3D printing
- Observations from capillary and closed cavity rheometry on the apparent flow behavior of a soy protein isolate dough used in meat analogues
- Special Issue on Hydromechanical coupling and rheological mechanism of geomaterials
- Rheological behavior of geopolymer dope solution activated by alkaline activator at different temperature
- Special Issue on Rheology of Petroleum, Bitumen, and Building Materials
- Rheological investigation and optimization of crumb rubber-modified bitumen production conditions in the plant and laboratory