Seeing the unseen: Laser speckles as a tool for coagulation tracking
-
Christoph Haessig
 and
Flemming Møller
and
Flemming Møller

Abstract
The ability to measure protein functionality is critical for the development of plant-based products, particularly with respect to gelation behavior, which is vital for food structure and texture. Small amplitude oscillatory shear (SAOS) tests remain the standard for monitoring protein gelation; however, these methods are costly, time-consuming, and require physical contact with the sample. Laser speckle rheology, an optical-based technique, offers a contactless alternative by assessing rheological properties through speckle pattern fluctuations. In this work, we present a simple laser speckle rheology setup, utilizing a diode laser and a digital camera, to monitor rheological changes during the rennet coagulation of milk. We use a viscoelasticity index (VI), derived from a two-dimensional linear correlation, to quantify speckle pattern fluctuations. The laser speckle rheology method is compared with conventional SAOS rheology. Results demonstrate that key characteristics of the coagulation process, including coagulation and gelation times, are temporally aligned between the two methods. Furthermore, the VI allows for the comparison of the complex modulus in samples with similar compositions under consistent acquisition parameters. These findings underscore the potential of laser speckle rheology as a cost-effective, rapid, and contactless approach for capturing protein gelation, providing an alternative to conventional shear rheological methods.
Abbreviations
- CMOS
-
complementary metal-oxide semiconductor
- SAOS
-
small amplitude oscillatory shear
- VI
-
viscoelasticity index
1 Introduction
The concern over a sustainable food supply, driven by the increasing global population, consumers’ flexitarian diet demands, and health and environmental concerns, has led to increased activity in plant protein research [1,2]. Of particular interest is the gelation behavior of plant-based proteins, especially in the context of dairy-free product development, due to the importance of proteins for food structure and texture, and consequently, consumer product acceptance [3,4,5].
Therefore, there is a need to quantify the rheological changes that occur during protein gelation. Typically, small amplitude oscillatory shear (SAOS) rheology is used to fully characterize the rheological changes during gelation [6,7,8]. An optical-based alternative method to shear rheology is the so-called laser speckle rheology [9]. Illuminating an optically rough surface with coherent light, such as a laser, results in light being scattered on and below the surface [10]. The backscattered light undergoes interference, creating a random pattern of bright and dark spots, known as a laser speckle pattern [11,12,13,14]. However, as the scattering structures are not static instead undergo Brownian motion, the laser speckle pattern fluctuates [15]. Since the mobility of the scatterers depends on the mechanical properties of the surrounding matrix, one can extract the rheological behavior from the fluctuations of the laser speckle pattern by performing temporal cross-correlation of the speckle patterns [16]. Consequently, similar to other microrheological techniques, laser speckle rheology probes scatterer mobility – a fundamental difference from rheology. Laser speckle rheology has been applied in various fields, such as medical diagnostics and tissue characterization [17]. Recently, laser speckle techniques have been used to characterize various food products, including dairy, ice cream, and milk [18,19,20]. For instance, Postnov et al. [18] applied a laser speckle rheology method to evaluate the viscosity properties of dairy products.
In contrast to plant-based proteins, dairy proteins and bovine milk, in general, have been extensively studied in the past decades [21,22,23]. Bovine milk is a complex multi-component fluid, mainly consisting of not only water, lipids, carbohydrates, and proteins but also containing trace amounts of minerals, vitamins, hormones, and enzymes [21,22]. The two main protein fractions present in bovine milk are caseins and whey proteins, which constitute around 80 and 20 wt%, respectively [24]. Caseins are a group of random coil proteins with molecular weights of about 107–109 Da, resulting in diameters of 50–500 nm [24]. Naturally, caseins are present in soluble micellar structures. The exterior of the casein micelles is coated with the κ-casein fraction, characterized by its large carbohydrate moiety, which solubilizes the casein micelle [25,26]. Casein precipitation may be induced through acidification to a pH of 4.6 or the addition of enzymes, like chymosin found in rennet [26,27]. Rennet coagulation is typically divided into a primary and secondary phase [26]. The primary phase describes the enzymatic hydrolysis of the κ-casein, resulting in the release of the so-called caseinomacropeptide. This, in turn, reduces the repulsion between the casein micelles, leading to their aggregation and subsequently gelation in the secondary phase [26,28]. The rennet coagulation mechanism is affected by various process parameters, including enzyme type and concentration, temperature, pH, and milk composition [26,28]. Therefore, the rennet coagulation of bovine milk can serve as a well-characterized study system to evaluate the ability of laser speckle rheology to track the rheological changes during protein gelation.
In this study, we apply a simple frame-to-frame two-dimensional correlation analysis of laser speckle images to evaluate the rheological changes during rennet coagulation of milk under various process conditions. The results demonstrate the ability of laser speckle rheology to non-invasively capture the rheological transitions during gelation. This opens up the possibility of tracking rheological changes during the gelation of plant-based protein systems, facilitating functionality research and product development.
2 Materials and methods
2.1 Materials
Skimmed milk powder (low heat treatment), and the commercially available enzymes Marzyme XT 220 PF (440 IMCU/L) and Chymostar (714 IMCU/L) were obtained by IFF internally. Calcium chloride dihydrate (technical grade) was purchased from Sigma-Aldrich (St. Louis, USA). All experiments were performed using deionized water (PURELAB flex 1, ELGA LabWater, High Wycombe, UK).
2.2 Sample preparation
The milk for the coagulation experiments was prepared by mixing milk powder with a 0.009 M calcium chloride solution at a concentration of 60 g/L (referred to as regular protein content) or 120 g/L (referred to as high-protein [HP]content).
The solution was stirred for 30 min, achieving complete dissolution of the milk powder. Subsequently, the milk was rested for at least 30 min at the coagulation test temperature using a heating chamber at 21°C to temper the milk to the test temperature.
The coagulants were diluted prior to inoculating the milk samples. Marzyme and Chymostar were diluted 5-fold and 10-fold, respectively, achieving enzyme concentrations of 40 and 71.4 IMCU/L. The diluted enzyme solutions were used for further experiments within 10 min after preparation.
2.3 Time sweep
The rheological changes upon the rennet coagulation of milk were tracked by time sweeps. The time sweeps were performed with a stress-controlled rheometer (Anton-Paar MCR 302) equipped with a concentric cylinder (27 mm;
Our test methodology proceeded as follows. First, 50 mL of milk, prepared according to Section 2.2, was inoculated at a concentration of 40 or 80 IMCU/L using the diluted coagulants. Second, the sample was transferred to the pre-heated measuring geometry, and the time sweep was started after a resting period of 5 min.
2.4 Laser speckle rheology
The laser speckle rheology optical setup is schematically displayed in Figure 1. Light from a randomly polarized laser diode (650 nm, 5 mW, Global Laser, Abertillery, UK) was polarized and focused onto the sample, which resulted in a laser spot of approximately 1 cm in diameter. The sample had a volume of 15 mL and a corresponding height of approximately 1 cm. The cross-polarized component of the light back-scattered at an angle of approximately 50° was collected by a complementary metal-oxide semiconductor (CMOS) camera (BFS-U3-51S5M-C, FLIR Systems, USA), equipped with a TV lens (25 mm, f1.4, Pentax, Rungis, France). To minimize external light interference, the experimental setup was enclosed using blackout curtains. The speckle frames were acquired at 199 fps, over an ROI of 200 × 200 pixels, for approximately 0.5 s unless specified differently. The camera parameters and image acquisition were controlled through a home-written Python-based code. The sample temperature was controlled through a heating jacket with constant water exchange from an external water bath.
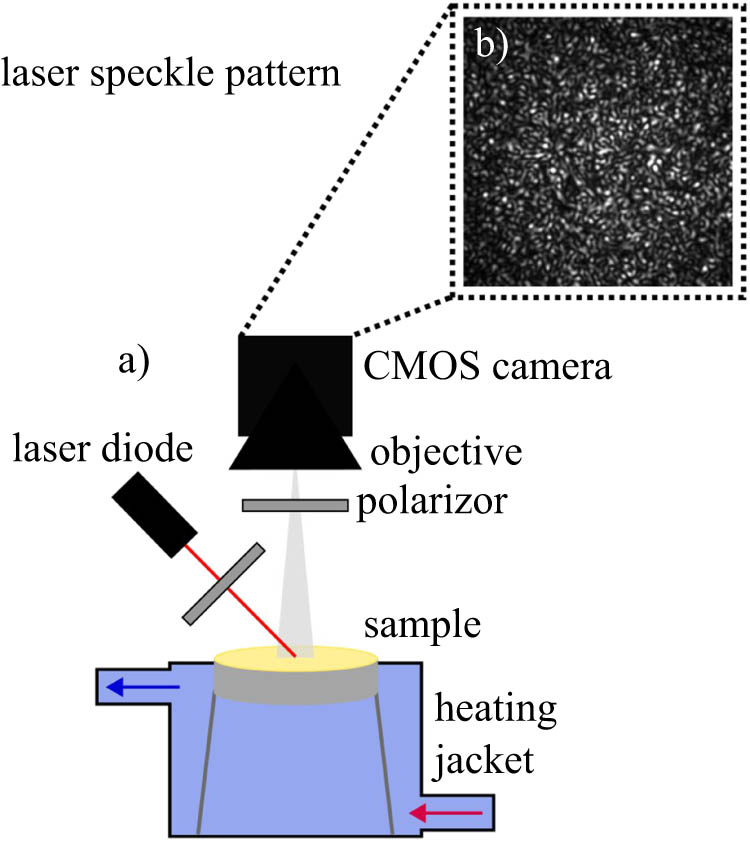
(a) Schematic of the laser speckle rheology setup and (b) laser speckle pattern.
2.5 Data processing
The acquired laser speckle images were analyzed using a custom Python script. First, the temporal evolution of the acquired speckle frames was analyzed by the two-dimensional linear correlation shown in equation (frames correlation),
where
where
To compare laser speckle rheology with SAOS rheology as methods to track the rheological changes during rennet coagulation of milk, we extract characteristic features from the temporal VI and
3 Results and discussion
3.1 Temporal evolution of laser speckle patterns during rennet coagulation
Upon the rennet addition to milk, chymosin starts to cleave the stabilizing κ-casein located on the outside of the casein micelles. The cleavage of the κ-casein leads to the destabilization of the casein micelles. This, in turn, results in the aggregation of the destabilized casein micelles and, eventually, in the formation of a percolating casein gel network [26,28]. The rheology of the milk systems changes drastically as a consequence of this coagulation process, from being a low-viscosity liquid to a firm viscoelastic gel [26,28,29]. As the scatterers’, i.e., casein micelles, mobility is reduced by the formation of aggregates and the subsequently formed space-spanning gel network, we hypothesize that the laser speckle pattern fluctuation slows down simultaneously (refer supplementary video). The frames correlation coefficient as a function of the delay time

Frames correlation coefficient
With increasing time after the coagulant addition, the frames correlation coefficient decays slower, as shown in Figure 2. Within the first 12 min, decorrelation of the laser speckle pattern occurs within a single
To quantify the linear correlation of the speckle patterns during the coagulation process, thereby providing insights into the simultaneous rheological transitions, we use the VI. SAOS was chosen as the comparison method to laser speckle rheology, as it is the industry standard for detailed rheological characterization and directly probes the mechanical changes during rennet coagulation [32,33]. Therefore, comparing shear and laser speckle rheology data enables the interpretation of laser speckle rheology measurements. However, it is important to note that the laser speckle approach probes scatterer mobility and thus, only indirectly reflects the rheological properties of the surrounding matrix, whereas SAOS directly probes the bulk rheological behavior. Consequently, the two methods do not probe the system at the same length or time scales. As such, comparisons and interpretations of the two methods must be carried out with caution. The temporal evolution of the VI, as well as the storage modulus

Storage modulus
In SAOS, an oscillatory shear stress or strain is applied, and the resulting response from the developing gel is measured [26]. The applied shear strain must remain within the LVR during the entire gel development, ensuring a linear proportionality between stress and strain. Yet, initially, the curd is very weak, and consequently, strongly limiting the LVR. Regardless, we argue that the gel strength develops sufficiently fast, thereby ensuring the linear viscoelasticity. To ensure that the time sweeps were performed within the LVR, an amplitude sweep was conducted and is shown in Figure S2 of the supplementary information.
Within the first 13 min, both
where

(a) VI, (b) complex modulus G*, and (c) loss factor δ as a function of time after rennet addition t during the rennet coagulation of regular and HP milk by either Marzyme or Chymostar at various concentrations at 21°C.
The initial VI regime around 0 is temporally well aligned with the liquid-like behavior dominated plateau observed for the shear moduli. The dominant liquid-like behavior indicates that the system remains within that time frame in the primary enzymatic phase. The absence of structures resisting the casein micelle mobility within the primary enzymatic phase explains the nearly instant decorrelation of the frame’s correlation coefficient, responsible for the VI value of 0. The onset of the observed increase in both the moduli and VI at 13 min, commonly referred to as the coagulation point [26], indicates the formation of structures restricting the scatterer mobility, which is simultaneously linked to an increasing resistance to deformation. Thus, this transition implies the onset of the secondary enzymatic phase. Over time, the casein aggregates grow further and eventually form a coherent space-spanning gel. The cross-over point was reached after 15.5 min, indicating the transition from liquid-like to gel-like behavior, as expected, resulting from the gel formation. Interestingly, the maximum VI growth rate occurred simultaneously at 15.5 min. The increasing shear moduli and VI after 15.5 min, known as curd firming, are caused by an increasing number of casein micelles incorporated into the particle gel network [26,28,29]. We propose that the incorporation of casein micelles, and also larger casein aggregates, reduces the number of freely moving casein micelles in solution. Concurrently, the resulting network further hinders the movement of free micelles. Consequently, the number of scatterers that moved between two frames, thereby changing the speckle pattern, characterized by the frames correlation coefficient [18], is expected to decrease. Thus, the frames correlation coefficient and consequently VI increase due to the curd firming.
Yet, we must note that the curd firming dynamics captured by the shear moduli and VI differed fundamentally. While the moduli increase visibly linearly (note that Figure 3 is plotted on a semilog scale), the slope of the VI seems to decrease with increasing coagulation duration, characteristic of a sigmoidal curve. Generally, one expects that the shear moduli reach a plateau at long times, i.e., a sigmoidal curve, as all casein micelles are incorporated into the gel network [26]. Hence, the SAOS coagulation curve indicates that this last coagulation stage was not reached within the observation window of 40 min. Despite the apparent different curd firming dynamics, both the laser speckle rheology and SAOS are temporally well-aligned in terms of the coagulation point and cross-over.
3.2 Tracking under various coagulation conditions
The generic behavior of both the shear moduli and the VI, and their connection, in response to the rennet coagulation of milk was discussed in Section 3.1. We further proceed by comparing the response of the two methods to the rennet coagulation of milk under various industry-relevant coagulation conditions. The VI, complex modulus

Characteristic features, extracted from the VI and moduli as a function of time after rennet addition during the rennet coagulation of regular and HP milk by either Marzyme or Chymostar at various concentrations at 21°C, as a function of the enzyme concentration. Filled and open markers represent measures extracted from the laser speckle rheology and shear rheometry, respectively. (a) Coagulation times
The experimental results indicate an inverse relation between coagulation time and enzyme concentration, as shown in Figure 5a. The coagulation time of the Marzyme-containing samples decreased from approximately 31 to 18 min and 5 min for enzyme concentrations of 20, 40, and 80 IMCU/L, respectively. A similar trend was found for the Chymostar-containing samples, where the coagulation time decreased from around 15–8 min for enzyme concentrations of 40 and 80 IMCU/L, respectively. Principally, milk coagulation initiates when a sufficiently high degree of
Similar to the coagulation point, the time of the
Further, the gel network development, captured by both methods, was compared by extracting the characteristic curd firming rates, which are shown in Figure 5c. As outlined in Section 2.5, the maximum VI slope and the slope of the linear
A substantial difference in the apparent coagulation dynamics captured by laser speckle rheology and SAOS is the behavior at the advanced coagulation stage, i.e., as
3.3 Influence of lag time
τ
The lag time

(a) VI for lag times 5 ms ≤ τ ≤ 2,500 ms as a function of time after rennet addition, and (b) normalized
The impact of the lag time
Coagulation time t (c, VI), maximum VI slope (dVI/dt)(max), time t (2nd plt.), and VI value VI(2nd plt.) of the apparent VI plateau at long times determined for the rennet coagulation of milk by 40 IMCU/L Marzyme at 21°C at various τ
|
|
|
|
|
|
|---|---|---|---|---|
| (ms) | (min) | (min−1) | (min) | (–) |
| 5 | 13.3 ± 1.2 | 0.11 ± 0.01 | 34.8 ± 2.6 | 0.73 ± 0.01 |
| 10 | 15.0 ± 0.8 | 0.12 ± 0.03 | 33.3 ± 2.1 | 0.69 ± 0.02 |
| 25 | 16.3 ± 0.9 | 0.11 ± 0.02 | 36.3 ± 2.4 | 0.65 ± 0.01 |
| 50 | 16.3 ± 0.9 | 0.12 ± 0.03 | 36.0 ± 2.2 | 0.58 ± 0.04 |
| 500 | 17.0 ± 0.0 | 0.10 ± 0.01 | 36.0 ± 1.4 | 0.58 ± 0.02 |
| 2,500 | 17.7 ± 1.2 | 0.10 ± 0.01 | 37.7 ± 0.5 | 0.50 ± 0.03 |
Moreover, the onset of the late VI plateau seems to be delayed, while its value decreases, with increasing
To compare the underlying coagulation dynamics suggested by the VI coagulation curves at various
3.4 Scaling analysis
In Sections 3.1–3.3, we compared the coagulation curves captured by SAOS and laser speckle rheology, and discussed the influence of coagulation conditions on these features. Despite the temporal alignment of key features, such as the coagulation point, and the ability of both methods to capture the effects of various coagulation conditions, we noted that the apparent gel firming dynamics differed between the two techniques. The

Complex modulus
Interestingly, when plotting
4 Conclusion
In this work, we utilized a simple, cost-effective, and contactless laser speckle rheology setup to monitor the rheological transition upon protein coagulation. Speckle patterns were generated by irradiating milk samples containing 20–80 IMCU/L commercial rennet, which were acquired using a CMOS camera. The speckle patterns were analyzed using a frame-to-frame two-dimensional linear correlation, and particle mobility was extracted using the VI. We compared the ability of the laser speckle rheology setup to monitor the protein coagulation process with the standard SAOS rheology. We demonstrated the capability of laser speckle rheology to monitor rheological transitions during rennet coagulation of milk under various coagulation conditions. Specifically, critical points in the coagulation process, such as the coagulation and gelation points, were temporally well-aligned between laser speckle rheology and SAOS. Notably, the initial increase in resistance to deformation due to aggregate formation was captured with high sensitivity. However, we report an apparent difference in gel firming dynamics between the two methods, which we propose may be due to the VI being linked to the scatterer mobility rather than the gel firmness itself. The effect of coagulation conditions, such as enzyme type, concentration, and protein content, on the coagulation dynamics was captured well by laser speckle rheology. Further, we emphasize the importance of the lag time
Acknowledgments
Christoph Haessig acknowledges support from the Erasmus + program of the European Union. We thank Birgitte Vesterlund Pedersen and Michel Hardenberg for their help and suggestions.
-
Funding information: This research was supported by International N&H Denmark ApS (an IFF subsidiary).
-
Author contributions: C.H. (corresponding author) – conceptualization, data curation, formal analysis, investigation, methodology, software, visualization, and writing – original draft; F.M. – conceptualization, funding acquisition, methodology, project administration, resources, supervision, and writing – review and editing.
-
Conflict of interest: Flemming Møller is employed at International N&H Denmark ApS (an IFF subsidiary), but no conflicts of interest arise from this publication. The remaining authors do not have any conflicts of interest to declare.
-
Data availability statement: The datasets generated during and/or analyzed during the current study are available from the corresponding author on reasonable request.
References
[1] McClements DJ, Grossmann L. Next-generation plant-based foods. Cham: Springer International Publishing; 2022.10.1007/978-3-030-96764-2Search in Google Scholar
[2] Abe-Inge V, Aidoo R, de la Fuente MM, Kwofie EM. Plant-based dietary shift: Current trends, barriers, and carriers. Trends Food Sci Technol. 2023;143:104292.10.1016/j.tifs.2023.104292Search in Google Scholar
[3] Hettiarachchy N, Kannan A, Schäfer C, Wagner G. Gelling of plant based proteins. Product design and engineering: Formulation of gels and pastes. Weinheim: Wiley-VCH; 2013. p. 221–45.10.1002/9783527654741.ch8Search in Google Scholar
[4] Nieto TVN, Wang Y, Ozimek L, Chen L. Improved thermal gelation of oat protein with the formation of controlled phase-separated networks using dextrin and carrageenan polysaccharides. Food Res Int. 2016;82:95–103.10.1016/j.foodres.2016.01.027Search in Google Scholar
[5] Brückner-Gühmann M, Banovic M, Drusch S. Towards an increased plant protein intake: Rheological properties, sensory perception and consumer acceptability of lactic acid fermented, oat-based gels. Food Hydrocoll. 2019;96:201–8.10.1016/j.foodhyd.2019.05.016Search in Google Scholar
[6] Tunick MH. Small-strain dynamic rheology of food protein networks. J Agric Food Chem. 2011;59:1481–6.10.1021/jf1016237Search in Google Scholar PubMed
[7] Tieu S, Harte F. Effect of mild thermal and pH changes on the sol-gel transition in skim milk. J Dairy Sci. 2022;105:7926–39.10.3168/jds.2021-21299Search in Google Scholar PubMed
[8] Cordobés F, Partal P, Guerrero A. Rheology and microstructure of heat-induced egg yolk gels. Rheol Acta. 2004;43:184–95.10.1007/s00397-003-0338-3Search in Google Scholar
[9] Nader CA, Pellen F, Roquefort P, Aubry T, Le Jeune B, Le Brun G, et al. Evaluation of low viscosity variations in fluids using temporal and spatial analysis of the speckle pattern. Opt Lett. 2016;41:2521–4.10.1364/OL.41.002521Search in Google Scholar PubMed
[10] Yokoi N, Shimatani Y, Kyoso M, Funamizu H, Aizu Y. Imaging of blood flow and blood concentration change in a frame rate using laser speckle: Methods for image analysis. Opt Laser Technol. 2014;64:352–62.10.1016/j.optlastec.2014.06.007Search in Google Scholar
[11] Dainty JC. Laser speckle and related phenomena. Vol. 9. Berlin, Heidelberg: Springer Science & Business Media; 2013.Search in Google Scholar
[12] Goodman JW. Speckle phenomena in optics: Theory and applications. Englewood (CO): Roberts and Company Publishers; 2007.Search in Google Scholar
[13] Bouyer P. Quantum gases and optical speckle: A new tool to simulate disordered quantum systems. Rep Prog Phys. 2010;73:062401.10.1088/0034-4885/73/6/062401Search in Google Scholar
[14] Rivera FP, Braga Jr RA. Illumination dependency in dynamic laser speckle analysis. Opt Laser Technol. 2020;128:106221.10.1016/j.optlastec.2020.106221Search in Google Scholar
[15] Rabal H, Braga R. Dynamic speckle, origin and features. Dynamic laser speckle and applications. Boca Raton: CRC Press; 2008.10.1201/9781420060164Search in Google Scholar
[16] Weitz DA, Pine DJ. Diffusing-wave spectroscopy. Dynamic light scattering. Oxford: Oxford University Press; 1993. p. 652–720.10.1093/oso/9780198539421.003.0016Search in Google Scholar
[17] Hajjarian Z, Nadkarni SK. Measurement of bulk mechanical properties of tissue using laser speckle rheology. 2011 Annual International Conference of the IEEE Engineering in Medicine and Biology Society. IEEE; 2011. p. 5746–8.10.1109/IEMBS.2011.6091422Search in Google Scholar PubMed PubMed Central
[18] Postnov DD, Moller F, Sosnovtseva O. Dairy products viscosity estimated by laser speckle correlation. PLoS One. 2018;13:e0203141.10.1371/journal.pone.0203141Search in Google Scholar PubMed PubMed Central
[19] da Silva Jr E, Da Silva ER, Muramatsu M, da Silva Lannes SC. Transient process in ice creams evaluated by laser speckles. Food Res Int. 2010;43:1470–5.10.1016/j.foodres.2010.04.017Search in Google Scholar
[20] Bello V, Fiocchi M, Bassi I, Figus E, Merlo S. Speckle pattern imaging for recognition of milk dilutions. 2024 IEEE International Instrumentation and Measurement Technology Conference (I2MTC). IEEE; 2024. p. 1–5.10.1109/I2MTC60896.2024.10560601Search in Google Scholar
[21] O’Mahony J, Fox P. Milk: An overview. Milk proteins. London: Academic Press; 2014. p. 19–73.10.1016/B978-0-12-405171-3.00002-7Search in Google Scholar
[22] Haug A, Høstmark AT, Harstad OM. Bovine milk in human nutrition–a review. Lipids Health Dis. 2007;6:1–16.10.1186/1476-511X-6-25Search in Google Scholar PubMed PubMed Central
[23] Fox PF. Milk: An overview. Milk proteins. London: Academic Press; 2008. p. 1–54.10.1016/B978-0-12-374039-7.00001-5Search in Google Scholar
[24] Fox P, Brodkorb A. The casein micelle: Historical aspects, current concepts and significance. Int Dairy J. 2008;18:677–84.10.1016/j.idairyj.2008.03.002Search in Google Scholar
[25] Walstra P. On the stability of casein micelles. J Dairy Sci. 1990;73:1965–79.10.3168/jds.S0022-0302(90)78875-3Search in Google Scholar
[26] Horne DS, Lucey JA. Rennet-induced coagulation of milk. Cheese. London: Academic Press; 2017. p. 115–43.10.1016/B978-0-12-417012-4.00005-3Search in Google Scholar
[27] Lucey JA. Formation, structural properties, and rheology of acid-coagulated milk gels. Cheese. London: Academic Press; 2017. p. 179–97.10.1016/B978-0-12-417012-4.00007-7Search in Google Scholar
[28] Britten M, Giroux HJ. Rennet coagulation of heated milk: A review. Int Dairy J. 2022;124:105179.10.1016/j.idairyj.2021.105179Search in Google Scholar
[29] Karlsson AO, Ipsen R, Ardö Y. Rheological properties and microstructure during rennet induced coagulation of UF concentrated skim milk. Int Dairy J. 2007;17:674–82. 10.1016/j.idairyj.2006.08.002.Search in Google Scholar
[30] Hajjarian Z, Nadkarni SK. Evaluation and correction for optical scattering variations in laser speckle rheology of biological fluids. PLoS One. 2013;8:e65014. 10.1371/journal.pone.0065014.Search in Google Scholar PubMed PubMed Central
[31] Tripathi MM, Hajjarian Z, Van Cott EM, Nadkarni SK. Assessing blood coagulation status with laser speckle rheology. Biomed Opt Express. 2014;5:817–31.10.1364/BOE.5.000817Search in Google Scholar PubMed PubMed Central
[32] O’callaghan DJ, O’Donnell CP, Payne F. Review of systems for monitoring curd setting during cheesemaking. Int J Dairy Technol. 2002;55:65–74.10.1046/j.1471-0307.2002.00043.xSearch in Google Scholar
[33] Lucey J. Formation and physical properties of milk protein gels. J Dairy Sci. 2002;85:281–94.10.3168/jds.S0022-0302(02)74078-2Search in Google Scholar
[34] Ross-Murphy SB. Rheological characterisation of gels 1. J Texture Stud. 1995;26:391–400.10.1111/j.1745-4603.1995.tb00979.xSearch in Google Scholar
[35] Blair GS, Burnett J. 716. Physical changes in milk caused by the action of rennet: I. Description of apparatus for measuring rigidity moduli and internal viscosities, tests of reliability and some observations on syneresis. J Dairy Res. 1958;25:297–303.10.1017/S0022029900009286Search in Google Scholar
[36] McSweeney P. Conversion of milk to curd. In: McSweeney PLH, editor. Cheese problem solved. Boca Raton, FL: CRC Press LLC; 2007. p. 50–71.10.1533/9781845693534.50Search in Google Scholar
[37] Mistry VV, Maubois J-L. Application of membrane separation technology to cheese production. Cheese. London: Academic Press; 2017. p. 677–97.10.1016/B978-0-12-417012-4.00027-2Search in Google Scholar
[38] Hajjarian Z, Nadkarni SK. Tutorial on laser speckle rheology: technology, applications, and opportunities. J Biomed Opt. 2020;25:1. 10.1117/1.jbo.25.5.050801.Search in Google Scholar PubMed PubMed Central
[39] Brunel L, Brun A, Snabre P, Cipelletti L. Adaptive speckle imaging interferometry: A new technique for the analysis of micro-structure dynamics, drying processes and coating formation. Opt Express. 2007;15:15250–9.10.1364/OE.15.015250Search in Google Scholar PubMed
© 2025 the author(s), published by De Gruyter
This work is licensed under the Creative Commons Attribution 4.0 International License.
Articles in the same Issue
- Research Articles
- Lie symmetry analysis of bio-nano-slip flow in a conical gap between a rotating disk and cone with Stefan blowing
- Mathematical modelling of MHD hybrid nanofluid flow in a convergent and divergent channel under variable thermal conductivity effect
- Advanced ANN computational procedure for thermal transport prediction in polymer-based ternary radiative Carreau nanofluid with extreme shear rates over bullet surface
- Effects of Ca(OH)2 on mechanical damage and energy evolution characteristics of limestone adsorbed with H2S
- Effect of plasticizer content on the rheological behavior of LTCC casting slurry under large amplitude oscillating shear
- Studying the role of fine materials characteristics on the packing density and rheological properties of blended cement pastes
- Deep learning-based image analysis for confirming segregation in fresh self-consolidating concrete
- MHD Casson nanofluid flow over a three-dimensional exponentially stretching surface with waste discharge concentration: A revised Buongiorno’s model
- Rheological behavior of fire-fighting foams during their application – a new experimental set-up and protocol for foam performance qualification
- Viscoelastic characterization of corn starch paste: (II) The first normal stress difference of a cross-linked waxy corn starch paste
- An innovative rheometric tool to study chemorheology
- Effect of polymer modification on bitumen rheology: A comparative study of bitumens obtained from different sources
- Rheological and irreversibility analysis of ternary nanofluid flow over an inclined radiative MHD cylinder with porous media and couple stress
- Rheological analysis of saliva samples in the context of phonation in ectodermal dysplasia
- Analytical study of the hybrid nanofluid for the porosity flowing through an accelerated plate: Laplace transform for the rheological behavior
- Brief Report
- Correlations for friction factor of Carreau fluids in a laminar tube flow
- Special Issue on the Rheological Properties of Low-carbon Cementitious Materials for Conventional and 3D Printing Applications
- Rheological and mechanical properties of self-compacting concrete with recycled coarse aggregate from the demolition of large panel system buildings
- Effect of the combined use of polyacrylamide and accelerators on the static yield stress evolution of cement paste and its mechanisms
- Special Issue on The rheological test, modeling and numerical simulation of rock material - Part II
- Revealing the interfacial dynamics of Escherichia coli growth and biofilm formation with integrated micro- and macro-scale approaches
- Construction of a model for predicting sensory attributes of cosmetic creams using instrumental parameters based on machine learning
- Effect of flaw inclination angle and crack arrest holes on mechanical behavior and failure mechanism of pre-cracked granite under uniaxial compression
- Special Issue on The rheology of emerging plant-based food systems
- Rheological properties of pea protein melts used for producing meat analogues
- Understanding the large deformation response of paste-like 3D food printing inks
- Seeing the unseen: Laser speckles as a tool for coagulation tracking
- Composition, structure, and interfacial rheological properties of walnut glutelin
- Microstructure and rheology of heated foams stabilized by faba bean isolate and their comparison to egg white foams
- Rheological analysis of swelling food soils for optimized cleaning in plant-based food production
- Multiscale monitoring of oleogels during thermal transition
- Influence of pea protein on alginate gelation behaviour: Implications for plant-based inks in 3D printing
- Observations from capillary and closed cavity rheometry on the apparent flow behavior of a soy protein isolate dough used in meat analogues
- Special Issue on Hydromechanical coupling and rheological mechanism of geomaterials
- Rheological behavior of geopolymer dope solution activated by alkaline activator at different temperature
- Special Issue on Rheology of Petroleum, Bitumen, and Building Materials
- Rheological investigation and optimization of crumb rubber-modified bitumen production conditions in the plant and laboratory