An innovative rheometric tool to study chemorheology
-
Annarita Altobelli
 and
Nino Grizzuti
and
Nino Grizzuti

Abstract
This study presents an innovative 3D-printed rheometric tool designed for the in situ analysis of phase transitions, providing a solution to the limitations of conventional rheometric methods. Standard techniques often face challenges in accurately capturing rapid gelation kinetics due to insufficient mixing capabilities and test preparation times. The new tool, adaptable to all conventional rheometers equipped with a disposable shuffle, incorporates a custom spiral channel geometry that allows immediate and efficient merging of two-component systems directly within the measurement system. The natural roughness of the 3D printed surface and the possibility of tuning plate and channel sizes make the tool even more promising. The instrument has been validated on three different systems: polyvinyl alcohol with borax, which undergoes rapid chemical gelation; sodium alginate with calcium chloride, which is characterized by rapid chemical gelation induced by ions; and Pluronic F68 solutions, which exhibit a concentration-dependent phase transition, from a crystal phase to a solution of randomly distributed spherical micelles. The 3D printed tool optimizes the study of chemorheological measurements in situ, capturing the evolution of viscoelastic properties in real time for the three cases.
1 Introduction
In situ rheometry has become an important tool for characterizing the rheological properties of various materials, especially when fast time-dependent phenomena, such as phase transitions, are involved. This technique allows for real-time monitoring of the viscoelastic properties of the evolving sample, thus providing insight into its microstructure and morphology dynamics [1]. Knowing how such properties vary with temperature and/or concentration can provide information about the stability, reactivity, and in situ microstructure of the material [2]. In addition, monitoring the real-time rheology of complex fluids allows for experimental adjustments, from the laboratory to the industrial scale, to rapidly changing systems in terms of formulation, temperature, and applied mechanical forces.
Phase transitions are widely studied phenomena for several categories of products, particularly thermoreversible gels [3–8] or chemical gels that photopolymerize using radiations, such as ultraviolet light [1,9–11]. Phase transitions are fundamental to rheology because they significantly affect the flow characteristics of these materials [12]. Understanding the impact of phase transitions on rheology is critical for designing and optimizing the properties of various materials in diverse fields, from biological systems to composites and granular suspensions [12–15].
One important factor in sol–gel transition is the characteristic time τ, of the transient gelation and the kinetics connected to the gel formation. τ can be extremely short, as in the case of some of the systems studied in the present work, namely, aqueous solutions of polyvinyl alcohol (PVA) upon the addition of sodium tetraborate (borax) [16–21] or aqueous solutions of sodium alginate in contact with the solution of calcium chloride (CaCl2) [22–24].
Monitoring phase transitions can be even more complicated for materials where the transition occurs in the presence of a chemical modifier (such as a crosslinking agent) or because of changes in some physicochemical parameter, such as pH [25,26]. For these materials, the kinetics are often characterized by a two-step dynamic, with a fast phase transition in the early stages followed by a slower evolution.
During the last decades, real-time rheology has been developed by using rotational rheometers equipped with standard tools. Among these, one of the most widely used tools is the Couette geometry, which has always been used to make measurements that can monitor the reaction kinetics of different materials [27–31]. It consists of two concentric cylinders: one of them is fixed, and the other rotates. This geometry has been used to monitor in situ phase transitions due to its ability to induce controlled shear conditions that enable the observation of structural changes in materials under varying temperatures and shear rates.
In many in situ gelling studies, the sample is placed in dialysis tubes and immersed in a solution of crosslinker for various periods of time before being removed and cut to size for rheological testing [32–35]. Other methodologies consist of pouring the gelled polymer into tissue culture plates containing a crosslinker-soaked filter paper. The sample is then incubated for the required gelation time and subsequently loaded onto a rheometer for measurements [36–38]. None of the above methods, however, offers an adequate experimental description of the gelation kinetics.
In the last decade, more specialized rheological methods have been proposed involving the modification of a commercial rheometer. One experimental set-up [39,40] used a rotational rheometer with a modified bottom plate and a Petri dish containing a series of filter paper, a semi-permeable membrane, and the sample. The filter paper was soaked with the crosslinker, and the semipermeable membrane allowed the diffusion of the crosslinker to the sample to be gelled.
More recently, Besiri et al. [41] proposed a new system to monitor the in situ gelation of alginate with CaCl2. They designed and built a homemade lower plate to inject CaCl2 instantaneously into the alginate solution [22,24,41,42]. Palma et al. [43] made rheological measurements using a rheometer equipped with a crosshatched geometry to improve the radial diffusion of the calcium chloride in the alginate solution (already kept within the plates). Their results are very similar to the one reported by Besiri et al., although in both cases, the focus was on the diffusion time of calcium chloride, assuming sample homogenization. Indeed, the diffusion of calcium chloride occurs in parallel with the gelation process (i.e. calcium chloride diffuses and reacts with alginate, probably on the same time scale), and the homogenization of the system is, frequently, an uncontrolled issue.
In general, to date, in the literature, attempts to measure a rapidly changing rheology are few and still not optimized. In this work, we propose an innovative rheological tool designed, engineered, and 3D printed in-house for the in situ measurements of the kinetics of fast phase transitions. We demonstrated the efficiency of the new set-up by using it to monitor the kinetics of three different gelling systems, namely, PVA–borax solutions, alginate solutions gelling under the action of calcium ions, and Pluronic F68 aqueous solutions, undergoing concentration-driven phase transitions.
2 Materials and methods
2.1 Materials
PVA (CTS Conservation, 87.7% hydrolysis, M w = 6.7 × 10⁴ g/mol), sodium tetraborate (borax) (CTS Conservation, M w = 381.37 g/mol), sodium alginate (Sigma Aldrich, M w = 8.4 × 10⁴ g/mol), calcium chloride (Sigma Aldrich, M w = 110.98 g/mol), Pluronic F68 (Sigma Aldrich, M w = 8,350 g/mol), bi-distilled water (Sigma Aldrich), and calibration fluid (Cannon, Instrument Company, viscosity 96 mPa s at 25°C) were used.
2.2 Sample preparation
2.2.1 PVA/borax
The PVA solution was prepared by dissolving 8% wt PVA in bi-distilled water at 80°C by magnetic stirring at 200 rpm for 8 h. The solution was then stored for 2 days at room temperature before use. A 4% wt solution of borax was made by dissolving the salt in bi-distilled water at room temperature by magnetic stirring at 100 rpm for 2 h until full dissolution. The PVA solution was used in combination with the borax solution in a 4:1 proportion for the gelation in situ experiment.
2.2.2 Alginate/CaCl2
Sodium alginate was dissolved in water at a concentration of 2% wt at room temperature and magnetic stirring for 24 h at 200 rpm. In the same way, a 75 mM solution of calcium chloride was prepared. The alginate solution was mixed with the CaCl2 solution in a 5:1 proportion for the gelation in situ experiment, following Besiri et al. [41].
2.2.3 Pluronic F68
The Pluronic F68 solution (45% wt) was prepared by dispersing the polymer in cold water at 5°C. The solution was stored at 5°C for 5 days and periodically subjected to magnetic stirring at 300 rpm to allow for complete dissolution. The Pluronic F68 solution was mixed with bi-distilled water in a 1:1 proportion for the gelation in situ experiment.
For the PVA–borax and alginate–CaCl2 systems, a somewhat rapid increase in moduli is expected due to the formation of chemical networks [16], while for the third system, the reverse trend, that is, a lowering of moduli is expected for the change occurring in phase transition [44–46].
2.3 Custom-made 3D-printed plate
To perform in situ rheological measurements and to obtain information on the early stages of phase transition, a 3D-printed plate was created. The CAD of the plate was developed using the open-source software Fusion 360 (Figure 1). The goal was to monitor the kinetics of phase transitions for these two-component systems where two different solutions react when in contact from the earliest instants.
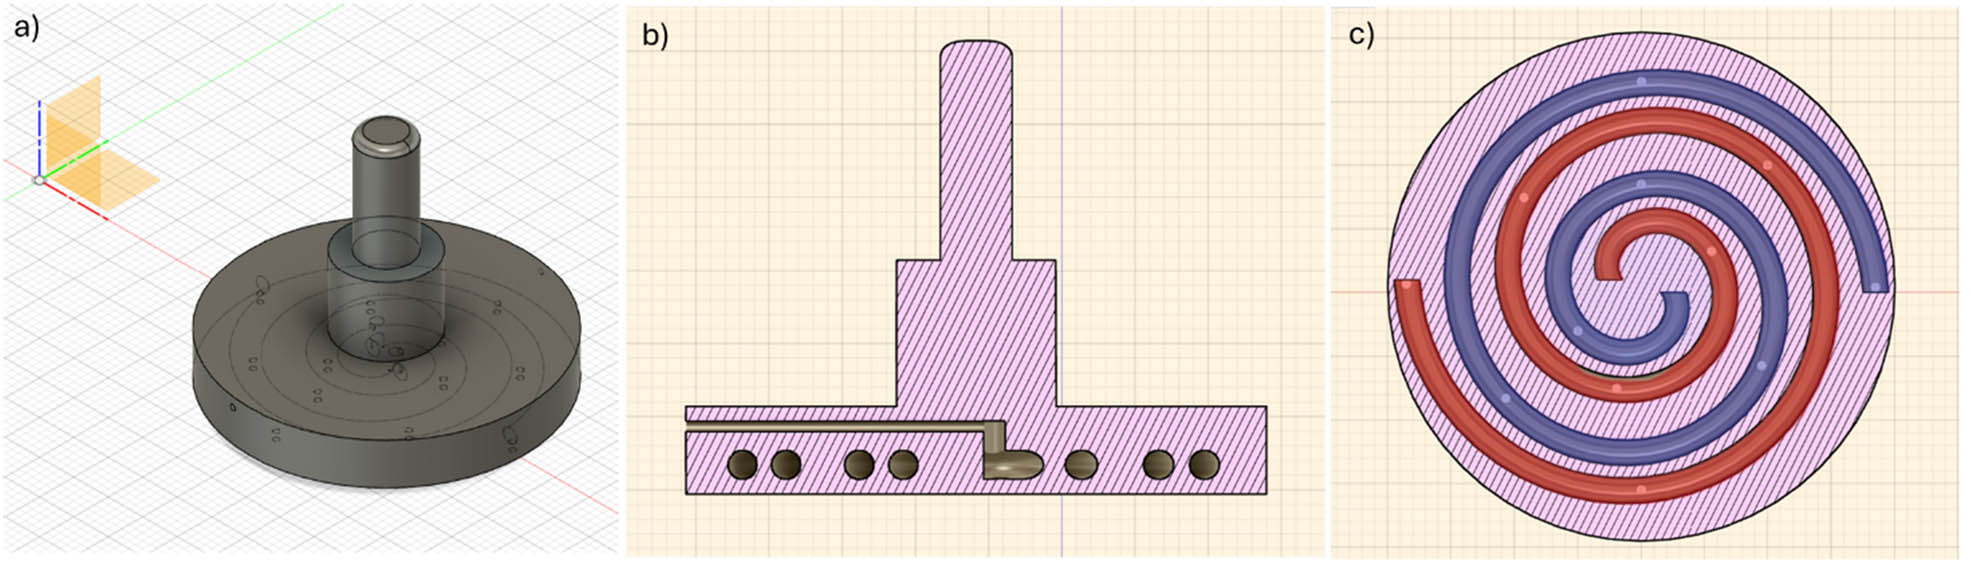
CAD design of the parallel plate, adaptable to the Anton Paar rheometer via the disposable attachment. The drawing shows (a) the whole plate set-up with the trajectories of the double internal spirals; (b) the middle transversal section of the plate showing the syringe input hole and the spirals channels; and (c) different spirals, coloured in red and blue with white dots representing the positions of the exit holes.
The plate is characterized by a diameter of 40 mm and a thickness of 6 mm and hosts two small holes on the rim, with a diameter of 0.5 mm, which are used to independently feed two different solutions. These are brought in contact at the exit holes on the plate surface as the test starts, upon injection into the channels (diameter 1 mm – Figure 1b) using syringes. The needles of the syringes (2 cm in length) are allocated in a straight channel, as shown in Figure 1b), which reaches the plate centre, where the separate spirals receive the two solutions. Along each of the two spiral-like channels, there are six equally spaced exit holes (diameter 0.5 mm – as shown in Figure 1c). The holes of the six couples are adjacent to each other so as to guarantee the best local mixing conditions. The spiral shape, in turn, aims at guaranteeing the most homogeneous mixing conditions around the plate surface. It must be stressed that mixing of the fluids occurs only outside the spiral channels once the rheology test is started. Capillary effects can be considered negligible due to the high pressure imposed by the user through the syringes.
Following CAD optimization, the next step involved 3D printing of the tool. The printing was done with a Raise 3D E2 printer (Raise 3D Technologies, Inc., Irvine, CA) using polylactic acid (PLA). Figure 2 shows microscopic images of the 3D printed tool, obtained with Axioskop 2 plus Zeiss, equipped with a digital camera (Optika C-P12). The images, analysed with the ImageJ software, show PLA printed on a single surface (in a and b) and the roughness of the printed layer, measured to be roughly 150 μm (in c).

Microscope pictures of the PLA printed layer, captured at (a) 3× magnification, (b) 10× magnification, and (c) 3× magnification.
Once the plate was printed, it was mounted on the Anton Paar rheometer using the shaft for disposable measuring tools. Some pictures of the measuring system are shown in Figure 3.

Set-up for rheological measurements with 3D printed PLA plate.
The new tool underwent all the required steps to be used with the rheometer, including registration of the new geometry, setting of the measuring parameter window, and motor adjustment for inertia correction. As reported below, a calibration fluid was used to compare the performance of the plate with that of the standard tools provided by the manufacturer.
2.4 Rheological protocols and measurements
Rheological measurements were performed on a stress-controlled rotational rheometer MCR 702 (Anton Paar, Graz, Austria) equipped with a Peltier unit for temperature control. Tests were performed in the linear viscoelastic regime using the custom-made parallel plate geometry, as illustrated below. A gap of 1 mm between plates was always used for all experiments. To prevent sample evaporation of the aqueous solutions during the measurement, a solvent trap consisting of a low-viscosity silicon oil sealing (η oil = 0.1 Pa s at 25°C) was poured around the rim of the PLA plate. Oscillatory shear isothermal tests were conducted on the PVA–borax and the alginate–CaCl2 systems at a temperature of 25°C to monitor the sol-to-gel transition as a function of time. Tests included a pre-mixing phase that was made possible by the specially designed set-up of the tools. The Pluronic F68 solution was instead tested at 40°C by monitoring the inverse, gel-to-sol transition upon dilution of the Pluronic solution, whose microstructure changed from soft body-centred cubic (BCC) crystals to a micellar solution [44–47]. In all cases, measurements were performed under an oscillatory frequency of 1 rad/s and a deformation of 3%.
Measurements of the PVA–borax and alginate–CaCl2 systems were performed in the same way as follows: an oscillatory time sweep test started with the 1 mm plate gap empty. Then, the two solutions were simultaneously injected inside the plate through the inlet of each channel. The amount of materials to be injected was specifically calculated to exactly fill the gap between the two plates and the cavities inside the 3D-printed plate while achieving a specific final composition. A movie of the procedure is reported in the SI. For the Pluronic F68 solution, due to its high viscosity, it was decided to use a different protocol: the measurement started after loading the aqueous solution of Pluronic. Later, a predetermined amount of water, which guarantees a change in Pluronic F68 concentration such as to produce a transition from a BCC phase to a micellar solution, was injected from both holes.
3 Results and discussion
In order to validate the new tool, the calibration fluid was first used to perform a frequency sweep test, as shown in Figure 4. The measurements were compared with those obtained with a standard 40 mm stainless steel plate. Up to frequencies of about 100 rad/s, the measurements were essentially coincident, while at higher frequencies, some discrepancies were observed. In particular, a spurious cross-over at the highest frequency can be seen, not expected from the calibration certificate of the fluid and not present in the standard tool data. As a consequence, in the subsequent measurements, frequencies above 100 rad/s were never used.

Frequency sweep test carried out on the calibration fluid at 25°C and 1% strain, with the 40 mm PLA plate (red symbols) and a regular 40 mm steel plate (blue symbols).
The positive results obtained from the calibration fluid measurements allowed us to use the novel set-up to perform in situ phase transition measurements of different systems. The first system considered is the one formed by sodium alginate and CaCl2. Alginate is a polysaccharide derived from seaweed in the form of a sodium salt. In an aqueous solution, long polymer chains are freely dispersed in water. When CaCl2 is added, calcium ions (Ca²⁺) replace sodium ions (Na⁺) on the alginate chain. The latter can be considered as an egg box with interstices in which Ca²⁺ may pack and coordinate [48]. This leads to cohesion between the different alginate chains and, consequently, to a 3D gel network. This has been well explained by the so-called “egg-box model” [48], which simplifies the cooperative process involving polysaccharides and divalent cations.
The gel formation is a rapid process that can be controlled by varying the concentration of both sodium alginate and calcium chloride, as well as temperature. In our case, tests were carried out by injecting 0.9 ml of 2% w/w alginate and 0.2 ml of 75 mM CaCl2 aqueous solutions into the two lateral holes of the plate. These concentrations allow us to work on a stoichiometric excess of alginate in comparison to the calcium chloride. The optimal “merging” of the systems is guaranteed by the fact that both systems fall between the measuring plates at the same time and are spatially distributed, owing to the design of the plate. Systematic time sweep measurements were performed to verify alginate gelation. Figure 5 shows the increase in moduli as a function of time after sample mixing, which marks the onset of gelation due to the presence of CaCl2. The viscoelastic moduli sharply increase up to a final value, characteristic of the gel strength at 25°C. It is evident that the interaction kinetics are quite fast, and the very early stages of gelation are difficult to be caught.

Small-amplitude oscillatory shear measurements at 25°C and 3% strain and an angular frequency of 1 rad/s on alginate and CaCl2 samples.
Inspired by the pioneering work of Scott Blair and Burnett [49], the gelation process can be described as a first-order kinetic reaction in the concentration of the limiting reactant, which determines the final number of chemical bonds in the formed gel [50]. The elastic modulus (G′) can be, then, considered as an approximate measure of the number of bonds; the most likely kinetic situation in the early gelation stages would be that the rate of increase of G′ at any time is proportional to the number of bonds already formed. Later, however, at long times, there should be a deceleration process as the number of bonds diminishes. Hence, the kinetics of gelation can be fitted through the three-parameter exponential raise to the maximum equation, as follows:
where G ∞ represents the value of the viscoelastic moduli at time infinite, G 0 is the value of the viscoelastic moduli at time zero (unfitted – they are the moduli values of the alginate solution at the final concentration, in the absence of calcium chloride), τ is the characteristic time of the gelation process, and t is the experimental time. This type of fit has been used for the experimental data on G′, and the fitted characteristic time τ has been, then, fixed to fit G″ too. The best fit through the data is obtained with the parameters shown in Table 1, and the relative curves are reported in Figure 5 with lines (continuous for G′ and dashed for G″).
Parameters obtained by the fits on the experimental data reported in Figure 4
| G | G 0 (Pa) | (G ∞ – G 0) (Pa) | τ (min) |
|---|---|---|---|
| G′ | 0.0007 | 235.8 ± 4.3 | 22.17 |
| G″ | 0.0177 | 31.0 ± 0.2 | 22.17 |
It is possible from the parameters presented in Table 1 to evaluate the onset of the gelation process by measuring the time at which G′ = G″. This time is 0.13 s, suggesting that the sol–gel transition is fast.
The results shown in Figure 5 are in line with those already found in the literature. Besiri et al. [22], to monitor in situ the gelation of sodium alginate solutions combined with calcium chloride solutions, designed a system similar to the one presented in this article, where a certain amount of CaCl2 was gradually added to the alginate solution, the last already kept between the two plates. The addition was done from the bottom plate, through two holes, making difficult the mixing efficiency and the temperature control. From the comparison made between the results achieved here and those presented in several articles published by the same group [22,42], similarities were found in terms of the trend of the moduli over time. Unfortunately, the tests conducted here and those carried out by Besiri and co-workers cannot be directly compared due to the different types of alginates used.
The same type of test was carried out on the PVA–borax system. The formation of the gel network in solutions of PVA and borax is an example of chemical cross-linking that transforms the liquid solution into a viscoelastic gel [51]. This process occurs through the formation of hydrogen bonds and chemical interactions between PVA and borax molecules [52]. The PVA solution is characterized by the presence of long linear molecules; when borax is added, the latter dissolves in water by dissociating into borate and sodium ions. In the same way, as with alginate and CaCl2 solution, borate ions form complexes via hydrogen bonds with the hydroxyl groups (−OH) present along the chains of PVA. In parallel, the incoming boric acid, which forms when sodium tetraborate is added to an aqueous solution, can also react with the hydroxyl groups of PVA to form boron–ester complexes, producing covalent bonds between the different chains of PVA [17]. The combination of hydrogen bonds and boron–ester bonds between the PVA chains creates a three-dimensional structure [19], within which water is trapped, transforming the solution into a viscoelastic gel. As in the previous case, this system shows very fast early stages of gelation kinetics, followed by a slower evolution at longer times.
Tests were carried out by injecting 0.9 ml of 8% w/w PVA solution on one side and 0.2 ml of a 4% w/w aqueous borax solution on the other side into the perforated plate. These concentrations allow us to work on a stoichiometric excess of PVA in comparison to borax. As in the previous case, the rapid increase of the moduli during the first instants of the test marks the onset of the gelation and is followed by slower kinetics at longer times (Figure 6). Measurements were also conducted on PVA samples at the same PVA concentration but in the absence of borax to get an initial value of the moduli before gelation, used for the following fit.

Small-amplitude oscillatory shear measurements at 3% strain and an angular frequency of 10 rad/s on PVA and borax samples.
The test provides several pieces of microstructural information about the hydrogel that has formed: during the first few minutes of the test, the rise of the moduli is rapid as the two solutions in contact begin to react and gel. At later times, the gelation slows down due to the decrease in the available bonds. The kinetics of the gel formation can be followed, again, by fitting the rheological data with equation (1), as previously explained. The best fits through the data are obtained with the parameters shown in Table 2. Fitted lines are also reported in Figure 6, along with the experimental data.
Parameters obtained by the fits on the experimental data reported in Figure 5
| G | G 0 (Pa) | (G ∞ – G 0) (Pa) | τ (min) |
|---|---|---|---|
| G′ | 0.003 | 2008.6 ± 21.7 | 32.00 |
| G″ | 0.294 | 661.8 ± 7.2 | 32.00 |
The characteristic time of the gelation for the system PVA–borax lasts roughly 30 min, with a characteristic time for the sol–gel transition of roughly 0.41 s.
A completely different proof of the successful functionality of the novel set-up was obtained from the measurement of the aqueous dilution of Pluronic F68 in water. According to the phase diagram of Pluronic F68 [44], at a fixed temperature, different phases are present. In particular, at 40°C, the system undergoes a phase transition from a BCC crystalline structure to a spherical micelle homogeneous suspension when the Pluronic F68 concentration decreases. It was decided to carry out an oscillatory time sweep experiment, where water was gradually added through the lateral holes of the plate to the Pluronic solution (to dilute it), thus “pushing” the phase transition from a BCC structure to a micellar suspension. To perform the test, the temperature was set at 40°C. About 1 g of the 45% Pluronic solution is already present between the two plates, and it is characterized by a solid-like high modulus due to a BCC phase at this concentration and temperature. Keeping the temperature constant, 1 ml of water was injected (Figure 7) in a way that the Pluronic F68 concentration could reach a final concentration of 22.5% w/w. According to the phase diagram reported elsewhere [44,45], at this concentration, the system presents spherical micelles disposed of randomly in water, such as characterized only by a viscous modulus. The test was performed for about 14 h while keeping the temperature constant.

Small-amplitude oscillatory shear measurements at 3% strain and an angular frequency of 1 rad/s on Pluronic F68 samples.
Figure 7 shows a completely different trend when compared to the previous two cases. The moduli, indeed, remain stable for roughly 10 min and then drop because of the water diffusion in the BCC structure and the consequent break of the crystal morphology (culminating in the formation of spherical micelles at very long times). In this case, the kinetics are marked by two characteristic times, as clearly identified by the double exponential decay equation used to properly fit the data:
where G ∞ (unfitted) represents the value of the viscoelastic moduli at time infinite (i.e. evaluated on the sample with F68 Pluronic concentration of 22.5% w/w), G ∞ + G 0,1 + G 0,2 represents the value of the viscoelastic moduli at time zero (although G ∞ is negligible), and τ 1 and τ 2 are the two characteristic times of the process. This type of fit has been used for the experimental data on both the viscous and the elastic moduli (G can be G′ or G″). The best fit through the data is obtained with the parameters shown in Table 3, and the relative curves are reported in Figure 7 with lines.
Parameters obtained by the fits on the experimental data reported in Figure 7
| G | G 0 (Pa) | G 0,1 (Pa) | τ 1 (min) | G 0,1 (Pa) | τ 2 (min) |
|---|---|---|---|---|---|
| G″ | 0.023 | 6672.15 ± 138.40 | 24.33 | 6508.84 ± 141.12 | 322.58 |
| G′ | 0.001 | 5678.75 ± 143.10 | 18.86 | 3909.36 ± 144.00 | 312.50 |
The presence of two characteristic times, which differ by one order of magnitude, suggests, as previously mentioned, that the dissolution process is probably a double step. We speculate that the first characteristic time relates to the diffusion of water within the sample, while the second characteristic time represents the breaking time needed by the BCC structure to transform into randomly distributed spherical micelles. The τ 1 value of G″ can be used to estimate the diffusion coefficient of water within the gap containing the Pluronic F68 solution. By considering the sample measurement gap, h, as the characteristic length of the system, the effective diffusion coefficient (i.e. the diffusion coefficient of water in a Pluronic network characterized by a specific microstructure) can be evaluated as D eff = h 2 /τ 1, which yields a value of 4 × 10⁻⁸ m2/s.
4 Conclusions
This study presents an experimental validation of a new tool, designed, engineered, and produced in a way to monitor in situ phase transitions of different materials. One of the advantages of using this tool is the ability to obtain in situ information on the kinetics of fast phase transitions, being gelation or dilution. With this tool, an attempt has been made to overcome the limitations of the instruments currently used to carry out measurements of this type by ensuring optimal merging of two different solutions directly in the measuring system. The main advantage of this new tool is its modularity; since it is 3D printed and designed, it is possible to change the size of the plate, as well as the geometry of the feeding channels, to adapt to different experimental conditions and protocols and to be mounted on any commercial rheometer. Moreover, it is possible to avoid problems, such as sample slippage, since the printed surface has a “natural” roughness, typical of surfaces that are obtained by overlapping filament-printed layers.
We validated the use of this tool with two systems undergoing gelation and one system facing a phase transition. The possibility of obtaining information about the early stages of the mixing procedures allows us to fit the experimental data and obtain the characteristic times of the processes. The results obtained are consistent with those found in the literature, which are, in any case, limited to the properties of the final product.
Nevertheless, there may be some limitations related to the use of this tool, such as the application of high temperatures, that could affect PLA. This, indeed, softens at temperatures close to 70°C and can deform in a nonlinear regime. A way to overcome these limitations could be to consider the same tool printed with other polymers, for example, thermosetting resins [53]. We are already working on this option, and on the way to implementing fast in situ analysis (e.g. chirp methodology [54]) by using other rheometers.
-
Funding information: This study was financially supported by the Italian Ministry of University and Research via the PRIN project (Project no: 2022JJRH8H; Project name: Non-equilibrium self-assembly of structured fluids: a multi-scale engineering problem).
-
Author contributions: AA: investigation, formal analysis, writing – original draft, and data curation; NG: writing – review and editing, funding acquisition, visualization, and resources; RP: conceptualization, data curation, writing – review and editing, supervision, funding acquisition, and visualization.
-
Conflict of interest: The datasets generated during and/or analysed during the current study are available from the corresponding author upon reasonable request.
-
Ethical approval: The conducted research is not related to either human or animal use.
-
Data availability statement: The data sets generated during and/or analysed during the current study are available from the corresponding author on reasonable request.
References
[1] Wang J, Ugaz VM. Using in situ rheology to characterize the microstructure in photopolymerized polyacrylamide gels for DNA electrophoresis. Electrophoresis. 2006;27(17):3349–58. 10.1002/elps.200500910.Search in Google Scholar
[2] Isakov D, Gibbons GJ. Real-time rheological monitoring with the smart stirrer. IEEE Trans Instrum Meas. 2024;73:1–6. 10.1109/TIM.2024.3379413.Search in Google Scholar
[3] Avallone PR, Russo Spena S, Acierno S, Esposito MG, Sarrica A, Delmonte M, et al. Thermorheological behavior of κ-carrageenan hydrogels modified with Xanthan gum. Fluids. 2023;8(4):119.10.3390/fluids8040119Search in Google Scholar
[4] Torres MD, Fradinho P, Raymundo A, Sousa I. Thermorheological and textural behaviour of gluten-free gels obtained from chestnut and rice flours. Food Bioprocess Technol. 2014;7(4):1171–82. 10.1007/s11947-013-1132-6.Search in Google Scholar
[5] Weber E, Moyers-González M, Burghelea TI. Thermorheological properties of a carbopol gel under shear. J Non-Newtonian Fluid Mech. 2012;183–184:14–24. 10.1016/j.jnnfm.2012.07.005.Search in Google Scholar
[6] Estévez N, Fuciños P, Bargiela V, Pastrana L, Tovar CA, Luisa Rúa M. Structural and thermo-rheological analysis of solutions and gels of a β-lactoglobulin fraction isolated from bovine whey. Food Chem. 2016;198:45–53. 10.1016/j.foodchem.2015.11.090.Search in Google Scholar
[7] Herranz B, Borderias AJ, Solas MT, Tovar CA. Influence of measurement temperature on the rheological and microstructural properties of glucomannan gels with different thermal histories. Food Res Int. 2012;48(2):885–92. 10.1016/j.foodres.2012.07.005.Search in Google Scholar
[8] Lee HG, Lanier TC, Hamann DD. Covalent cross-linking effects on thermo-rheological profiles of fish protein gels. J Food Sci. 1997;62(1):25–8. 10.1111/j.1365-2621.1997.tb04360.x.Search in Google Scholar
[9] Bonino CA, Samorezov JE, Jeon O, Alsberg E, Khan SA. Real-time in situ rheology of alginate hydrogel photocrosslinking. Soft Matter. 2011;7(24):11510–7. 10.1039/C1SM06109G.Search in Google Scholar
[10] Haraguchi K, Takada T. Synthesis and characteristics of nanocomposite gels prepared by in situ photopolymerization in an aqueous system. Macromolecules. 2010;43(9):4294–9. 10.1021/ma902693x.Search in Google Scholar
[11] Sun G, Wu X, Liu R. A comprehensive investigation of acrylates photopolymerization shrinkage stress from micro and macro perspectives by real time MIR-photo-rheology. Prog Org Coat. 2021;155:106229. 10.1016/j.porgcoat.2021.106229.Search in Google Scholar
[12] He S, Afshang M, Caggioni M, Lindberg S, Schultz KM. Characterizing phase transitions of microfibrillated cellulose induced by anionic and cationic surfactants. Langmuir. 2023;39(35):12346–56. 10.1021/acs.langmuir.3c01347.Search in Google Scholar
[13] Avallone PR, Pasquino R, Costanzo S, Sarrica A, Delmonte M, Greco F, et al. On the inverse quenching technique applied to gelatin solutions. J Rheol. 2021;65(5):1081–8. 10.1122/8.0000298.Search in Google Scholar
[14] Fang Y, Zhang H, Nishinari K, eds. Food hydrocolloids: Functionalities and applications. Singapore: Springer; 2021. 10.1007/978-981-16-0320-4.Search in Google Scholar
[15] He S, Pascucci DR, Caggioni M, Lindberg S, Schultz KM. Rheological properties of phase transitions in polydisperse and monodisperse colloidal rod systems. AIChE J. 2021;67(11):e17401. 10.1002/aic.17401.Search in Google Scholar
[16] Abbes C, Zammali M, Mahjoub HF, Othman T. Microrheological study of PVA–borax physical gel: effects of charge screening. Macromol Res. 2023;31(7):637–48. 10.1007/s13233-023-00146-5.Search in Google Scholar
[17] Angelova LV, Terech P, Natali I, Dei L, Carretti E, Weiss RG. Cosolvent gel-like materials from partially hydrolyzed poly(vinyl acetate)s and borax. Langmuir. 2011;27(18):11671–82. 10.1021/la202179e.Search in Google Scholar
[18] Altobelli A, Cennamo P, Trojsi G, Lumaga MRB, Carpentieri A, Fatigati G. Experimentation of a PVA-Borax hydrogel for the removal of Paraloid B72® from artifacts of archaeological interest from the National Archaeological Museum in Naples, Italy. Acta IMEKO. 2023;12(3):1–8. 10.21014/actaimeko.v12i3.1501.Search in Google Scholar
[19] Bertsch P, Diba M, Mooney DJ, Leeuwenburgh SCG. Self-healing injectable hydrogels for tissue regeneration. Chem Rev. 2023;123(2):834–73. 10.1021/acs.chemrev.2c00179.Search in Google Scholar
[20] Liu M, Lu X, Gao L, Wang S, Huo Y, Chen Z-N. Polyvinyl alcohol-based thermogel with tunable gelation and self-healing property. Macromol Chem Phys. 2018;219(14):1800162. 10.1002/macp.201800162.Search in Google Scholar
[21] Lin H-L, Liu W-H, Shen K-S, Yu TL, Cheng C-H. Weak gel behaviour of poly(vinyl alcohol)-borax aqueous solutions. J Polym Res. 2003;10(3):171–9. 10.1023/A:1026060630998.Search in Google Scholar
[22] Besiri IN, Goudoulas TB, Germann N. Impact of CaCl2 concentration and in situ rheometric setup configuration on fast alginate-Ca2+ reaction. Phys Fluids. 2022;34(5):053104. 10.1063/5.0090679.Search in Google Scholar
[23] Hu C, Lu W, Mata A, Nishinari K, Fang Y. Ions-induced gelation of alginate: mechanisms and applications. Int J Biol Macromol. 2021;177:578–88. 10.1016/j.ijbiomac.2021.02.086.Search in Google Scholar
[24] Besiri IN, Goudoulas TB, Fattahi E, Becker T. Experimental advances in the real-time recording of cross-linking alginate in situ gelation: a review. Polymers. 2023;15(13):2875. 10.3390/polym15132875.Search in Google Scholar
[25] Madan M, Bajaj A, Lewis S, Udupa N, Baig JA. In situ forming polymeric drug delivery systems. Indian J Pharm Sci. 2009;71(3):242–51. 10.4103/0250-474X.56015.Search in Google Scholar
[26] Hatefi A, Amsden B. Biodegradable injectable in situ forming drug delivery systems. J Controlled Rel. 2002;80(1):9–28. 10.1016/S0168-3659(02)00008-1.Search in Google Scholar
[27] Avallone PR, Raccone E, Costanzo S, Delmonte M, Sarrica A, Pasquino R, et al. Gelation kinetics of aqueous gelatin solutions in isothermal conditions via rheological tools. Food Hydrocoll. 2021;111:106248. 10.1016/j.foodhyd.2020.106248.Search in Google Scholar
[28] Russo Spena S, Pasquino R, Sarrica A, Delmonte M, Yang C, Grizzuti N. Kinetics of acid hydrolysis of K-carrageenan by in situ rheological follow-up. Food Hydrocoll. 2023;144:108953. 10.1016/j.foodhyd.2023.108953.Search in Google Scholar
[29] Paruta-Tuarez E, Marchal P, Choplin L. Application of the systemic rheology to the in situ follow-up of viscosity evolution with reaction time in the synthesis of urethane prepolymers. Int J Adhes Adhes. 2014;50:32–6. 10.1016/j.ijadhadh.2013.12.015.Search in Google Scholar
[30] Parlato RM, Russo ER, Läuger J, Costanzo S, Vanzanella V, Grizzuti N. On the use of the coaxial cylinders equivalence for the measurement of viscosity in complex non-viscometric, rotational geometries. Fluids. 2020;5(2):43. 10.3390/fluids5020043.Search in Google Scholar
[31] Quantitative Analysis of Mixer‐Type Rheometers using the Couette Analogy - Aït‐Kadi - 2002 - The Canadian Journal of Chemical Engineering – Wiley Online Library. https://onlinelibrary.wiley.com/doi/abs/10.1002/cjce.5450800618 (accessed 2024-09-30).Search in Google Scholar
[32] Kubo W, Konno Y, Miyazaki S, Attwood D. In situ gelling pectin formulations for oral sustained delivery of paracetamol. Drug Dev Ind Pharm. 2004;30(6):593–9. 10.1081/ddc-120037490.Search in Google Scholar
[33] Miyazaki S, Endo K, Kawasaki N, Kubo W, Watanabe H, Attwood D. Oral sustained delivery of paracetamol from in situ gelling xyloglucan formulations. Drug Dev Ind Pharm. 2003;29(2):113–9. 10.1081/ddc-120016718.Search in Google Scholar
[34] Di Spirito NA, Di Baia C, Grizzuti N, Pasquino R, de Gennaro B. Drug release from Pluronic F68 hydrogels. Phys Fluids. 2024;36(3):031709. 10.1063/5.0204073.Search in Google Scholar
[35] Itoh K, Yahaba M, Takahashi A, Tsuruya R, Miyazaki S, Dairaku M, et al. In situ gelling xyloglucan/pectin formulations for oral sustained drug delivery. Int J Pharm. 2008;356(1–2):95–101. 10.1016/j.ijpharm.2007.12.049.Search in Google Scholar
[36] Hunt NC, Smith AM, Gbureck U, Shelton RM, Grover LM. Encapsulation of fibroblasts causes accelerated alginate hydrogel degradation. Acta Biomater. 2010;6(9):3649–56. 10.1016/j.actbio.2010.03.026.Search in Google Scholar
[37] Moxon SR, Smith AM. Controlling the rheology of gellan gum hydrogels in cell culture conditions. Int J Biol Macromol. 2016;84:79–86. 10.1016/j.ijbiomac.2015.12.007.Search in Google Scholar
[38] Jahromi SH, Grover LM, Paxton JZ, Smith AM. Degradation of polysaccharide hydrogels seeded with bone marrow stromal cells. J Mech Behav Biomed Mater. 2011;4(7):1157–66. 10.1016/j.jmbbm.2011.03.025.Search in Google Scholar
[39] Mahdi MH, Diryak R, Kontogiorgos V, Morris GA, Smith AM. In situ rheological measurements of the external gelation of alginate. Food Hydrocoll. 2016;55:77–80. 10.1016/j.foodhyd.2015.11.002.Search in Google Scholar
[40] Diryak R, Kontogiorgos V, Ghori MU, Bills P, Tawfik A, Morris GA, et al. Behavior of in situ cross-linked hydrogels with rapid gelation kinetics on contact with physiological fluids. Macromol Chem Phys. 2018;219(8):1700584. 10.1002/macp.201700584.Search in Google Scholar
[41] Besiri IN, Goudoulas TB, Germann N. Custom-made rheological setup for in situ real-time fast alginate-Ca2+ gelation. Carbohydr Polym. 2020;246:116615. 10.1016/j.carbpol.2020.116615.Search in Google Scholar
[42] Besiri IN, Goudoulas TB, Fattahi E, Becker T. In situ evaluation of alginate-Ca2+ gelation kinetics. J Appl Polym Sci. 2023;140(32):54252. 10.1002/app.54252.Search in Google Scholar
[43] Palma JH, Bertuola M, Hermida ÉB. Modeling calcium diffusion and crosslinking dynamics in a thermogelling alginate-gelatin-hyaluronic acid ink: 3D bioprinting applications. Bioprinting. 2024;38:e00329. 10.1016/j.bprint.2024.e00329.Search in Google Scholar
[44] Costanzo S, di Sarno A, D’Apuzzo M, Avallone PR, Raccone E, Bellissimo A, et al. Rheology and morphology of Pluronic F68 in water. Phys Fluids. 2021;33(4):043113. 10.1063/5.60049722.Search in Google Scholar
[45] Di Spirito NA, Grizzuti N, Casalegno M, Castiglione F, Pasquino R. Phase transitions of aqueous solutions of Pluronic F68 in the presence of Diclofenac Sodium. Int J Pharm. 2023;644:123353. 10.1016/j.ijpharm.2023.123353.Search in Google Scholar
[46] Di Spirito NA, Grizzuti N, Lutz-Bueno V, Urciuoli G, Auriemma F, Pasquino R. Pluronic F68 micelles as carriers for an anti-inflammatory drug: a rheological and scattering investigation. Langmuir. 2024;40(2):1544–54. 10.1021/acs.langmuir.3c03682.Search in Google Scholar
[47] Zhou Z, Chu B. Anomalous micellization behavior and composition heterogeneity of a triblock ABA copolymer of (A) ethylene oxide and (B) propylene oxide in aqueous solution. Macromolecules. 1988;21(8):2548–54. 10.1021/ma00186a039.Search in Google Scholar
[48] Grant GT, Morris ER, Rees DA, Smith PJC, Thom D. Biological interactions between polysaccharides and divalent cations: the egg-box model. FEBS Lett. 1973;32(1):195–8. 10.1016/0014-5793(73)80770-7.Search in Google Scholar
[49] Scott Blair GW, Burnett J. An equation to describe the rate of setting of blood and milk. Biorheology. 1963;1:183–91.10.3233/BIR-1963-1303Search in Google Scholar
[50] Funami T, Fang Y, Noda S, Ishihara S, Nakauma M, Draget KI, et al. Rheological properties of sodium alginate in an aqueous system during gelation in relation to supermolecular structures and Ca2+ binding. Food Hydrocoll. 2009;23(7):1746–55. 10.1016/j.foodhyd.2009.02.014.Search in Google Scholar
[51] Mahjoub HF, Zammali M, Abbes C, Othman T. Microrheological study of PVA/borax physical gels: Effect of chain length and elastic reinforcement by sodium hydroxide addition. J Mol Liq. 2019;291:111272. 10.1016/j.molliq.2019.111272.Search in Google Scholar
[52] Bercea M, Morariu S, Rusu D. In situ gelation of aqueous solutions of entangled poly(vinyl alcohol). Soft Matter. 2012;9(4):1244–53. 10.1039/C2SM26094H.Search in Google Scholar
[53] Polymers | Free Full-Text | A Review of Vat Photopolymerization Technology: Materials, Applications, Challenges, and Future Trends of 3D Printing. https://www.mdpi.com/2073-4360/13/4/598 (accessed 2024-07-26).10.3390/polym13040598Search in Google Scholar
[54] Geri M, Keshavarz B, Divoux T, Clasen C, Curtis DJ, McKinley GH. Time-resolved mechanical spectroscopy of soft materials via optimally windowed chirps. Phys Rev X. 2018;8(4):041042. 10.1103/PhysRevX.8.041042.Search in Google Scholar
© 2025 the author(s), published by De Gruyter
This work is licensed under the Creative Commons Attribution 4.0 International License.
Articles in the same Issue
- Research Articles
- Lie symmetry analysis of bio-nano-slip flow in a conical gap between a rotating disk and cone with Stefan blowing
- Mathematical modelling of MHD hybrid nanofluid flow in a convergent and divergent channel under variable thermal conductivity effect
- Advanced ANN computational procedure for thermal transport prediction in polymer-based ternary radiative Carreau nanofluid with extreme shear rates over bullet surface
- Effects of Ca(OH)2 on mechanical damage and energy evolution characteristics of limestone adsorbed with H2S
- Effect of plasticizer content on the rheological behavior of LTCC casting slurry under large amplitude oscillating shear
- Studying the role of fine materials characteristics on the packing density and rheological properties of blended cement pastes
- Deep learning-based image analysis for confirming segregation in fresh self-consolidating concrete
- MHD Casson nanofluid flow over a three-dimensional exponentially stretching surface with waste discharge concentration: A revised Buongiorno’s model
- Rheological behavior of fire-fighting foams during their application – a new experimental set-up and protocol for foam performance qualification
- Viscoelastic characterization of corn starch paste: (II) The first normal stress difference of a cross-linked waxy corn starch paste
- An innovative rheometric tool to study chemorheology
- Effect of polymer modification on bitumen rheology: A comparative study of bitumens obtained from different sources
- Rheological and irreversibility analysis of ternary nanofluid flow over an inclined radiative MHD cylinder with porous media and couple stress
- Rheological analysis of saliva samples in the context of phonation in ectodermal dysplasia
- Analytical study of the hybrid nanofluid for the porosity flowing through an accelerated plate: Laplace transform for the rheological behavior
- Brief Report
- Correlations for friction factor of Carreau fluids in a laminar tube flow
- Special Issue on the Rheological Properties of Low-carbon Cementitious Materials for Conventional and 3D Printing Applications
- Rheological and mechanical properties of self-compacting concrete with recycled coarse aggregate from the demolition of large panel system buildings
- Effect of the combined use of polyacrylamide and accelerators on the static yield stress evolution of cement paste and its mechanisms
- Special Issue on The rheological test, modeling and numerical simulation of rock material - Part II
- Revealing the interfacial dynamics of Escherichia coli growth and biofilm formation with integrated micro- and macro-scale approaches
- Construction of a model for predicting sensory attributes of cosmetic creams using instrumental parameters based on machine learning
- Effect of flaw inclination angle and crack arrest holes on mechanical behavior and failure mechanism of pre-cracked granite under uniaxial compression
- Special Issue on The rheology of emerging plant-based food systems
- Rheological properties of pea protein melts used for producing meat analogues
- Understanding the large deformation response of paste-like 3D food printing inks
- Seeing the unseen: Laser speckles as a tool for coagulation tracking
- Composition, structure, and interfacial rheological properties of walnut glutelin
- Microstructure and rheology of heated foams stabilized by faba bean isolate and their comparison to egg white foams
- Rheological analysis of swelling food soils for optimized cleaning in plant-based food production
- Multiscale monitoring of oleogels during thermal transition
- Influence of pea protein on alginate gelation behaviour: Implications for plant-based inks in 3D printing
- Observations from capillary and closed cavity rheometry on the apparent flow behavior of a soy protein isolate dough used in meat analogues
- Special Issue on Hydromechanical coupling and rheological mechanism of geomaterials
- Rheological behavior of geopolymer dope solution activated by alkaline activator at different temperature
- Special Issue on Rheology of Petroleum, Bitumen, and Building Materials
- Rheological investigation and optimization of crumb rubber-modified bitumen production conditions in the plant and laboratory