Potential of anaerobic co-digestion of acidic fruit processing waste and waste-activated sludge for biogas production
-
Lulu Zhang
 ,
Biao Peng
,
Biao Peng

Abstract
The potential of acidic fruit processing waste (FPW) and waste-activated sludge (WAS) co-digestion for methane production was investigated using batch and continuous experiments. First, batch experiments showed the co-digestion of FPW and WAS solved acid accumulation and increased cumulative biogas production. When the volatile solid (VS) ratio of FPW to WAS was 2:1, the cumulative biogas production was the highest (4,695.47 mL), which increased by 5.2% and 10.5% compared with the VS ratios of 3:1 and 1:1, respectively. Methane production was the rate-limiting step when the FPW percentage was high, and hydrolysis was the rate-limiting step when the WAS percentage was high. Second, the continuous experiments showed fermentation was the most stable when the VS ratio was 2:1, without acid accumulation or excessive total alkalinity consumption. Additionally, the ammonia nitrogen content in the system was above 138.34 mg·L−1, which solved the slow WAS hydrolysis rate and low nitrogen supply efficiency. Microbial community structure of the reactor was correlated with substrate composition greatly. On the 180th day, the relative abundance levels of Bacteroides, Paludibacter, Litorilinea, Levilinea, and Smithella were higher than those on the 120th day and the 240th day. The enrichment of those bacterial groups was beneficial to improve the substrate hydrolysis rate and reduce the influence of organic acids on the anaerobic system.
1 Introduction
Apples are in high demand worldwide because of their desirable taste, nutritional value, and unique properties [1]. Globally, almost 54.2 million tons of apples are produced yearly [2], of which more than 50% are produced in China. Most of the apples are eaten as fresh fruits, and 25–30% of apples are converted into processed products, especially concentrated apple juice which is the most important product [3]. There are mainly two kinds of solid wastes generated from apple juice production. One is fruit processing waste (FPW), which is direct solid waste such as rotten apples and apple pomace generated in apple cleaning, screening, crushing, and other steps. The other is waste-activated sludge (WAS), which is indirect solid waste generated during the aerobic treatment of apple juice wastewater [4,5].
Both FPW and WAS have high fermentation characteristics and biodegradability [6,7]. If discarded or landfilled, they can cause environmental problems such as greenhouse gas emissions, landfill leachate emissions, pathogen transport, and groundwater pollution [8]. In recent years, there have been many studies on the recycling of WAS and FPW. WAS is rich in fructose, glucose, protein, and organic acids [9], and is often used for feed [10], pectin recovery [11,12], and enzyme [13] and phenolic [14] extraction. There are also a few studies on the biomethanation of apple waste, but only the fruit seeds and peels screened from wastewater [15] or the residues from apple juice ultrafiltration are used as raw materials [9]. Anaerobic digestion of rotten apples produced during the washing and sorting stages is rarely studied. FPW is typically treated by incineration, landfills, composting [16,17], and anaerobic digestion [18,19,20]. In particular, the anaerobic digestion of FPW is well studied and is the best treatment method for sludge reduction. The methane produced therefrom is a clean energy source and can replace some fossil fuels for power generation, boiler combustion, etc.
Biogas preparation by anaerobic digestion of FPW or WAS alone still faces many challenges. When FPW is used as a single fermentation substance, its high carbon-nitrogen ratio may make the digestive system unbalanced, which will decrease microbial activity, resulting in microbial cell dysfunction and process deterioration [21] that are not conducive to the digestion progress. In addition, FPW has a high organic acid content and low pH, but the optimum pH for methanogens is neutral [22]. Too low of a pH can subject the anaerobic digestion reactor to inhibition or failure. Consequently, NaOH or Ca(OH)2 is often added as a buffer, but this method is only suitable for laboratory research and will raise the cost in large-scale industrial operations, and excessive Na+ and Ca2+ will inhibit methanogens [23]. When WAS is used as the single fermentation material, first, its low carbon-nitrogen ratio is also unfavorable for the digestion process. Second, hydrolytic acidification becomes the rate-limiting step since sludge contains intractable exopolymer materials and biomass cell envelopes [24]. This unfavorable condition results in low digestion efficiency, with specific methane yields of 150–190 L·g−1 volatile solid (VS). For this reason, thermal pretreatment to improve sludge degradation [25] or alkaline pretreatment to improve sludge solubility and facilitate hydrolytic acidification [26,27] is usually needed. However, this approach increases cost and leads to Maillard reactions that inhibit methanogens [28]. Given the properties of the aforementioned two substrates, co-digestion of FPW and WAS may be able to avoid acidification, and improve the efficiency of WAS hydrolysis and acidification, thereby achieving efficient and stable anaerobic fermentation. Although Fonoll [29] studied the feasibility of co-digestion of sewage sludge and fruit wastes (peach, banana, or apple), there were no particular studies on the optimal condition, fermentation mechanism, and microbial community structure for co-digestion of FPW and WAS.
In this study, the potential of FPW and WAS co-digestion to produce biogas was evaluated using two fermentation modes, including batch experiments and continuous experiments. The effects of VS ratios on biogas, methane content, pH,
2 Materials and methods
2.1 Feedstock and seeding sludge
FPW (rotten apple and apple pomace) and WAS were collected from Haisheng Fresh Fruit Juice Co. (Shaanxi province, China). FPW was shredded in a mashing device into small particles with a diameter of less than 2 mm. The detailed properties of FPW and WAS are presented in Table 1.
Physicochemical characterization of FPW and WAS
| Parameter | FPW | WAS | Parameter | FPW | WAS |
|---|---|---|---|---|---|
| pH | 3.2 ± 0.2 | 7.27 ± 0.3 | C/N ratio | 51.2 ± 0.6 | 9.2 ± 0.2 |
| Total solids (g·L−1) | 150.1 ± 2.2 | 83.84 ± 0.9 | TP (mg·g−1 TS) | 12.05 ± 0.3 | 9.79 ± 0.1 |
| Volatile solids (g·L−1) | 145.3 ± 4.3 | 51.56 ± 0.5 | NH4–N (mg·L−1) | 50.1 ± 1.2 | 229.0 ± 1.8 |
| SCOD (mg·L−1) | 7,761.5 ± 39.2 | 89.2 ± 2.3 | NO3–N (mg·g−1 TS) | n.d. | 12.4 ± 0.1 |
| COD (mg·g−1 TS) | 1,249.6 ± 19.4 | 681.6 ± 11.3 | Carbohydrates (% TS) | 87.3 ± 1.1 | 17.7 ± 0.8 |
| TOC (mg·g−1 TS) | 462.6 ± 0.8 | 470.4 ± 1.2 | Protein (% TS) | 5.3 ± 0.4 | 21.2 ± 0.6 |
| TN (mg·g−1 TS) | 9.0 ± 0.2 | 51.3 ± 0.5 | Lipid (% TS) | 4.0 ± 0.2 | 12.3 ± 0.5 |
The seeding sludge from a working pilot-scale mesophilic continuous stirred tank reactor (CSTR) for FPW digestion was used as the inoculum. The VS concentration and pH of the inoculum were 30.8 g·L−1 and 7.24, respectively. Before the experiment, starvation treatment was performed for a week, and no biogas production was observed. Hence, the inoculum can be used for anaerobic fermentation.
2.2 Reactor and operation
2.2.1 Batch experiments
Batch experiments were carried out in 500 mL reactors (effective volume of 400 mL), each covered with a rubber septum. Triplicate bottles were used in all batch experiments, and all data were expressed as the mean of triplicate ± standard deviation. Among the various samples, FW1 and FW7 were 100% FPW and 100% WAS as controls. Then, the effects of the VS ratios of FPW and WAS on biogas production were investigated. Typically, 250 mL of inoculated sludge and feedstock under different feeding ratios of FPW and WAS at the same organic load was added to each group of reactors, which were then added with water to a volume of 400 mL. After stirring evenly, it was purged with 99.99% pure nitrogen for 5 min so that the oxidation-reduction potential reached to −300 mV to ensure an anaerobic environment. The fermentation proceeded at 35 ± 0.5°C for a period of 40 day under 20 min of stirring at 100 rpm every 12 h. Biogas and methane production was detected online using a fully automated methanogenesis potential testing system (AMPTS II, Bioprocess Control). The feed-to-microbe (F/M) ratio was calculated based on the initial VS of the substrate and inoculum. Detailed experimental conditions and mixing ratios are summarized in Table 2. The F/M ratio was calculated based on the initial VS of the substrate and inoculum in Eq. 1:
Experimental design for batch experiment
| Samples | FW1 | FW2 | FW3 | FW4 | FW5 | FW6 | FW7 |
|---|---|---|---|---|---|---|---|
| FPW 100% | / | / | / | / | / | WAS 100% | |
| VS ratio (FPW:WAS) | / | 3:1 | 2:1 | 1:1 | 1:2 | 1:3 | / |
| Total VS (g) | 7.72 | ||||||
| F/M ratio | 1:1 | ||||||
| Substrate loading (gVS L−1) | 19.3 | ||||||
| Experimental duration | 40 days | ||||||
| Temperature | 35 ± 0.5℃ | ||||||
2.2.2 Continuous experiments
A lab-scale one-phase anaerobic digester (Bioprocess® CSTR-5S, Sweden) with a 4 L working volume was used for the co-digestion of FPW and WAS (Figure 1). A water bath was used to maintain the digester in a mesophilic environment (35 ± 0.5°C). The reactor was mixed using dedicated heaters (3619 Aquarium Heater 300 W, Eheim Jager, Germany) until a homogeneous state was reached. Then, 4 L of the inoculum was added initially and flushed with N2, ensuring that the oxidation-reduction potential reached to −300 mV to establish anaerobic conditions. FPW was diluted with water to a VS concentration of 8% before feeding from Day 1 to Day 230.
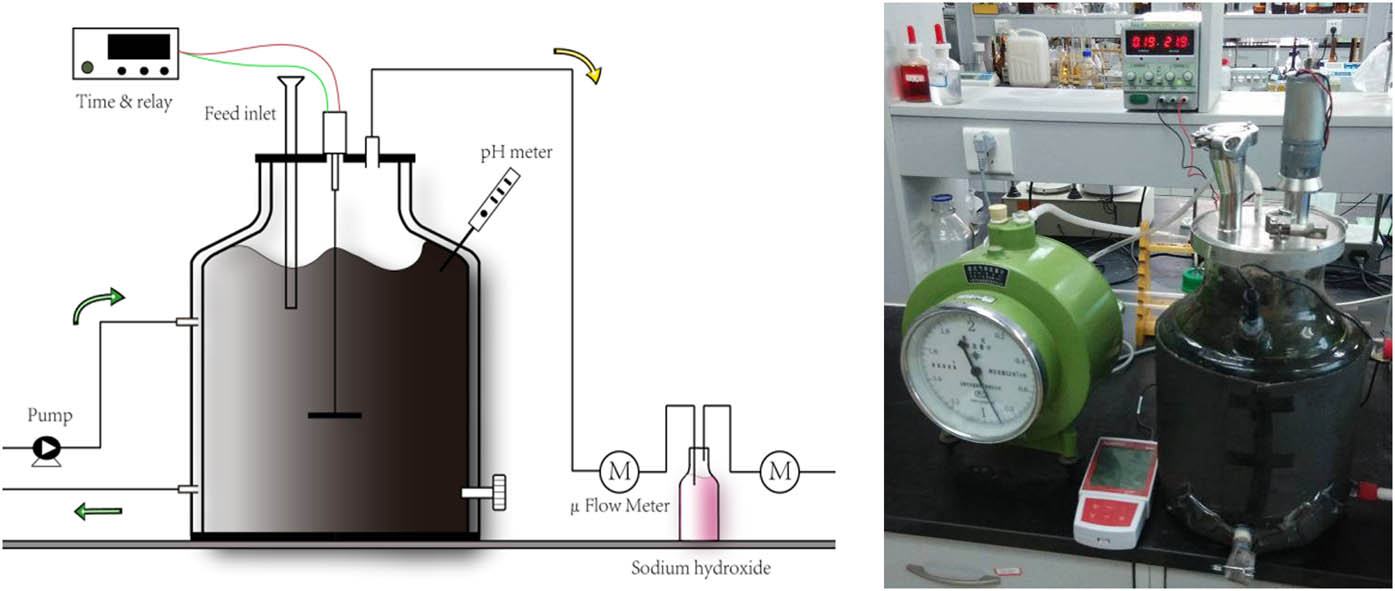
Schematic and material object diagram of the lab-scale FPW and WAS co-digestion processes.
Five operation stages were applied (Table 3). The feedstock was added once a day, and the digestate was discharged every three days. The effluent pH, ammonium nitrogen, volatile fatty acids (VFAs), and alkalinity were analyzed every three days. Biogas and methane were detected online.
Influent characteristic and operational parameters for FPW and WAS co-digestion
| Stage | Day | FPW | WAS | Feed volume (mL) | VS ratio (FPW:WAS) | C/N ratio | OLR (kg VS·m−3·day−1) | pH | Retention time (day) |
|---|---|---|---|---|---|---|---|---|---|
| VS (%) | VS (%) | ||||||||
| I | 1–60 | 8 | 5.16 | 100 | 4:1 | 22.2 | 1.80 | 4.21 | 40 |
| II | 61–120 | 8 | 5.16 | 109 | 3:1 | 19.8 | 1.92 | 4.51 | 37 |
| II | 121–180 | 8 | 5.16 | 128 | 2:1 | 16.8 | 2.16 | 4.76 | 31 |
| IV | 181–240 | 8 | 5.16 | 165 | 1.2:1 | 14.2 | 2.64 | 5.14 | 24 |
| V | 241–300 | 8 | 5.16 | 184 | 1:1 | 13.4 | 2.88 | 5.32 | 22 |
2.3 Physicochemical analysis
As described in Standard Methods (APHA/AWA/WEF 2005), TS, VS, chemical oxygen demand (COD), pH, and ammonium nitrogen (N–
2.4 Definition of conversion efficiency
The conversion efficiency of hydrolysis, acidogenesis, acetogenesis, and methanogenesis were calculated based on the COD in Eqs. 2–5, respectively [32]:
where TCOD and SCOD are the total COD and soluble COD, respectively. CODVFA is the total VFA concentration calculated by the COD of individual VFAs. CODAcetate is the concentration of acetic acid represented by COD. CODCH4 is calculated based on the principle of 0.35 LCH4·g−1 COD. The footnotes “in” and “out” indicate the COD of the influent and effluent, respectively.
2.5 Kinetic modeling
The kinetics of anaerobic co-digestion of FPW and WAS were investigated using two models. Cumulative biogas production during batch anaerobic co-digestion was estimated using the model in Table 4. Curve fitting and calculation of kinetic parameters were performed in Origin.
Equation of the kinetic model used for data analysis
| Model | Mathematical definition | Abbreviations |
|---|---|---|
| Monod [33] |
|
B(t): cumulative biogas production (mL) |
| B max: ultimate biogas production potential (mL) | ||
| t: co-digestion day (day) | ||
| k: rate constant (day−1) | ||
| First-order dynamics [34] |
|
2.6 Microbial analysis
Fermentation samples were collected from CSTR digester on Days 120, 180, and 240, respectively, and processed for microbial DNA extraction with the Fast DNA SPIN Kit for Soil (MP Biomedicals, Illkirch, France) in accordance with the manufacturer’s instructions. Then, the universal primer 341 F (5′ Adaptor−CCTACGGGNGGCWGCAG−3′) and reverse primer 805 R (5′ Adaptor−GACTACHVGGGTATCTAATCC−3′) were used for the polymerase chain reaction (PCR) amplification of V3–V4 hypervariable regions in 16 S rRNA. After purification and quantification, the amplicons were operated on a MiSeq sequencing platform (Illumina Inc, California, USA) by a company of microbial analysis (Majorbio Bio-Pharm Technology Co. Ltd. Shanghai, China). The raw data were merged, quality filtered by FLASH software and Mothur platform, and the taxonomic level was aligned using PyNAST and Greengenes [35].
3 Results and discussion
3.1 Batch experiments
3.1.1 Performance of biogas production and methane content in batch experiments
To study the methanogenesis capacity of substrates with different VS ratios, the cumulative biogas production obtained from the reactors under 7 feeding ratios of FPW to WAS is illustrated in Figure 2. Under the same total feeding VS, the biogas production first increased and then decreased following a gradual increase in the proportion of WAS. Because of its low pH and easy degradation, FPW fermented alone can be rapidly converted into small molecular acids at the early stage, resulting in abundant acid accumulation that inhibits the activity of methanogens and leads to fermentation failure (Figure 2a). With the addition of WAS, the acidification during fermentation was significantly improved. When the VS ratio was 2:1, the amount of cumulative biogas produced in the reactor was maximized to 4695.47 mL (Figure 2c), which increased by 5.2% and 10.5% compared with the VS ratios of 3:1 and 1:1, respectively. Then, with a further increase in the WAS proportion, the biogas production gradually decreased, because the hydrolysis stage is the rate-limiting step in WAS methane production. When WAS was fermented alone (Figure 2g), the cumulative biogas production was only 2,234.4 mL, which is consistent with some previous studies [15].
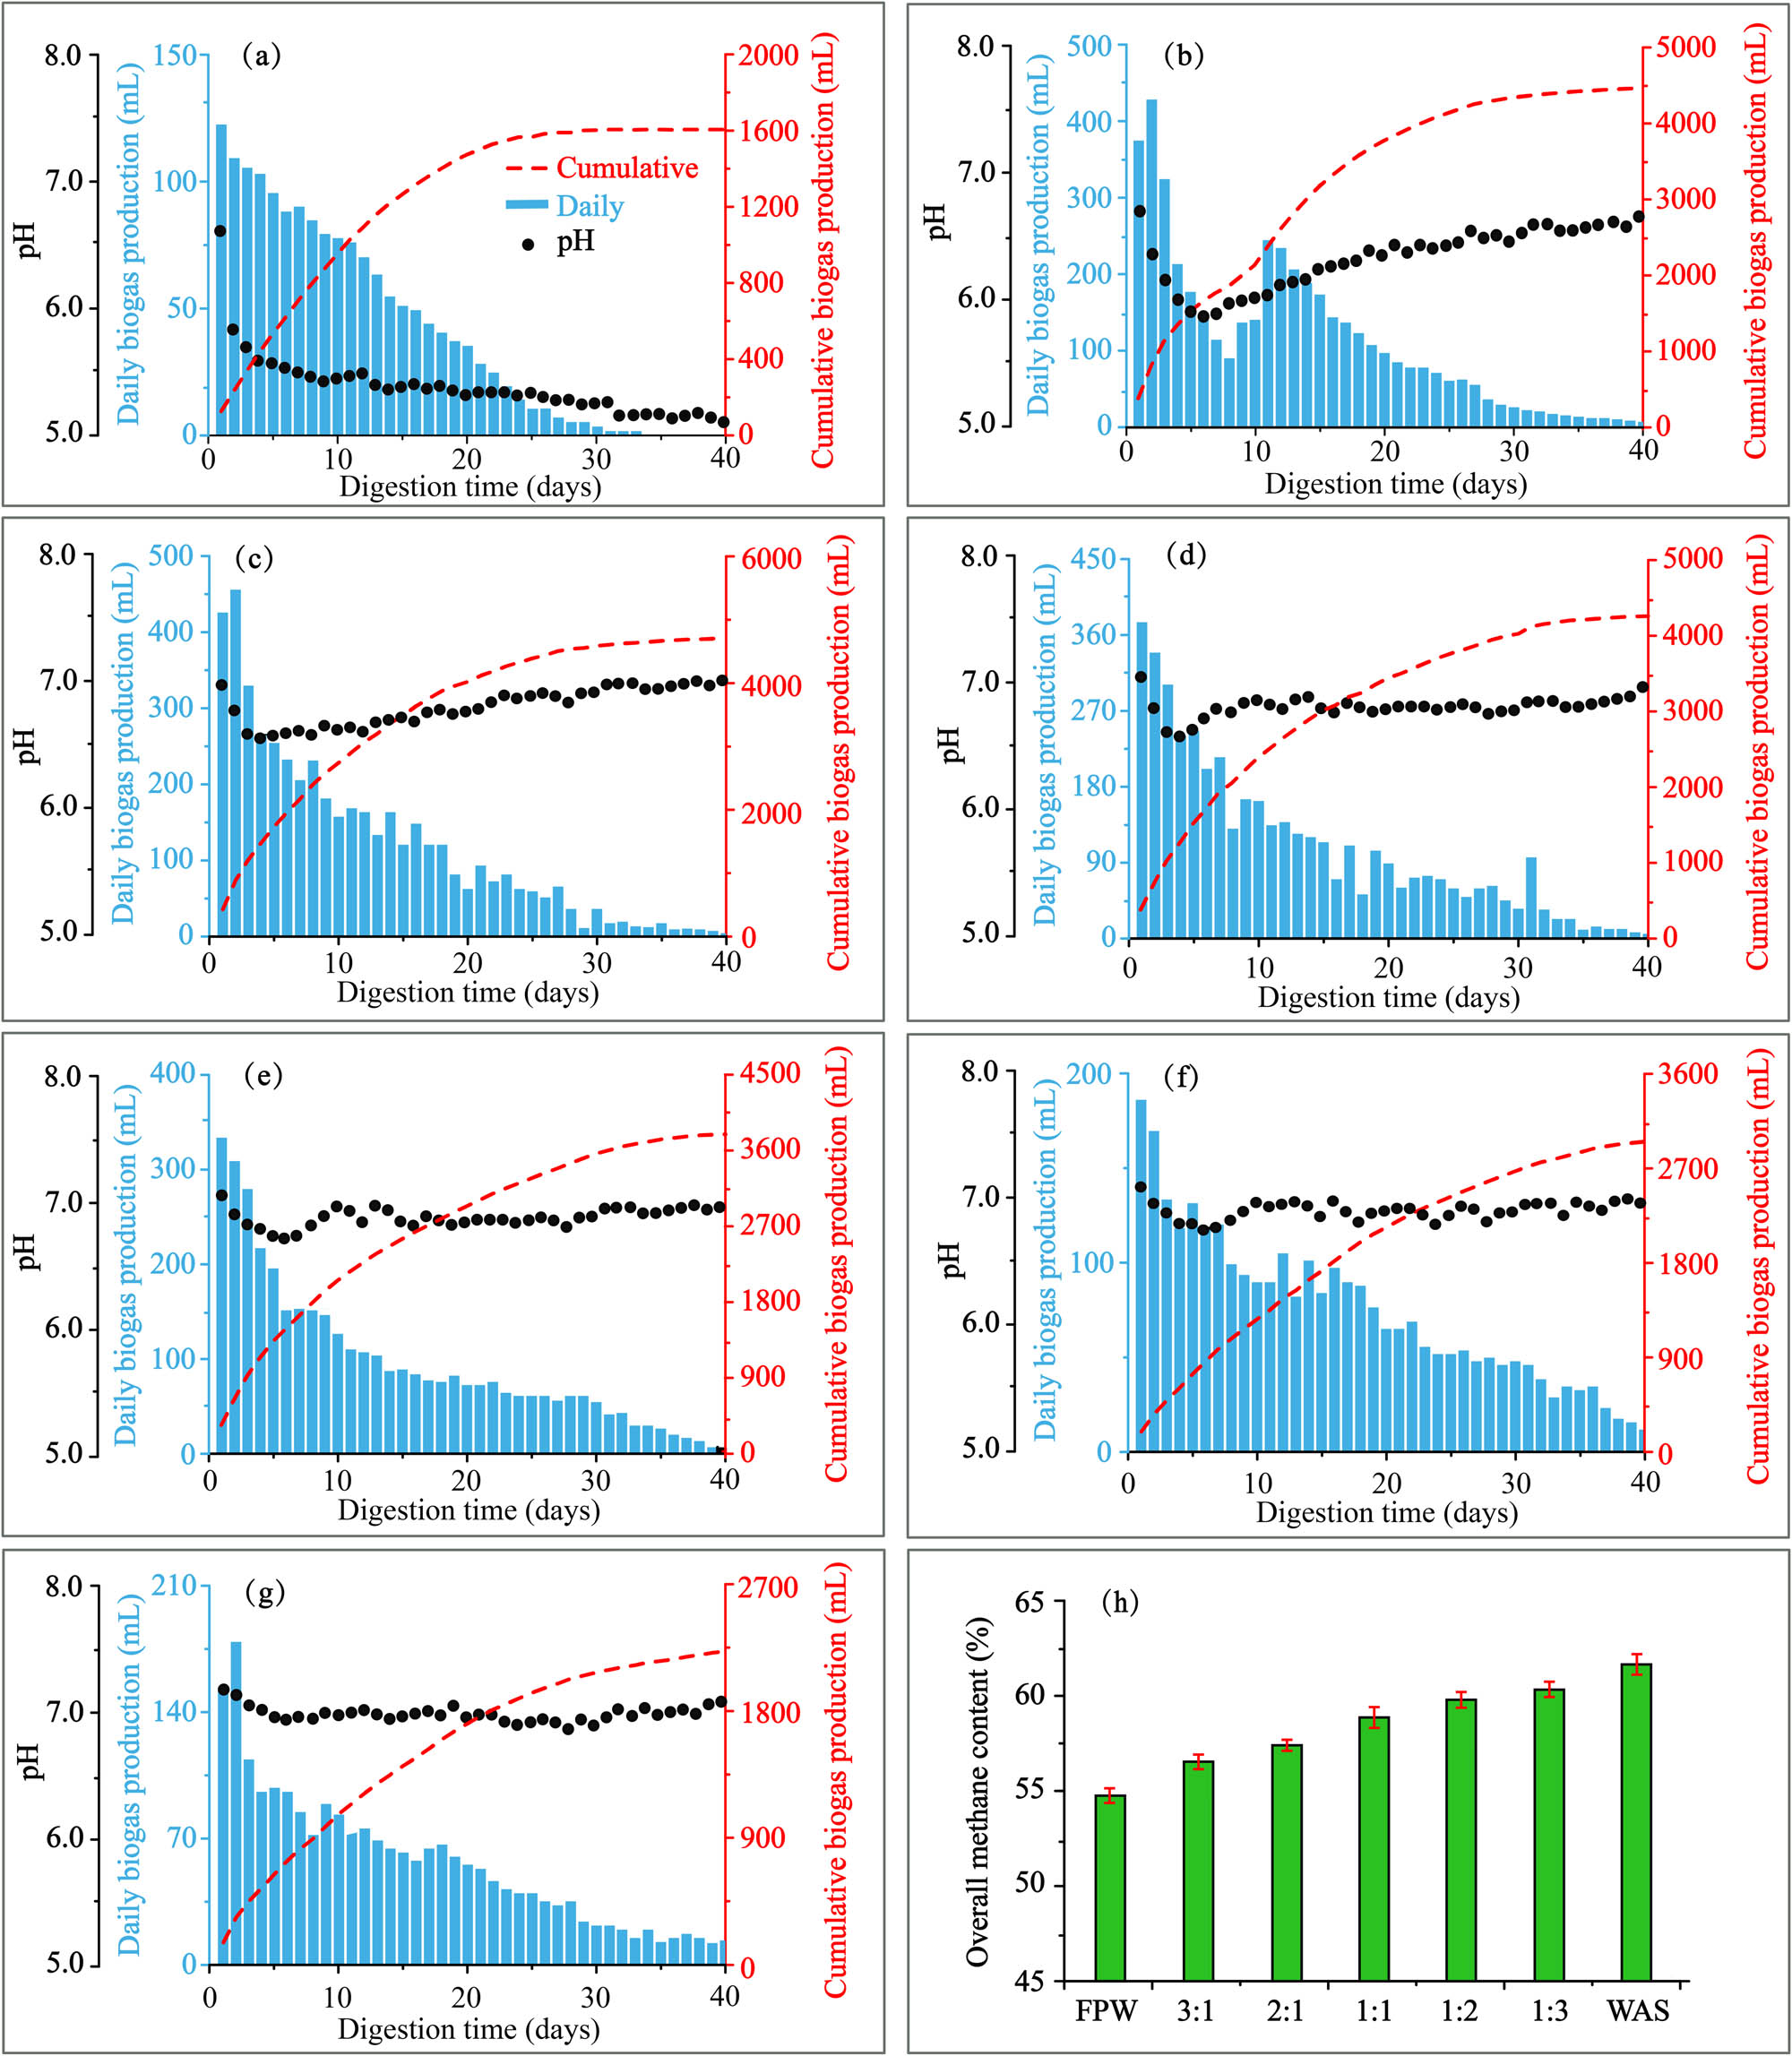
Daily and cumulative biogas production under different VS ratios: (a) FW1, (b)FW2, (c) FW3, (d) FW4, (e) FW5, (f) FW6, (g) FW7. (h) Overall methane content under different VS ratios.
With an increase in the proportion of WAS, the overall methane content gradually rose (Figure 2h). Raising the proportion of WAS improved the lipid and protein contents of the feed, including lipid (1,014 mL CH4·g VS−1), carbohydrate (415 mL CH4·g VS−1), and protein (496 mL CH4·g VS−1) contents, according to theoretical methane production (TMP) [36]. Hence, changes in the components of the feed will affect TMP and thus the overall methane content (Table 5).
Theoretical methane production with different VS ratios
| FW1 | FW2 | FW3 | FW4 | FW5 | FW6 | FW7 | |
|---|---|---|---|---|---|---|---|
| Formula |
|
||||||
| TMP | 3,406 | 3,505 | 3,542 | 3,606 | 3,671 | 3,707 | 3,806 |
3.1.2 Conversion efficiency of hydrolysis, acidogenesis, acetogenesis, and methanogenesis in anaerobic co-digestion
To analyze the rate-limiting step in the anaerobic co-digestion process, we calculated the conversion ratio of the four stages of hydrolysis, acidogenesis (VFA), acetogenesis (acetic acid, CO2, and H2), and methanogenesis [37]. The conversions were calculated from the initial and final COD values of anaerobic co-digestion at different VS ratios. As shown in Figure 3, as the proportion of sludge in the substrate increased, and the methane conversion ratio showed a trend of first increasing and then decreasing. For FW1, FW2, and FW3, apple content was higher, and apple is a substrate that is highly anaerobically digestible. Apples are rich in a variety of soluble sugars (fructose, sucrose, glucose, and sorbitol), which can be converted to pyruvate through the Embden–Meyerhof–Parnas pathway [38]. It is rich in a variety of organic acids, such as malic acid content of 29.4–32.2 mg·g−1 TS and citric acid content of 4.44-5.19 mg·g−1 TS, in addition to lactic acid, succinic acid, fumaric acid, oxalic acid, and other small-molecule organic acids, so that the initial concentration of organic acids in apple raw materials is relatively high. In addition, the macromolecular carbohydrates (pectin, cellulose, and hemicellulose), proteins, and fats contained in apples are also easily converted into small molecules such as monosaccharides, amino acids, and fatty acids, and finally into acetic acid, CO2, and H2, which can be used by methanogens. FW1 and FW2 rapidly accumulated a large amount of VFA during the early stage of fermentation, which inhibited the conversion of acetic acid and the production of methane so that VFA could not be converted into methane smoothly. The conversion rate of the four stages is hydrolysis > acidogenesis > acetogenesis > methanogenesis. The methane conversion ratio was the highest in FW3, and there was no inhibition of the methane conversion process.
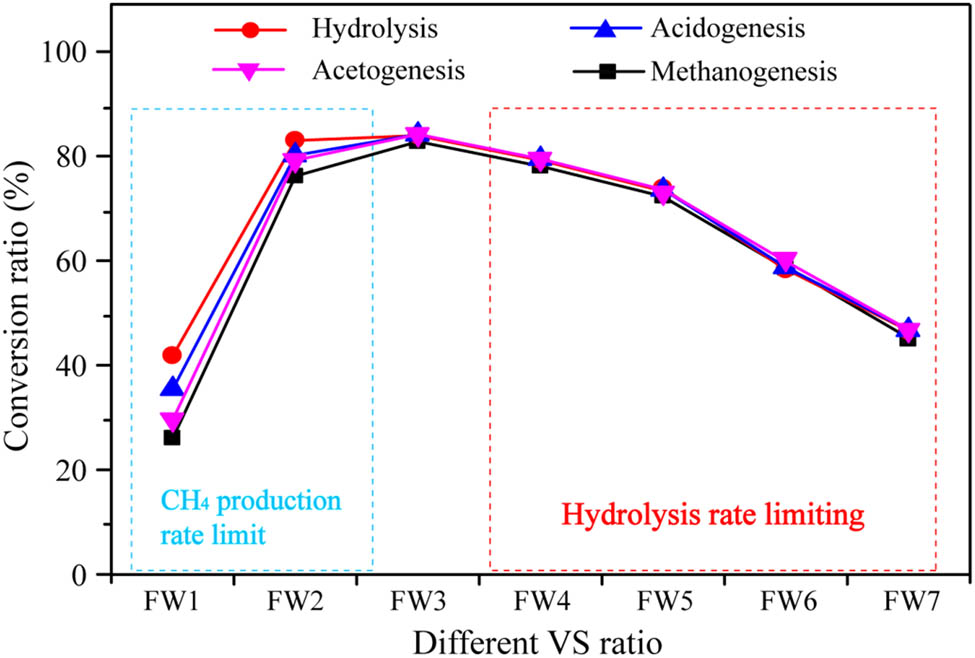
Hydrolysis, acidogenesis, acetogenesis, and methanogenesis conversion ratios under different VS ratio conditions.
On the other hand, in the fermentation process of FW3, FW4, FW5, FW6, and FW7, the organic matter produced by hydrolysis can quickly enter the stages of acid production and acetic acid production, and finally be converted into biogas. The conversion rates of the four stages are basically equal. In Figure 3, the hydrolysis conversion ratios in the system decreased with the decrease in apple feed components, and the influence of the hydrolysis process as the rate-limiting step became increasingly obvious. This is because WAS is a microbial matrix (floc) composed of microorganisms and exopolymers. These microbial-originated extracellular polymeric substances (EPS) are a complex mixture of biopolymers comprising polysaccharides, proteins, nucleic acids, uronic acids, humic substances, and lipids, amongst others [28]. It is well known that certain compounds in EPS are resistant to anaerobic digestion, resulting in hydrolysis as the rate-limiting step. Overall, when the VS ratio is 2:1, the problems of VFA accumulation and WAS hydrolysis rate-limiting can be alleviated at the same time.
3.1.3 Kinetics analysis
To further study the fermentation efficiency of different VS ratios, we chose FW2, FW3, and FW4 with higher cumulative biogas yields for kinetic simulation analysis. The results of the applied kinetic models are shown in Figure A1 (in the Appendix), while the calculated kinetic parameters are listed in Table 6. For FW2, FW3, and FW4, the correlation coefficients obtained by the Monod model are above 0.9914, 0.9992, and 0.9998, respectively. The correlation coefficients obtained by the first-order kinetic model were higher than 0.9901, 0.9991, and 0.9989, respectively. This indicates that the Monod model is best suited for FPW and WAS co-digestion of cumulative biogas production trends. The correlation coefficients of the two models of FW2 were lower, which was due to the slight fluctuation of the cumulative biogas curve due to acid suppression in the early stage of fermentation.
Kinetic parameters for anaerobic co-digestion of selected mixtures
| Model | Parameter | FW2 | FW3 | FW4 |
|---|---|---|---|---|
| Monod | B(t)-experimental (mL) | 4,339.13 | 4,578.89 | 4,015.12 |
| B(t)-predicted (mL) | 4,478.73 | 4,660.35 | 4,013.63 | |
| B max (mL) | 7,987.57 | 7,036.63 | 6,096.57 | |
| k (day−1) | 0.043 | 0.065 | 0.060 | |
| R 2 | 0.9914 | 0.9992 | 0.9998 | |
| First-order dynamics | B(t)-experimental (mL) | 4,339.13 | 4,578.52 | 4,015.89 |
| B(t)-predicted (mL) | 4,432.94 | 4,601.44 | 3,968.68 | |
| B max (mL) | 5,352.51 | 5,010.5 | 4,337.75 | |
| k (day−1) | 0.059 | 0.076 | 0.074 | |
| R 2 | 0.9901 | 0.9991 | 0.9989 |
The kinetic constant K is an important index to determine the operating efficiency of the anaerobic reactor, which reflects the speed of the co-digestion system. In both the Monod model and the first-order model, the K (0.065 and 0.076 day−1) of FW3 is the largest, indicating that the cumulative biogas production rate of FW3 is the fastest, which is consistent with the analysis in 3.1.2. The K (0.043 and 0.059 day−1) of FW2 was the smallest because the generated excess VFA inhibited the subsequent acetogenic and methanogenic stages and reduced the overall velocity of the reaction system. Similarly, the K (0.060 and 0.074 day−1) of FW4 is smaller than that of FW3, which is mainly due to the flocculation of sludge and the difficulty of cell wall degradation, which reduces the overall progress of the reaction system.
3.2 Continuous experiments
3.2.1 Continuous experiments performance
In order to further study the performance of continuous co-digestion for biogas production, the co-digestion of FPW and WAS was operated for 300 days over the five stages, and the biogas and methane production under different VS ratios (FPW:WAS) is illustrated in Figure 4. During the whole co-digestion process, as the OLR increased from 1.80 to 2.88 kg VS·m−3·day−1, the MPR rose from 0.6 to 0.89 L·L−1day−1, and biogas production increased from 1.16 to 1.48 L·L−1day−1. The methane yield is always above 300 mL·g−1, indicating that the continuous anaerobic fermentation process can achieve high-rate co-digestion with FPW and WAS. The pH was maintained between 6.76 and 7.29, and VFA/TA was below 0.16, indicating the reactor was always in a steady state.
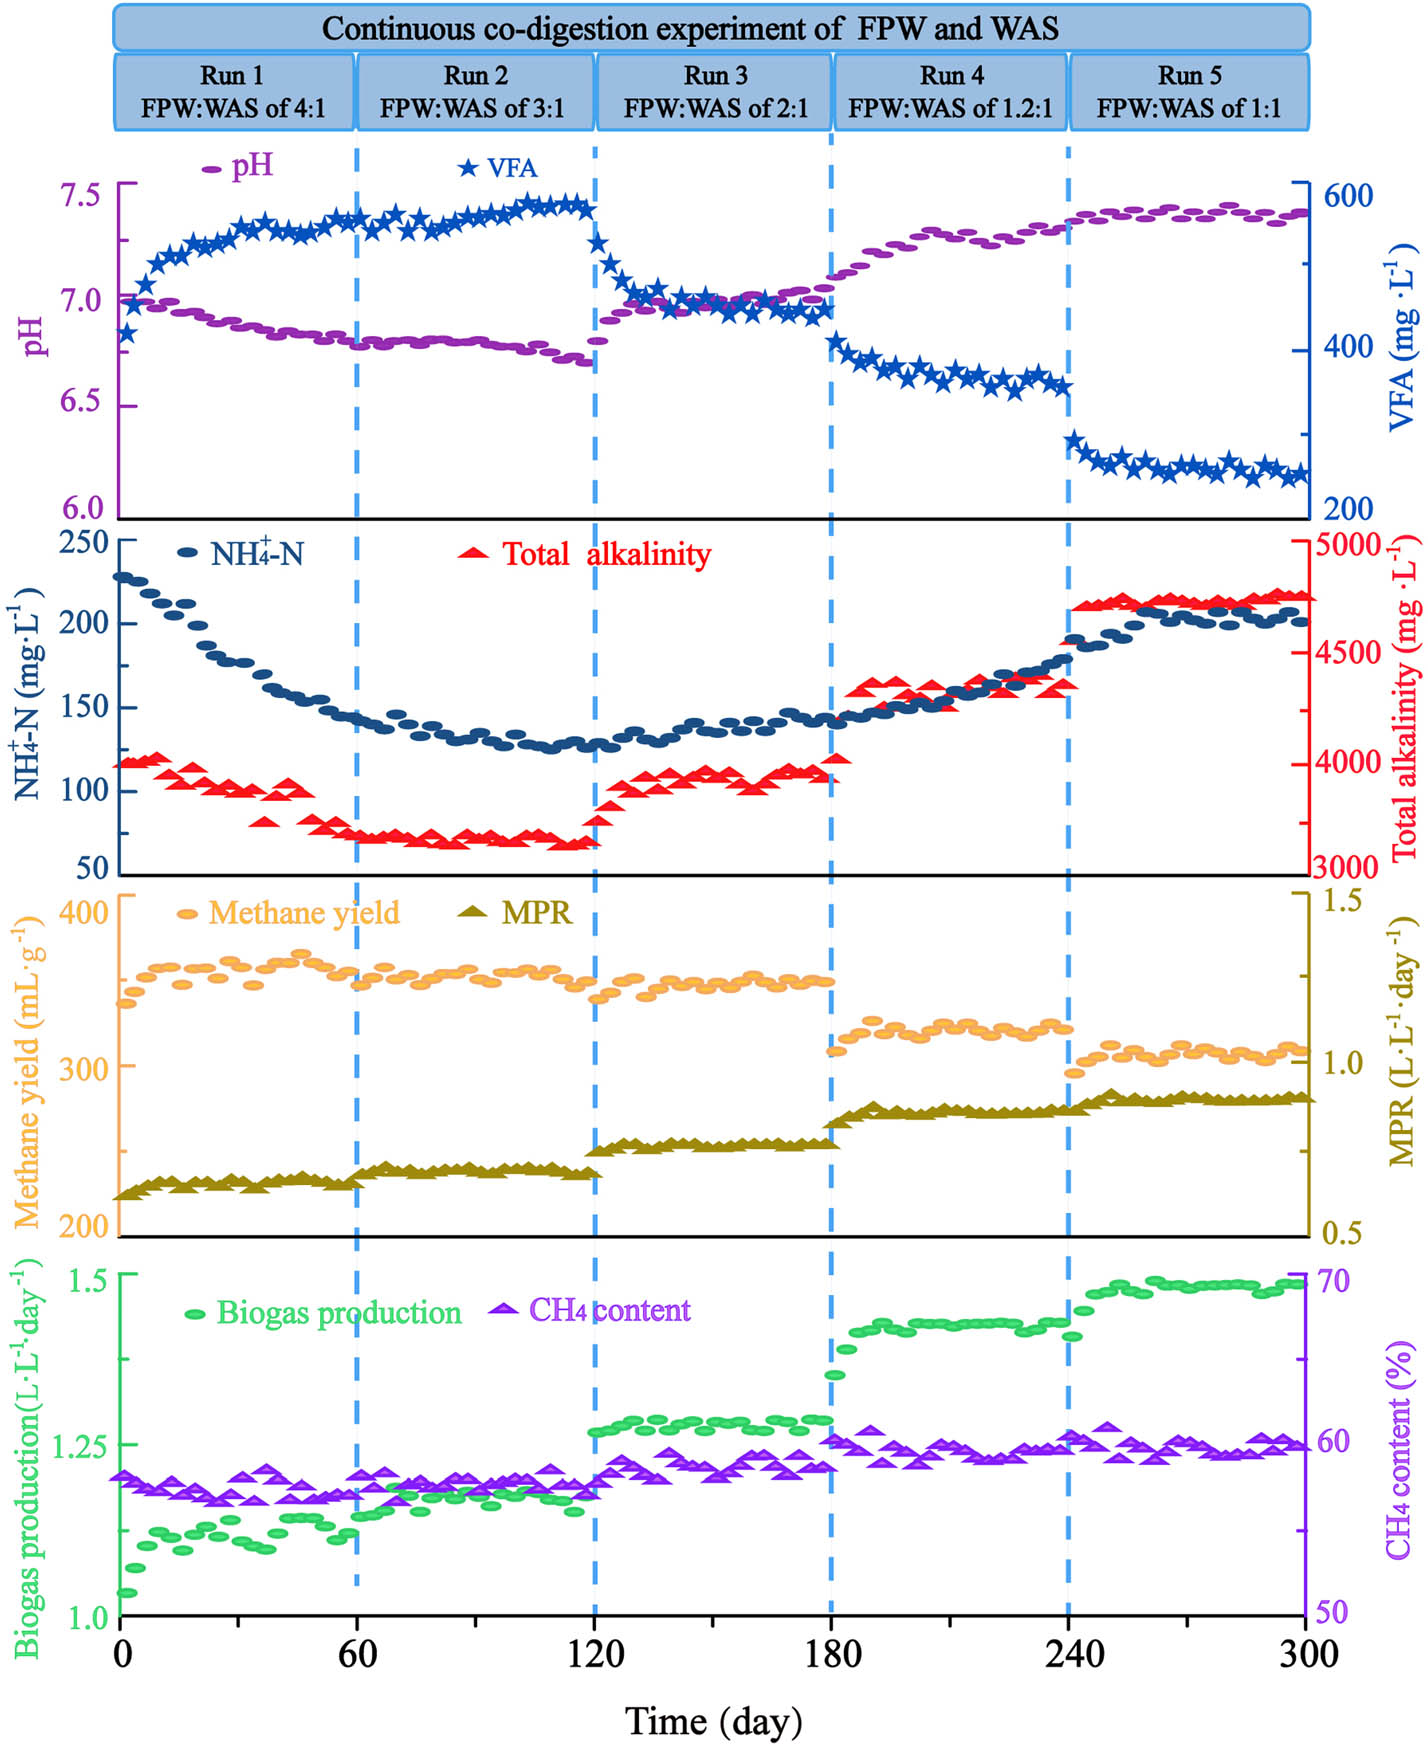
Changes in the pH, TA, VFA,
In Run 1, the average methane yield was 354.51 mL·g−1, but the pH and TA continued to decrease. This is because FPW is easily hydrolyzed organic matter, and the rate-limiting step of its anaerobic fermentation is methanation, so acid accumulation will occur and the TA consumption in the buffer system will be increased. This result is similar to the batch experiment. In Run 2, the average methane yield was 351.87 mL·g−1, and the downtrend of pH in the first 20 days was alleviated, but the downtrend of pH and TA in the reactor remained unchanged with the accumulation of VFA. Similarly, Fonoll [29] found the co-digestion experiment with apple waste and sewage sludge at a mass ratio of 30:70 (ww/ww, VS ratio of 3:1) was also showed the increase of VFA, a decrease of TA and methane production within the first 20 days, and the average methane yield was 260 mL·g−1. In particular, on the 60th and 120th days, the ammonia nitrogen concentration in the reaction system decreased from the initial 227.54–138.11 and 123.67 mg·L−1, respectively. The C/N ratio in the feed was 22.2 and 19.8, respectively, which met the C/N requirements in the general anaerobic fermentation process [39]. However, because WAS is not easily degraded, the consumption of ammonia nitrogen is less than the production, resulting in insufficient nitrogen source supplementation during the reaction.
In Run 3, the VFA was significantly reduced from 533.45 to 438.12 mg·L−1, the TA content increased from 3,755.67 to 3,958.32 mg·L−1, and no acid accumulation occurred. At this time, the average methane yield was 346.69 mL·g−1 and did not change significantly from the previous two stages, indicating that FPW and WAS maintained high hydrolysis efficiency. The ammonia nitrogen content increased from 123.67 to 138.34 mg·L−1, so the problem of nitrogen source consumption was solved. In Runs 4 and 5, as the addition of WAS further increased, the pH in the system rose to 7.37, and the buffering capacity was significantly improved, but the average methane yield decreased significantly to 310.21 and 299.07 mg·L−1 respectively. This is because although co-digestion of FPW and WAS can improve the hydrolysis efficiency of WAS, excessive WAS can reduce the hydrolysis efficiency.
During the whole fermentation process, the methane content increased slightly with a rise in the WAS proportion. This is because WAS is rich in proteins and fats, and the biogas produced by its decomposition contains a higher percentage of methane [39]. This result is the same as that of the batch experiment.
3.2.2 Microbial community dynamics
The species and abundance of bacteria have a close relationship with the hydrolytic and acidogenic capacity to degrade complex organic matter during CSTR digestion. Relative abundance (RA) and distribution of bacterial communities at 120, 180, and 240 days during continuous fermentation were analyzed at the phylum and genus levels. Four main phyla were selected (Figure 5a), including Firmicutes, Bacteroidetes, Proteobacteria, and Chloroflexi. The RA of Firmicutes increased in the whole digestion, which was 10.2%, 24.3%, and 31.9% at 120, 180, and 240 days, respectively. This phylum is one of the major hydrolytic bacteria that can decompose substrates into SCOD and especially degrade proteins and polysaccharides into soluble organic matter [40]. It helps to promote the hydrolysis of incremental sludge in the feed. Bacteroidetes can degrade complex compounds such as celluloses and hemicelluloses and convert them into glucose and organic acids and further to VFAs [41]. On the 180th day, the RA of Bacteroidetes increased to 21.3%, which helped to improve the hydrolysis efficiency of long-chain compounds. Proteobacteria and Chloroflexi are commonly found in the decomposition reaction of monosaccharides, polysaccharides, and small-molecular compounds to form acetic acids [42]. With the increase in WAS content, the proportion of carbohydrates in the substrate, and the RA of Proteobacteria and Chloroflex all decreased, which are also consistent with the gradual decrease in VFAs.
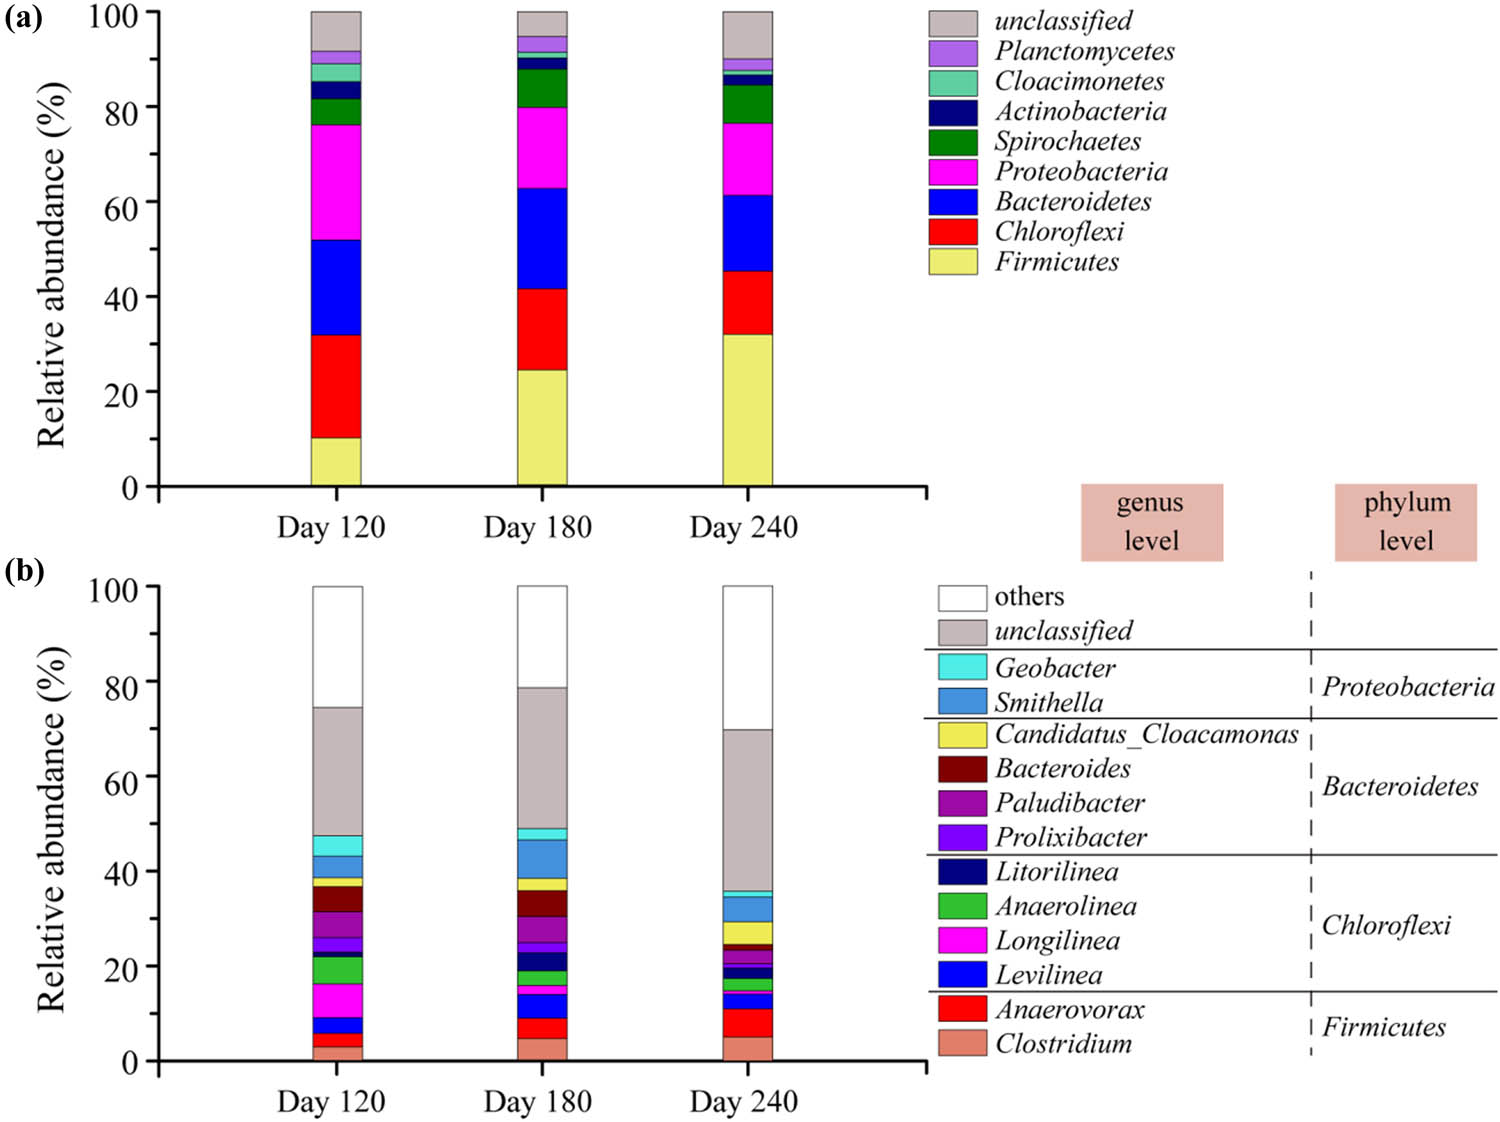
The RA of bacteria communities at (a) the phylum and (b) genus levels.
The reasons for the changes in hydrolysis efficiency under different VS ratio can also be explained by analyzing the changes in microbial community structure at the genus level. On the 180th day, the RAs of Bacteroides, Paludibacter, Litorilinea, Levilinea, and Smithella reached 5.4%, 5.4%, 5.0%, 7.9%, and 3.8%, respectively (Figure 5b), which were higher than those on Day 120 and Day 240. Among them, Bacteroides and Paludibacter are carbohydrate-fermenting bacteria that promote the utilization of carbon sources such as cellulose and hemicellulose during hydrolysis and acidification [43]. Litolinea can utilize proteins to facilitate WAS hydrolysis. The monosaccharides from the hydrolysis of carbohydrates, peptides, and amino acids from the decomposition of protein can be decomposed into volatile organic acids by Levilinea [44]. At last, Smithella can degrade butyrate and propionate and maintain the stability of the acetogenic methanogenesis reaction [45]. The enrichment of the above-mentioned bacterial groups is conducive to the simultaneous hydrolysis and acidification of carbohydrates, proteins, and other substrates, which can accelerate the feed hydrolysis rate and reduce the impact of organic acids in an anaerobic system.
4 Conclusions
This study focused on the biogas production potential of acidic FPW and WAS co-digestion. FPW was rich in various organic acids and had high acidity. The pH of a single fermentation reached 5.16, which greatly inhibited the activity of methanogens, and the cumulative biogas production was only 1,602.41 mL. The acidification of FPW digestion could be solved by co-digestion with WAS. When the VS ratio of FPW and WAS was 2:1, the buffer capacity of the batch fermentation system was improved, and the highest cumulative biogas yield was 4,695.47 mL. Similarly, the continuous co-digestion process is the most stable when the VS ratio was 2:1, without VFA accumulation as in Run 1 and Run 2, and ammonia nitrogen concentration decreased in the system. The average methane yield reached 346.69 mL·g−1. Compared with the batch fermentation system, continuous fermentation system handle more organic load per day, and it has better adaptability and stability to organic load changes. The enrichment of Bacteroides, Paludibacter, Litorilinea, Levilinea, and Smithella was beneficial to improve the hydrolysis rate of the substrate and reduced the impact of organic acids in the anaerobic system.
-
Funding information: This work was supported by the Shaanxi Provincial Land Engineering Construction Group Research Project (no. DJNY2021-23, 2022-27, 2022-34) and the Xi’an Science and Technology Plan Project (no. 20193050YF038 NS038).
-
Author contributions: Lulu Zhang: writing – original draft, writing – review and editing, methodology, formal analysis; Biao Peng: writing – original draft; Luyao Wang: writing – review and editing, formal analysis; Qingyi Wang: writing – original draft, writing – review and editing, conceptualization.
-
Conflict of interest: Author Lulu Zhang is employed by Shaanxi Provincial Land Engineering Construction Group Co., Ltd. The remaining authors declare that the research was conducted in the absence of any commercial or financial relationships that could be construed as a potential conflict of interest.
Appendix
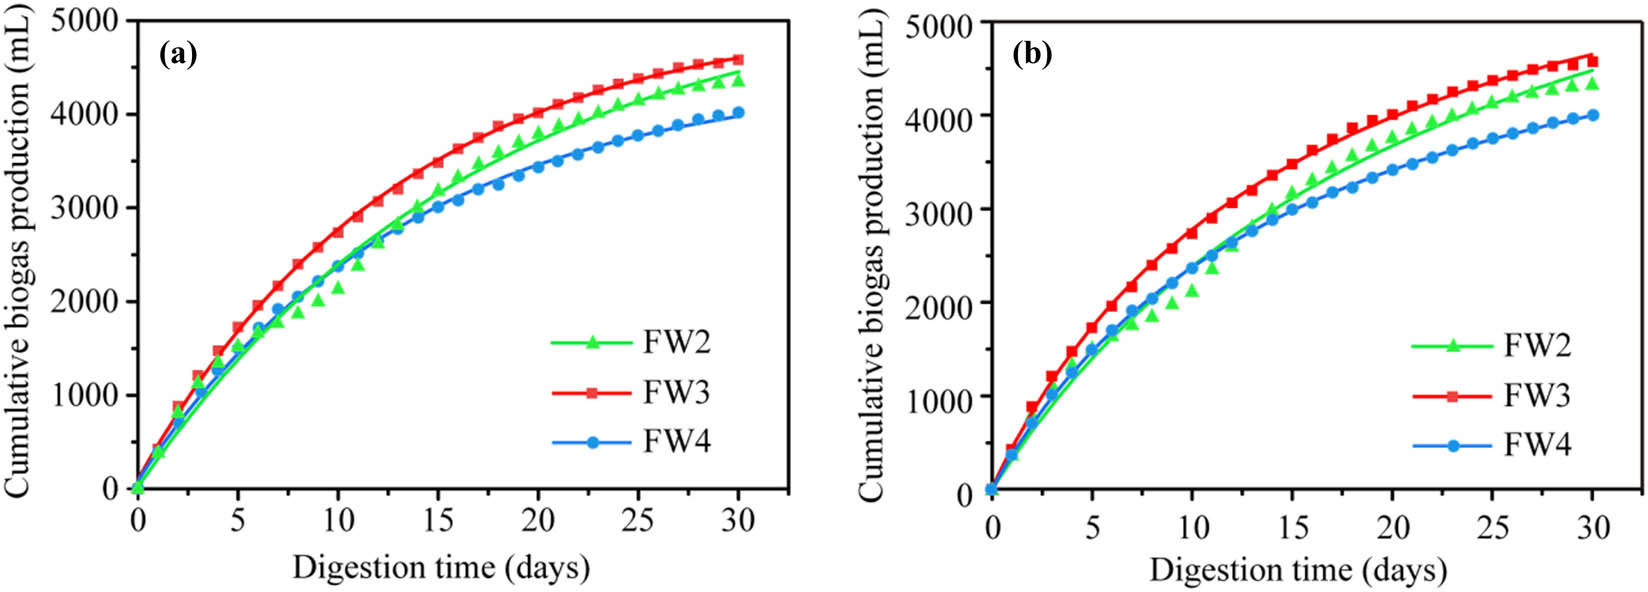
Anaerobic co-digestion kinetics analysis for (a) Monod and (b) first-order dynamics models.
References
[1] Zhu DS, Shen YS, Wei LW, Xu LX, Cao XH, Liu H, et al. Effect of particle size on the stability and flavor of cloudy apple juice. Food Chem. 2020;328(30):126967–81. 10.1016/j.foodchem.2020.126967.Suche in Google Scholar PubMed
[2] Paini J, Benedetti V, Menin L, Baratieri M, Patuzzi F. Subcritical water hydrolysis coupled with hydrothermal carbonization for apple pomace integrated cascade valorization. Bioresour Technol. 2021;342:125956–64. 10.1016/j.biortech.2021.125956.Suche in Google Scholar PubMed
[3] Wang HX, Hu ZQ, Long FY, Chen N. Characterization of osmotolerant yeasts and yeast-like molds from apple orchards and apple juice processing plants in China and investigation of their spoilage potential. J Food Sci. 2015;80(8):1850–60. 10.1111/1750-3841.12946.Suche in Google Scholar PubMed
[4] Hala EK, Ahmed T, Mohamed M, Hisham AH. Treatment of high strength wastewater from fruit juice industry using integrated anaerobic/aerobic system. Desalination. 2010;253(1–3):158–63. 10.1016/j.desal.2009.11.013.Suche in Google Scholar
[5] Amor C, Lucas MS, Pirra AJ, Peres JA. Treatment of concentrated fruit juice wastewater by the combination of biological and chemical processes. J Env Sci Heal A. 2012;47(12):1809–17. 10.1080/10934529.2012.689244.Suche in Google Scholar PubMed
[6] He JG, Li L, Zhang J, Wu XW, Li BQ, Tang X. Medium chain fatty acids production from simple substrate and waste activated sludge with ethanol as the electron donor. Chemosphere. 2021;283:131278–83. 10.1016/j.chemosphere.2021.131278.Suche in Google Scholar PubMed
[7] Lian TJ, Zhang WQ, Cao QT, Wang SL, Yin FB, Chen YX, et al. Optimization of lactate production from co-fermentation of swine manure with apple waste and dynamics of microbial communities. Bioresour Technol. 2021;336:125307–15. 10.1016/j.biortech.2021.125307.Suche in Google Scholar PubMed
[8] Edwiges T, Frare L, Mayer B, Lins L, Triolo MJ, Flotats X. Influence of chemical composition on biochemical methane potential of fruit and vegetable waste. Waste Manage. 2018;71:618–25. 10.1016/j.wasman.2017.05.030.Suche in Google Scholar PubMed
[9] Cruz MG, Bastos R, Pinto M, Ferreira JM, Santos JF, Wessel DF, et al. Waste mitigation: from an effluent of apple juice concentrate industry to a valuable ingredient for food and feed applications. J Clean Prod. 2018;193(20):652–60. 10.1016/j.jclepro.2018.05.109.Suche in Google Scholar
[10] O’Shea N, Arendt EK, Gallagher E. Dietary fibre and phytochemical characteristics of fruit and vegetable by-products and their recent applications as novel ingredients in food products. Innov Food Sci Emerg. 2012;16:1–10. 10.1016/j.ifset.2012.06.002.Suche in Google Scholar
[11] Chen MR, Lahaye M. Natural deep eutectic solvents pretreatment as an aid for pectin extraction from apple pomace. Food Hydrocolloid. 2021;115:106601–11. 10.1016/j.foodhyd.2021.106601.Suche in Google Scholar
[12] Neckebroeck B, Verkempinck SHE, Audenhove JV, Bernaerts T, d’Estmael H, Hendrickx ME, et al. Structural and emulsion stabilizing properties of pectin rich extracts obtained from different botanical sources. Food Res Int. 2021;141:110087–97. 10.1016/j.foodres.2020.110087.Suche in Google Scholar PubMed
[13] Muñoz-Pina S, Ros-Lis JV, Argüelles Á, Martínez-Máñez R, Andrés A. Influence of the functionalisation of mesoporous silica material UVM-7 on polyphenol oxidase enzyme capture and enzymatic browning. Food Chem. 2019;310:125741–48. 10.1016/j.foodchem.2019.125741.Suche in Google Scholar PubMed
[14] Massias A, Boisard S, Baccaunaud M, Calderon FL, Subra-Paternault P. Recovery of phenolics from apple peels using CO2 + ethanol extraction: kinetics and antioxidant activity of extracts. J Supercrit Fluid. 2015;98:172–82. 10.1016/j.supflu.2014.12.007.Suche in Google Scholar
[15] Choi HJ. Assessment of sludge reduction and biogas potential from anaerobic co-digestion using an acidogenically fermented fishery byproduct with various agricultural wastes. Water Air Soil Poll. 2020;231:336–47. 10.1007/s11270-020-04720-w.Suche in Google Scholar
[16] Liu Y, Ran CM, Siyal AA, Song YM, Jiang ZH, Dai JJ, et al. Comparative study for fluidized bed pyrolysis of textile dyeing sludge and municipal sewage sludge. J Hazard Mater. 2020;396:122619. 10.1016/j.jhazmat.2020.122619.Suche in Google Scholar PubMed
[17] Xu Y, Wu YJ, Zhang XD, Chen G. Effects of freeze-thaw and chemical preconditioning on the consolidation properties and microstructure of landfill sludge. Water Res. 2021;200:117249–59. 10.1016/j.watres.2021.117249.Suche in Google Scholar PubMed
[18] Wang ZF, Ma TL, Xing LZ. Process performance and microbial interaction in two-stage continuously stirred tank reactors for sludge anaerobic digestion operated at different temperatures. Biochem Eng J. 2020;161:107682. 10.1016/j.bej.2020.107682.Suche in Google Scholar
[19] Liu HD, Xu GR, Li GB. Autocatalytic sludge pyrolysis by biochar derived from pharmaceutical sludge for biogas upgrading. Energy. 2021;229:120802–9. 10.1016/j.energy.2021.120802.Suche in Google Scholar
[20] Liu XR, Wu YX, Xu QX, Du MT, Wang DB, Yang Q, et al. Mechanistic insights into the effect of poly ferric sulfate on anaerobic digestion of waste activated sludge. Water Res. 2021;189:116645–56. 10.1016/j.watres.2020.116645.Suche in Google Scholar PubMed
[21] Xue SR, Wang YB, Lyu XG, Zhao N, Song JH, Wang XJ, et al. Interactive effects of carbohydrate, lipid, protein composition and carbon/nitrogen ratio on biogas production of different food wastes. Bioresour Technol. 2020;312:123566–78. 10.1016/j.biortech.2020.123566.Suche in Google Scholar PubMed
[22] Ali S, Hua B, Huang JJ, Droste RL, Zhou Q, Zhao WX, et al. Effect of different initial low pH conditions on biogas production, composition, and shift in the aceticlastic methanogenic population. Bioresour Technol. 2019;289:121579–85. 10.1016/j.biortech.2019.121579.Suche in Google Scholar PubMed
[23] Algapani DE, Wei Q, Su M, Pumpo FD, Wandera SM, Adani F, et al. Bio-hydrolysis and bio-hydrogen production from food waste by thermophilic and hyperthermophilic anaerobic process. Bioresour Technol. 2016;216:768–77. 10.1016/j.biortech.2016.06.016.Suche in Google Scholar PubMed
[24] Wu LJ, Li XX, Liu YX, Yang F, Zhou Q, Ren RP. Optimization of hydrothermal pretreatment conditions for mesophilic and thermophilic anaerobic digestion of high-solid sludge. Bioresour Technol. 2021;321:124454–63. 10.1016/j.biortech.2020.124454.Suche in Google Scholar PubMed
[25] Tong J, Lu XT, Zhang JY, Angelidaki I, Wei YS. Factors influencing the fate of antibiotic resistance genes during thermochemical pretreatment and anaerobic digestion of pharmaceutical waste sludge. Env Pollut. 2018;243:1403–13. 10.1016/j.envpol.2018.09.096.Suche in Google Scholar PubMed
[26] Elalami D, Monlau F, Carrere H, Abdelouahdi K, Oukarroum A, Zeroual Y, et al. Effect of coupling alkaline pretreatment and sewage sludge co-digestion on methane production and fertilizer potential of digestate. Sci Total Env. 2020;743:140670–89. 10.1016/j.scitotenv.2020.140670.Suche in Google Scholar PubMed
[27] He DD, Xiao JX, Wang DD. Digestion liquid based alkaline pretreatment of waste activated sludge promotes methane production from anaerobic digestion. Water Res. 2021;199:117198–206. 10.1016/j.watres.2021.117198.Suche in Google Scholar PubMed
[28] Carrère H, Dumas C, Battimelli A, Batstone DJ, Delgenès JP, Steyer JP. Pretreatment methods to improve sludge anaerobic degradability: a review. J Hazard Mater. 2010;183(1–3):1–15. 10.1016/j.jhazmat.2010.06.129.Suche in Google Scholar PubMed
[29] Fonoll X, Astals S, Dosta J, Mata-Alvarez J. Anaerobic co-digestion of sewage sludge and fruit wastes: evaluation of the transitory states when the co-substrate is changed. Chem Eng J. 2015;262:1268–74. 10.1016/j.cej.2014.10.0451385-8947.Suche in Google Scholar
[30] Lützhøft HH, Boe K, Fang C, Angelidaki I. Comparison of VFA titration procedures used for monitoring the biogas process. Water Res. 2014;54:262–72. 10.1016/j.watres.2014.02.001.Suche in Google Scholar PubMed
[31] DuBois M, Gilles KA, Hamilton JK, Rebers PA, Smith F. Colorimetric method for determination of sugars and related substances. Anal Chem. 1956;28(3):350–6. 10.1021/ac60111a017.Suche in Google Scholar
[32] Li Q, Li H, Wang GJ, Wang XC. Effects of loading rate and temperature on anaerobic co-digestion of food waste and waste activated sludge in a high frequency feeding system, looking in particular at stability and efficiency. Bioresour Technol. 2017;237:231–9. 10.1016/j.biortech.2017.02.045.Suche in Google Scholar PubMed
[33] Koch K, Lippert T, Drewes JE. The Role of Inoculum’s Origin on the methane yield of different substrates in biochemical methane potential (BMP) tests. Bioresour Technol. 2017;243:457–63. 10.1016/j.biortech.2017.06.142.Suche in Google Scholar PubMed
[34] Guo H, Oosterkamp MJ, Tonin F, Hendriks A, Kreuk MD. Reconsidering hydrolysis kinetics for anaerobic digestion of waste activated sludge applying cascade reactors with ultra-short residence times. Water Res. 2021;202:117398–117408. 10.1016/j.watres.2021.117398.Suche in Google Scholar PubMed
[35] Bai YH, Qi WX, Liang JS, Qu JH. Using high-throughput sequencing to assess the impacts of treated and untreated wastewater discharge on prokaryotic communities in an urban river. Appl Microbiol Biot. 2014;98:1841–51. 10.1007/s00253-013-5116-2.Suche in Google Scholar PubMed
[36] Xue S, Zhao N, Song JH, Wang XJ. Interactive effects of chemical composition of food waste during anaerobic co-digestion under thermophilic temperature. Sustainability. 2019;11:2933–47. 10.3390/su11102933.Suche in Google Scholar
[37] Yuan YY, Hu XY, Chen HB, Zhou YY, Zhou YF, Wang DB. Advances in enhanced volatile fatty acid production fromanaerobic fermentation of waste activated sludge. Sci Total Env. 2019;694:133741–52. 10.1016/j.scitotenv.2019.133741.Suche in Google Scholar PubMed
[38] Sakuraba H, Ohshima T. Novel energy metabolism in anaerobic hyperthermophilic archaea: A modified embden-meyerhof pathway. J Biosci Bioeng. 2002;93(5):441–8. 10.1016/S1389-1723(02)80090-1.Suche in Google Scholar PubMed
[39] Khalid A, Arshad M, Anjum M, Mahmood T, Dawson L. The anaerobic digestion of solid organic waste. Waste Manage. 2011;31(8):1737–44. 10.1016/j.wasman.2011.03.021.Suche in Google Scholar PubMed
[40] Xing BS, Wang XC. High-rate mesophilic co-digestion with food waste and waste activated sludge through a low-magnitude increasing loading regime: performance and microorganism characteristics. Sci Total Env. 2021;777:146210–9. 10.1016/j.scitotenv.2021.146210.Suche in Google Scholar
[41] Panichnumsin P, Ahring B, Nopharatana A. Microbial community structure and performance of ananaerobic reactor digesting cassava pulp and pig manure. Water Sci Technol. 2012;66(7):1590–600. 10.2166/wst.2012.358.Suche in Google Scholar PubMed
[42] Sun R, Xing DF, Jia JN, Zhou AJ, Zhang L, Ren NQ. Methane production and microbial community structure for alkaline pretreated waste activated sludge. Bioresour Technol. 2014;169:496–501. 10.1016/j.biortech.2014.07.032.Suche in Google Scholar PubMed
[43] Ueki A, Akasaka H, Suzuki D, Ueki K. Paludibacter propionicigenes gen. nov., sp. nov., a novel strictly anaerobic, Gram-negative, propionate-producing bacterium isolated from plant residue in irrigated rice-field soil in Japan. Int J Syst Evol Micr. 2006;56:39–44. 10.1099/ijs.0.63896-0.Suche in Google Scholar PubMed
[44] Yamada T, Sekiguchi Y, Hanada S, Imachi H, Ohashi A, Harada H, et al. Anaerolinea thermolimosa sp. nov., Levilinea saccharolytica gen. nov., sp. nov. and Leptolinea tardivitalis gen. nov., sp. nov., novel filamentous anaerobes, and description of the new classes Anaerolineae classis nov. and Caldilineae classis nov. in the baccterial phylum Chloroflexi. Int J Syst Evol Micr. 2006;56:1331–40. 10.1099/ijs.0.64169-0.Suche in Google Scholar PubMed
[45] Stams AJM, Sousa DZ, Kleerebezem R, Plugge CM. Role of syntrophic microbial communities in high-rate methanogenic bioreactors. Water Sci Technol. 2012;66(2):352–62. 10.2166/wst.2012.192.Suche in Google Scholar PubMed
© 2022 Lulu Zhang et al., published by De Gruyter
This work is licensed under the Creative Commons Attribution 4.0 International License.
Artikel in diesem Heft
- Research Articles
- Kinetic study on the reaction between Incoloy 825 alloy and low-fluoride slag for electroslag remelting
- Black pepper (Piper nigrum) fruit-based gold nanoparticles (BP-AuNPs): Synthesis, characterization, biological activities, and catalytic applications – A green approach
- Protective role of foliar application of green-synthesized silver nanoparticles against wheat stripe rust disease caused by Puccinia striiformis
- Effects of nitrogen and phosphorus on Microcystis aeruginosa growth and microcystin production
- Efficient degradation of methyl orange and methylene blue in aqueous solution using a novel Fenton-like catalyst of CuCo-ZIFs
- Synthesis of biological base oils by a green process
- Efficient pilot-scale synthesis of the key cefonicid intermediate at room temperature
- Synthesis and characterization of noble metal/metal oxide nanoparticles and their potential antidiabetic effect on biochemical parameters and wound healing
- Regioselectivity in the reaction of 5-amino-3-anilino-1H-pyrazole-4-carbonitrile with cinnamonitriles and enaminones: Synthesis of functionally substituted pyrazolo[1,5-a]pyrimidine derivatives
- A numerical study on the in-nozzle cavitating flow and near-field atomization of cylindrical, V-type, and Y-type intersecting hole nozzles using the LES-VOF method
- Synthesis and characterization of Ce-doped TiO2 nanoparticles and their enhanced anticancer activity in Y79 retinoblastoma cancer cells
- Aspects of the physiochemical properties of SARS-CoV-2 to prevent S-protein receptor binding using Arabic gum
- Sonochemical synthesis of protein microcapsules loaded with traditional Chinese herb extracts
- MW-assisted hydrolysis of phosphinates in the presence of PTSA as the catalyst, and as a MW absorber
- Fabrication of silicotungstic acid immobilized on Ce-based MOF and embedded in Zr-based MOF matrix for green fatty acid esterification
- Superior photocatalytic degradation performance for gaseous toluene by 3D g-C3N4-reduced graphene oxide gels
- Catalytic performance of Na/Ca-based fluxes for coal char gasification
- Slow pyrolysis of waste navel orange peels with metal oxide catalysts to produce high-grade bio-oil
- Development and butyrylcholinesterase/monoamine oxidase inhibition potential of PVA-Berberis lycium nanofibers
- Influence of biosynthesized silver nanoparticles using red alga Corallina elongata on broiler chicks’ performance
- Green synthesis, characterization, cytotoxicity, and antimicrobial activity of iron oxide nanoparticles using Nigella sativa seed extract
- Vitamin supplements enhance Spirulina platensis biomass and phytochemical contents
- Malachite green dye removal using ceramsite-supported nanoscale zero-valent iron in a fixed-bed reactor
- Green synthesis of manganese-doped superparamagnetic iron oxide nanoparticles for the effective removal of Pb(ii) from aqueous solutions
- Desalination technology for energy-efficient and low-cost water production: A bibliometric analysis
- Biological fabrication of zinc oxide nanoparticles from Nepeta cataria potentially produces apoptosis through inhibition of proliferative markers in ovarian cancer
- Effect of stabilizers on Mn ZnSe quantum dots synthesized by using green method
- Calcium oxide addition and ultrasonic pretreatment-assisted hydrothermal carbonization of granatum for adsorption of lead
- Fe3O4@SiO2 nanoflakes synthesized using biogenic silica from Salacca zalacca leaf ash and the mechanistic insight into adsorption and photocatalytic wet peroxidation of dye
- Facile route of synthesis of silver nanoparticles templated bacterial cellulose, characterization, and its antibacterial application
- Synergistic in vitro anticancer actions of decorated selenium nanoparticles with fucoidan/Reishi extract against colorectal adenocarcinoma cells
- Preparation of the micro-size flake silver powders by using a micro-jet reactor
- Effect of direct coal liquefaction residue on the properties of fine blue-coke-based activated coke
- Integration of microwave co-torrefaction with helical lift for pellet fuel production
- Cytotoxicity of green-synthesized silver nanoparticles by Adansonia digitata fruit extract against HTC116 and SW480 human colon cancer cell lines
- Optimization of biochar preparation process and carbon sequestration effect of pruned wolfberry branches
- Anticancer potential of biogenic silver nanoparticles using the stem extract of Commiphora gileadensis against human colon cancer cells
- Fabrication and characterization of lysine hydrochloride Cu(ii) complexes and their potential for bombing bacterial resistance
- First report of biocellulose production by an indigenous yeast, Pichia kudriavzevii USM-YBP2
- Biosynthesis and characterization of silver nanoparticles prepared using seeds of Sisymbrium irio and evaluation of their antifungal and cytotoxic activities
- Synthesis, characterization, and photocatalysis of a rare-earth cerium/silver/zinc oxide inorganic nanocomposite
- Developing a plastic cycle toward circular economy practice
- Fabrication of CsPb1−xMnxBr3−2xCl2x (x = 0–0.5) quantum dots for near UV photodetector application
- Anti-colon cancer activities of green-synthesized Moringa oleifera–AgNPs against human colon cancer cells
- Phosphorus removal from aqueous solution by adsorption using wetland-based biochar: Batch experiment
- A low-cost and eco-friendly fabrication of an MCDI-utilized PVA/SSA/GA cation exchange membrane
- Synthesis, microstructure, and phase transition characteristics of Gd/Nd-doped nano VO2 powders
- Biomediated synthesis of ZnO quantum dots decorated attapulgite nanocomposites for improved antibacterial properties
- Preparation of metal–organic frameworks by microwave-assisted ball milling for the removal of CR from wastewater
- A green approach in the biological base oil process
- A cost-effective and eco-friendly biosorption technology for complete removal of nickel ions from an aqueous solution: Optimization of process variables
- Protective role of Spirulina platensis liquid extract against salinity stress effects on Triticum aestivum L.
- Comprehensive physical and chemical characterization highlights the uniqueness of enzymatic gelatin in terms of surface properties
- Effectiveness of different accelerated green synthesis methods in zinc oxide nanoparticles using red pepper extract: Synthesis and characterization
- Blueprinting morpho-anatomical episodes via green silver nanoparticles foliation
- A numerical study on the effects of bowl and nozzle geometry on performances of an engine fueled with diesel or bio-diesel fuels
- Liquid-phase hydrogenation of carbon tetrachloride catalyzed by three-dimensional graphene-supported palladium catalyst
- The catalytic performance of acid-modified Hβ molecular sieves for environmentally friendly acylation of 2-methylnaphthalene
- A study of the precipitation of cerium oxide synthesized from rare earth sources used as the catalyst for biodiesel production
- Larvicidal potential of Cipadessa baccifera leaf extract-synthesized zinc nanoparticles against three major mosquito vectors
- Fabrication of green nanoinsecticides from agri-waste of corn silk and its larvicidal and antibiofilm properties
- Palladium-mediated base-free and solvent-free synthesis of aromatic azo compounds from anilines catalyzed by copper acetate
- Study on the functionalization of activated carbon and the effect of binder toward capacitive deionization application
- Co-chlorination of low-density polyethylene in paraffin: An intensified green process alternative to conventional solvent-based chlorination
- Antioxidant and photocatalytic properties of zinc oxide nanoparticles phyto-fabricated using the aqueous leaf extract of Sida acuta
- Recovery of cobalt from spent lithium-ion battery cathode materials by using choline chloride-based deep eutectic solvent
- Synthesis of insoluble sulfur and development of green technology based on Aspen Plus simulation
- Photodegradation of methyl orange under solar irradiation on Fe-doped ZnO nanoparticles synthesized using wild olive leaf extract
- A facile and universal method to purify silica from natural sand
- Green synthesis of silver nanoparticles using Atalantia monophylla: A potential eco-friendly agent for controlling blood-sucking vectors
- Endophytic bacterial strain, Brevibacillus brevis-mediated green synthesis of copper oxide nanoparticles, characterization, antifungal, in vitro cytotoxicity, and larvicidal activity
- Off-gas detection and treatment for green air-plasma process
- Ultrasonic-assisted food grade nanoemulsion preparation from clove bud essential oil and evaluation of its antioxidant and antibacterial activity
- Construction of mercury ion fluorescence system in water samples and art materials and fluorescence detection method for rhodamine B derivatives
- Hydroxyapatite/TPU/PLA nanocomposites: Morphological, dynamic-mechanical, and thermal study
- Potential of anaerobic co-digestion of acidic fruit processing waste and waste-activated sludge for biogas production
- Synthesis and characterization of ZnO–TiO2–chitosan–escin metallic nanocomposites: Evaluation of their antimicrobial and anticancer activities
- Nitrogen removal characteristics of wet–dry alternative constructed wetlands
- Structural properties and reactivity variations of wheat straw char catalysts in volatile reforming
- Microfluidic plasma: Novel process intensification strategy
- Antibacterial and photocatalytic activity of visible-light-induced synthesized gold nanoparticles by using Lantana camara flower extract
- Antimicrobial edible materials via nano-modifications for food safety applications
- Biosynthesis of nano-curcumin/nano-selenium composite and their potentialities as bactericides against fish-borne pathogens
- Exploring the effect of silver nanoparticles on gene expression in colon cancer cell line HCT116
- Chemical synthesis, characterization, and dose optimization of chitosan-based nanoparticles of clodinofop propargyl and fenoxaprop-p-ethyl for management of Phalaris minor (little seed canary grass): First report
- Double [3 + 2] cycloadditions for diastereoselective synthesis of spirooxindole pyrrolizidines
- Green synthesis of silver nanoparticles and their antibacterial activities
- Review Articles
- A comprehensive review on green synthesis of titanium dioxide nanoparticles and their diverse biomedical applications
- Applications of polyaniline-impregnated silica gel-based nanocomposites in wastewater treatment as an efficient adsorbent of some important organic dyes
- Green synthesis of nano-propolis and nanoparticles (Se and Ag) from ethanolic extract of propolis, their biochemical characterization: A review
- Advances in novel activation methods to perform green organic synthesis using recyclable heteropolyacid catalysis
- Limitations of nanomaterials insights in green chemistry sustainable route: Review on novel applications
- Special Issue: Use of magnetic resonance in profiling bioactive metabolites and its applications (Guest Editors: Plalanoivel Velmurugan et al.)
- Stomach-affecting intestinal parasites as a precursor model of Pheretima posthuma treated with anthelmintic drug from Dodonaea viscosa Linn.
- Anti-asthmatic activity of Saudi herbal composites from plants Bacopa monnieri and Euphorbia hirta on Guinea pigs
- Embedding green synthesized zinc oxide nanoparticles in cotton fabrics and assessment of their antibacterial wound healing and cytotoxic properties: An eco-friendly approach
- Synthetic pathway of 2-fluoro-N,N-diphenylbenzamide with opto-electrical properties: NMR, FT-IR, UV-Vis spectroscopic, and DFT computational studies of the first-order nonlinear optical organic single crystal