Co-chlorination of low-density polyethylene in paraffin: An intensified green process alternative to conventional solvent-based chlorination
-
 ,
,

Abstract
This study experimentally demonstrates the potential of co-chlorination as a green process alternative to conventional independent chlorination of polyolefins, which involves the use of non-environment-friendly solvents like carbon tetrachloride (CCl4). Low-density polyethylene (LDPE) was used as a representative polymer in this study and co-chlorinated with paraffin. Apart from being a reactant, the paraffin also acts as a solvent, thus eliminating the need for using CCl4 during the reaction. Test runs were first conducted to measure LDPE-paraffin solution viscosities at different LDPE concentrations to investigate the solubility of LDPE in paraffin. Co-chlorination experiments were then carried out covering a range of temperatures (100–130°C), chlorine flow rates (150–350 mL·min−1), LDPE concentrations in paraffin (10–30%) and agitation speeds (100–400 rpm). The chlorinated LDPE and paraffin products were subsequently characterized post separation using FTIR/1H NMR spectroscopy and differential scanning calorimetry. Specific properties of these two co-chlorinated products were compared with independently chlorinated LDPE and paraffin. The co-chlorinated products were found to compare well in terms of chlorine content and quality. A preliminary comparative study from a process perspective between co-chlorination and conventional chlorination of LDPE is also reported. The results obtained confirm the potential of co-chlorination as an environmentally friendly alternative.
Graphical abstract
Abbreviations
- CPE
-
chlorinated polyethylene
- CPO
-
chlorinated polyolefin
- CPP
-
chlorinated polypropylene
- CPVC
-
chlorinated polyvinyl chloride
- HDPE
-
high-density polyethylene
- LDPE
-
low-density polyethylene
- PVC
-
polyvinyl chloride
1 Introduction
Chlorinated polyolefins (CPOs) have gained considerable importance in recent times due to their unique properties and wide applications. Some of the CPOs’ of industrial importance are chlorinated polyethylene (CPE), chlorinated polypropylene (CPP), and chlorinated polyvinyl chloride (CPVC) [1,2,3,4,5,6,7]. Chlorination imparts additional properties such as shore hardness, tensile strength, adhesive strength, and impact resistance to the respective parent polyolefin. As a result, CPOs are commercially used over and above conventional non-chlorinated polyolefins in various applications.
CPOs are generally manufactured by the “solution” chlorination process in which chlorine gas (Cl2) is passed through a solid polyolefin dissolved in a suitable solvent like carbon tetrachloride (CCl4) [8,9,10,11]. In another method referred to as the “suspension” chlorination process, chlorine is passed through a parent polyolefin suspended in an inert solvent like water [12,13,14,15,16,17]. As a variation, the chlorination process can also be carried out in a combined manner involving two stages, the first and second stages being based on solvent suspension and dissolution of the polyolefin, respectively. The bulk of the chlorination occurs in stage 1 which normally operates at a low temperature (<50°C). The third method of manufacture known as the “solid-state” chlorination process involves fluidizing finely powdered polyolefin using chlorine as such or diluted with an inert gas like nitrogen. More details on the above processes have been reported in several patents and refs. [18–25]. The solution and suspension processes have also been demonstrated at the commercial level. The inherent drawbacks of the three processes are summarized in Table 1.
Drawbacks of solution, suspension, and solid-state chlorination processes
| S. no. | Chlorination process | Drawbacks |
|---|---|---|
| 1 | Solution | • Lower effective utilization of reactor capacity due to excessive solvent usage |
| • Non-environment-friendly process due to hazardous nature of solvents used | ||
| • Energy intensive in terms of solvent recovery | ||
| • Presence of trace amounts of solvent in the final product which can affect its quality and usage in further applications | ||
| 2 | Suspension | • Aggregation of suspended particles of the parent polymer which can result in non-uniform chlorination |
| • Long chlorination time requirement | ||
| • Large solvent/water requirement for solid suspension | ||
| • Large amount of wastewater generation post chlorination | ||
| • Requirement of additional ingredients like emulsifiers | ||
| • Limitation in chlorine content in the final product | ||
| 3 | Solid state | • Long chlorination time requirement |
| • Risk of charring of the solid polyolefin and lump formation due to localized heating | ||
| • Possible incomplete conversion of solid polyolefin |
The drawbacks in the case of solution and suspension chlorination indicate that there is scope for intensifying these existing processes in terms of solvent usage and recovery. Any research aimed at eliminating the use of hazardous solvents or replacing them with non-hazardous alternatives will be beneficial. It will also enable a uniform chlorination environment, yield consistent product quality, and facilitate ease of product separation after the reaction is completed. One line of thought involves identifying a solvent that will concurrently act as a reactant. This solvent thus undergoes chlorination along with the parent polyolefin in a single reactor yielding two useful chlorinated products, the reaction referred to as co-chlorination.
Tan et al. [26,27] were the first to report co-chlorination of high-density polyethylene (HDPE) and isotactic polypropylene (IPP) using paraffin as solvent. HDPE was dissolved in paraffin at ∼135°C, and the homogeneous solution was co-chlorinated to yield chlorinated HDPE and chlorinated paraffin as products. While their results confirmed that the carbon chain in a polyolefin can be co-chlorinated in paraffin, the effect of operating parameters (temperature, chlorine flow rate, polyolefin composition in paraffin, and agitation) on the extent of chlorination has not been investigated. The effect of temperature on the polyolefin-paraffin solution viscosity which can impact chlorination and agitation power requirement has also not been studied. Both investigations were carried out at a specific combination of varying temperatures and reaction times which would be difficult to adopt and maintain in practice. No change in chlorine content in respective products post-co-chlorination was observed at all combinations investigated. The maximum chlorine content in chlorinated HDPE and paraffin was limited to ∼35% and ∼36%, respectively. The authors have justified conducting studies below the temperature at which HDPE and IPP are completely soluble in paraffin from a perspective of saving energy. However, the chlorination reactions involved are exothermic and necessitate cooling, thereby contradicting this justification. To the best of our knowledge, there has been no further work reported in the literature on co-chlorination.
While solvent-based chlorination of HDPE and low-density polyethylene (LDPE) has been researched by investigators over the years [8,9,10,28], major emphasis has been placed on chlorinated HDPE in view of its applications in polymer blending and manufacture of rubbers, wires, cables, and hoses. Abdumavlyanova and Magrupov [29] investigated the use of chlorinated LDPE as a modifier in PVC composites used for window frames. Chlorinated LDPE was found to have a considerable effect on improving the strength-related characteristics of these composites. Wang et al. [21] have attempted utilizing chlorinated LDPE as a raw material for corrosion paint synthesis instead of conventional chlorinated HDPE, the use of which in such paints is constrained by its high viscosity. The chlorine content in LDPE in the above studies was in the range of 20–50%.
With limited published data on co-chlorination from a process chemistry perspective and the use of chlorinated LDPE gaining attention over the last decade, the present work aims to experimentally investigate co-chlorination of LDPE and paraffin. The representative reactions involved are as follows:
where [–CH2–CH2–] n and CH3[–CH2–] n CH3 denote representative LDPE and paraffin chains, respectively.
The effect of operating conditions on LDPE co-chlorination in paraffin was studied. The co-chlorinated products were subsequently characterized to determine the efficacy of chlorination. In addition, a comparative study on the potential of LDPE co-chlorination at large-scale process level with the CCl4 solvent-based LDPE chlorination process (adopted industrially) is also presented.
2 Materials and methods
2.1 Materials
All chemicals, solvents, and reagents were acquired commercially and utilized without further purification. Paraffin (C14 – 98.09%, C13 – 1.91%) was supplied by Grasim Industries Ltd. (India). LDPE was purchased from Triveni Chemicals Ltd. (India). Chlorine and Nitrogen gas cylinders (both of 99.9% purity) were procured from M/S Shree Enterprises (India) and Om Gas (India), respectively.
2.2 Experimental setup
Figure 1 depicts a schematic of the experimental setup used to study co-chlorination. The apparatus consists of a jacketed cylindrical 1 L glass reactor (1) with an inlet for chlorine gas (2). The gas was supplied to the reactor from a cylinder (3) fitted with a pressure regulating valve (PRV) at the outlet. The chlorine flow rate was measured using a rotameter (4) with a range and accuracy of 0 to 500 mL·min−1 and 2% of full span, respectively. Before entering the reactor, the chlorine was routed through a sulphuric acid trap (5) to absorb any trace of residual moisture present in the gas. The reaction temperature was maintained at a desired value by circulating hot oil through the reactor jacket. This temperature was measured using a PT-100 sensor (6) with an accuracy of ±0.25% of full span. A stirrer (7) was used to agitate the reactor contents during the experimental runs. A reflux condenser (8) was provided to facilitate condensation of solvent vapors back into the reactor (during chlorination of LDPE in CCl4 only). The reactor was purged with nitrogen supplied from a cylinder (9) at the end of each test run to remove HCl gas generated during chlorination along with unreacted chlorine. These gases were further treated in a caustic scrubber (10) at the reactor exit. Un-scrubbed nitrogen was safely released into the atmosphere through a vent (11). A charge port (12) was used to feed paraffin and LDPE into the reactor.
Schematic of experimental test setup: (1) jacketed cylindrical glass reactor, (2) chlorine gas inlet, (3) chlorine gas cylinder, (4) rotameter, (5) sulfuric acid trap, (6) temperature sensor, (7) stirrer, (8) reflux condenser, (9) nitrogen gas cylinder, (10) caustic scrubber, (11) vent, and (12) paraffin/LDPE/solvent charge port.
2.3 Methods
2.3.1 Identifying optimum conditions for co-chlorination
Preliminary test runs were performed using a rheometer to determine solution viscosity at different LDPE concentrations in paraffin and temperatures. These experiments helped identify the temperature above which the solution remains homogeneous at any given concentration, thus ensuring that no precipitation of LDPE occurred during the co-chlorination runs. 3 g of solid LDPE was mixed with 27 g of liquid paraffin in a round bottom flask to yield a 10% solution of LDPE in paraffin. The flask and its contents were then indirectly heated to 130°C in an oil bath whose temperature was sustained using a magnetic hot plate. LDPE was expected to completely dissolve in paraffin at this temperature (confirmed later by viscosity measurements). The contents of the flask were then continuously stirred for 30 min to produce a homogeneous solution (confirmed via visual observation). The entire solution was transferred to the sample cup of a rheometer (Anton Paar make, Model MCR301) and heated to 150°C using an in-built heater outside the cup. The temperature was then gradually reduced to 70°C at a rate of 2°C·min−1 while the solution viscosity was continuously recorded. Thereafter, viscosity measurements were taken by heating the sample at the same rate from 70°C to 150°C. The above protocol was repeated at different LDPE concentrations in paraffin ranging from 20% to 50%. These measurements were repeated twice at each concentration to confirm consistency in the results.
2.3.2 Co-chlorination test runs
A typical co-chlorination test run was initiated by charging 225 g of liquid paraffin and 25 g of solid LDPE (10% w/w) into the 1 L reactor. The temperature of the mixture was raised to 130°C at 400 rpm to dissolve the LDPE in the paraffin; 0.625 g of AIBN was then added to this homogeneous solution as an initiator [28]. The solution was chlorinated at a chlorine flow rate of 350 mL·min−1 for 3 h. The chlorine flow was turned off, and a sample was collected for analysis. Chlorination was resumed, and the preceding procedure was repeated every 3 h for a duration of 15 h. Test runs were conducted in a similar manner covering a range of temperatures, chlorine flow rates, LDPE concentrations, and agitator speed, details of which are listed in Table 2. Each co-chlorination experiment was further repeated twice to confirm consistency in the results obtained.
Operating conditions adopted in co-chlorination experiments
| S. no. | Variables | Range |
|---|---|---|
| 1 | Temperature (°C) [chlorine flow rate, 350 mL·min−1; LDPE concentration in paraffin, 10%; agitator speed, 400 rpm] | 100–130 |
| 2 | Chlorine flow rate (mL·min−1) [temperature, 130°C; LDPE concentration in paraffin, 10%; agitator speed, 400 rpm] | 150–350 |
| 3 | LDPE concentration in paraffin (%) [chlorine flow rate, 350 mL·min−1; temperature, 130°C; agitator speed, 400 rpm] | 10–30 |
| 4 | Agitator speed (rpm) [temperature, 130°C; chlorine flow rate, 350 mL·min−1; LDPE concentration in paraffin, 10%] | 100–400 |
A portion of the co-chlorinated LDPE-paraffin solution samples collected at different time intervals was analyzed as is. The remaining portion was treated with two-fold volume of methanol resulting in the precipitation of chlorinated LDPE from a solution of chlorinated paraffin and methanol. The precipitate was separated from the solution by decantation and subsequently washed twice with methanol (1:1 weight ratio of solid to methanol) and once with deionized water sequentially. The washed precipitate was then dried overnight in an oven at 80°C and stored. The chlorinated paraffin-methanol solution devoid of LDPE was then distilled to separate methanol as vapor. Any residual methanol in the chlorinated paraffin after distillation was removed in a rotary vacuum evaporator operated at ∼60°C. The choice of methanol as solvent was based on a series of trial runs in which 23 solvents were tested for their potential to dissolve chlorinated paraffin and LDPE independently.
2.3.3 Determination of chlorine content
The weight percentages of carbon (C) and hydrogen (H) in all the samples collected were first determined using a CHNS analyzer (Thermo Scientific make, Model Flash 2000). The analyzer was also used to determine the C and H content in the LDPE-paraffin solution before chlorination. The weight percent of chlorine in the samples was estimated thus:
3 Results and discussion
3.1 Optimum conditions for co-chlorination
As mentioned in Section 2.3.1, preliminary tests were carried out to determine the optimum temperature and LDPE composition in paraffin. These tests ensured that a homogeneous solution of LDPE was chlorinated during the main co-chlorination experiments. Figure 2a and b shows the effect of temperature on viscosity at different LDPE concentrations in samples that were subjected to independent cooling and heating cycles between 70°C and 150°C. During the cooling cycle, the viscosity at a given LDPE concentration is observed to increase with decreasing temperature.
Variation of viscosity with the temperature at different LDPE concentrations: (a) cooling cycle and (b) heating cycle.
The solution viscosity increases with increasing LDPE concentration at a fixed temperature. The viscosity increases below a specified temperature (∼100°C) at all concentrations. This can be ascribed to the precipitation of LDPE from the solution. An abrupt rate of viscosity increase is observed at concentrations greater than 30%. As the concentration of LDPE increases, precipitation is initiated at a higher temperature. Precipitation at 10% and 50% concentration was found to occur at ∼92°C and ∼100°C, respectively. The LDPE-paraffin solution is homogeneous above 100°C as indicated by a near constant viscosity, which is more pronounced at lower concentrations.
During the heating cycle, the viscosity decreases with an increase in temperature at a fixed LDPE concentration due to the dissolution of LDPE in paraffin (Figure 2b). While dissolution is observed at all concentrations investigated, the dissolution temperature increases with LDPE concentration. Solution homogeneity in both cycles was confirmed by a near constant solution viscosity above the precipitation and dissolution temperatures at a fixed concentration of LDPE.
A hysteresis was also observed at all concentrations investigated where the viscosity value during heating of the sample at a given temperature is different from the viscosity value of the same sample at the same temperature during the cooling cycle. A representative hysteresis plot at 10% LDPE concentration is shown in Figure 3. The hysteresis phenomenon is no longer observed once LDPE completely dissolves in paraffin. It can be concluded from the above study that co-chlorination can be carried out at between 100°C and 130°C at 10% or 20% LDPE concentration with the polyolefin likely to precipitate below 100°C. Product degradation has been reported above 130°C via de-chlorination and formation of HCl [23,26].

Hysteresis during heating and cooling cycles (10% LDPE in paraffin).
3.2 Parametric studies
The variation of chlorine content with time at different temperatures, chlorine flow rates, LDPE concentrations and agitation speeds are shown in Figure 4a–d, respectively.
(a) Effect of temperature on co-chlorination (chlorine flow rate 350 mL·min−1, 10% LDPE concentration, and 400 rpm); (b) effect of chlorine gas flow rate on co-chlorination (130°C, 10% LDPE concentration, and 400 rpm); (c) effect of concentration of LDPE on co-chlorination (130°C, chlorine flow rate 350 mL·min−1, and 400 rpm); and (d) effect of agitation on co-chlorination (130°C, chlorine flow rate 350 mL·min−1, and 10% LDPE concentration).
3.2.1 Effect of temperature
At a given temperature, the chlorine content is found to increase over time (Figure 4a). At any given time, the chlorine content increases with temperature. However, this increase is not significant (less than ∼2.5%) between 110°C and 130°C. A maximum chlorine content of ∼56% by weight was obtained at 130°C after 18 h.
3.2.2 Effect of chlorine gas flow rate
As shown in Figure 4b, the chlorine content initially increases with time at a given flow rate and subsequently levels off as time progresses. This is due to a decrease in the availability of hydrogen atoms in LDPE and paraffin, which are eventually replaced by chlorine atoms during the reaction. This level-off trend is also observed in Figure 4a, c and d for the same reason. At any given time, the chlorine content increases with an increase in flow rate due to the availability of more chlorine radicals at higher flow rates which aids in the propagation of the reaction [8]. The initial rate of increase in chlorine content is also greater at 350 mL·min−1 than at the other flow rates investigated. The chlorine content at flow rates of 150 and 350 mL·min−1 after 18 h was ∼43% and ∼56% (w/w), respectively.
3.2.3 Effect of concentration of LDPE
As illustrated in Figure 4c, the chlorine content decreases with an increase in concentration at any given time. After 18 h, the chlorine content was ∼56% by weight in the 10% LDPE solution as against ∼51% in the 30% solution. The decrease can be attributed to an increase in solution viscosity, which results in lower diffusion of chlorine gas through the solution. The chlorine content in independently chlorinated paraffin with no LDPE is also shown in the figure for reference. The increase in viscosity will be significantly greater at concentrations above 30% (as shown in Figure 2a and b). The chlorine content under these conditions is expected to be even lower. The viscosity of 10% LDPE-paraffin solution before and after co-chlorination was 0.00098 and 0.00248 Pa·s, respectively. The viscosity values reported are at 130°C.
3.2.4 Effect of agitation
Figure 4d shows the effect of agitation on chlorine content in solution during co-chlorination. At a fixed time, the chlorine content increases with rpm (indicative of the extent of agitation) due to an increase in mass transfer between the gas and solution phases. Agitation increases turbulence, and thus the shear rate, thereby promoting the formation of smaller bubbles with larger interfacial area. This reduces the mass transfer resistance between the phases, resulting in an increase in the rate of chlorination. Agitation also helps maintain uniformity in the solution during the chlorination reaction. The chlorine content post 18 h of test runs was found to differ by ∼2.6% (w/w) at 300 and 400 rpm where the effects of mass transfer can be neglected.
3.3 Product characterization
3.3.1 Elemental analysis
The carbon (C), hydrogen (H), and chlorine content in all samples collected before and after co-chlorination was estimated using a CHNS analyzer, details of which are outlined in Section 2.3.3. Based on the CHNS spectra obtained, Table 3 shows the weight percent of C and H in a LDPE-paraffin solution sample before co-chlorination. The composition of C and H in the same sample after 9 and 18 h of chlorination at 130°C, chlorine flow rate 350 mL·min−1, 10% LDPE concentration and 400 rpm are also shown in Table 3.
Weight percent of C and H in LDPE-paraffin solution
| S. no. | Element | Composition (wt%) | ||
|---|---|---|---|---|
| Before co-chlorination | After 9 h* | After 18 h* | ||
| 1 | Carbon | 85.66 | 51.86 | 38.24 |
| 2 | Hydrogen | 14.34 | 7.33 | 5.80 |
| 3 | Total | 100 | 59.19 | 44.04 |
*130°C, 350 mL·min−1 chlorine flow rate, 10% LDPE concentration, and 400 rpm.
The total composition of C and H in the unchlorinated solution is 100% by weight. This percentage however reduces to 59.19% after 9 h. As chlorination proceeds, the hydrogen in the LDPE and paraffin chain is replaced by chlorine. The overall molar mass of the solution increases, thereby reducing the weight percentage of carbon and hydrogen in the final product. The chlorine subsequently contributes to the remaining ∼41%. After 18 h of chlorination, the total C and H content is 44.04% which corresponds to a chlorine content of ∼56% in the solution.
3.3.2 Fourier Transform Infrared (FTIR) analysis
FTIR spectra of samples were recorded to qualitatively confirm the formation of the carbon–chlorine (C–Cl) bond during co-chlorination. The spectra were recorded using an infrared spectrophotometer (Thermo Scientific make, Model Nicolet 6700). Each spectrum was collected in the wavelength range of 400–4,000 cm−1 with 4 cm−1 resolution over 32 scans in transmission mode.
FTIR spectra of 10% LDPE-paraffin solution before and after co-chlorination (at 130°C, chlorine flow rate 350 mL·min−1, and 400 rpm) are shown in Figure 5a and b, respectively. The spectrum of the unchlorinated solution in Figure 5a shows three characteristic peaks at 2,848, 2,915, and 2,955 cm−1. These peaks are attributed to stretching modes of the C–H bond present in the methylene (–CH2–) group of LDPE and paraffin when in solution [30,31]. The peak observed at 1,462 cm−1 is due to the scissoring vibration of the –CH2– group. The deformation mode of the methyl (–CH3) group is confirmed by a peak at 1,376 cm−1 [32]. The sharp peak at a wavelength of 719 cm−1 is ascribed to the rocking vibration of the –CH2– group in LDPE and is normally observed in crystalline polyolefins [33].
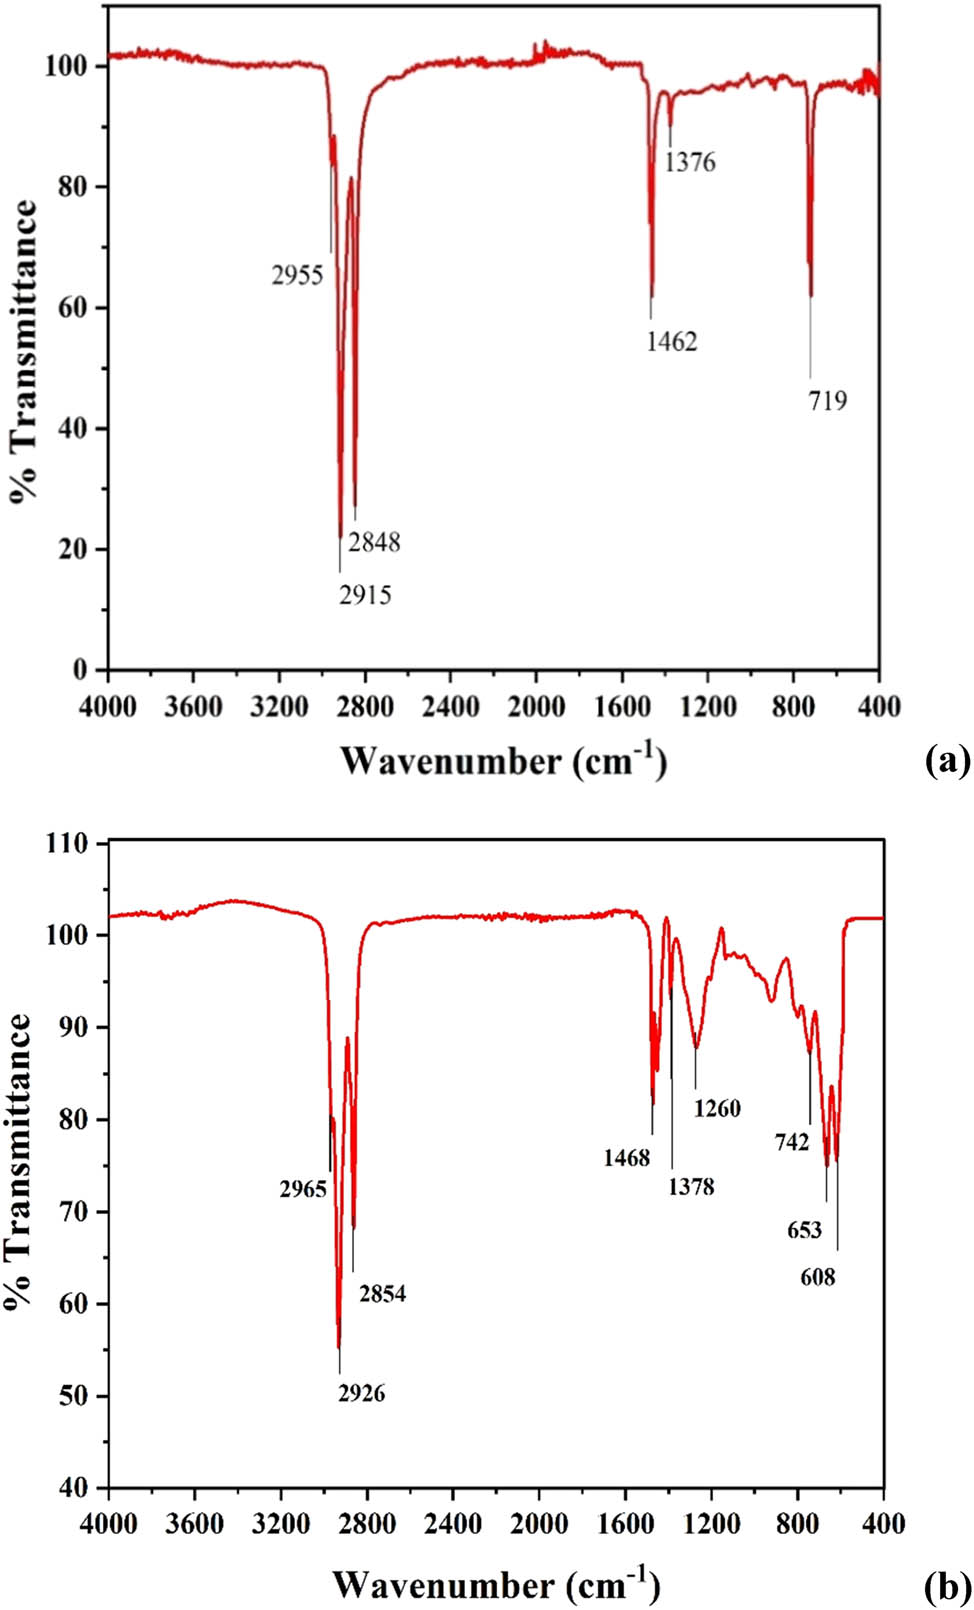
(a) FTIR spectrum of LDPE-paraffin solution before co-chlorination (10% LDPE concentration); (b) FTIR spectrum of LDPE-paraffin solution post co-chlorination (130°C, chlorine flow rate 350 mL·min−1, 10% LDPE concentration, and 400 rpm).
However, two additional peaks are observed after co-chlorination at 653 and 1,260 cm−1. These additional peaks relate to the stretching of the C–Cl bond in the chloromethylene (–CHCl–) group and deformation of the C–H bond in the –CH2– group, respectively [34]. The presence of these peaks confirms that the reaction mixture has been chlorinated, with the chlorine atom replacing hydrogen to form the C–Cl bond. This bond also results in the shifting of peaks from 2,848, 2,915, 2,955, and 1,462 cm−1 in Figure 5b to 2,854, 2,926, 2,965, and 1,468 cm−1 due to the induction effects of chlorine atoms in the vicinity of –CH2– groups [35].
The FTIR spectra of chlorinated LDPE and chlorinated paraffin post separation are shown in Figure 6a and b, respectively. These spectra in general were found to be similar in nature to the spectrum of the chlorinated LDPE-paraffin solution shown in Figure 5b. The peak at 719 cm−1 seen in Figure 5a is not observed in Figure 6a as the LDPE structure no longer retains its crystalline nature after chlorination. This allows chlorinated LDPE to dissolve easily in a solvent during its final application. This was later confirmed to be consistent with the results obtained using a differential scanning calorimeter (DSC), which is discussed later in Section 3.3.4. The presence of a strong peak at about 1,255 cm−1 has been reported in the spectrum of polyvinyl chloride (PVC) confirming the presence of the –CH2CHCl– structure in the polymer [34]. A similar peak is observed at 1,261 cm−1 in Figure 6a, indicating –CH– deformation mode and the presence of the –CH2CHCl– structure in chlorinated LDPE.
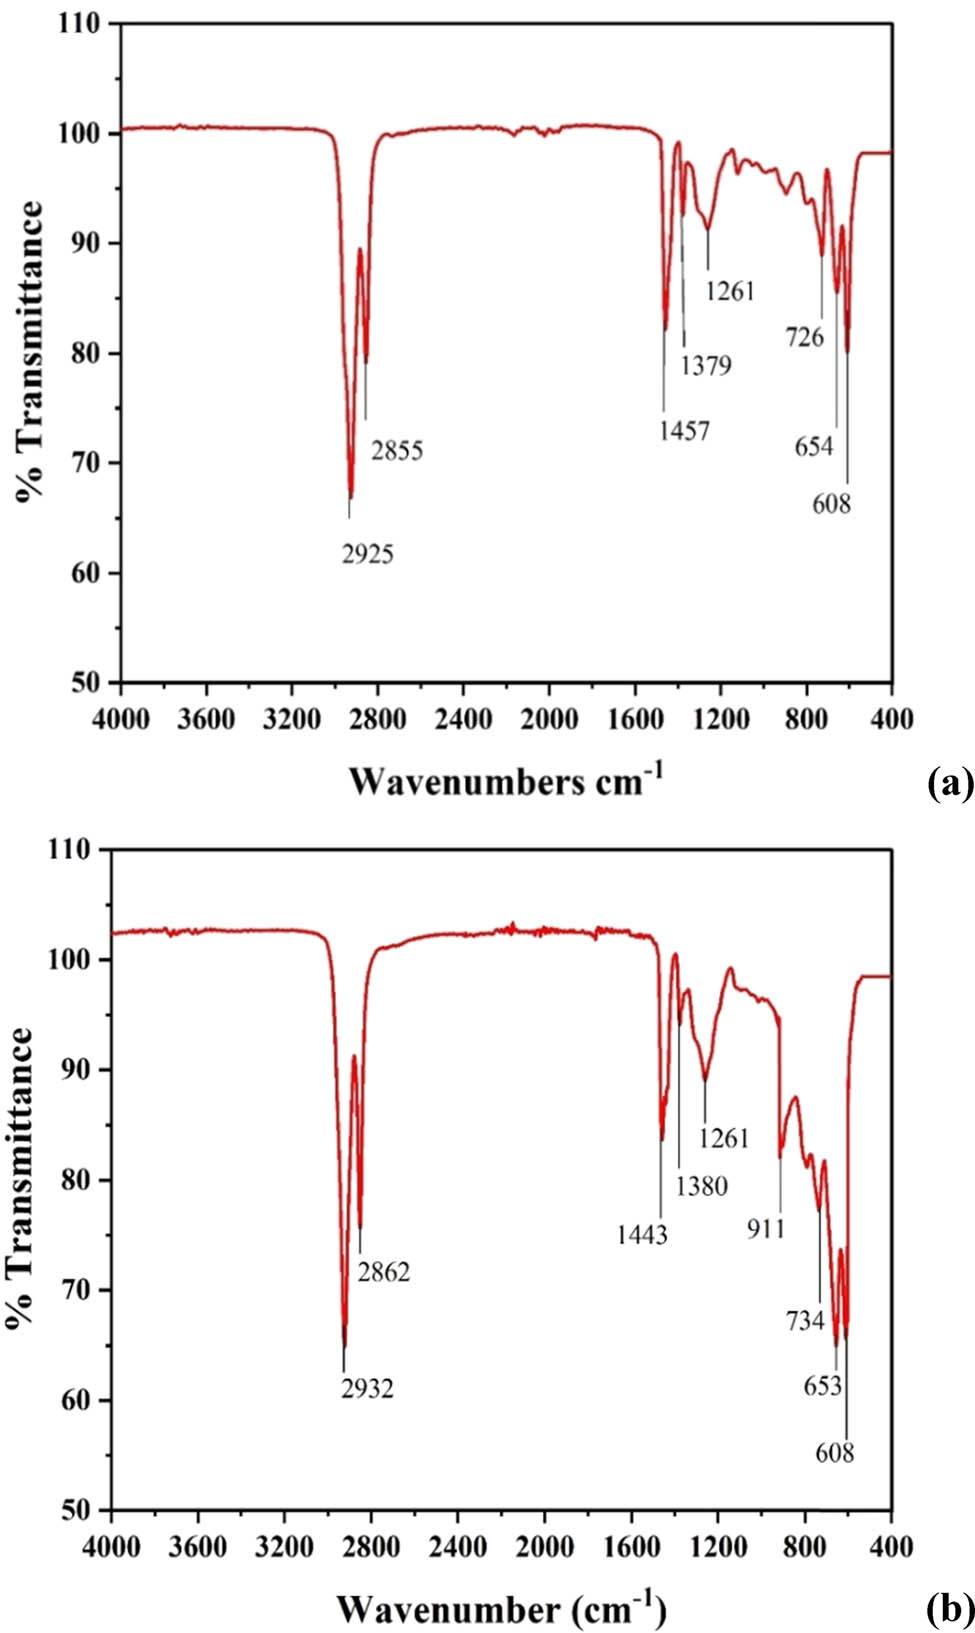
(a) FTIR spectrum of chlorinated LDPE post separation; (b) FTIR spectrum of co-chlorinated paraffin post separation from LDPE (130°C, chlorine flow rate 350 mL·min−1, 10% LDPE concentration, and 400 rpm).
3.3.3 High-resolution nuclear magnetic resonance (1H NMR) analysis
1H NMR spectra of an LDPE-paraffin solution from a specific test run before and after co-chlorination was recorded to qualitatively confirm the formation of carbon–chlorine bond during the reaction. The spectra were recorded using an Avance III 400 MHz Bruker make NMR spectrometer, using deuterated chloroform (CDCl3) and Tetramethyl Silane (TMS) as an internal reference. Spectra were also obtained for chlorinated LDPE and chlorinated paraffin post separation.
The 1H NMR spectrum of the LDPE-paraffin solution prior to co-chlorination is shown in Figure 7a. The chemical shifts of 0.9 and 1.41 ppm (parts per million) in the spectrum are attributed to proton resonance in the methyl (–CH3) and methylene (–CH2–) groups, respectively. Post co-chlorination of the above solution, the 1H NMR spectrum obtained (Figure 7b) shows three groups of peaks appearing in the approximate range of 3.3–4.8, 1.5–2.8, and 1–1.3 ppm. The first group in the range of 3.3–4.8 ppm is due to the resonance of chloromethylene (–CHCl–) group protons in the chlorinated product. The resonance of protons associated with the –CH2– and the –CH3 groups results in peaks between 1.5–2.8 and 1–1.3 ppm, respectively.
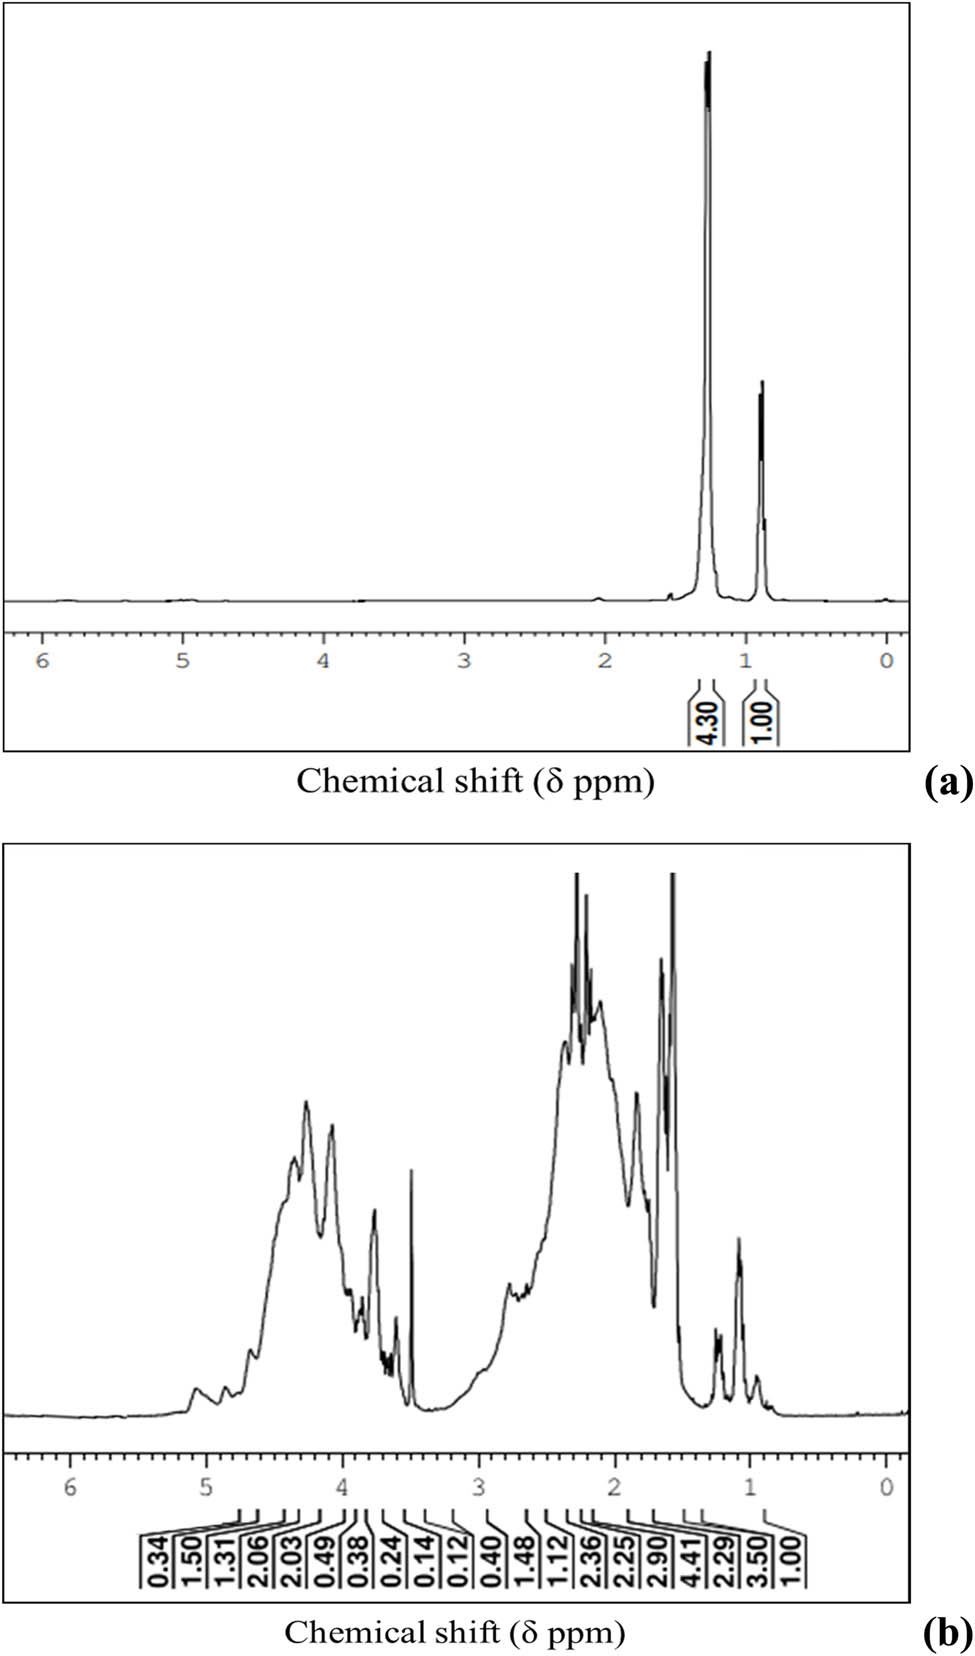
(a) 1H NMR spectrum of LDPE-paraffin solution before co-chlorination; (b) 1H NMR spectrum of co-chlorinated LDPE-paraffin solution after 18 h (130°C, chlorine flow rate 350 mL·min−1, 10% LDPE concentration, and 400 rpm).
The spectra of chlorinated LDPE separated from paraffin after 9 and 18 h are shown in Figure 8a and b. Figure 8a shows a sharp peak at ∼1.2 ppm grouped with peaks at higher chemical shifts between 1.35 and 1.9 ppm, all of which can be assigned to methylene protons. As chlorination progresses, the integrated value of the peak at ∼1.2 ppm decreases, and the number of methylene peaks between 1.3 and 2.8 ppm increases.

1H NMR spectrum of co-chlorinated LDPE post separation after (a) 9 h and (b) 18 h (in both cases: 130°C, chlorine flow rate 350 mL·min−1, 10% LDPE concentration, and 400 rpm); (c) 1H NMR spectrum of chlorinated LDPE using CCl4 as solvent (post separation).
The 1H NMR spectrum of LDPE chlorinated in CCl4 is shown in Figure 8c. The spectrum is near identical to the spectrum of co-chlorinated LDPE as shown in Figure 8b, which indicates that the microstructure of this product from the above two methods is similar.
3.3.4 Differential Scanning Calorimetric (DSC) analysis
Understanding the crystalline nature of polyolefin is essential for determining its solubility in various solvents used in its end applications. In this context, a DSC analysis of an LDPE sample before and after co-chlorination (post separation) was carried out. A DSC was used for this purpose (TA Instruments make, Model Q200 V24.11 Build 124). The sample was heated in a nitrogen atmosphere from 30°C to a final temperature of 200°C at a scanning rate of 10°C·min−1 (determined from trial runs). In addition, a DSC analysis of LDPE chlorinated in CCl4 was also carried out. Respective thermograms are shown in Figure 9.
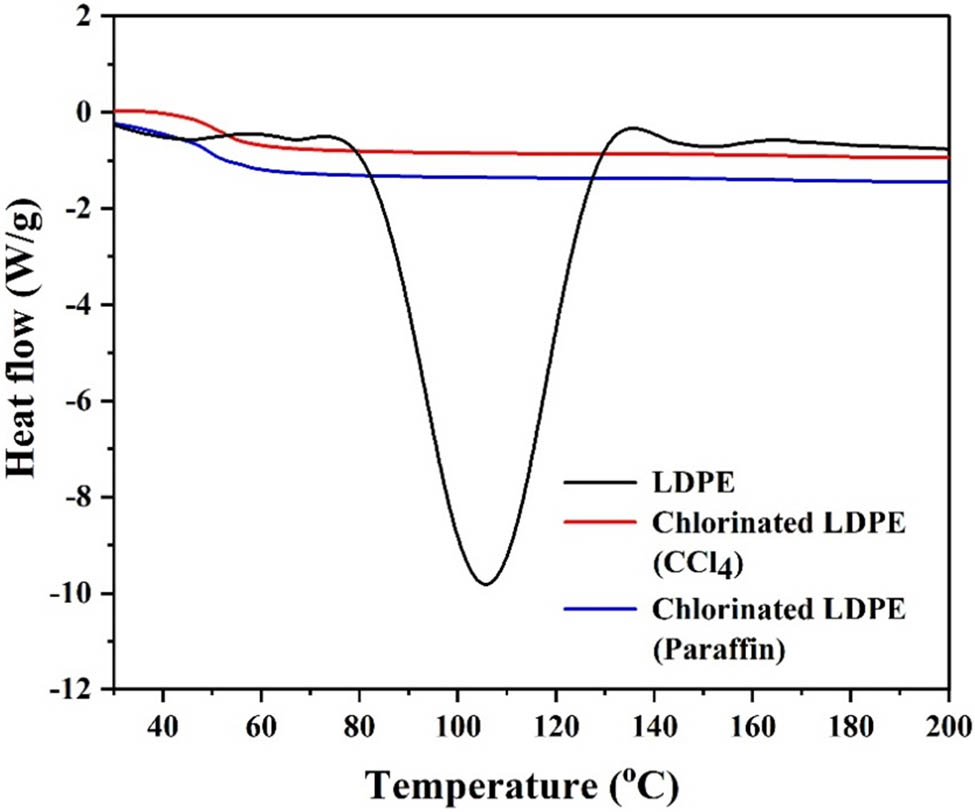
DSC thermograms to confirm the degree of crystallinity in LDPE (before and after chlorination and co-chlorination).
While the x-axis of the thermogram denotes the temperature in °C, the y-axis represents heat flow. In the case of unchlorinated LDPE, an endothermic peak pointing downward is observed, which corresponds to the melting of the polyolefin. The percentage relative crystallinity in unchlorinated LDPE was estimated using
where
This reference has been established for polymers commonly used in practice and is available in the literature. This value for LDPE was taken to be 270.03 J·g−1 in the present study [36,37,38]. The degree of crystallinity in unchlorinated LDPE was found to be ∼39% confirming a semi-crystalline nature. No peak is observed in the case of LDPE after co-chlorination and separation from paraffin, indicating that chlorinated LDPE is not crystalline. This is due to the steric hindrance of the randomly distributed chlorine atoms grafted into the polyolefin chain. This nature is similar to the non-crystallinity associated with LDPE chlorinated in CCl4, which is also shown in Figure 9.
Figure 10 shows the photograph of a representative co-chlorinated LDPE-paraffin solution sample after 18 h along with chlorinated LDPE and paraffin after separation using methanol.
Photograph of co-chlorinated LDPE-paraffin solution, chlorinated paraffin and chlorinated LDPE post separation using methanol (post 18 h, 130°C, chlorine flow rate 350 mL·min−1, 10% LDPE concentration, and 400 rpm).
Specific properties of the final LDPE product obtained after chlorination in CCl4 and paraffin were also compared, and the comparison is shown in Table 4. CCl4-based chlorination was carried out at 75°C using the same test setup shown in Figure 1.
Comparison between LDPE chlorinated in CCl4 and paraffin (post separation)
| S. no. | Properties | CCl4-based chlorination | Co-chlorination |
|---|---|---|---|
| 1 | Chlorine content* | ∼58% | ∼55% |
| 2 | Solubility in toluene** | Completely soluble | Completely soluble |
| 3 | pH Value in water | 6 | 6.2 |
| 4 | Absorbance | 0.2 (at 370 nm) | 0.4 (at 370 nm) |
*Chlorine content measured using the CHNS method.
**Solubility concluded via visual measurement.
It is observed that the LDPE product quality in terms of chlorine content from both methods compares well to within 3%. The chlorine content can be varied by altering the reaction time. This would however be dependent on the availability of hydrogen in the LDPE-CCl4 or LDPE-paraffin solution, as well as the viscosities of these solutions not changing significantly during chlorination by either method.
Chlorinated LDPE is used in a variety of applications where this polymer is dissolved in an appropriate solvent prior to use. The solubility of chlorinated LDPE obtained from both methods in a representative solvent, i.e., toluene at ∼30°C was independently investigated. In both cases, LDPE was found to form a homogeneous solution (based on visual observation). A chlorinated LDPE solution in toluene (20% w/w) was used for the above test [26].
The chlorinated LDPE products obtained from chlorination in CCl4 and paraffin were separately dissolved in toluene (20% w/w). Deionized water was added to these solutions which were then stirred for 30 min. Thereafter, these solutions were allowed to settle for 60 min resulting in a separate organic and aqueous layer. The pH of the aqueous layer in each solution was then measured. The pH values obtained were close to the pH value of deionized water indicating the absence of free chlorine or HCl trapped in either product during respective reactions which otherwise post transport to the aqueous phase would have rendered the water acidic.
The chlorinated LDPE from both methods was tested for absorbance at wavelengths between 190 and 400 nm covering the ultraviolet (UV) range of the electromagnetic spectrum. The absorbance was measured using a PerkinElmer UV-Vis spectrophotometer (Model Lambda 365). The possibility of degradation of chlorinated LDPE can be predicted by the absorbance of UV light. The absorbance values of 0.2 and 0.4 reported in Table 4 correspond to a wavelength of 370 nm in the UV region. This can be attributed to the presence of UV absorbing impurities or chromophores, which initiate the formation of free radicals by breaking of C–Cl bond normally observed at ∼367 nm [39].
Table 5 compares the viscosity of chlorinated paraffin samples having varying chlorine content obtained by independent chlorination and co-chlorination (post separation). The viscosity measurements were carried out at 30°C using a rotary viscometer as discussed earlier in Section 2.3.1. The viscosity of chlorinated paraffin from either method was found to increase with chlorine content. This increase in viscosity is due to stiffness in the carbon chain arising from the replacement of hydrogen atoms with chlorine atoms. The viscosity of chlorinated paraffin obtained via co-chlorination was consistently higher possibly due to the presence of trace amounts of LDPE in the sample post separation. Industrial-grade chlorinated paraffin has a viscosity ranging between 0.05 and 150 Pa·s depending on the chlorine content.
Comparison between viscosities of chlorinated paraffin obtained via independent chlorination and co-chlorination
| S. no. | % Cl content | Viscosity (Pa·s) | |
|---|---|---|---|
| Independent chlorination | Co-chlorination | ||
| 1 | 30 | 0.2 | 0.3 |
| 2 | 40 | 1.1 | 1.4 |
| 3 | 50 | 6.2 | 8.2 |
| 4 | 55 | 120 | 126 |
Volatile loss in chlorinated paraffin is of importance when it is used as a secondary plasticizer in PVC compounding and metalworking lubricants. A volatile loss test was carried out by keeping a sample of chlorinated paraffin in a petri dish. Post weighing, the petri dish was placed in an oven (maintained at 180°C) for 4 h following which it was removed and cooled in a desiccator containing fused calcium chloride. The petri dish was weighed again, and the volatile loss was calculated using:
where X is the weight of the sample before heating (g) and Y is the weight of sample after heating (g)
Table 6 shows the comparison of volatile loss in chlorinated paraffin samples having varying chlorine content obtained from both methods. The volatile loss of chlorinated paraffin from either method was found to be comparable and decreases with an increase in chlorine content. The volatile loss will not significantly affect product quality, more so at chlorine concentrations normally associated with industrial-grade chlorinated paraffin (>50%).
Comparison between volatile loss in chlorinated paraffin obtained via independent chlorination and co-chlorination
| S. no. | %Cl content | Volatile loss (%) | |
|---|---|---|---|
| Independent chlorination | Co-chlorination | ||
| 1 | 30 | 2.50 | 2.41 |
| 2 | 40 | 0.78 | 0.72 |
| 3 | 50 | 0.24 | 0.23 |
| 4 | 55 | 0.19 | 0.17 |
The chlorination trend in paraffin chlorinated with LDPE was found to match the trend obtained when paraffin was independently chlorinated at 90°C in the same test setup (Figure 11). The discrepancy is less than ∼1.7% after 18 h. The maximum chlorine content in co-chlorinated paraffin was ∼56%.

Comparison of independently chlorinated paraffin and co-chlorinated paraffin with LDPE.
For co-chlorination of LDPE in paraffin to be adopted at pilot and/or plant scale, it is important to compare this method with the conventional solvent-based method adopted industrially for LDPE chlorination. Based on the results and discussions presented earlier, a comparative summary from a process perspective is presented in Table 7. While both reactions are carried out at atmospheric pressure, the co-chlorination reaction will need to be operated at a higher temperature (∼130°C) to ensure the complete solubility of LDPE in paraffin. This increase in temperature will however have no impact on the reactor material of construction (MOC). Conventional chlorination reactors used mild steel lined with glass, and hence, a similar reactor MOC can be used for co-chlorination.
Comparison between solvent-based chlorination and co-chlorination methods
| S. no. | Parameter | Solvent-based chlorination | Co-chlorination |
|---|---|---|---|
| 1 | Reaction absolute pressure | Atmospheric | Atmospheric |
| 2 | Reaction temperature (°C) | 70–100* | 100–130 |
| 3 | Solvent requirement for chlorination reaction/s | Yes | Yes |
| 4 | Solvent addition and recovery | Added as a third component in the reaction and then recovered by distillation | No third component is added during the reaction (reactant paraffin act as a solvent). No recovery of solvent |
| 5 | Solvent toxicity | High | Low |
| 6 | Solvent loss during the reaction | Yes (with exit of the gas stream of HCl and unreacted Cl2) | No solvent loss |
| 7 | Final product | Chlorinated LDPE or chlorinated paraffin* | Chlorinated LDPE and chlorinated paraffin |
| 8 | Effective reactor capacity utilization | Under-utilized (∼10%)** | Possible complete utilization (100%) |
| 9 | Mode of operation | Semi-batch | Semi-batch |
| 10 | Solvent addition for product separation | Not applicable | Methanol added as solvent post co-chlorination |
| 11 | Methanol recovery | Not applicable | By distillation |
*Independent chlorination of paraffin or LDPE.
**Friese et al. [10] and Moradi et al. [40].
A solvent like CCl4 is presently banned from usage under the Montreal Protocol [41] from a viewpoint of protecting the ozone layer. Despite the ban, CCl4 continues to be sold and used in practice, thereby still depleting the ozone layer during its emission. Co-chlorination eliminates the need for using environmentally toxic solvents like CCl4 presently used in conventional independent LDPE chlorination. The solvent requirement in co-chlorination is limited only to the use of methanol for separating chlorinated LDPE from chlorinated paraffin, which can then be recovered by distillation. Using methanol, emissions can be reduced to an estimated ∼150 kg per ton of co-chlorinated mixture. With appropriate recovery systems, this emission level can be further reduced or practically eliminated. CCl4 emissions during independent chlorination of HDPE have been reported in the order of ∼350 to ∼550 kg per ton of product [26]. The use of CCl4 in conventional chlorination also results in a solvent loss in the exit gas stream. During co-chlorination, the non-volatile nature of paraffin reduces solvent loss to a negligible value in the exit stream. CCl4 is separated and recovered from LDPE in conventional chlorination using an additional energy-intensive distillation-based recovery system. Distillation operation in co-chlorination is likely to be less energy-intensive due to the lower quantity of methanol solvent used. The use of solvents like CCl4 also results in under-utilization of reactor capacity due to ∼90% of the reaction solution comprising the solvent which does not undergo chlorination. During co-chlorination, the effective reactor capacity is likely to be better utilized with paraffin and LDPE simultaneously undergoing chlorination, thus resulting in better chlorine usage and reduced reactor volume.
4 Conclusions
The feasibility and potential of polyolefin co-chlorination using LDPE as a representative polymer and paraffin as solvent has been experimentally demonstrated as an environment-friendly alternative to conventional solvent-based polyolefin chlorination. A customized experimental test setup was used for this purpose. The viscosity of LDPE-paraffin solution is influenced by temperature and LDPE concentration in paraffin. An abrupt viscosity increase was observed below ∼100°C at all LDPE concentrations with this increase being more significant at concentrations above 30%, which can affect chlorine content in the final product during co-chlorination. The chlorine content in the LDPE and paraffin products post separation was maximized to ∼55% and ∼56%, respectively, at 130°C, chlorine flow rate 350 mL·min−1, 10% LDPE concentration in paraffin and agitation speed of 400 rpm. Product characterization using FTIR and 1HNMR spectroscopy confirmed the formation of the C–Cl bond in LDPE and paraffin post co-chlorination. The final co-chlorinated LDPE product compared well with LDPE chlorinated in CCl4 in terms of chlorine content, solubility in toluene, pH, and absorbance. Co-chlorination can be extended to other polymers like polypropylene and polyvinyl chloride, which today adopt solvent or suspension-based processes in practice for chlorination. However, a similar study will need to be carried out to identify operating conditions and confirm the efficacy of chlorination. While the results obtained present an excellent case to promote co-chlorination, addressing issues related to the reaction kinetics, reactor design, and process development will be the key drivers for the successful application of this concept on a large scale. It is also proposed to extend the above work to understand the chlorination of biodegradable polyolefins in paraffin.
Acknowledgment
The support provided for this work by the Analytical Science and Technology (AS&T) Division of Aditya Birla Science and Technology Co. Pvt. Ltd. is gratefully acknowledged.
-
Funding information: The authors state no funding is involved.
-
Author contributions: Vinod More: investigation, validation, writing – original draft, formal analysis; Srinivas Krishnaswamy: conceptualization, writing – original draft, writing – review and editing, supervision, resources, project administration; Madan Kumar Singh: writing – review and editing, supervision, resources, project administration; Krishnaswamy Ponnani: conceptualization, writing – review and editing.
-
Conflict of interest: Authors state no conflict of interest.
-
Data availability statement: The data set generated during and/or analyzed during the current study can be made available on request.
References
[1] Siegmann A, Hiltner A. Impact modification of poly(vinyl chloride) with chlorinated polyethylene I. Blend morphology. Polym Eng Sci. 1984;24:869–76. 10.1002/pen.760241106.Search in Google Scholar
[2] Ventresca DA, Berard MT. Increasing filler concentrations in PVC compounds using CPE. J Vinyl Addit Technol. 1997;3:274–8. 10.1002/vnl.10205.Search in Google Scholar
[3] Kutz M. Applied plastics engineering handbook: processing, materials, and applications. 2nd edn.; Netherlands: Elsevier Science; 2016.Search in Google Scholar
[4] Peter D. Speciality and high performance rubbers. England: RAPRA Technology LTD; 1997.Search in Google Scholar
[5] Stelescu MD. Physico-mechanical characteristics of some EPDM/plasticized PVC blends. Macromol Symp. 2008;263:70–7. 10.1002/masy.200850309.Search in Google Scholar
[6] Hu W, Bai Y, Zhang C, Li N, Cheng B. Coating based on the modified chlorinated polypropylene emulsion for promoting printability of biaxially oriented polypropylene film. J Adhes Sci Technol. 2017;32:50–67. 10.1080/01694243.2017.1341191.Search in Google Scholar
[7] Bhandari S, Chandra S. Chlorinated resins and polymers: a survey of the present state. Prog Org Coat. 1993;23:155–82. 10.1016/0033-0655(93)80009-Y.Search in Google Scholar
[8] Moradi A, Abadi ARS, Shahrokhi M. Characterization and kinetics study of the photochlorination of polyethylene. Polym J. 2012;44:973–7. 10.1038/pj.2012.42.Search in Google Scholar
[9] Korolev BM, Kosorotov VI, Kirillov AN, Yegunov AV, Chertorizhskii AV, Dzhagatspanyan RV. The radiation chlorination of polyethylene in CCl4 solution. Polym Sci USSR. 1974;16:3173–8. 10.1016/0032-3950(74)90313-X.Search in Google Scholar
[10] Friese K, Hößelbarth B, Reinhardt J, Newe R. A novel process for the chlorination of polymers in solution. Angew Makromol Chem. 1996;234:119–32. 10.1002/apmc.1996.052340111.Search in Google Scholar
[11] Mukherjee AK, Patri M. Thermal chlorination of atactic polypropylene. Die Angew Makromol Chem. 1988;163:23–35. 10.1002/apmc.1988.051630103.Search in Google Scholar
[12] Liu X, Xia C, Wang M, Wang J, Liu Z. Suspension chlorination of waste ethylene polymer film. Polym - Plast Technol Eng. 1996;35:857–63. 10.1080/03602559608000603.Search in Google Scholar
[13] Puszyński A, Godniak E. Chlorination of polyethylene in suspension in the presence of heavy metal salts. Die Makromol Chem Rapid Commun. 1980;1:617–20. 10.1002/marc.1980.030011004.Search in Google Scholar
[14] Razmirad MR, Moradi A. Characterization and structural study of chlorinated polyethylene production in suspension phase. Chem Technol An Indian J. 2012;7:1–8.Search in Google Scholar
[15] Naotoshi Watanabe T, Masukawa K, Ozaki I, Moriwak N. Process for production of chlorinated ethylene-propylene copolymers. U.S. Patent 5466757A; 1995.Search in Google Scholar
[16] Mitani K, Ogata T, Iwasaki M. Chlorine distribution and structure–property relationship of chlorinated polypropylene. J Polym Sci Polym Chem Ed. 1974;12:1653–69. 10.1002/pol.1974.170120806.Search in Google Scholar
[17] Nose S, Takayama S, Kodama T. Process for producing chlorinated polyethylene. JP patent document 1974-9632/B/; 1970.Search in Google Scholar
[18] Stoeva S, Tsocheva D, Terlemezyan L. Thermal behavior and characterization of solid-state chlorinated polyethylenes. J Therm Anal Calorim. 2006;85:439–47. 10.1007/s10973-005-7296-1.Search in Google Scholar
[19] Stoeva S, Vlaev L. Kinetics of the solid-state chlorination of high-density polyethylene. Macromol Chem Phys. 2002;203:346–53. 10.1002/1521-3935(20020101)203:2<346: AID-MACP346>3.0.CO;2-7.Search in Google Scholar
[20] Zhang X, Yang Q, Mao D, Cheng Y. Experimental study on thermal and UV-enhanced gas-solid chlorination of high-density polyethylene. Int J Chem React Eng. 2018;16:1–11. 10.1515/ijcre-2017-0254.Search in Google Scholar
[21] Wang Y, Liu L, Jing Z, Zhao J, Feng Y. Synthesis of chlorinated and anhydride-modified low density polyethylene by solid-phase chlorination and grafting - Improving the adhesion of a film-forming polymer. RSC Adv. 2014;4:12490–6. 10.1039/c3ra47562j.Search in Google Scholar
[22] Stoeva S. Structural and conformational changes in solid-phase chlorinated polyethylene. J Appl Polym Sci. 2004;94:189–96. 10.1002/app.20854.Search in Google Scholar
[23] Mao D, Yang Q, Zhang X, Cheng Y. UV-enhanced gas-solid chlorination of polyvinyl chloride for cleaner production of chlorinated polyvinyl chloride. Chem Eng Technol. 2016;39:834–40. 10.1002/ceat.201500716.Search in Google Scholar
[24] Honsberg W, Ennis RE, Beaumont T. Process for bimodal chlorination of Polyethyelene U.S. patent 474975; 1988.Search in Google Scholar
[25] Ishida Y, Okayama K. Process for producing chlorinated polyolefin, U.S. Patent 5290879; 1994.Search in Google Scholar
[26] Tan K-L, Lu Y-Z, Sun A-J, Li C-X, Wang Z-H. Union production of low chlorinated polyethylene and chlorinated paraffin via a carbon tetrachloride solvent free process. J Appl Polym Sci. 2009;111:63–9. 10.1002/app.29048.Search in Google Scholar
[27] Tan KL, Li CX, Lu YZ, Wang ZH. Unified production of chlorinated isotactic polypropylene and chlorinated paraffin via a solvent free chlorination process. Polym Eng Sci. 2009;49:1587–93. 10.1002/pen.21379.Search in Google Scholar
[28] Akovali G, Vatansever A. Notes on chlorinated polyethylene: Its preparation, some mechanical and thermal properties. Polym Eng Sci. 1986;26:1195–9. 10.1002/pen.760261706.Search in Google Scholar
[29] Abdumavlyanova MK, Magrupov FA. Chlorination of low molecular weight polyethylene. Plast Massy. 2006;12:9–12.10.1177/0307174X0603301004Search in Google Scholar
[30] Bhagabati P, Chaki TK. Compatibility study of chlorinated polyethylene/ethylene methacrylate copolymer blends using thermal, mechanical, and chemical analysis. J Appl Polym Sci. 2014;131(1–9):1–9. 10.1002/app.40316.Search in Google Scholar
[31] Kesti S, Sharana S. Physical and chemical characterization of low density polyethylene and high density polyethylene. J Adv Sci Res. 2019;10(3):30–4. http://www.sciensage.info/jasr%0AISSN.Search in Google Scholar
[32] Charles J, Ramkumaar GR. Qualitative analysis of high density polyethylene using FTIR spectroscopy. Asian J Chem. 2009;21:4477–84.Search in Google Scholar
[33] Krimm S, Liang CY, Sutherland GBBM. Infrared spectra of high polymers. II. Polyethylene. J Chem Phys. 1956;25:549–62. 10.1063/1.1742963.Search in Google Scholar
[34] Nambu K. Studies on chlorinated polyethylenes. I. Infrared spectra of chlorinated polyethylenes. J Appl Polym Sci. 1960;4:69–73. 10.1002/app.1960.070041010.Search in Google Scholar
[35] Gusev MN, Kissin YV, Voronovitskii MM, Berlin AA. Investigation of chloroparaffin structure by IR spectroscopy. Pet Chem USSR. 1968;8:138–45. 10.1016/0031-6458(68)90029-4.Search in Google Scholar
[36] Lopes CMA, Felisberti MI. Composite of low-density polyethylene and aluminum obtained from the recycling of postconsumer aseptic packaging. J Appl Polym Sci. 2006;101:3183–91. 10.1002/app.23406.Search in Google Scholar
[37] Omar MF, Akil HM, Ahmad ZA. Effect of molecular structures on dynamic compression properties of polyethylene. Mater Sci Eng A. 2012;538:125–34. 10.1016/j.msea.2011.12.111.Search in Google Scholar
[38] Rusu M, Sofian N, Rusu D. Mechanical and thermal properties of zinc powder filled high density polyethylene composites. Polym Test. 2001;20:409–17. 10.1016/S0142-9418(00)00051-9.Search in Google Scholar
[39] Kamweru PK, Ndiritu FG, Kinyanjui T, Muthui ZW, Gichuki R. UV Absorption and dynamic mechanical analysis of polyethylene films. Int J Phys Sci. 2014;9:545–55. 10.5897/IJPS2014.4229.Search in Google Scholar
[40] Moradi A, Ramazani A, Shahrokhi M. Radical chlorination of polyethylene and molecular structure characterization of reaction products. Polym J. 2005;37:661–8. 10.1295/polymj.37.661.Search in Google Scholar
[41] Lunt MF, Park S, Li S, Henne S, Manning AJ, Ganesan AL, et al. Continued Emissions of the Ozone‐Depleting Substance Carbon Tetrachloride From Eastern Asia. Geophys Res Lett. 2018;45:11423–30. 10.1029/2018GL079500.Search in Google Scholar
© 2022 Vinod Kadu More et al., published by De Gruyter
This work is licensed under the Creative Commons Attribution 4.0 International License.
Articles in the same Issue
- Research Articles
- Kinetic study on the reaction between Incoloy 825 alloy and low-fluoride slag for electroslag remelting
- Black pepper (Piper nigrum) fruit-based gold nanoparticles (BP-AuNPs): Synthesis, characterization, biological activities, and catalytic applications – A green approach
- Protective role of foliar application of green-synthesized silver nanoparticles against wheat stripe rust disease caused by Puccinia striiformis
- Effects of nitrogen and phosphorus on Microcystis aeruginosa growth and microcystin production
- Efficient degradation of methyl orange and methylene blue in aqueous solution using a novel Fenton-like catalyst of CuCo-ZIFs
- Synthesis of biological base oils by a green process
- Efficient pilot-scale synthesis of the key cefonicid intermediate at room temperature
- Synthesis and characterization of noble metal/metal oxide nanoparticles and their potential antidiabetic effect on biochemical parameters and wound healing
- Regioselectivity in the reaction of 5-amino-3-anilino-1H-pyrazole-4-carbonitrile with cinnamonitriles and enaminones: Synthesis of functionally substituted pyrazolo[1,5-a]pyrimidine derivatives
- A numerical study on the in-nozzle cavitating flow and near-field atomization of cylindrical, V-type, and Y-type intersecting hole nozzles using the LES-VOF method
- Synthesis and characterization of Ce-doped TiO2 nanoparticles and their enhanced anticancer activity in Y79 retinoblastoma cancer cells
- Aspects of the physiochemical properties of SARS-CoV-2 to prevent S-protein receptor binding using Arabic gum
- Sonochemical synthesis of protein microcapsules loaded with traditional Chinese herb extracts
- MW-assisted hydrolysis of phosphinates in the presence of PTSA as the catalyst, and as a MW absorber
- Fabrication of silicotungstic acid immobilized on Ce-based MOF and embedded in Zr-based MOF matrix for green fatty acid esterification
- Superior photocatalytic degradation performance for gaseous toluene by 3D g-C3N4-reduced graphene oxide gels
- Catalytic performance of Na/Ca-based fluxes for coal char gasification
- Slow pyrolysis of waste navel orange peels with metal oxide catalysts to produce high-grade bio-oil
- Development and butyrylcholinesterase/monoamine oxidase inhibition potential of PVA-Berberis lycium nanofibers
- Influence of biosynthesized silver nanoparticles using red alga Corallina elongata on broiler chicks’ performance
- Green synthesis, characterization, cytotoxicity, and antimicrobial activity of iron oxide nanoparticles using Nigella sativa seed extract
- Vitamin supplements enhance Spirulina platensis biomass and phytochemical contents
- Malachite green dye removal using ceramsite-supported nanoscale zero-valent iron in a fixed-bed reactor
- Green synthesis of manganese-doped superparamagnetic iron oxide nanoparticles for the effective removal of Pb(ii) from aqueous solutions
- Desalination technology for energy-efficient and low-cost water production: A bibliometric analysis
- Biological fabrication of zinc oxide nanoparticles from Nepeta cataria potentially produces apoptosis through inhibition of proliferative markers in ovarian cancer
- Effect of stabilizers on Mn ZnSe quantum dots synthesized by using green method
- Calcium oxide addition and ultrasonic pretreatment-assisted hydrothermal carbonization of granatum for adsorption of lead
- Fe3O4@SiO2 nanoflakes synthesized using biogenic silica from Salacca zalacca leaf ash and the mechanistic insight into adsorption and photocatalytic wet peroxidation of dye
- Facile route of synthesis of silver nanoparticles templated bacterial cellulose, characterization, and its antibacterial application
- Synergistic in vitro anticancer actions of decorated selenium nanoparticles with fucoidan/Reishi extract against colorectal adenocarcinoma cells
- Preparation of the micro-size flake silver powders by using a micro-jet reactor
- Effect of direct coal liquefaction residue on the properties of fine blue-coke-based activated coke
- Integration of microwave co-torrefaction with helical lift for pellet fuel production
- Cytotoxicity of green-synthesized silver nanoparticles by Adansonia digitata fruit extract against HTC116 and SW480 human colon cancer cell lines
- Optimization of biochar preparation process and carbon sequestration effect of pruned wolfberry branches
- Anticancer potential of biogenic silver nanoparticles using the stem extract of Commiphora gileadensis against human colon cancer cells
- Fabrication and characterization of lysine hydrochloride Cu(ii) complexes and their potential for bombing bacterial resistance
- First report of biocellulose production by an indigenous yeast, Pichia kudriavzevii USM-YBP2
- Biosynthesis and characterization of silver nanoparticles prepared using seeds of Sisymbrium irio and evaluation of their antifungal and cytotoxic activities
- Synthesis, characterization, and photocatalysis of a rare-earth cerium/silver/zinc oxide inorganic nanocomposite
- Developing a plastic cycle toward circular economy practice
- Fabrication of CsPb1−xMnxBr3−2xCl2x (x = 0–0.5) quantum dots for near UV photodetector application
- Anti-colon cancer activities of green-synthesized Moringa oleifera–AgNPs against human colon cancer cells
- Phosphorus removal from aqueous solution by adsorption using wetland-based biochar: Batch experiment
- A low-cost and eco-friendly fabrication of an MCDI-utilized PVA/SSA/GA cation exchange membrane
- Synthesis, microstructure, and phase transition characteristics of Gd/Nd-doped nano VO2 powders
- Biomediated synthesis of ZnO quantum dots decorated attapulgite nanocomposites for improved antibacterial properties
- Preparation of metal–organic frameworks by microwave-assisted ball milling for the removal of CR from wastewater
- A green approach in the biological base oil process
- A cost-effective and eco-friendly biosorption technology for complete removal of nickel ions from an aqueous solution: Optimization of process variables
- Protective role of Spirulina platensis liquid extract against salinity stress effects on Triticum aestivum L.
- Comprehensive physical and chemical characterization highlights the uniqueness of enzymatic gelatin in terms of surface properties
- Effectiveness of different accelerated green synthesis methods in zinc oxide nanoparticles using red pepper extract: Synthesis and characterization
- Blueprinting morpho-anatomical episodes via green silver nanoparticles foliation
- A numerical study on the effects of bowl and nozzle geometry on performances of an engine fueled with diesel or bio-diesel fuels
- Liquid-phase hydrogenation of carbon tetrachloride catalyzed by three-dimensional graphene-supported palladium catalyst
- The catalytic performance of acid-modified Hβ molecular sieves for environmentally friendly acylation of 2-methylnaphthalene
- A study of the precipitation of cerium oxide synthesized from rare earth sources used as the catalyst for biodiesel production
- Larvicidal potential of Cipadessa baccifera leaf extract-synthesized zinc nanoparticles against three major mosquito vectors
- Fabrication of green nanoinsecticides from agri-waste of corn silk and its larvicidal and antibiofilm properties
- Palladium-mediated base-free and solvent-free synthesis of aromatic azo compounds from anilines catalyzed by copper acetate
- Study on the functionalization of activated carbon and the effect of binder toward capacitive deionization application
- Co-chlorination of low-density polyethylene in paraffin: An intensified green process alternative to conventional solvent-based chlorination
- Antioxidant and photocatalytic properties of zinc oxide nanoparticles phyto-fabricated using the aqueous leaf extract of Sida acuta
- Recovery of cobalt from spent lithium-ion battery cathode materials by using choline chloride-based deep eutectic solvent
- Synthesis of insoluble sulfur and development of green technology based on Aspen Plus simulation
- Photodegradation of methyl orange under solar irradiation on Fe-doped ZnO nanoparticles synthesized using wild olive leaf extract
- A facile and universal method to purify silica from natural sand
- Green synthesis of silver nanoparticles using Atalantia monophylla: A potential eco-friendly agent for controlling blood-sucking vectors
- Endophytic bacterial strain, Brevibacillus brevis-mediated green synthesis of copper oxide nanoparticles, characterization, antifungal, in vitro cytotoxicity, and larvicidal activity
- Off-gas detection and treatment for green air-plasma process
- Ultrasonic-assisted food grade nanoemulsion preparation from clove bud essential oil and evaluation of its antioxidant and antibacterial activity
- Construction of mercury ion fluorescence system in water samples and art materials and fluorescence detection method for rhodamine B derivatives
- Hydroxyapatite/TPU/PLA nanocomposites: Morphological, dynamic-mechanical, and thermal study
- Potential of anaerobic co-digestion of acidic fruit processing waste and waste-activated sludge for biogas production
- Synthesis and characterization of ZnO–TiO2–chitosan–escin metallic nanocomposites: Evaluation of their antimicrobial and anticancer activities
- Nitrogen removal characteristics of wet–dry alternative constructed wetlands
- Structural properties and reactivity variations of wheat straw char catalysts in volatile reforming
- Microfluidic plasma: Novel process intensification strategy
- Antibacterial and photocatalytic activity of visible-light-induced synthesized gold nanoparticles by using Lantana camara flower extract
- Antimicrobial edible materials via nano-modifications for food safety applications
- Biosynthesis of nano-curcumin/nano-selenium composite and their potentialities as bactericides against fish-borne pathogens
- Exploring the effect of silver nanoparticles on gene expression in colon cancer cell line HCT116
- Chemical synthesis, characterization, and dose optimization of chitosan-based nanoparticles of clodinofop propargyl and fenoxaprop-p-ethyl for management of Phalaris minor (little seed canary grass): First report
- Double [3 + 2] cycloadditions for diastereoselective synthesis of spirooxindole pyrrolizidines
- Green synthesis of silver nanoparticles and their antibacterial activities
- Review Articles
- A comprehensive review on green synthesis of titanium dioxide nanoparticles and their diverse biomedical applications
- Applications of polyaniline-impregnated silica gel-based nanocomposites in wastewater treatment as an efficient adsorbent of some important organic dyes
- Green synthesis of nano-propolis and nanoparticles (Se and Ag) from ethanolic extract of propolis, their biochemical characterization: A review
- Advances in novel activation methods to perform green organic synthesis using recyclable heteropolyacid catalysis
- Limitations of nanomaterials insights in green chemistry sustainable route: Review on novel applications
- Special Issue: Use of magnetic resonance in profiling bioactive metabolites and its applications (Guest Editors: Plalanoivel Velmurugan et al.)
- Stomach-affecting intestinal parasites as a precursor model of Pheretima posthuma treated with anthelmintic drug from Dodonaea viscosa Linn.
- Anti-asthmatic activity of Saudi herbal composites from plants Bacopa monnieri and Euphorbia hirta on Guinea pigs
- Embedding green synthesized zinc oxide nanoparticles in cotton fabrics and assessment of their antibacterial wound healing and cytotoxic properties: An eco-friendly approach
- Synthetic pathway of 2-fluoro-N,N-diphenylbenzamide with opto-electrical properties: NMR, FT-IR, UV-Vis spectroscopic, and DFT computational studies of the first-order nonlinear optical organic single crystal