Fe3+ and Ce3+ modified nano-TiO2 for degradation of exhaust gas in tunnels
-
Yin Luo
 ,
Zhong Qin
,
Zhong Qin

Abstract
To solve the environmental pollution caused by automobile exhaust in a tunnel, this study has developed a modified nano-TiO2 based on Fe3+ and Ce3+. The modified nano-TiO2 is prepared by the sol–gel method, and the modification adopts Fe3+ single-doping, Ce3+ sing-doping, and co-doping. The properties were also characterized by X-ray diffraction analysis, UV-vis diffuse reflectance analysis, fluorescence spectroscopy analysis, specific surface area analysis, and paramagnetic resonance popper analysis. The analyses showed that the doping of ions would change the energy band structure of nano-TiO2 and produce crystal defects, thus improving the photocatalytic activity. Then, a self-fabricated exhaust gas degradation device was used to carry out the exhaust gas degradation experiments. The results showed that the modification improves the catalytic efficiency of nano-TiO2, and Fe3+, Ce3+ co-doping > Ce3+ single-doping > Fe3+ single-doping > pure TiO2. At the dosage of 0.5%, the maximum degradation efficiencies of NO and CO before compensation are 53.85% and 16.39%, respectively, and the maximum degradation rates are 1.04 and 0.93 ppm·min−1. After compensation, the maximum degradation efficiencies of NO and CO are 20.14% and 6.04%, respectively. The maximum degradation rate is 0.40 and 0.41 ppm·min−1, respectively.
1 Introduction
In 2017, the number of motor vehicles in China had reached 310 million, and the total emission of motor vehicle exhaust pollutants reached 43,597,000 tons. The substantial exhaust emissions will threaten human beings’ living environment if not treated in time. The automobile exhaust mainly includes CO, HC, NOx, CO2, and CO and easily binds to hemoglobin which will cause human hypoxia. HC and NOx can form toxic fumes through the action of ultraviolet light, and can also cause discomforts, such as dizziness, chest tightness [1], and even cancer [2,3,4]. Nano-TiO2 has the following advantages [5,6,7]: (i) low price, simple preparation equipment, and non-toxic; (ii) strong photocatalytic performance and strong redox ability; (iii) excellent chemical stability and corrosion resistance; (iv) suitable forbidden bandwidth (3.2 eV) and can effectively absorb ultraviolet light with wavelengths less than 387 nm in sunlight, etc. Therefore, compared with other catalysts, nano-TiO2 has obvious advantages that make it the most widely used.
In 1972, Japanese scientists Fujishima and Honda [8] discovered that TiO2 single-crystal electrodes could decompose water, which started the research on photocatalytic materials. In 1976, Frank [9,29] proposed that semiconductor materials could be used for photocatalytic degradation of organic pollutants, which opened the door to the application of photocatalytic materials. At the end of the 20th century, Japanese scholars [30] proposed the concept of the photocatalytic highway. They used various ways to improve the photocatalytic activity of nano-TiO2, among which the main ones are surface noble metal deposition [31], surface photosensitization [32], composite semiconductors [33], ion doping, etc. [34]. Meng and Liu [35] sprayed a lipophilic permeate containing nano-TiO2 into asphalt pavement. They have used scanning electron microscopy to observe the distribution of TiO2 after penetrating into the interior of the asphalt pavement voids. The effects of humidity, light intensity, and other factors on the photocatalytic efficiency of the eco-friendly asphalt pavement were investigated. The results showed that the catalytic efficiency first increased and then slightly decreased with the increase in air humidity, and the stronger the light and the shorter the wavelength, the higher the photocatalytic efficiency. Hassan et al. [36] studied the wear resistance of concrete pavements coated with TiO2 photocatalysts and evaluated the effect of coated photocatalysts on the wear resistance of the concrete pavements by controlling the light intensity and air humidity to simulate different test environments. They have used scanning electron microscopy and energy electron spectroscopy to determine the concentration distribution of ions after TiO2 coating, and high degradation efficiency of 26.9% was achieved for NOx removal at 5% of TiO2 doping concentration. Vaiano et al. [37] used the sol–gel method to prepare N-doped nano-TiO2 and loaded them onto glass microspheres to prepare coatings with photocatalytic functions. Larumbe et al. [38] used the sol–gel method to prepare N and Fe co-doped nano-TiO2. They analyzed the effect of ion doping on the structure of nano-TiO2, magnetic properties, and photocatalytic properties. Heather et al. [39] studied the degradation effect of concrete pavement coated with TiO2 photocatalyst on NOx. The results showed that the degradation effect was significant at an air relative humidity of 25%. Shang [10] used hot asphalt as a carrier to load photocatalytic materials so that they could adhere to the road surface or in the void, and achieve the purpose of decomposing NOx under the irradiation of visible light. Tan et al. [11] used doping to study the effect of exhaust gas degradation and investigated various road properties of doped asphalt mixes. The results showed that photocatalysts using doping hardly affect the multiple properties of asphalt mixes. Although nano-TiO2 has many advantages as a photocatalyst, it has a wide energy bandgap. It can only use ultraviolet light in sunlight to trigger an electron leap. It does not absorb visible light, which accounts for 45% of sunlight [12,13], so the utilization of sunlight is extremely low.
In this study, for the poor ventilation conditions and low light intensity in the tunnel, a high-pressure sodium lamp with high penetrating power and high luminous efficiency is used as the light source, unlike the previous incandescent lamp. Based on the previous studies, Fe3+ single doping, Ce3+ single doping, and co-doping are used to modify the nano-TiO2 to study the modification principle and effect of metal ions to achieve the adjustment of TiO2 energy band structure, so that it can absorb and utilize visible light. X-ray diffraction (XRD) analysis shows that the doping of ions will reduce the size of nano-TiO2. UV-Vis diffuse reflectance analysis shows that the doping of ions causes a significant redshift in the absorption band of nano-TiO2. Fluorescence spectroscopy analysis shows that the doping of ions decreases the probability of electron-hole complexation. The specific surface area analysis shows that the doping of ions causes the pore size of nano-TiO2 to become smaller and the surface area to increase. Paramagnetic resonance popper analysis shows that the doping of ions increases the number of electron-hole pairs and generates more reactive radicals. This experiment used AC-13 asphalt mixture rutting slabs to simulate tunnel pavement and then conducted tail gas degradation tests using a self-fabricated tail gas degradation device, which can simulate the tunnel environment to the maximum extent. The exhaust gas generation device is a standard exhaust gas tank, which can ensure the consistency of the initial concentration to the greatest extent, and compensate for the experimental error by using the blank group experiment. Finally, the best modifier and its optimal doping amount were determined to provide a method and basis for the subsequent photocatalyst modification research.
2 Materials and methods
2.1 Experimental reagents and experimental apparatus
The nano-TiO2 and modified nano-TiO2 were prepared by the sol–gel method [14,15,16,17,28]. The primary reagents were butyl titanate (analytical purity), anhydrous ethanol (superior purity), glacial acetic acid (analytical purity), deionized water (analytical purity), cerium chloride (analytical purity), ferric chloride (analytical purity), etc. The central apparatus are constant temperature magnetic stirrer (HS-19), vacuum drying oven (DZF-6050), muffle furnace (SX2-2.5-10), etc. The costs of various reagents are shown in Table 1.
Experimental reagent and cost
| Experimental reagent | Butyl titanate/500 mL | Anhydrous ethanol/500 mL | Ice acetic acid/500 mL | Ferric chloride/500 g | Cerium chloride/25 g |
|---|---|---|---|---|---|
| Cost (yuan) | 33.00 | 28.00 | 33.00 | 37.24 | 37.00 |
2.2 Experimental steps
The specific steps for the preparation of nano-TiO2 and modified nano-TiO2 by the sol–gel method are as follows:
25 mL of anhydrous ethanol and 5 mL of glacial acetic acid was poured into a beaker at room temperature. Then, 17 mL of butyl titanate was slowly added with uniform stirring using a magnetic stirrer and stirred for 30 min to obtain a uniform and transparent light yellow solution A.
20 mL of anhydrous ethanol, 5 mL of glacial acetic acid, and 10 mL of deionized water was thoroughly mixed at room temperature and a few drops of hydrochloric acid was added to control the pH of the solution between 2 and 3 to form solution B. Then, place it in a separatory funnel and set aside. Add 0.1%, 0.5%, and 1% of Fe3+, Ce3+ relative to the molar fraction of Ti atoms to make modified nano-TiO2.
The solution B was slowly added (1–2 drops per second) to the solution A to obtain the sol under the action of a thermostatic magnetic stirrer at a controlled temperature of 30°C. Attention was paid so that the speed of the dropping was not be too fast to prevent the butyl titanate from hydrolyzing too fast, and the gel was obtained by aging for a while.
The gel was dried in a vacuum drying oven at 80°C for 24 h to get a dry gel.
The dry gel was crushed in a mortar and then placed in a muffle furnace and calcined at 500°C for 2 h to obtain nano-TiO2. Nano-TiO2 sols and nano-TiO2 particles are shown in Figure 1.
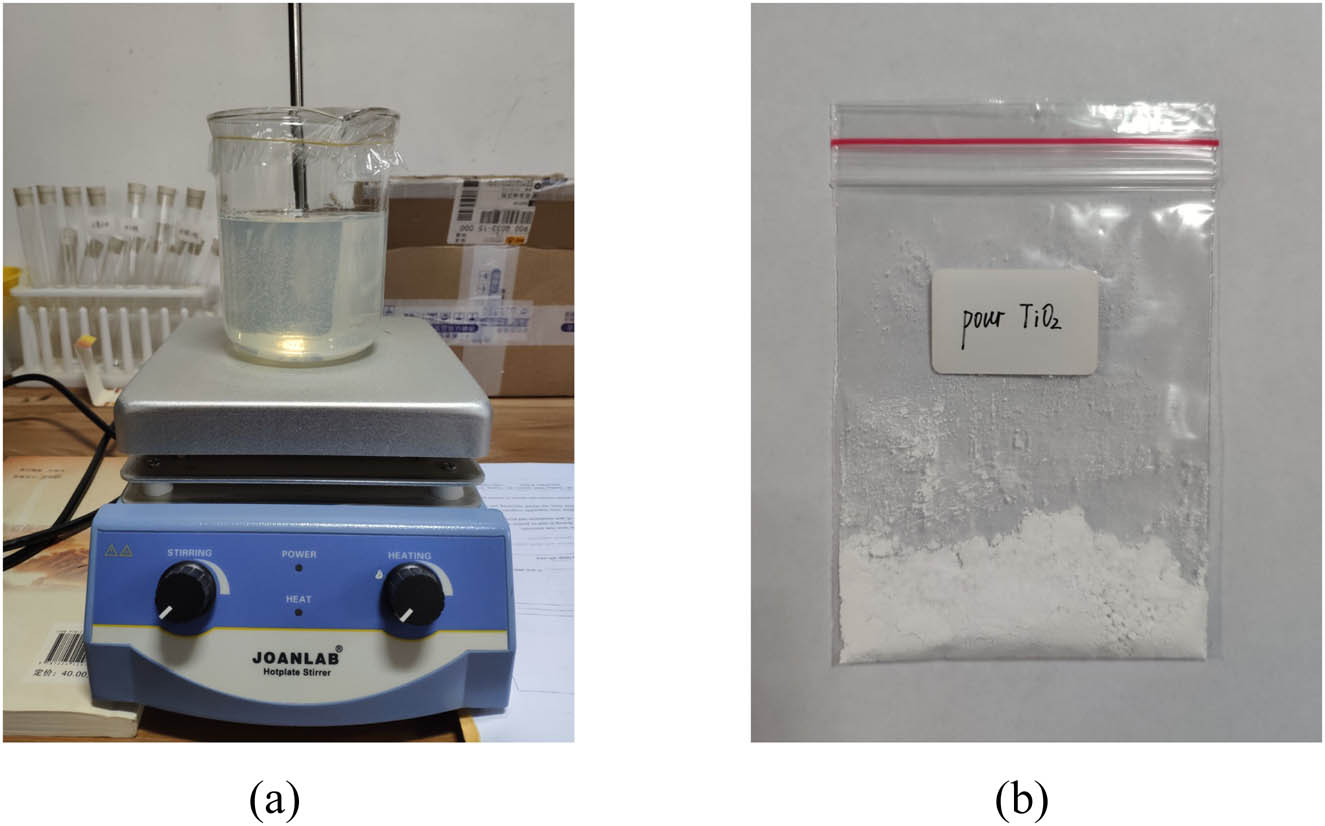
(a) The sol of TiO2 and (b) the particles of TiO2.
The yield of nano-TiO2 in the theoretical case is 4 g. The orthogonal experiments of nano-TiO2 obtained under different conditions are given in Table 2.
Orthogonal test table for preparation of TiO2
| Serial number | Dissolution time of butyl titanate (min) | Gel placement time (days) | Calcination temperature (°C) | Calcination time (h) | Capacity (g) |
|---|---|---|---|---|---|
| 1 | 30 | 5 | 450 | 1 | 4.123 |
| 2 | 30 | 10 | 500 | 2 | 4.003 |
| 3 | 30 | 15 | 550 | 3 | 3.987 |
| 4 | 60 | 5 | 500 | 3 | 3.991 |
| 5 | 60 | 10 | 550 | 1 | 4.025 |
| 6 | 60 | 15 | 450 | 2 | 4.124 |
| 7 | 90 | 5 | 550 | 2 | 3.977 |
| 8 | 90 | 10 | 450 | 3 | 3.926 |
| 9 | 90 | 15 | 500 | 1 | 4.029 |
The dissolution speed of butyl titanate is too fast and white flocculent is easily formed, while the dissolution speed is too slow and it is not easy to form a sol. Generally, the sol contains many tiny bubbles after it is made, and a series of chemical reactions will occur subsequently. Hence, it needs to be placed for a while to make the butyl titanate fully hydrolyzed. Calcination temperature and calcination time mainly affect the crystalline structure. When the temperature is 400°C, the crystalline form is mostly anatase phase, but the crystallization is not complete; when the temperature is 500°C, the crystalline form is completely anatase phase; when temperature increases, the material will be transformed from anatase phase to rutile phase, and the photocatalytic activity is reduced. With close to theoretical yield as the standard, the dissolution time of butyl titanate should be selected for 30 min, gel placed for 10 days, and calcination for 2 h at 500°C.
2.3 Photocatalytic principle
As a semiconductor material, the electronic energy level of nano-TiO2 is discontinuous, in which there are empty energy level regions, so there are both full and empty bands. The bottom full band is called the valence band, the top empty band is called the conduction band, and the region from the top of the valence band to the bottom of the conduction band is called the forbidden band or bandgap. When the photoelectrons’ energy is greater than or equal to the width of the forbidden band, the electrons in the valence band will be excited by light and jump to the conduction band, while the electrons in the valence band will generate holes due to the jump, forming electron-hole pairs. The electron-hole complex pair will be compounded under the action of an electric field and thus lose its activity. The electron-hole complex pair can react with H2O and O2, which are on the surface of nano-TiO2.
It can be seen from the above reactions that the electron-hole complex pair eventually generates superoxide ion radicals and hydroxyl radicals, which can oxidize CO and NO in the air into CO2, various carbonates, nitrates, etc., due to the strongly oxidizing properties of these radicals, so as to achieve the purpose of degrading the car exhaust to cure the environment, and the specific catalytic principle is shown in Figure 2 [18].

Schematic diagram of photocatalysis.
2.4 Test systems
The P750 gas catalytic reaction device, which was developed by the Cusson Company in the United States, calculates the catalytic conversion efficiency by testing the change in the gas concentration (mainly refers to the harmful gas of automobile exhaust gas) flowing through the reactor. However, the equipment could not perform to its full efficiency when it is applied to test the catalytic decomposition performance of asphalt mixture on automobile exhaust gas, and the reason is that the equipment cannot provide the light conditions needed for the photocatalytic reaction [20]. The auto-exhaust reaction test equipment was developed independently by Tohoku Forestry University [21], which contains an automobile exhaust gas supply system, computer-aided test system, gas chamber, and other multi-functional components and structures, with a variety of sensors (such as oxygen sensor, carbon dioxide sensor, hydrocarbon sensor, carbon monoxide sensor, pressure box, temperature sensor, etc.). However, due to the instability of the sensor, the device has the disadvantages of unstable reading and short service life. In this study, the actual situation in the tunnel is combined with the disadvantages of poor lighting conditions and poor ventilation in the tunnel, so a closed chamber is used to simulate the tunnel, and the light is a high-pressure sodium lamp, which is commonly used in such low-light conditions in the tunnel due to its high luminous efficiency, low power consumption, long life, and high penetration [22]. The test device consists explicitly of three parts: a standard exhaust gas tank, a closed reaction chamber, and an exhaust gas analyzer, as shown in Figure 3.
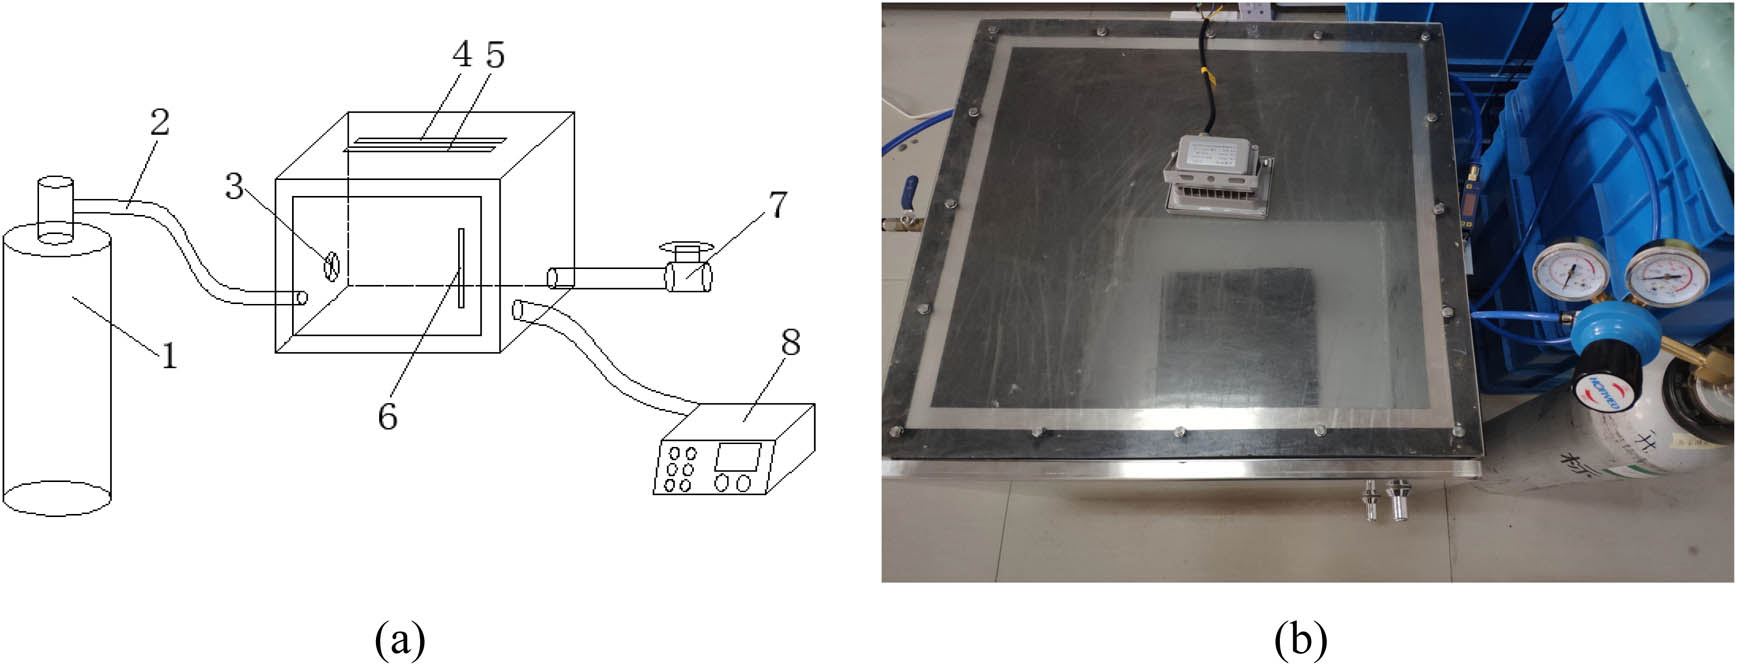
(a) Degradation system design drawing and (b) exhaust gas degradation test system; (1) standard exhaust gas tank, (2) air inlet pipe, (3) small fan, (4) high pressure sodium lamp, (5) UV lamp, (6) sealed door, (7) exhaust gas cleaning device, and (8) exhaust gas analyzer.
2.5 Photocatalytic material specimen preparation
The coating type in this study uses a water coating solution. In the process of preparing the coating solution, it is easy to precipitate in the process of preparation as the specific gravity of nano-TiO2 is 4.26, and nano-TiO2 is easy to disperse unevenly in water and produce agglomeration. Therefore, during the preparation, a certain amount of dispersing stabilizer needs to be added, and the addition amount is 10–20% of the mass of nano-TiO2. In the coating solution, water:nano-TiO2:dispersion stabilizer = 1%:2%:0.4%. The specific laboratory preparation steps are as follows: (1) Weigh a certain amount of water, dispersant, and stabilizer. Add the dispersant and stabilizer to the aqueous solution, and shear at 500 rpm for 5 min with a high-speed shearer. (2) Add nano-TiO2 to the above solution, and the water-based nano-TiO2 coating solution can be produced by shearing at a high speed of 2,000 rpm for 30 min with a high-speed shearer [23,24].
In this study, relying on the actual needs of the project, the AC-13 asphalt mixture is used, fine aggregate is limestone, coarse aggregate is basalt, oil to stone ratio is 5.0%, 70# matrix asphalt is used, and the gradation design is as shown in Table 3.
Gradation design
| Sieve hole (mm) | 16 | 13.2 | 9.5 | 4.75 | 2.36 | 1.18 | 0.6 | 0.3 | 0.15 | 0.075 |
| Target grading (%) | 100 | 96 | 77.5 | 49 | 32 | 21 | 15 | 10 | 7 | 5 |
The nano-TiO2 coating solution and the specimens covered with photocatalytic materials are shown in Figure 4.
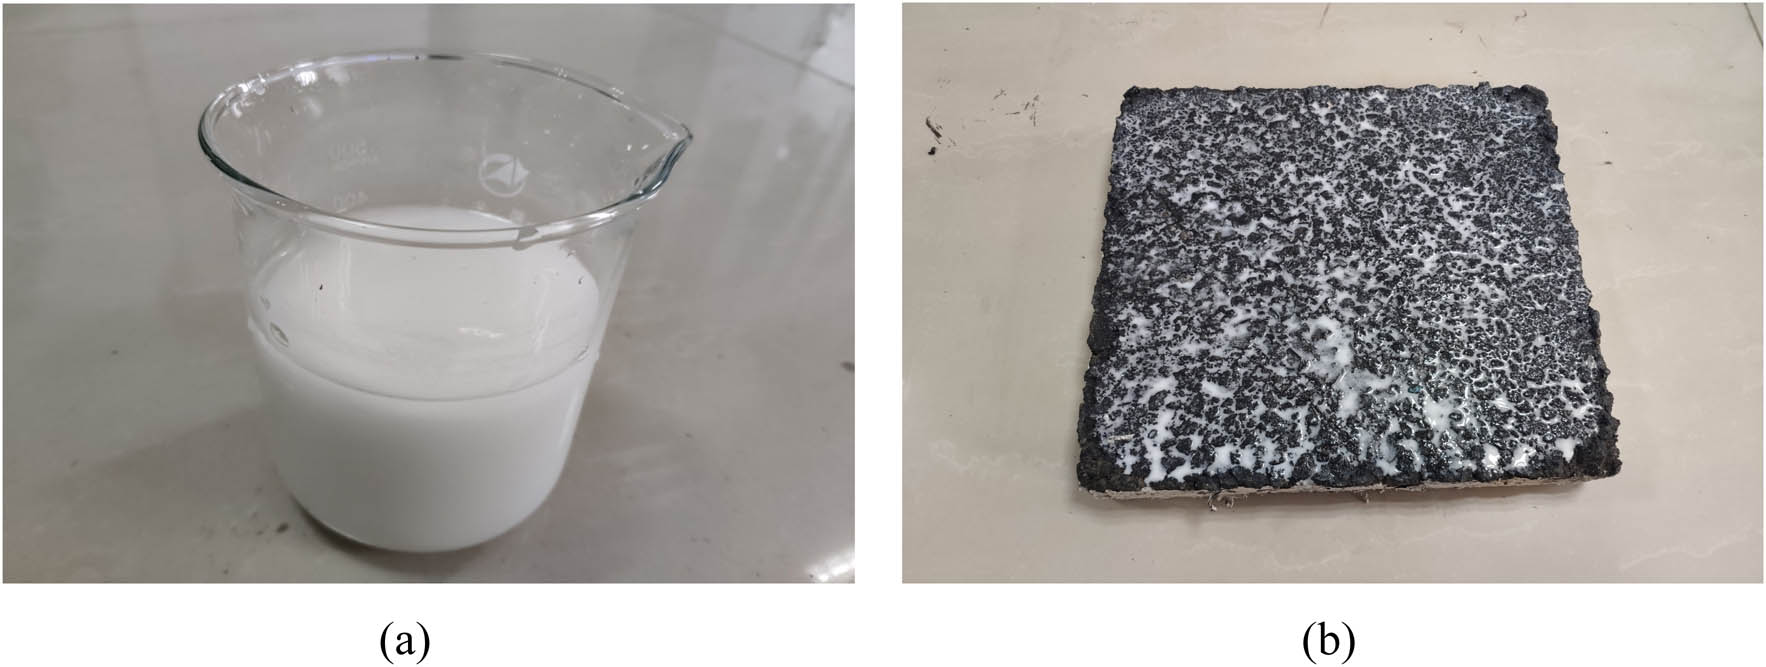
(a) The coating solution of nano-TiO2 and (b) specimen covered with photocatalytic material.
2.6 Evaluation indicators
Among the evaluation indices currently used to evaluate the performance of photocatalytic decomposition of vehicle exhaust, the cumulative decomposition rate (i.e., decomposition efficiency) is the most common evaluation index [25,26]. The cumulative decomposition rate is calculated in Eq. 7:
where η – cumulative decomposition rate, %; M 0 – initial concentration, ppm; and M 1 – final concentration, ppm.
The cumulative decomposition rate is one of the essential evaluation indicators for the reaction photocatalytic decomposition of automobile exhaust gas, as well as a quantitative indicator, but there are shortcomings that the indicator requires a fixed initial gas concentration of the test as well as a fixed closed reaction chamber.
In the process of photocatalytic degradation of automobile exhaust, the rate of gas concentration reduction is not always constant, which means that the gas concentration is not linearly related to time, so the decomposition rate is different at different periods. The average decomposition rate is an important index to react to different decomposition rates at different periods. The average decomposition rate is calculated in Eq. 8 [27]:
where v – average decomposition rate, ppm·min−1; and t – reaction time, min.
In this study, the average decomposition rate is differentiated based on the average decomposition rate, i.e., it is more time-sensitive. The concentration-time relationship graph is made with time as the horizontal coordinate and gas concentration as the vertical coordinate, which was then fitted by Origin to obtain the exhaust gas degradation curve, as shown in Figure 12. The slope of this curve indicates the decomposition rate.
3 Results and discussion
Nanomaterials are materials with at least one dimension in the nanoscale (1–100 nm) at the three-dimensional spatial scale, which is a typical mesoscopic system in the transition region at the junction of atomic clusters and macroscopic objects, neither microscopic nor macroscopic, with a series of specific physicochemical properties [19].
3.1 XRD
XRD uses the position and intensity of XRD diffraction angles to analyze the composition of minerals. It explores the phases of the substance based on the spacing of each crystal plane and the relative intensity of diffraction lines against PDF cards. By comparing the diffraction peaks of unknown substances with those of known substances, the various phases in the sample are derived. It can be derived from Figure 5 that the diffraction angles 2θ = 25.3, 37.9, 48.2, 54.1, 55.7, and 63.4, so the nano-TiO2 is anatase crystalline type, and these diffraction peaks belong to (101), (004), (200), (105), (211), and (204), respectively. The determination of XRD crystal size is related to the peak width of the diffraction peak and the material grain size, which is calculated in Eq. 9:
where D – grain size, nm; K – Scherrer constant, generally taken as 0.89; λ – wavelength of the rays, nm; B – half-peak width of the diffraction peak, rad; and θ – Bragg diffraction angle, °.
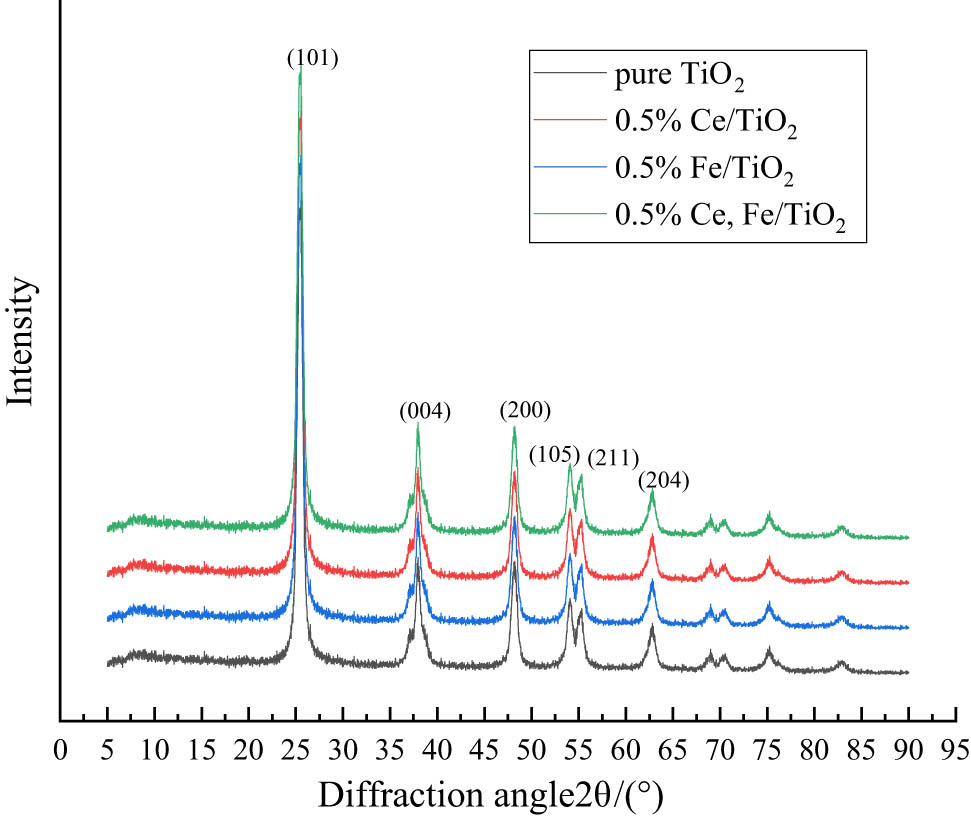
X-ray diffraction analysis.
This study used a DB-type X-ray diffractometer with the following technical parameters: Cu target K-α radiation (λ = 1.5406 nm), operating voltage of 40 kV, operating current of 150 mA, scan range of 5–90°, and scan rate of 10°·min−1. The calculation results of the relevant lattice parameters for different ion doping are displayed in Table 4.
Calculation results of grain size of TiO2 doped with different ions
| Parameters | Pure TiO2 | 0.5% of Fe/TiO2 | 0.5% of Ce/TiO2 | 0.5% of Ce, Fe/TiO2 |
|---|---|---|---|---|
| D | 16.75 | 15.97 | 14.48 | 13.16 |
| B | 0.4930 | 0.5056 | 0.5184 | 0.5213 |
As can be seen from Figure 5, the doping of Fe3+ and Ce3+ did not cause fundamental changes in the positions of the diffraction peaks of nano-TiO2, which indicates that the modified nano-TiO2 is still dominated by anatase. With the doping of ions, the diffraction peaks show specific regular changes. From Table 4, it can be concluded that the average grain size of Ce3+, Fe3+ co-doping is significantly smaller than that of pure TiO2. The ionic radius of Fe3+ is 0.064 nm and that of Ti4+ is 0.068 nm, and the difference between the ionic radii is not large, indicating that part of Fe3+ will replace Ti4+ and exist in the crystal lattice during the doping modification process. The entry of Fe3+ into the nano-TiO2 lattice will destroy the periodicity of the crystal plasmon arrangement, thus inducing crystal distortion and inhibiting the growth of TiO2 crystals. The ionic radius of Ce3+ is 0.102 nm, which is much larger than that of Ti4+, so the possibility of Ce3+ entering the TiO2 lattice to replace Ti4+ is negligible, but it may exist at the TiO2 grain boundary, i.e., the interface between two grains or microcrystals. On the one hand, it induces crystal distortion and form lattice defects. On the other hand, it will increase the diffusion energy barrier of atoms between grains and prevent direct contact between grains. Both of them will inhibit lattice growth, form lattice defects to trap photogenerated electrons, and reduce the probability of electron-hole complexation, thus improving photocatalytic activity.
3.2 UV-visible (UV-Vis) spectroscopy analysis
UV-Vis diffuse reflectance spectroscopy is the UV-Vis spectrum generated by using the degree of absorption of UV or visible light by the sample. This study used a UV 3600 Plus UV-Vis spectrophotometer with a scanning range of 200–900 nm.
The wavelengths of various kinds of light are composed of ultraviolet wavelength (below 400 nm), visible wavelength (400–760 nm), and infrared wavelength (above 760 nm). It can be seen from Figure 6 that the absorbance of nano-TiO2 decreases with the increase in the wavelength of light, which decreases dramatically between the wavelengths of 350–450 nm. In this interval, the rate of decline first increases and then decreases, that is, there is an inflection point, making a tangent line at the point. The intersection of the tangent line and the horizontal coordinate can roughly represent the maximum value of the absorbance wavelength. The tangent line drawn for each spectrum in Figure 6 concludes that the doping of ions will increase the wavelength of TiO2 response to visible light so that its absorption range is expanded from ultraviolet light to visible light. The co-doping effect is better than Ce3+ single doping and Fe3+ single doping because the doping of ions inhibits the growth of TiO2 nanocrystals and generates lattice defects, so that electron leap can occur even at low energy. The redshift of the sample’s absorbed optical band is beneficial to excite the photocatalytic activity and form an electron-hole, thus improving the utilization of visible light.
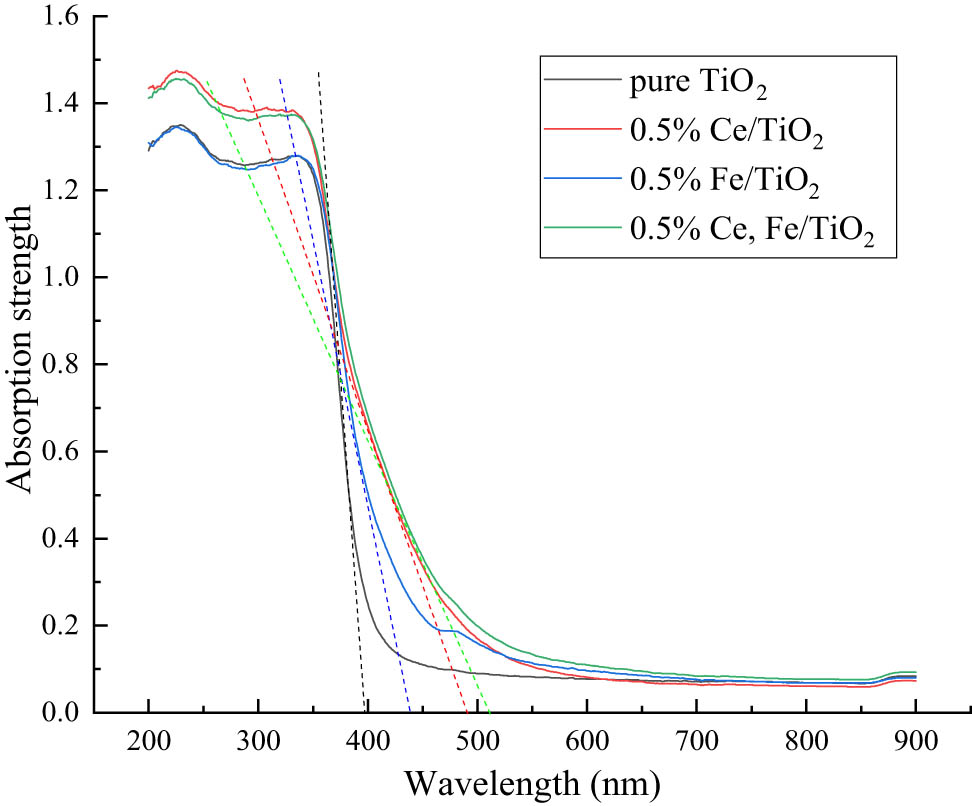
UV-Vis light diffuse reflection.
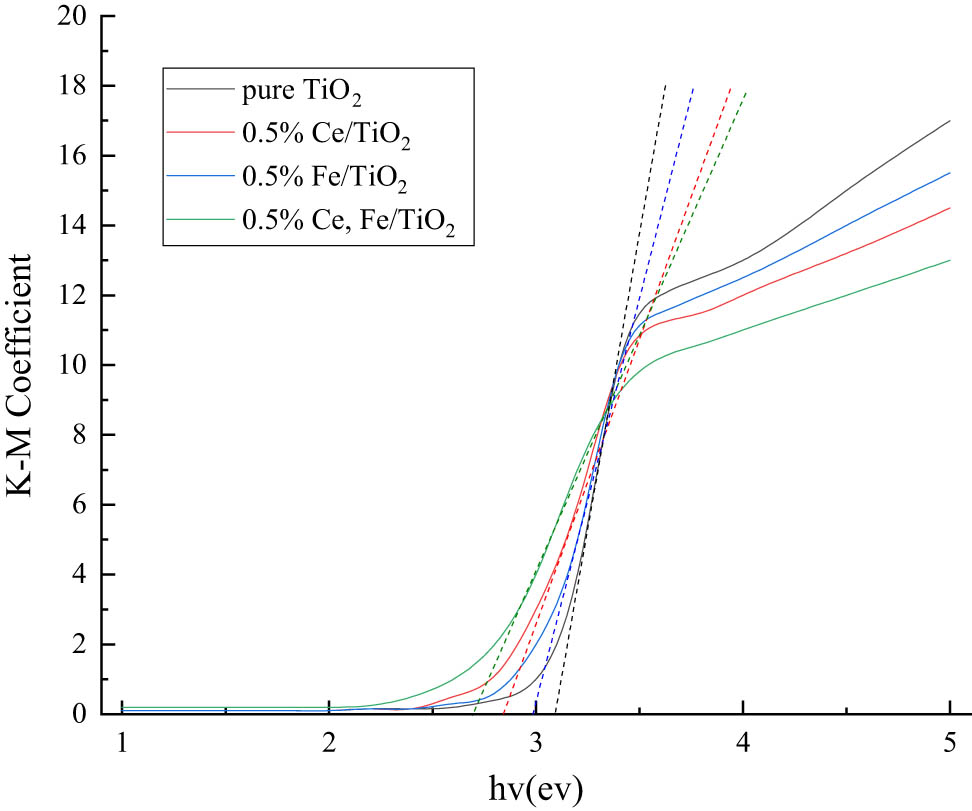
To further investigate the effect of different ion doping on the forbidden bandwidth of nano-TiO2, the optical band gap energy value of TiO2 can be calculated after the Kubelka–Munk transformation of the UV-Vis diffuse absorption spectrum of TiO2. The specific expression of the change is given by Eq. 10:
where R ∞ – reflectance; s – scattering coefficient; and k – molar absorption coefficient.
The relationship between the forbidden bandwidth of semiconductor materials and the wavelength of light absorption is given by Eq. 11:
where E g – bandwidth and λ g – light absorption threshold.
After the K–M transformation of the UV-Vis diffuse reflectance absorption spectrum, the tangent line intersects with the horizontal axis and then the K–M transformation curve graph was obtained. It can be seen from Figure 7 that the absorption sidebands of the samples gradually move from the shortwave direction (390 nm) to the longwave direction (520 nm) with the doping of different ions, and the forbidden bandwidth decreases from 3.22 to 2.71 eV. This is related to the lattice distortion produced by Fe3+ and Ce3+, which causes defect traps on the TiO2 surface and achieves the purpose of trapping photogenerated electron pairs. And according to the semiconductor energy band theory, the low-valent Fe3+ replaces Ti4+ in the lattice and forms a new d-energy band in the energy band gap of TiO2. The d-energy band creates separated impurity energy levels in the forbidden band, leading to a decrease in the position of the bottom of the TiO2 conduction band. The position of the TiO2 conduction band bottom decreases so that the less energetic photons are excited to the impurity energy levels to trap electrons. This is consistent with the findings that ion doping can cause the UV-Vis absorption edge of TiO2 to be redshifted.
K–M conversion curve graph.
3.3 PL analysis
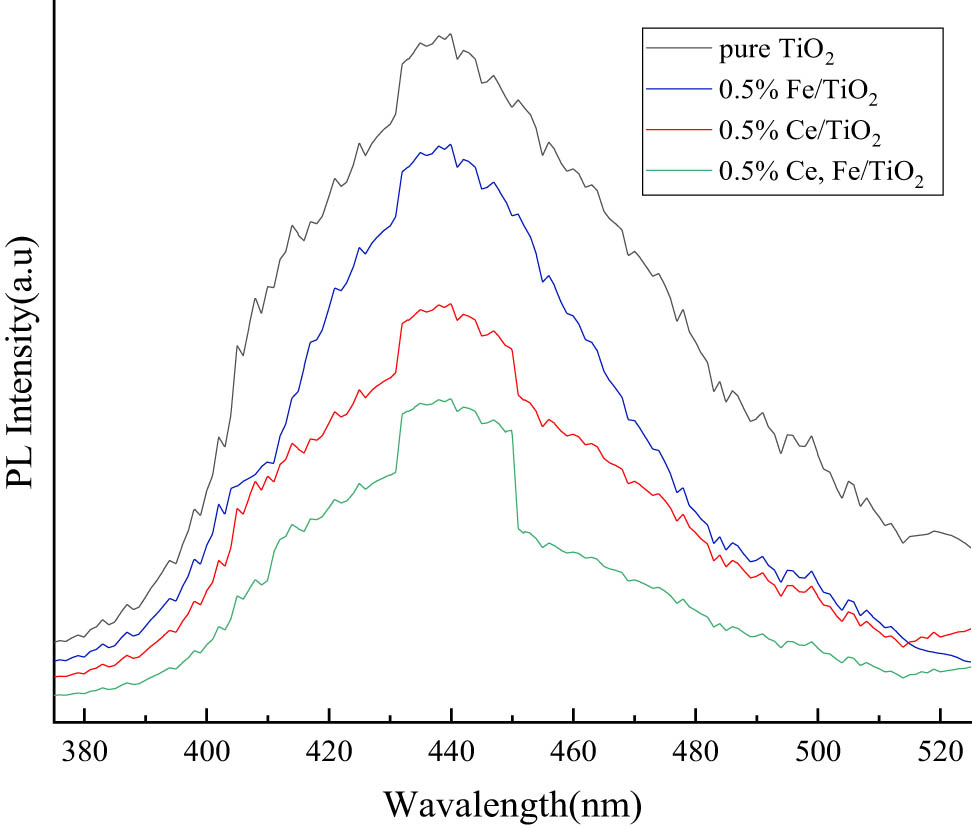
Photoluminescence (PL) reflects the separation of electrons and holes. In general, the lower the intensity, the more efficient the separation of electrons and holes and the lower the probability of compounding. In this experiment, an FL4500 type fluorescence photometer was used for characterization and analysis. The PL spectra in the range of 375–525 nm were measured at an excitation wavelength of 365 nm, and as shown in Figure 8, the intensities of modified nano-TiO2 were all lower than those of pure nano-TiO2, indicating that the doping of modified ions induced crystal distortion and formed lattice defects, which produced traps for trapping photogenerated electrons and reduced the probability of electron-hole complexation. Among them, Fe3+ and Ce3+ co-doping has a lower electron-hole complex probability, indicating that the co-doping of two metal ions is more favorable to improve the catalytic efficiency of nano-TiO2.
Fluorescence spectroscopy analysis.
3.4 BET analysis
In chemical materials research, the biggest advantage of nanoscale photocatalytic materials over other macroscopic photocatalytic materials is that nanomaterials have a huge surface area and surface structure advantages. The specific surface area test referred to as the BET test method, has become the standard for qualitative analysis of adsorption properties of materials and microscopic particles in the field of materials research at home and abroad. Before the BET test analysis of composite nano photocatalytic materials, the sample needs to be subjected to nitrogen adsorption–desorption isothermal test and then the data are fitted and analyzed according to the BET formula, and the specific surface area and pore size of nano-TiO2 and modified nano-TiO2 are derived from the distribution data. As shown in Figure 9a, the modified nano-TiO2 changed the linear type from type II to type IV compared with the pure TiO2. It can be observed that the inflection point of modified nano-TiO2 occurs between 0.55 and 0.75 relative pressure. After the inflection point, the rise rate decreases, and both show the absorption–desorption hysteresis phenomenon, indicating that the modified nano-TiO2 belongs to the mesoporous material structure. This hysteresis phenomenon is caused by the presence of a large number of capillary pores on the surface, indicating that the doping of ions makes the catalyst surface more rough and porous with increased capillary structures. Figure 9b also reflects that the average pore size of modified nano-TiO2 is smaller than that of pure TiO2 and the specific surface area is larger than that of pure TiO2, which further confirms the XRD analysis.
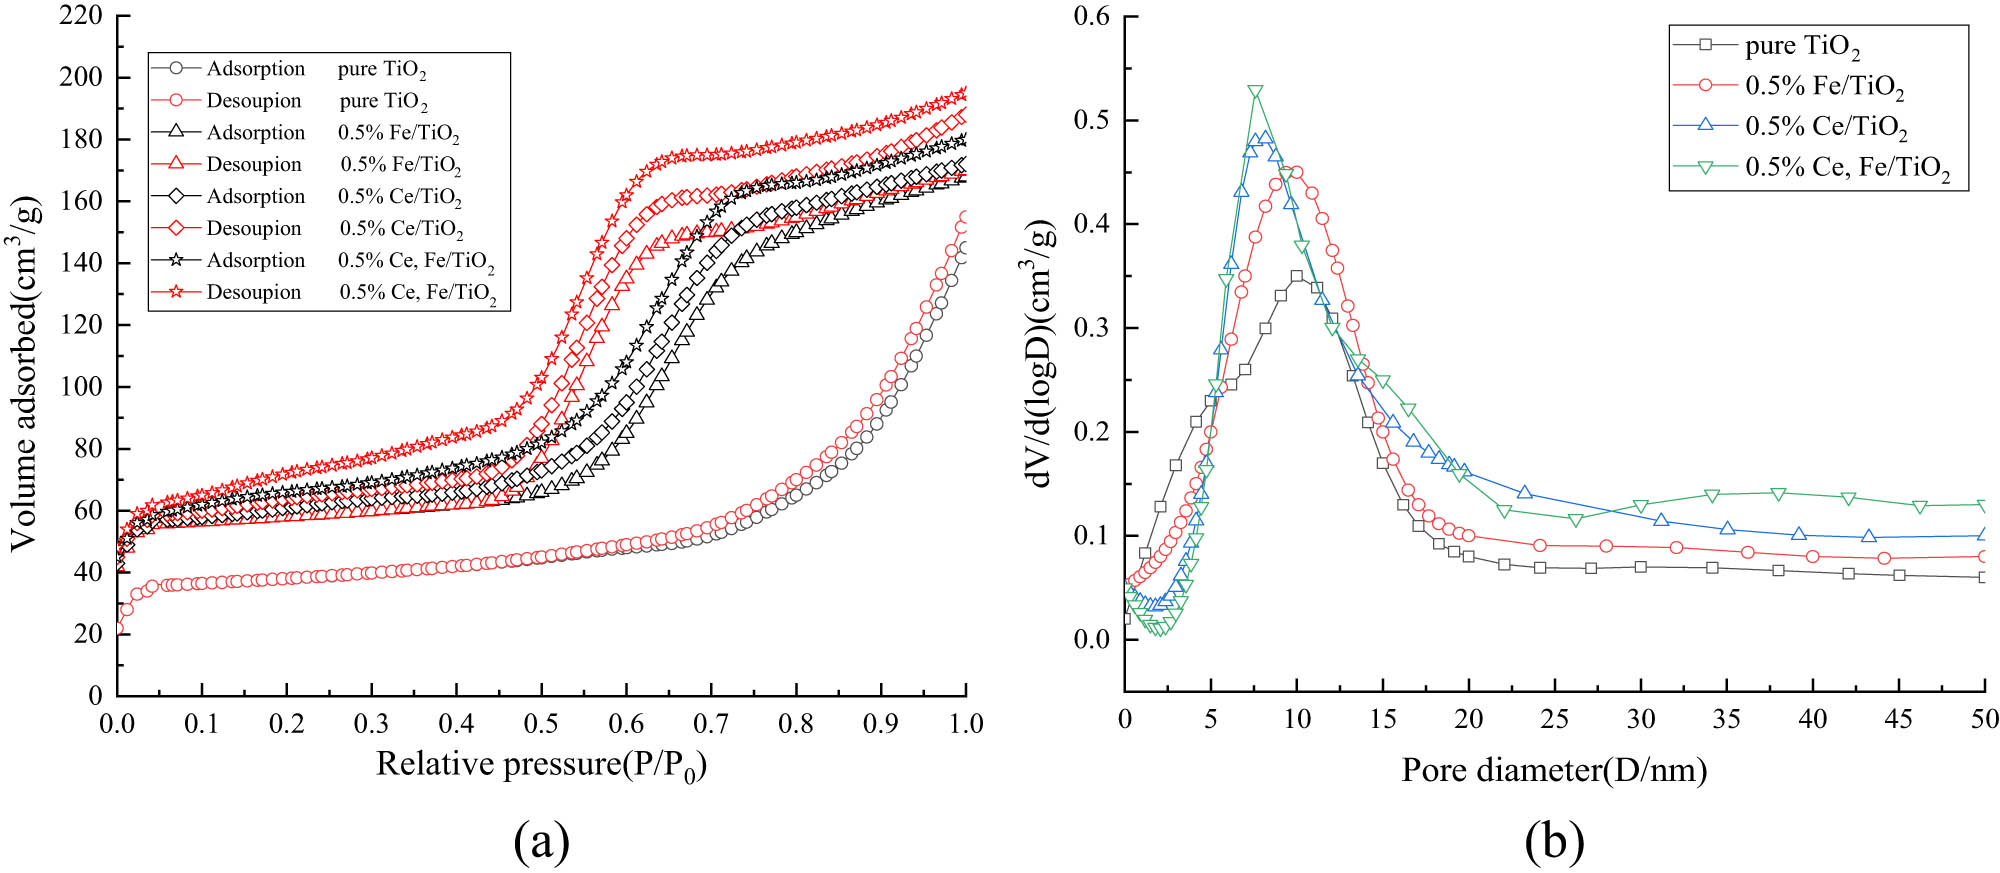
(a) N2 adsorption/desorption isotherms and (b) pore size distribution curves.
3.5 Electron spin resonance (ESR) analysis
In this thesis, ESR was used to monitor the formation of •OH. As shown in Figure 10, the area ratio of the four characteristic peaks was 1:2:2:1 under the high-pressure sodium lamp irradiation for 30 min, which belonged to the typical characteristic signal peaks of •OH, and all samples had obvious •OH signal peaks. The ESR signals of modified nano-TiO2 are stronger than those of pure TiO2, which should be related to the number of separated electron-hole pairs. In general, more reactive radicals are beneficial to photocatalytic performance, which provides the possibility to subsequently enhance the tail gas degradation efficiency.
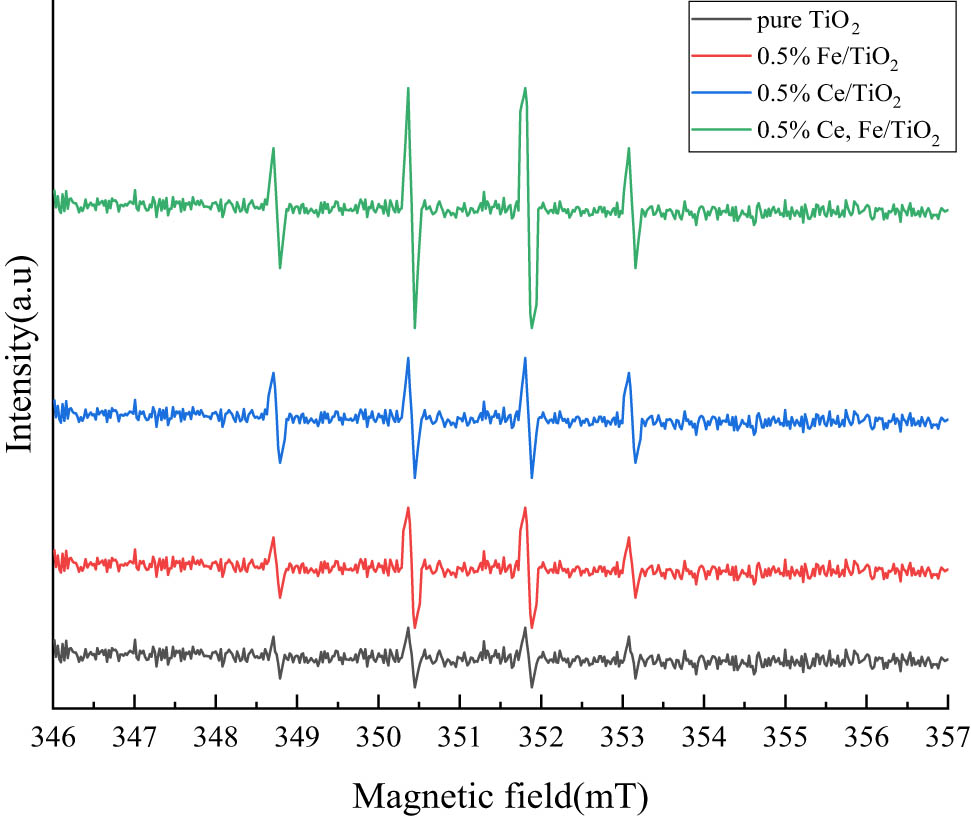
Results of electron spin resonance analysis.
3.6 Exhaust degradation test
The source of exhaust gas for the test was a standard exhaust gas tank, and the composition ratio of the gas mixture was NO (40,560 ppm), CO (9.96%), CO2 (5%), and N2. The volume of the exhaust gas tank is 8 L, the length, width, and height of the sealed chamber are 60 cm, converted to a volume of 216 L. Using a micro-flow meter to control the volume of gas passing each time, the volume of gas mixture passed in the test is 0.5 L, and the initial gas concentration control range is shown in Table 5.
Initial gas concentration control
| Gases (ppm) | CO | NO | CO2 | Gases (ppm) | CO | NO | CO2 |
|---|---|---|---|---|---|---|---|
| Theoretical concentration | 231.26 | 92.59 | 115.63 | Actual concentration | 202–212 | 62–72 | 214–229 |
As can be seen from Table 5, the actual concentrations of CO and NO are less than the theoretical values, but the concentration of CO2 is greater than the theoretical value. The reason for this is that in the process of the mixed gas entering the pipe, the connection between the pipes is not completely dense and part of the gas is left in the pipe, resulting in the actual concentration being less than the theoretical concentration. The increase in CO2 concentration is due to the fact that the closed chamber is not a vacuum and contains air, which contains CO2 in its composition, and when this content is greater than the loss value, it causes an increase in CO2 content.
Before starting the test, the tightness of the reaction chamber should be checked to prevent large test errors. The airtightness was checked by not putting any specimen in the reaction chamber and then introducing 0.5 L of the gas mixture. The main objects of this test are CO and NO, and the concentration changes in CO and NO are tested within 60 min. To avoid the error brought by one group of tests, two groups of each test are done in this study, and the specific test results are shown in Figure 11.
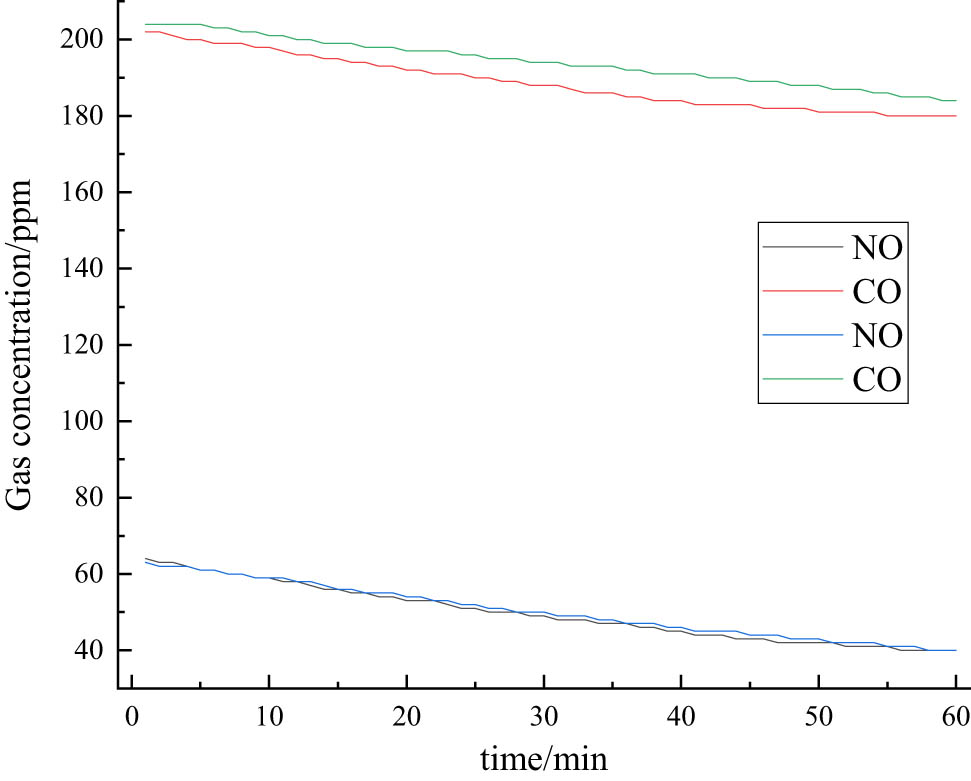
Graph of CO and NO concentration changes over time (blank test).
As can be seen from Figure 11, the concentration of CO slightly decreases with the growth of time, while the concentration of NO significantly reduces with the growth of time. The reason is that part of NO has an oxidation reaction with O2 in the air, so the concentration of CO slightly decreases and can be concluded that the airtightness of the confinement chamber is good and meets the requirements of the test.
After the airtightness check, debug and preheat the exhaust gas analyzer, then put the photocatalytic specimen into the sealed chamber, close the sealing door, start the exhaust gas analyzer, and open the pressure reducing valve of the exhaust gas tank after the analyzer indicates a stable number. The volume of the gas mixture is controlled by the micro-flow meter, and the rate chosen by the micro-flow meter is 2 L·min−1, i.e., the pressure reducing valve is closed after 15 s. Turn on the small fan and wait for 5 min to make the mixture evenly fill the sealed chamber, then turn on the high-pressure sodium lamp, set the parameters of the exhaust gas analyzer for a total duration of 60 min, because the exhaust gas analyzer is equipped with a data export function, the data export interval is set to 6 min per time. At the end of the test, turn off the fan, open the sealed door, and take out the test specimen after the exhaust gas is exhausted from the test system to prepare for the next test.
In the exhaust gas degradation test, the surface of the AC-13 asphalt mixture was pretreated first. Then, the prepared water-based nano-TiO2 coating solution was sprayed onto the rutting plate at a dosage of 556 mL·m−2, and it could be used in the exhaust gas degradation test after the water evaporated. A total of 20 groups were tested. The specific experimental data are shown in Table 6.
Data of exhaust gas degradation test
| Grouping | Group A | Group B | |||||||||||
|---|---|---|---|---|---|---|---|---|---|---|---|---|---|
| Time | Min | 0 | 12 | 24 | 36 | 48 | 60 | 0 | 12 | 24 | 36 | 48 | 60 |
| Blank test | NO | 63 | 58 | 51 | 47 | 42 | 40 | 64 | 58 | 52 | 47 | 43 | 40 |
| CO | 202 | 198 | 193 | 188 | 185 | 182 | 203 | 198 | 194 | 189 | 185 | 182 | |
| Pure TiO2 | NO | 66 | 59 | 51 | 44 | 41 | 38 | 68 | 61 | 53 | 46 | 42 | 40 |
| CO | 214 | 208 | 205 | 201 | 196 | 191 | 209 | 203 | 200 | 195 | 191 | 187 | |
| 0.1% of Fe | NO | 67 | 59 | 51 | 44 | 39 | 36 | 64 | 56 | 48 | 41 | 36 | 34 |
| CO | 195 | 189 | 183 | 180 | 177 | 173 | 205 | 199 | 192 | 189 | 186 | 183 | |
| 0.5% of Fe | NO | 69 | 60 | 52 | 45 | 40 | 36 | 65 | 56 | 48 | 41 | 36 | 34 |
| CO | 211 | 201 | 195 | 192 | 187 | 182 | 208 | 198 | 192 | 189 | 184 | 182 | |
| 1% of Fe | NO | 67 | 58 | 50 | 44 | 39 | 36 | 69 | 60 | 50 | 42 | 37 | 36 |
| CO | 209 | 201 | 195 | 192 | 187 | 182 | 207 | 199 | 194 | 191 | 185 | 182 | |
| 0.1% of Ce | NO | 68 | 60 | 55 | 48 | 42 | 36 | 69 | 61 | 56 | 49 | 42 | 36 |
| CO | 210 | 206 | 199 | 194 | 190 | 183 | 210 | 206 | 197 | 191 | 185 | 182 | |
| 0.5% of Ce | NO | 65 | 54 | 47 | 41 | 36 | 32 | 68 | 55 | 45 | 39 | 34 | 33 |
| CO | 207 | 198 | 190 | 185 | 182 | 178 | 208 | 198 | 191 | 184 | 180 | 177 | |
| 1% of Ce | NO | 65 | 55 | 48 | 42 | 37 | 34 | 67 | 56 | 46 | 41 | 36 | 34 |
| CO | 211 | 206 | 199 | 193 | 190 | 183 | 209 | 204 | 197 | 191 | 188 | 183 | |
| 0.1% of Fe, Ce | NO | 69 | 60 | 55 | 48 | 39 | 35 | 69 | 60 | 51 | 41 | 36 | 34 |
| CO | 204 | 191 | 187 | 183 | 178 | 175 | 204 | 190 | 185 | 183 | 178 | 174 | |
| 0.5% of Fe, Ce | NO | 72 | 61 | 52 | 44 | 39 | 34 | 71 | 61 | 50 | 41 | 35 | 32 |
| CO | 207 | 192 | 187 | 182 | 178 | 174 | 208 | 192 | 185 | 181 | 177 | 173 | |
| 1% of Fe, Ce | NO | 62 | 53 | 46 | 41 | 36 | 32 | 61 | 52 | 45 | 40 | 35 | 32 |
| CO | 210 | 197 | 192 | 188 | 182 | 179 | 209 | 197 | 192 | 186 | 183 | 180 | |
Because the airtightness of the closed chamber body is not completely sealed as well as the reason that NO will be naturally oxidized in the air, a blank test group is needed to make the correction comparison. The specific compensation method is: the initial concentration of the blank group is C 0, the concentration of the blank group is C 1, and the concentration of the test group is C 2, then the actual concentration of the test group after degradation is given by Eq. 12:
After compensating the data of each group, the average value of two groups A and B was taken as the final test data, as shown in Figure 12.
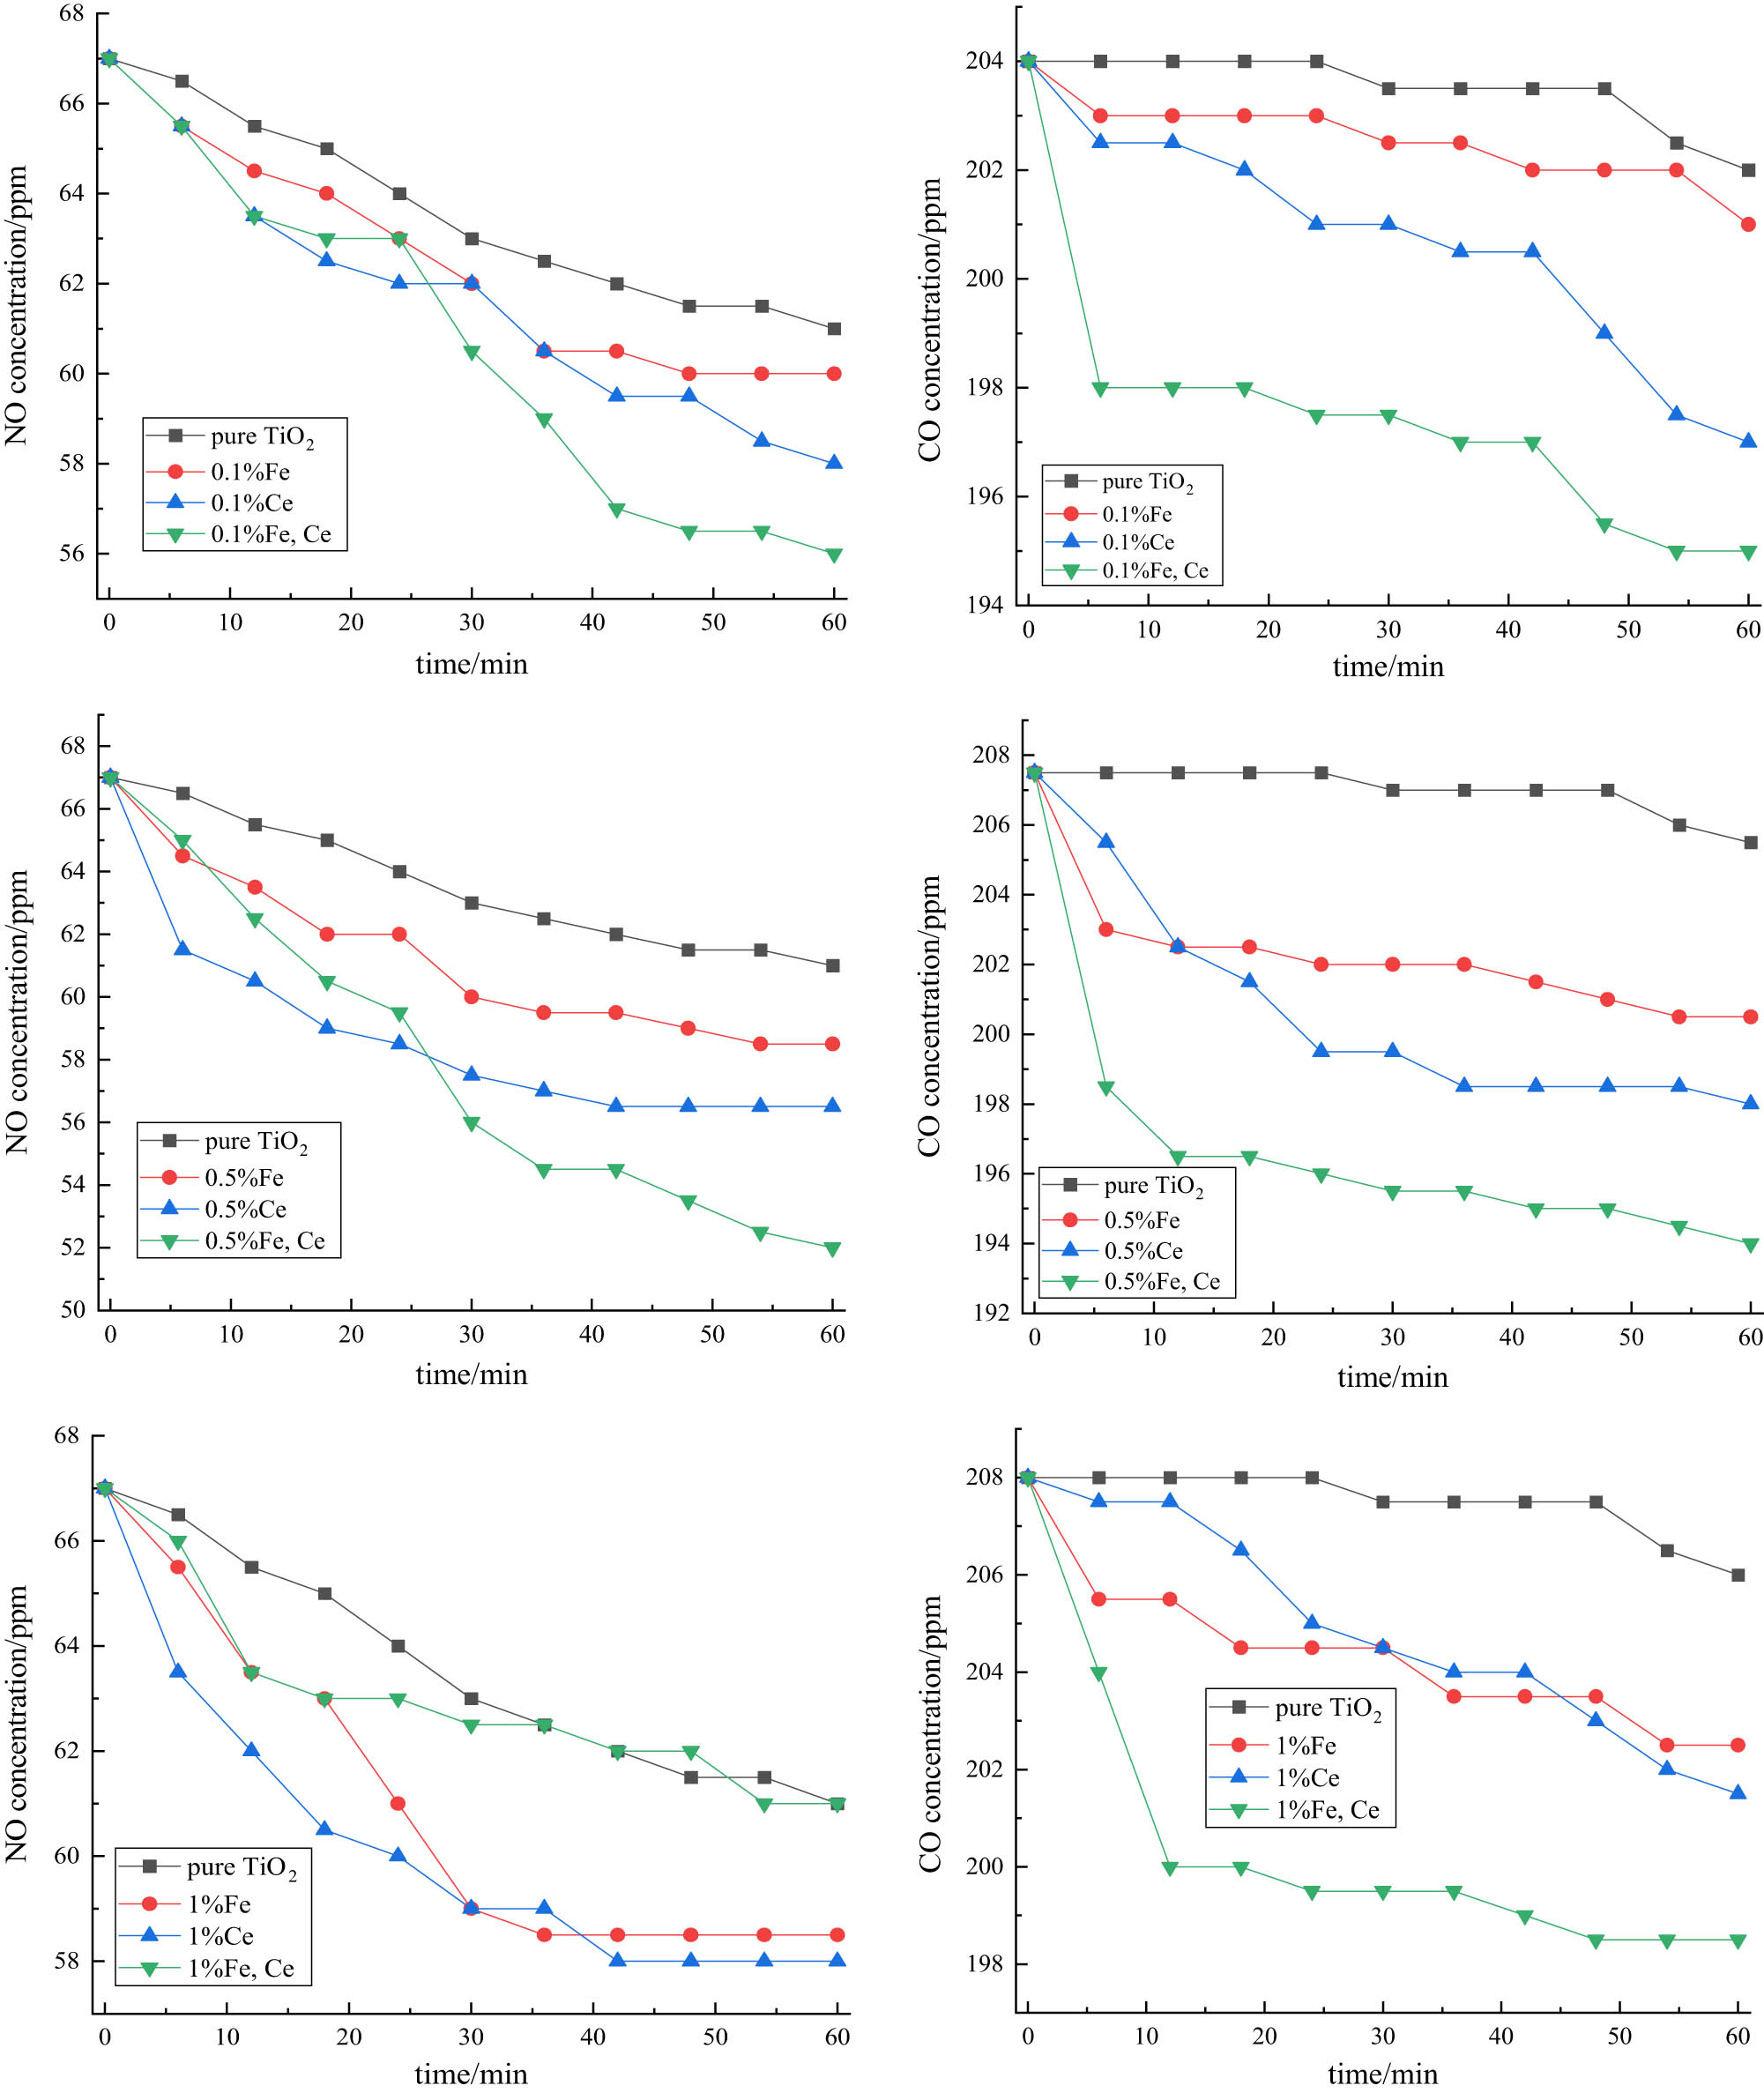
Graph of NO and CO concentration changes over time.
It can be noted that the doping of ions will improve the degradation efficiency of the exhaust gas of nano-TiO2 under high-pressure sodium lamp irradiation, and the degradation effect of co-doping is better than cerium ion single doping, better than iron ion single doping better than pure TiO2, and the degradation efficiencies are shown in Tables 7 and 8.
Exhaust gas degradation efficiency (NO)
| Degradation efficiency | Blank test | Pure TiO2 | 0.1% of Fe | 0.5% of Fe | 1% of Fe | 0.1% of Ce | 0.5% of Ce | 1% of Ce | 0.1% of Fe, Ce | 0.5% of Fe, Ce | 1% of Fe, Ce |
|---|---|---|---|---|---|---|---|---|---|---|---|
| Before compensation | 37.01 | 41.79 | 46.57 | 47.76 | 47.06 | 47.45 | 51.13 | 48.49 | 50.00 | 53.85 | 47.97 |
| After compensation | — | 8.96 | 10.69 | 12.69 | 12.50 | 13.14 | 15.79 | 12.88 | 15.94 | 20.98 | 9.76 |
Exhaust gas degradation efficiency (CO)
| Degradation efficiency | Blank test | Pure TiO2 | 0.1% of Fe | 0.5% of Fe | 1% of Fe | 0.1% of Ce | 0.5% of Ce | 1% of Ce | 0.1% of Fe, Ce | 0.5% of Fe, Ce | 1% of Fe, Ce |
|---|---|---|---|---|---|---|---|---|---|---|---|
| Before compensation | 10.12 | 10.64 | 11.00 | 13.13 | 12.50 | 13.10 | 14.46 | 12.86 | 14.46 | 16.39 | 14.32 |
| After compensation | — | 0.95 | 1.50 | 3.34 | 2.64 | 3.33 | 4.58 | 3.10 | 4.41 | 6.51 | 4.53 |
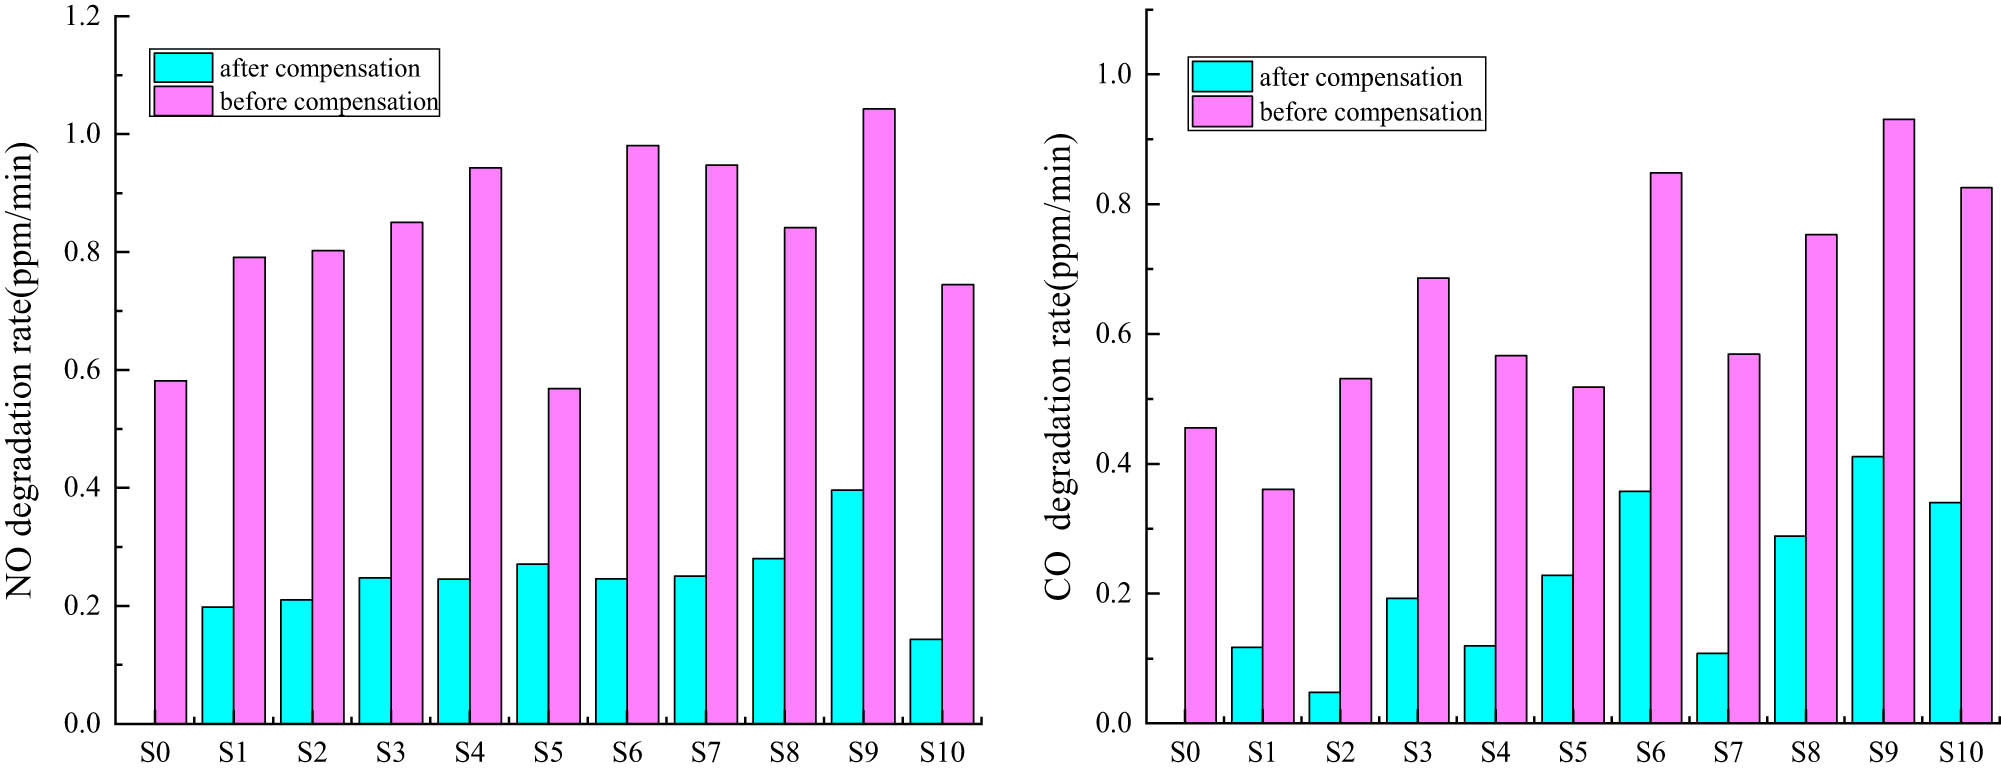
The concentration curve of exhaust gas degradation was obtained by fitting with Origin software. The maximum value of the slope of the curve was found to represent the maximum value of the degradation rate of exhaust gas, and the categories from left to right in Table 8 were represented by S0–S10. The exhaust gas degradation rates of NO and CO are shown in Figure 13. The maximum values of the degradation rates of NO and CO were obtained as shown in Tables 9 and 10.
Exhaust gas degradation rate of NO and CO.
Exhaust gas degradation rate (NO)
| Degradation rate | Blank test | Pure TiO2 | 0.1% of Fe | 0.5% of Fe | 1% of Fe | 0.1% of Ce | 0.5% of Ce | 1% of Ce | 0.1% of Fe, Ce | 0.5% of Fe, Ce | 1% of Fe, Ce |
|---|---|---|---|---|---|---|---|---|---|---|---|
| Before compensation | 0.58 | 0.79 | 0.80 | 0.85 | 0.94 | 0.57 | 0.98 | 0.95 | 0.84 | 1.04 | 0.75 |
| After compensation | — | 0.20 | 0.21 | 0.25 | 0.25 | 0.27 | 0.25 | 0.25 | 0.28 | 0.40 | 0.14 |
Exhaust gas degradation rate (CO)
| Degradation rate | Blank test | Pure TiO2 | 0.1% of Fe | 0.5% of Fe | 1% of Fe | 0.1% of Ce | 0.5% of Ce | 1% of Ce | 0.1% of Fe, Ce | 0.5% of Fe, Ce | 1% of Fe, Ce |
|---|---|---|---|---|---|---|---|---|---|---|---|
| Before compensation | 0.46 | 0.36 | 0.53 | 0.69 | 0.57 | 0.52 | 0.85 | 0.57 | 0.75 | 0.93 | 0.83 |
| After compensation | — | 0.12 | 0.05 | 0.19 | 0.12 | 0.23 | 0.36 | 0.11 | 0.29 | 0.41 | 0.34 |
It can be noted from exhaust gas degradation test that the degradation effect of Ce3+, Fe3+ co-doping is better than Ce3+ single doping, Fe3+ single doping and pure TiO2, where the maximum degradation efficiency and maximum degradation rate are Ce3+, Fe3+ co-doping, and the doping amount is 0.5%. This is because in the process of doping, Fe3+ with a small ion radius replaces part of Ti4+ and thus changes the crystal structure, while Ce3+ with a large ion radius exists at the grain boundary position and increases the diffusion energy barrier between the grains, both of which can induce lattice distortion, form lattice defects, reduce the probability of electron-hole complexation, improve photocatalytic activity, and thus improve the exhaust gas degradation efficiency. But too much ion doping will cause the remaining ions to accumulate on the particle surface of the catalyst, resulting in a reduced contact area between nano-TiO2 and visible light, thus decreasing the catalytic activity.
4 Conclusion
In conclusion, the efficiency of exhaust gas degradation efficiency of nano-TiO2 with different ion doping for use in tunnels is investigated. The two ions differ in the principle of increasing photocatalytic activity: Fe3+ is in the form of substituted Ti4+, while Ce3+ is present at the grain boundary sites, increasing the diffusion energy barrier. The doping of different ions will improve the degradation efficiency of nano-TiO2 exhaust gas under a high-pressure sodium lamp, and the degradation efficiency is: Fe3+, Ce3+ co-doping > Ce3+ single doping > Fe3+ single doping > pure TiO2. The maximum degradation efficiency and maximum degradation rate were of Fe3+, Ce3+ co-doped, and the doping amount was 0.5%. The maximum degradation efficiencies of NO and CO before compensation were 53.85% and 16.39%, respectively, and the maximum degradation rates were 1.04 and 0.93 ppm·min−1. The maximum degradation efficiencies of NO and CO after compensation were 20.14% and 6.04%, with top degradation rates of 0.40 and 0.41 ppm·min−1.
The use of the in-tunnel exhaust gas degradation materials prepared in this study for practical engineering purposes requires further research. In this study, an aqueous solution coating is used, and further research is needed on how to make a highly durable and waterproof coating subsequently. The optimal amount of co-doping is 0.5%, and the molar fraction ratio of 1:1 is used for co-doping. The specific molar fraction ratio of the two to achieve the best photocatalytic performance of TiO2 nanomaterials remains to be investigated.
Acknowledgements
We thank Mr Jianmin Wu from Chang’an University for his suggestions on this article. We thank all the participants in this study.
-
Funding information: Science and Technology Project of Guangxi Zhuang Autonomous Region Transportation Department.
-
Author contributions: Yin Luo: writing − original draft and experiment; Jianmin Wu: writing − review and editing; Hengcong Zhang: experiment; Zhong Qin: experiment.
-
Conflict of interest: Authors state no conflict of interest.
-
Data availability statement: All data generated or analyzed during this study are also available from the corresponding author on reasonable request.
References
[1] Barolo G, Livraghi S, Chiesa M, Paganini MC, Giamello E. Mechanism of the photoactivity under visible light of N-doped titanium dioxide. Charge carriers migration in irradiated N-TiO2 investigated by electron paramagnetic resonance. J Phys Chem C. 2012;116(39):20887–994. 10.1021/jp306123d.Search in Google Scholar
[2] Burkardt A, Weisweiler W, Tillaart J, Schfer-Sindlinger A, Lox ES. Influence of the V2O5 loading on the structure and activity of V2O5/TiO2 SCR catalysts for vehicle application. Top Catal. 2001;16–17(1):369–75. 10.1023/A:1016673418398.Search in Google Scholar
[3] Zhu J, Birgisson B, Kringos N. Polymer modification of bitumen: advances and challenges. Eur Polym J. 2014;54(1):18–38. 10.1016/j.eurpolymj.2014.02.005.Search in Google Scholar
[4] Yin S, Ihara K, Aita Y, Komatsu M, Sato T. Visible-light induced photocatalytic activity of TiO2xAy (A = N, S) prepared by precipitation route. J Photoch Photobio A. 2006;179(1):105–14. 10.1016/j.jphotochem.2005.08.001.Search in Google Scholar
[5] Schmitt M, Dylla H, Hassan MM, Mohammad LN, Rupnow T, Wright E. Impact of mixed nitrogen dioxide (NO2) and nitrogen oxide (NO) gases on titanium dioxide photodegradation of NOx. Transportation and Development Institute Congress 2011: Integrated Transportation and Development for a Better Tomorrow; 2011. p. 731–40.10.1061/41167(398)70Search in Google Scholar
[6] Nan Z, Ye M, Wen X, Lin C. Rutile TiO2 nanosheet arrays planted on magnetron sputtered Ti metal layers for efficient Perovskite solar cells. J Electrochem. 2017;23(2):226–37.Search in Google Scholar
[7] Rettie A, Klavetter KC, Lin JF, Dolocan A, Mullins CB. Improved visible light harvesting of WO3 by incorporation of sulfur or iodine: a tale of two impurities. Chem Mater. 2014;26(4):1670–7. 10.1021/cm403969r.Search in Google Scholar
[8] Fujishima A, Honda K. Photolysis-decomposition of water at the surface of an irradiated semiconductor. Nature. 1972;238(5385):37–8. 10.1038/238037a0.Search in Google Scholar
[9] Frank LA, Ackerson KL, Lepping R. On hot tenuous plasmas, fireballs, and boundary layers in the earth, s magnetotail. J Geophys Res. 1976;81(34):5859–81. 10.1029/JA083iA07p03358.Search in Google Scholar
[10] Shang PD. Application of asphalt concrete pavement that can degrade automobile exhaust in tunnels. Highway. 2014;59(3):189–92. CNKI:SUN:GLGL.0.2014-03-044.Search in Google Scholar
[11] Tan YQ, Li LK, Wei P, Sun Z. Application performance evaluation of biodegradable automobile exhaust materials in asphalt pavement. China J Highw Transp. 2010;23(6):21–7. CNKI:SUN:ZGGL.0.2010-06-005.Search in Google Scholar
[12] Wang H, Xu Q, Zheng X, Han W, Zheng J, Jiang B, et al. Synthesis mechanism, enhanced visible-light-photocatalytic properties, and photogenerated hydroxyl radicals of PS@CdS core–shell nanohybrids. J Nanopart Res. 2014;16(12):1–15. 10.1007/s11051-014-2794-3.Search in Google Scholar
[13] Choi W, Termin A, Hoffmann MR. The role of metal ion Dopants in quantum-sized TiO2: correlation between photoreactivity and charge carrier recombination dynamics. J Phys Chem-US. 1994;98(51):13669–79. 10.1021/j100102a038.Search in Google Scholar
[14] Hamad D, Dhib R, Mehrvar M. Photochemical degradation of aqueous polyvinyl alcohol in a continuous UV/H2O2 process: experimental and statistical analysis. J Polym Env. 2016;24(1):72–83. 10.1007/s10924-016-0750-2.Search in Google Scholar
[15] Kanan S, Moyet MA, Arthur RB, Patterson HH. Recent advances on TiO2-based photocatalysts toward the degradation of pesticides and major organic pollutants from water bodies. Catal Rev. 2019;62(3):1–65. 10.1080/01614940.2019.1613323.Search in Google Scholar
[16] Byrne C, Moran L, Hermosilla D, Merayo N, Ángeles B, Stephen R, et al. Effect of Cu doping on the anatase-to-rutile phase transition in TiO2 photocatalysts: theory and experiments. Appl Catal B-Environ. 2019;246(6):266–76. 10.1016/j.apcatb.2019.01.058.Search in Google Scholar
[17] Adhikari SP, Awasthi GP, Kim HJ, Park CH, Kim CS. Electrospinning directly synthesized porous TiO2 nanofibers modified by graphitic carbon nitride sheets for enhanced photocatalytic degradation activity under solar light irradiation. Langmuir Acs J Surf Colloids. 2016;32(24):6163–75. 10.1021/acs.langmuir.6b01085.Search in Google Scholar
[18] Chao W, Ao Y, Wang P, Hou J, Qian J, Zhang S. Preparation, characterization, photocatalytic properties of titania hollow sphere doped with cerium. J Hazard Mater. 2010;178(1–3):517–21. 10.1016/j.jhazmat.2010.01.111.Search in Google Scholar
[19] Asadi S, Hassan M, Nadiri A, Dylla H. Artificial intelligence modeling to evaluate field performance of photocatalytic asphalt pavement for ambient air purification. Env sci Pollut Res Int. 2014;21(14):8847–57. 10.1007/s11356-014-2821-z.Search in Google Scholar
[20] Osborn D, Hassan M, Asadi S, White JR. Durability quantification of TiO2 surface coating on concrete and asphalt pavements. J Mater Civ Eng. 2014;26(2):331–7. 10.1061/(ASCE)MT.1943-5533.0000816.Search in Google Scholar
[21] Han XC, Du XJ, Li HG. Design of test system for automobile exhaust degradation material test chamber. Forestry Machinery Woodworking Equip. 2005;7:24–6. 10.3969/j.issn.2095-2953.2005.07.009.Search in Google Scholar
[22] Zhang JP. Comparison and selection of high-pressure sodium lamps and LED lamps in urban road lighting. Electr Technol Intell Build. 2019;13(4):25–6. CNKI:SUN:ZNDQ.0.2019-04-007.Search in Google Scholar
[23] Ruzi P. Environmental-friendly pavement technology for exhaust gas absorption in tunnels. China Highw. 2018;4:105–7. CNKI:SUN:GLZG.0.2018-04-058.Search in Google Scholar
[24] Xu YH, Gu GB, Chen XQ, Li XJ. Preparation, characterization and photocatalytic activity of composite nano-Fe2O3/TiO2. J South China Univ Technol (Nat Sci.). 2001;11:76–80. 10.3321/j.issn:1000-565X.2001.11.018.Search in Google Scholar
[25] Wang ZL, Li M, Liu TX, Chang JZ, Shi HZ, Zhang ZJ, et al. Study on the photosensitization and sterilization activity of TiO2 film. J Shaanxi Norm Univ (Nat Sci Ed). 2002;3:87–9. 10.3321/j.issn:1672-4291.2002.03.019.Search in Google Scholar
[26] Wang CY, Liu CY, Shen T. Surface modification of semiconductor photocatalysts. Chem J Chin Universities (Nat Sci Ed). 1998;19(12):2013–9. CNKI:SUN:GDXH.0.1998-12-030.Search in Google Scholar
[27] Gandhe AR, Fernandes JB. A simple method to synthesize N-doped rutile titania with enhanced photocatalytic activity in sunlight. J Solid State Chem. 2005;178(9):2953–7. 10.1016/j.jssc.2005.06.034.Search in Google Scholar
[28] Katsumata H, Higashi F, Kobayashi Y, Tateishi I, Kaneco S. Dual-defect-modified graphitic carbon nitride with boosted photocatalytic activity under visible light. Sci Rep-UK. 2019;9(1):1–10. 10.1038/s41598-019-49949-6.Search in Google Scholar
[29] Durán-Álvarez JC, Santiago AL, Ramírez-Ortega D, Acevedo-Peña P, Castillón F, Ramírez-Zamora RM, et al. Surface modification of B–TiO2 by deposition of Au nanoparticles to increase its photocatalytic activity under simulated sunlight irradiation. J Sol–Gel Sci Techn. 2018;88:474–87. 10.1007/s10971-018-4815-7.Search in Google Scholar
[30] Zhang KX. Current status and prospects of application of titanium dioxide photocatalyst technology in Japan. Tokyo: Xinhua News Agency; 1999.Search in Google Scholar
[31] Gelover S, Mondragón P, Jiménez A. Titanium dioxide sol–gel deposited over glass and its application as a photocatalyst for water decontamination. J Photoch Photobio A. 2004;165(1–3):241–6. 10.1016/j.jphotochem.2004.03.023.Search in Google Scholar
[32] Hao LY, Mao LQ, Zhang SL, Dang HX, Li QL. Study on surface state and photocatalytic property of the compound semiconductor CdS/TiO2. J Henan Univ (Nat Sci). 2004;34(2):28–32. 10.1016/j.jco. 2003.08.015.Search in Google Scholar
[33] Vinodgopal K, Kamat PV. Enhanced rates of photocatalytic degradation of an Azo dye using SnO2/TiO2 coupled semiconductor thin films. Env Sci Technol. 1995;29(3):841. 10.1021/es00003a037.Search in Google Scholar
[34] Vaiano V, Sacco O, Sannino D, Ciambelli P. Photocatalytic removal of spiramycin from wastewater under visible light with N-doped TiO2, photocatalysts. Chem Eng J. 2015;261:3–8. 10.1016/j.cej.2014.02.071.Search in Google Scholar
[35] Meng C, Liu Y. NOx removal from vehicle emissions by functionality surface of asphalt road. J Hazard Mater. 2010;3(174):375–9. 10.1016/j.jhazmat.2009.09.062.Search in Google Scholar
[36] Hassan MM, Dylla H, Mohammad LN, Rupnow T. Evaluation of the durability of titanium dioxide photocatalyst coating for concrete pavement. Constr Build Mater. 2010;8(24):1456–61. 10.1016/j.conbuildmat.2010.01.009.Search in Google Scholar
[37] Vaiano V, Sacco O, Sannino D, Ciambelli P. Nanostructured N-doped TiO2, coated on glass spheres for the photocatalytic removal of organic dyes under UV or visible light irradiation. Appl Catal B-Environ. 2015;171:153–61. 10.1016/j.apcatb.2015.01.039.Search in Google Scholar
[38] Larumbe S, Monge M, Gómez-Polo C. Comparative study of (N, Fe) doped TiO2, photocatalysts. Appl Surf Sci. 2015;327:490–7. 10.1016/j.apsusc.2014.11.137.Search in Google Scholar
[39] Heather D, Marwa MH, Marion S, Tyson R, Louay NM. J Mater Civ Eng. 2011;23(7):1087–93. 10.1061/(ASCE)MT.1943-5533.0000248.Search in Google Scholar
© 2021 Yin Luo et al., published by De Gruyter
This work is licensed under the Creative Commons Attribution 4.0 International License.
Articles in the same Issue
- Research Articles
- MW irradiation and ionic liquids as green tools in hydrolyses and alcoholyses
- Effect of CaO on catalytic combustion of semi-coke
- Studies of Penicillium species associated with blue mold disease of grapes and management through plant essential oils as non-hazardous botanical fungicides
- Development of leftover rice/gelatin interpenetrating polymer network films for food packaging
- Potent antibacterial action of phycosynthesized selenium nanoparticles using Spirulina platensis extract
- Green synthesized silver and copper nanoparticles induced changes in biomass parameters, secondary metabolites production, and antioxidant activity in callus cultures of Artemisia absinthium L.
- Gold nanoparticles from Celastrus hindsii and HAuCl4: Green synthesis, characteristics, and their cytotoxic effects on HeLa cells
- Green synthesis of silver nanoparticles using Tropaeolum majus: Phytochemical screening and antibacterial studies
- One-step preparation of metal-free phthalocyanine with controllable crystal form
- In vitro and in vivo applications of Euphorbia wallichii shoot extract-mediated gold nanospheres
- Fabrication of green ZnO nanoparticles using walnut leaf extract to develop an antibacterial film based on polyethylene–starch–ZnO NPs
- Preparation of Zn-MOFs by microwave-assisted ball milling for removal of tetracycline hydrochloride and Congo red from wastewater
- Feasibility of fly ash as fluxing agent in mid- and low-grade phosphate rock carbothermal reduction and its reaction kinetics
- Three combined pretreatments for reactive gasification feedstock from wet coffee grounds waste
- Biosynthesis and antioxidation of nano-selenium using lemon juice as a reducing agent
- Combustion and gasification characteristics of low-temperature pyrolytic semi-coke prepared through atmosphere rich in CH4 and H2
- Microwave-assisted reactions: Efficient and versatile one-step synthesis of 8-substituted xanthines and substituted pyrimidopteridine-2,4,6,8-tetraones under controlled microwave heating
- New approach in process intensification based on subcritical water, as green solvent, in propolis oil in water nanoemulsion preparation
- Continuous sulfonation of hexadecylbenzene in a microreactor
- Synthesis, characterization, biological activities, and catalytic applications of alcoholic extract of saffron (Crocus sativus) flower stigma-based gold nanoparticles
- Foliar applications of plant-based titanium dioxide nanoparticles to improve agronomic and physiological attributes of wheat (Triticum aestivum L.) plants under salinity stress
- Simultaneous leaching of rare earth elements and phosphorus from a Chinese phosphate ore using H3PO4
- Silica extraction from bauxite reaction residue and synthesis water glass
- Metal–organic framework-derived nanoporous titanium dioxide–heteropoly acid composites and its application in esterification
- Highly Cr(vi)-tolerant Staphylococcus simulans assisting chromate evacuation from tannery effluent
- A green method for the preparation of phoxim based on high-boiling nitrite
- Silver nanoparticles elicited physiological, biochemical, and antioxidant modifications in rice plants to control Aspergillus flavus
- Mixed gel electrolytes: Synthesis, characterization, and gas release on PbSb electrode
- Supported on mesoporous silica nanospheres, molecularly imprinted polymer for selective adsorption of dichlorophen
- Synthesis of zeolite from fly ash and its adsorption of phosphorus in wastewater
- Development of a continuous PET depolymerization process as a basis for a back-to-monomer recycling method
- Green synthesis of ZnS nanoparticles and fabrication of ZnS–chitosan nanocomposites for the removal of Cr(vi) ion from wastewater
- Synthesis, surface modification, and characterization of Fe3O4@SiO2 core@shell nanostructure
- Antioxidant potential of bulk and nanoparticles of naringenin against cadmium-induced oxidative stress in Nile tilapia, Oreochromis niloticus
- Variability and improvement of optical and antimicrobial performances for CQDs/mesoporous SiO2/Ag NPs composites via in situ synthesis
- Green synthesis of silver nanoparticles: Characterization and its potential biomedical applications
- Green synthesis, characterization, and antimicrobial activity of silver nanoparticles prepared using Trigonella foenum-graecum L. leaves grown in Saudi Arabia
- Intensification process in thyme essential oil nanoemulsion preparation based on subcritical water as green solvent and six different emulsifiers
- Synthesis and biological activities of alcohol extract of black cumin seeds (Bunium persicum)-based gold nanoparticles and their catalytic applications
- Digera muricata (L.) Mart. mediated synthesis of antimicrobial and enzymatic inhibitory zinc oxide bionanoparticles
- Aqueous synthesis of Nb-modified SnO2 quantum dots for efficient photocatalytic degradation of polyethylene for in situ agricultural waste treatment
- Study on the effect of microwave roasting pretreatment on nickel extraction from nickel-containing residue using sulfuric acid
- Green nanotechnology synthesized silver nanoparticles: Characterization and testing its antibacterial activity
- Phyto-fabrication of selenium nanorods using extract of pomegranate rind wastes and their potentialities for inhibiting fish-borne pathogens
- Hydrophilic modification of PVDF membranes by in situ synthesis of nano-Ag with nano-ZrO2
- Paracrine study of adipose tissue-derived mesenchymal stem cells (ADMSCs) in a self-assembling nano-polypeptide hydrogel environment
- Study of the corrosion-inhibiting activity of the green materials of the Posidonia oceanica leaves’ ethanolic extract based on PVP in corrosive media (1 M of HCl)
- Callus-mediated biosynthesis of Ag and ZnO nanoparticles using aqueous callus extract of Cannabis sativa: Their cytotoxic potential and clinical potential against human pathogenic bacteria and fungi
- Ionic liquids as capping agents of silver nanoparticles. Part II: Antimicrobial and cytotoxic study
- CO2 hydrogenation to dimethyl ether over In2O3 catalysts supported on aluminosilicate halloysite nanotubes
- Corylus avellana leaf extract-mediated green synthesis of antifungal silver nanoparticles using microwave irradiation and assessment of their properties
- Novel design and combination strategy of minocycline and OECs-loaded CeO2 nanoparticles with SF for the treatment of spinal cord injury: In vitro and in vivo evaluations
- Fe3+ and Ce3+ modified nano-TiO2 for degradation of exhaust gas in tunnels
- Analysis of enzyme activity and microbial community structure changes in the anaerobic digestion process of cattle manure at sub-mesophilic temperatures
- Synthesis of greener silver nanoparticle-based chitosan nanocomposites and their potential antimicrobial activity against oral pathogens
- Baeyer–Villiger co-oxidation of cyclohexanone with Fe–Sn–O catalysts in an O2/benzaldehyde system
- Increased flexibility to improve the catalytic performance of carbon-based solid acid catalysts
- Study on titanium dioxide nanoparticles as MALDI MS matrix for the determination of lipids in the brain
- Green-synthesized silver nanoparticles with aqueous extract of green algae Chaetomorpha ligustica and its anticancer potential
- Curcumin-removed turmeric oleoresin nano-emulsion as a novel botanical fungicide to control anthracnose (Colletotrichum gloeosporioides) in litchi
- Antibacterial greener silver nanoparticles synthesized using Marsilea quadrifolia extract and their eco-friendly evaluation against Zika virus vector, Aedes aegypti
- Optimization for simultaneous removal of NH3-N and COD from coking wastewater via a three-dimensional electrode system with coal-based electrode materials by RSM method
- Effect of Cu doping on the optical property of green synthesised l-cystein-capped CdSe quantum dots
- Anticandidal potentiality of biosynthesized and decorated nanometals with fucoidan
- Biosynthesis of silver nanoparticles using leaves of Mentha pulegium, their characterization, and antifungal properties
- A study on the coordination of cyclohexanocucurbit[6]uril with copper, zinc, and magnesium ions
- Ultrasound-assisted l-cysteine whole-cell bioconversion by recombinant Escherichia coli with tryptophan synthase
- Green synthesis of silver nanoparticles using aqueous extract of Citrus sinensis peels and evaluation of their antibacterial efficacy
- Preparation and characterization of sodium alginate/acrylic acid composite hydrogels conjugated to silver nanoparticles as an antibiotic delivery system
- Synthesis of tert-amylbenzene for side-chain alkylation of cumene catalyzed by a solid superbase
- Punica granatum peel extracts mediated the green synthesis of gold nanoparticles and their detailed in vivo biological activities
- Simulation and improvement of the separation process of synthesizing vinyl acetate by acetylene gas-phase method
- Review Articles
- Carbon dots: Discovery, structure, fluorescent properties, and applications
- Potential applications of biogenic selenium nanoparticles in alleviating biotic and abiotic stresses in plants: A comprehensive insight on the mechanistic approach and future perspectives
- Review on functionalized magnetic nanoparticles for the pretreatment of organophosphorus pesticides
- Extraction and modification of hemicellulose from lignocellulosic biomass: A review
- Topical Issue: Recent advances in deep eutectic solvents: Fundamentals and applications (Guest Editors: Santiago Aparicio and Mert Atilhan)
- Delignification of unbleached pulp by ternary deep eutectic solvents
- Removal of thiophene from model oil by polyethylene glycol via forming deep eutectic solvents
- Valorization of birch bark using a low transition temperature mixture composed of choline chloride and lactic acid
- Topical Issue: Flow chemistry and microreaction technologies for circular processes (Guest Editor: Gianvito Vilé)
- Stille, Heck, and Sonogashira coupling and hydrogenation catalyzed by porous-silica-gel-supported palladium in batch and flow
- In-flow enantioselective homogeneous organic synthesis