Effect of plasticizer content on the rheological behavior of LTCC casting slurry under large amplitude oscillating shear
-
Zibin Lv


Abstract
The casting slurry determines the quality of the low-temperature co-fired ceramic (LTCC) green tapes. In the present investigation, large amplitude oscillatory shear (LAOS) is first exploited to characterize the rheological properties of casting slurry. Three kinds of casting slurries with different plasticizer contents were cast into green tapes and studied. Furthermore, comprehensive performance tests were carried out on the obtained green tapes, which showed matching nonlinear rheological properties with those of casting slurries, as obtained by LAOS tests. It revealed that the addition of an appropriate amount of plasticizer (plastic/binder = 0.5) can significantly improve the structural uniformity of the slurry. The green tapes at this content also had high tensile strength and excellent yield elongation. This study combines the internal microstructure of the casting slurry and the external comprehensive performance of green tapes according to LAOS tests. The optimal plasticizer content can be quickly and accurately obtained from the rheological theory.
1 Introduction
The casting slurry is the key to determining the low-temperature co-fired ceramic (LTCC) casting process. The internal structure of fresh casting slurry with polymer additives is different from that of common single-component polymer fluids. Accompanied by the interaction of internal components, it can lead to complex rheological behavior, especially strain stiffening and shear thinning [1,2]. The rheology of these non-aqueous systems is significant as it affects the microstructure of the formed green tapes. Therefore, understanding rheological properties is the best way to study the internal structure of the casting slurry, which is useful for subsequent quality control, process design, and the development of new formulations. At present, the influence of plasticizer content on slurry in a polyvinyl butyral binder system has been widely studied [3,4,5]. However, most of the studies only focus on the evaluation of the product performance with respect to the additive content. The optimal additive ratio is obtained by reverse inference based on the final results, without studying the internal structural of the slurry. Xin et al. [6] and Li et al. [7] investigated the effects of butyl benzyl phthalate and dibutyl phthalate (DBP) as plasticizers of CaO–B2O3–SiO2-based LTCC casting slurry and green tapes, respectively. The optimal ratio of plasticizer was determined by examining the performance of LTCC products. Foghmoes et al. [8] innovatively selected different plasticizers with low toxicity as alternatives to DBP. While maintaining the chemical compatibility, the optimal type and the corresponding additive ratio were qualitatively given based on evaluation of the debonding, mechanical, and sintering properties of the green tapes. Unfortunately, Foghmoes et al. in keeping with previous studies did not acknowledge the effect of plasticizers on the internal structure of casting slurry. Although previous research studies were clear and straightforward, it is necessary to study the internal structure changes of slurry for the subsequent development of other slurry formulations.
The internal structure of the casting slurry is composed of the solvent phase, polymer phase, and solid particle phase, which may lead to liquid–solid separation and segregation phenomena by flow induction due to the multiphase. This complex rheological behavior also explains the irrelevance between conclusions in different literature reports [9]. Although the results of flow curves for casting slurry have been reported in the literature, these characteristics cannot be completely defined in the case of constantly changing materials [10]. The familiar viscoelastic moduli G′ and G″ are rigorously defined only in the linear viscoelastic regime, where the stress response is a single harmonic sine wave. In the nonlinear state, the definition of the viscoelastic modulus is not unique [11]. For the casting slurry composed of complex components, a single strain scan in the oscillatory test is insufficient to comprehensively evaluate the internal structural changes in the slurry.
The small amplitude oscillatory shear (SAOS) test is widely used as a standard method to study the linear viscoelastic properties of complex fluids due to its straightforward theoretical background and ease of application [12]. However, many industrial processes cannot be adequately described by steady shearing flow, or by linear viscoelastic deformations constrained by the SAOS flow. This is because most materials experience large and rapid deformations during processing and application. For tape casting, the slurry needs to be sheared at a high speed by doctor blade before forming. The large amplitude oscillatory shear (LAOS) test addresses the limitation that the casting slurry cannot be adequately characterized in the non-linear region. The LAOS method performance is based on the response of the stress–strain curve. The response is used to describe the LAOS results called Lissajous–Bowditch curves. By utilizing symmetric parameters to overlap the “elastic” and “viscous” contributions of nonlinear stress responses, the geometric interpretation of a single harmonic stress output is generated. The stress–strain curve, referred to as the elastic Lissajous curve, reflects the elastic properties of the material. At present, the LAOS test has been widely used in the fields of polymer solutions, food, hydrogels, and cement concrete [13,14,15,16]. The LAOS test can help in the study of complex fluids and provide information about the nonlinear evolution of the fluid microstructure, which may not be available from conventional rheological measurements [10]. But, so far, the application of the LAOS test for casting slurry has not been mentioned. A novel approach based on the LAOS method, which integrates nonlinear rheological parameters with the comprehensive performance of the green tapes, provides valuable theoretical insights for the formulation of casting slurry. Therefore, studies on the application of LAOS to casting slurry are essential for both theoretical research and practical engineering applications.
In the present investigation, the LAOS rheological procedure was attempted for the first time in the case of casting slurry. The LAOS test was chosen to extend the rheological property map from a purely phenomenological study to the rheological description of microstructure experiments. This article aimed to demonstrate that the internal structure of casting slurry with different plasticizer contents can be characterized using the LAOS strain oscillation test, offering a novel strategy for optimizing casting slurry formulations. This study highlighted the difference in rheological properties of slurries with three different plasticizer contents due to microstructural changes and provided the justification for selecting the optimal ratio. The comprehensive performance of products with the optimal ratio was further validated through practical production. This thesis provided an idea for the structural characterization of other casting slurries, such as high-temperature co-fired ceramics, multilayer ceramic capacitors, LTCC, and other ceramics or glass slurries. Meanwhile, we hope this method could reduce the experimental time and cost in industrial manufacturing. It also could, to some extent, provide support for further research on the microstructure and kinetic analysis of slurries under different testing environments.
2 Experimental
2.1 Materials
The casting slurries in this study were self-formulated, and the solids consisted of glass powder and aluminum powder. The glass powder used in the casting slurry was obtained by self-melting, but the aluminum powder with D 50 = 2.5 μm was supplied by Nippon Light Metal Co., Ltd. Cao-B2O3-La2O3 (BAO) glass was prepared by melting 16.6 wt% CaCO3, 33.4 wt% H3BO3, 39.8 wt% La2O3, 6.9 wt% BPO4, 2.1 wt% SiO2, and 1.2 wt% Na2CO3 at 1,450°C for approximately 1 h. The obtained melt was quenched to flakes by water-cooled counter roll rolling and then ball-milled. After drying and sieving, glass powders with a D 50 of 1.6 μm were obtained. The remaining solvent additives were purchased from Tianjin Zhiyuan Chemical Reagent Company, such as ethyl acetate and butyl acetate. The binder acrylic resin was obtained from Wuxi Shangyi Chemical Company. The plasticizer dioctyl phthalate (DOP), as an organic ester compound, had good compatibility with polymer chains, which could improve the plasticity of the green tapes. However, DOP is toxic to humans at a certain dose and so is gradually replaced. The aim of this study was to provide a new suggestion for the selection of other plasticizers.
The following steps were required for preparation of the casting slurry. First, the Al2O3 powder was heated at 300°C for 4 h to remove the hydroxyl group and H2O. Second, different contents of acrylic resin and DOP (18.3 wt% acrylic resin and 5.5% DOP; 15.9 wt% acrylic resin and 7.9% DOP; 14 wt% acrylic resin and 9.8% DOP; i.e., plastic/binder = 0.3, 0.5, and 0.7 mass ratios, respectively) and 20.1 wt% binary solvent (ethyl acetate/butyl acetate = 1:1 mass ratio) were ball-milled for 4 h using nylon balls. Balls of 45 wt% Φ8 and 55 wt% Φ10 were selected for the milling media. Then, 25.8 wt% CBL glass powders were added and homogeneously mixed for 12 h. Next, heated 30.3 wt% Al2O3 powder was added to this mixture, and the slurry was mixed for another 12 h. After mixing, the slurry was filtered through a 200-mesh sieve to remove impurities and grinding media. The obtained slurry was then subjected to vacuum defoaming for 20 min under a vacuum pressure of 0.5 Pa. Then, the prepared slurry was turned into green tapes by tape-casting. The casting parameters chosen were a 260 μm blade gap, 0.6 m/min casting rate, and 80°C heating. All formulations of slurry were tape-cast in strict accordance with this standard. The obtained green tapes were cut into 20 cm × 20 cm × 135 μm sheets. The eight-layer green tapes were laminated by hot pressing and then printed with silver paste on its surface. All the obtained green tapes showed no cracking and did not affect the next step of the process. Finally, the treated green tapes were sintered at 850°C, and the final LTCC substrates were obtained. The sintering program is detailed in Section 3.8. The stay stages included holding at 220°C for 30 min, at 440°C for 60 min, and at 850°C for 20 min. The schematic diagram of tape casting is given in Figure 1.
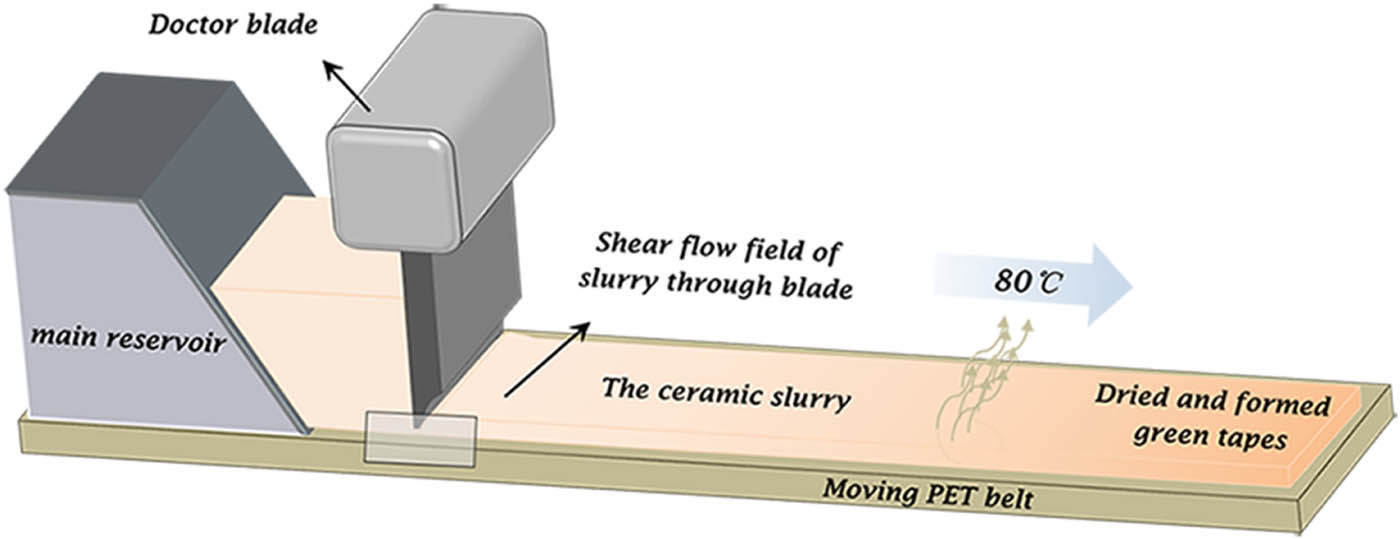
Schematic diagram of tape casting.
2.2 Rheological testing methods
All rheological tests were carried out using a stress-controlled MCR 302E rheometer (Anton Paar, Italy). The strain input generated using the stress-controlled rheometer was the same as that generated by a strain-controlled rheometer [17]. In order to minimize wall slip and ensure reliable measurements, a cross-scratched flat plate geometry with a serration gap of 1 mm and a depth of 0.5 mm was used. The flat plate was 25 mm diameter. The gap for all tests was set at 1 mm. In order to start with the same flow history, pre-shear was applied. A shear rate of 5 s−1 was applied for 30 s to remove any shear history during sampling preparation, followed by a period of rest for 60 s to reach equilibration. The temperature was kept constant at 20 ± 0.1°C using the Peltier system. Due to the volatility of casting slurry, a solvent trap was used to ensure that the slurry remained in a stable state during the test. The components added in the solvent trap were in the same ratio as the solvent in the slurry.
The LAOS program that comes with the device was selected for the test, and the initial strain amplitude was set from 0.1 to 1,000%. The stepwise loading method was used, where the shear strain was incrementally increased in stages, and each stage was maintained for a rest time of 60 s. The pickup time for each data point in tests was at the discretion of the instrument. The tests were carried out at a frequency of 0.5 Hz. This could prevent the evolution of the material during the LAOS test when the frequency was too low, while avoiding the inertial effect of instruments when the frequency was too high. At the same time, to ensure the accuracy of the experimental data, the equipment was inertially calibrated and checked at the beginning of all the tests. Each test was performed four times to check for the repeatability of the tests.
2.3 Testing and characterization
A tape-casting machine (CAM-H355, KEKO, Slovenia) was used for slurry casting, and the green tapes were sintered in a furnace (SN364760, Nabertherm, Germany). An automatic coating machine (P-250AVF, KEKO, Slovenia) was used to print silver paste on the surface of green tapes. The stability of the slurry was evaluated through settlement tests, using a TURBISCAN Lab Expert stability analyzer based on multiple light scattering produced by a French pharmaceutical company. The test temperature was set to 20 ± 0.5°C. The testing period was 48 h, during which sedimentation curves of the slurry were obtained by performing scans from the bottom to the top every 2 h. The rheological properties of the slurry were tested by means of a stress-controlled rheometer (MCR 302E, Anton Paar, Italy), and the test procedure is given in detail in Section 2.2. The tensile strengths were tested using a universal material testing machine (MTS-Model E42, MTS, USA), and the stress direction was parallel and perpendicular to the tape-casting direction. The shape of the green tapes’ tensile sample was a dumbbell, and the size was 90 mm in length, 10 mm wide at both ends and 5 mm wide in the middle, with a 5 mm chamfer. The standard GB/T 23805-2009 was used. A static thermo-mechanical analyzer (402, NETZSCH, Germany) was used to measure the shrinkage in the Z-axis direction after lamination of the green tapes, and samples were tested in an air atmosphere. The micromorphologies of the green tapes and sintered samples were characterized by scanning electron microscopy (SEM, S-4800, Hitachi, Japan).
2.4 Material characterization solutions from rheology to product performance
The non-linear material parameters given in the LAOS test allowed for precise material characterization. Depending on the point of interest, flow curves or inter-cyclic material analysis described casting slurry on a macroscopic scale. Shear-dependent structure analysis or intra-cyclic elasticity analysis methods provided more sophisticated material information on a microscopic scale. A collection of relevant rheological parameters defined the overall rheological behavior of the casting slurry during the LAOS test, potentially providing a stronger correlation with the subsequent product performance. This scheme qualitatively characterized the changes in the internal structure of casting slurry during the test and provided a basis for predicting the comprehensive performance of the subsequent product. In Figure 2, the overall route from slurry rheology testing to the comprehensive performance of green tapes is demonstrated.
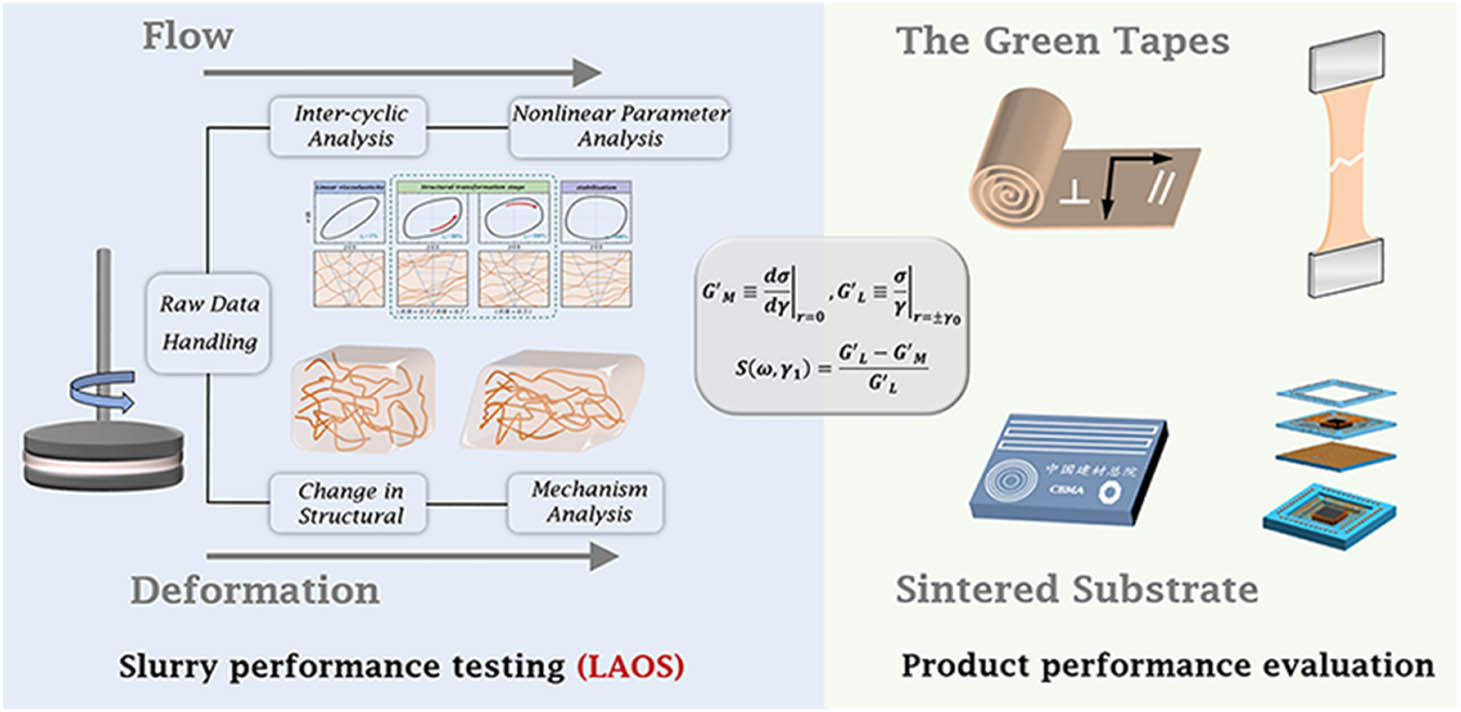
Overall route from slurry rheology testing to the comprehensive performance of green tapes.
3 Results and discussion
3.1 Study on the stability of slurry
The casting slurry is essentially a concentrated suspension system of inorganic particles dispersed in a polymer network. Sedimentation is unavoidable in this complex system due to the existence of high volume-content large particles [18,19]. The solid particles in slurry due to their own weight and thermodynamic properties show a gradual tendency to reach the lowest energy state over time, reflecting an obvious layering phenomenon in the casting slurry [20]. In order to ensure that the slurry remained in a stable state during all the tests, the sedimentation characteristics of casting slurry within 48 h were studied using the light scattering method. The backscattering data of the slurry over time were obtained by scanning the sample up and down using different wavelengths of infrared waves in the detector head. In Figure 3(a), the backscattering curves of the casting slurry at different plasticizer contents during 48 h of resting are presented. The curves for all three slurries were basically constant at the same level and had not significantly decreased over time, indicating that there was no significant sedimentation of samples. To further quantitatively describe the sedimentation characteristics of casting slurry, we calculated the stability kinetic index (TSI) for a given time at the entire sample height using backscattering data, which is expressed by the following equation:
where
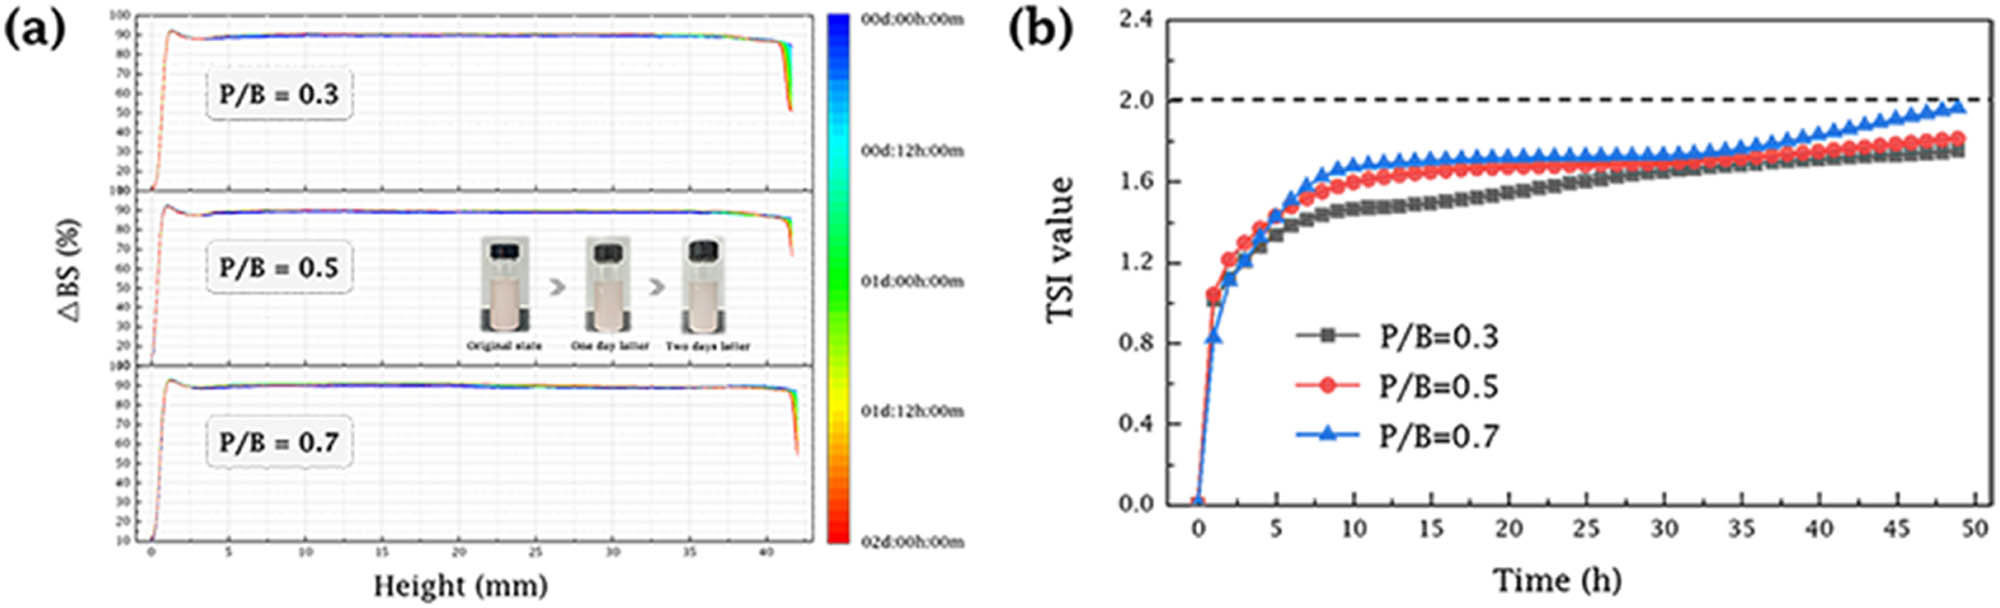
(a) Backscattering curves and (b) TSI curves with different plasticizer contents during 48 h of resting.
3.2 Rheological behavior law
The casting slurry is essentially a suspension of inorganic particles uniformly dispersed in a polymer matrix. The most critical rheological properties are shear-thinning behavior and yield stress effects. Therefore, the rheological behavior of casting slurry could be effectively described using the Herschel–Bulkley model:
for shear thinning, yield pseudoplastic:
This model captured the fundamental flow characteristics of casting slurry, where the yield stress (
Rotational shear tests were performed on the three types of casting slurries. The temperature was kept constant at 20 ± 0.1°C using the Peltier system. The shear rate range, selected based on previous research articles on casting slurries, was set between 0.1 and 200 s−¹ [19,23,24]. The shear rate was increased following a logarithmic progression. The Herschel–Bulkley model was employed to fit the resulting shear rate–shear stress curves, and the results are presented in Figure 4 and Table 1.
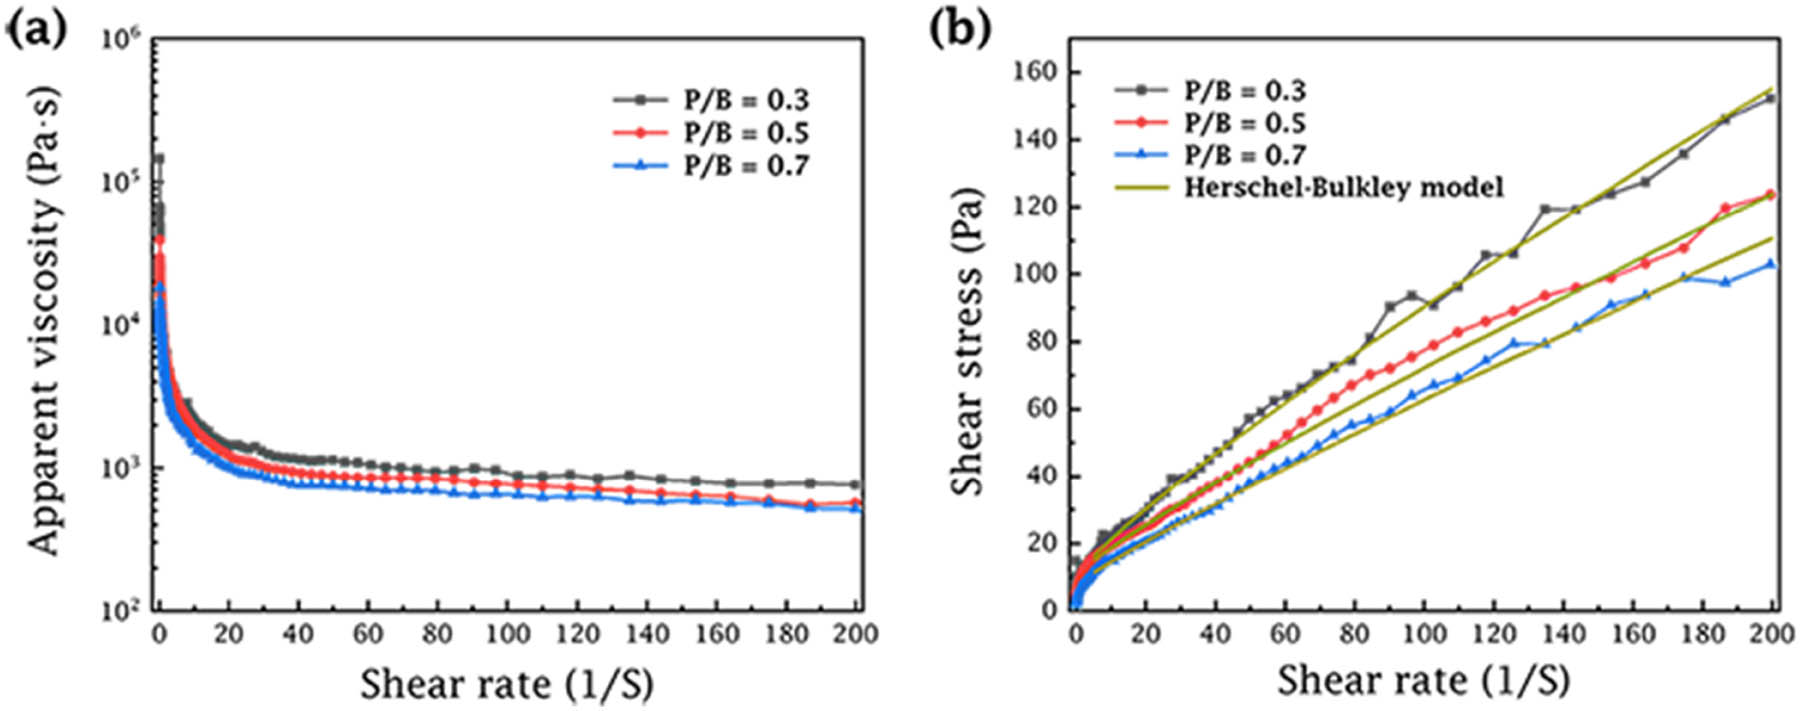
(a) Apparent viscosity (
Fitting parameters of the Herschel–Bulkley model for casting slurry with different plasticizer contents
| Herschel–Bulkley model | ||||
|---|---|---|---|---|
|
|
||||
| Yield stress (
|
Flow consistency index (
|
Flow behavior index (
|
|
|
| P/B = 0.3 | 10.052 Pa | 1.5656 | 0.85476 | 0.99707 |
| P/B = 0.5 | 10.574 Pa | 1.0768 | 0.87865 | 0.99683 |
| P/B = 0.7 | 7.7274 Pa | 0.85407 | 0.90434 | 0.99547 |
Figure 4(a) shows that the apparent viscosity of all casting slurries decreased with increasing shear rate, exhibiting pronounced shear-thinning behavior. As the plasticizer content increased, the apparent viscosity of the slurry decreased progressively. This could be attributed to the plasticizer partially acting as a small molecular solvent that dissolved the macromolecular polymer binder [7]. As shown in Figure 4(b), the Herschel–Bulkley model provides a good fit to the curves, with linear correlation coefficients (
3.3 Strain sweep test
Figure 5(a) shows the curve of the stress response of the casting slurry with the initial strain amplitude, gradually changing from SAOS to the LAOS region. The inset signals were taken during the loading and unloading of the slurry (when the solvent trap had been removed). In the linear region, both the output and input signals behaved as sinusoidal curves, and the output signals were characterized by a constant phase lag over cycling. This indicated that the material microstructure was not evolving over the cycles within the linear region [25,26]. As the initial strain amplitude increased, the output signal curve began to deviate from the sinusoidal shape in the nonlinear region. The internal structure of slurry was distorted and rearranged. Distortion of the stress response curves aggravated as the initial strain amplitude increased. At this time, the higher order harmonics (high non-linearities) had a significant contribution to the stress response and the viscous behavior began to dominate. This might indicate that the microstructure was almost fully broken, and the origin of non-linearity was mainly outside the flow [25].
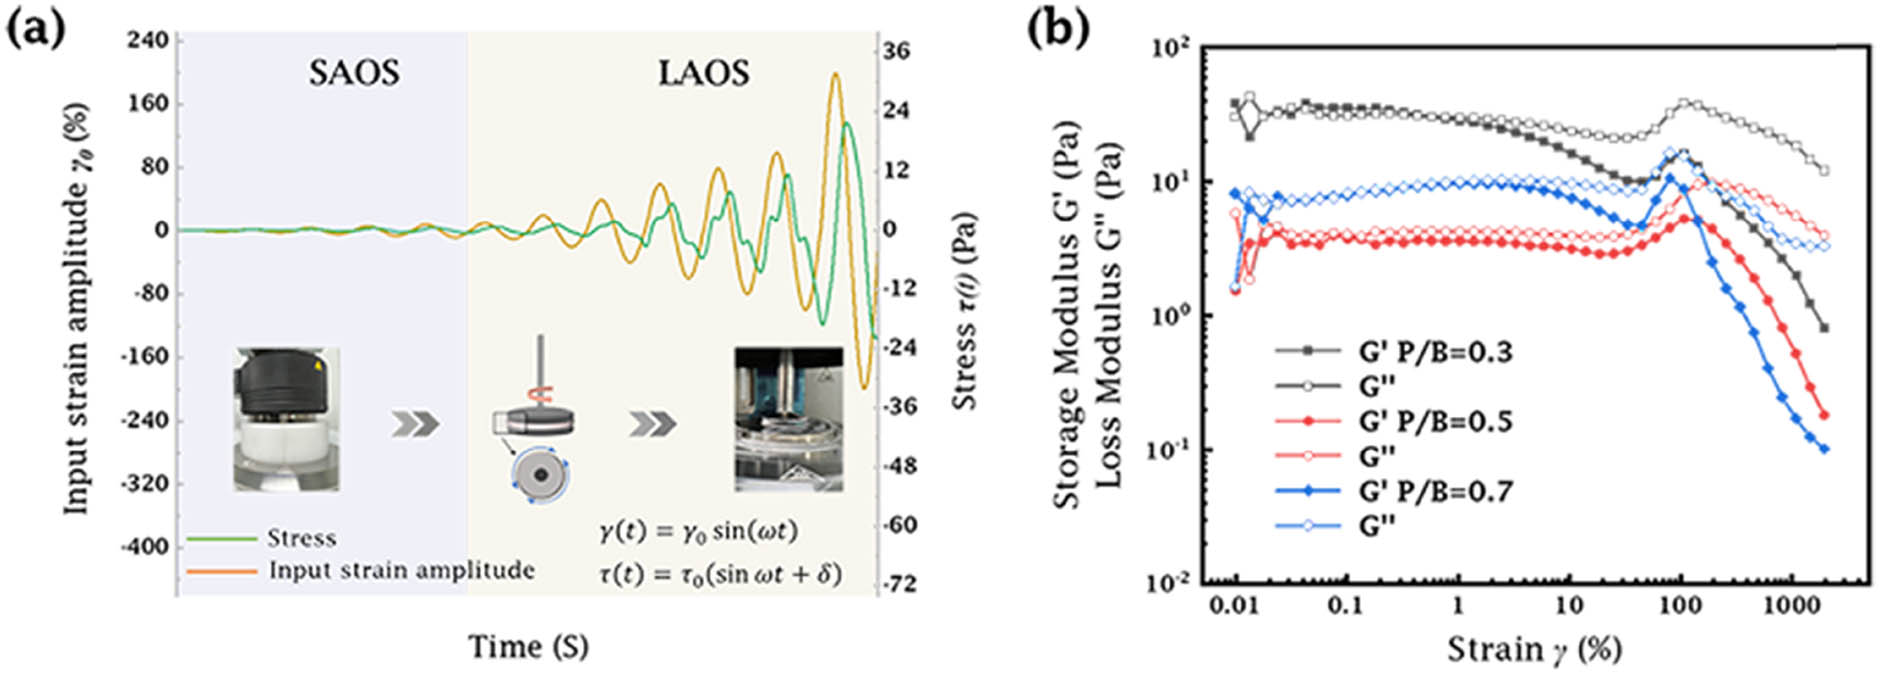
(a) Curves of the stress response of casting slurry with strain amplitude. (b) Curves of modulus as a function of strain amplitude at 0.5 Hz.
Rheological behavior of casting slurries with different plasticizer/binder ratios (P/B: 0.3, 0.5, and 0.7) was investigated by oscillatory strain sweeps tests. The curves of energy storage modulus (
Observing the trend of the given curves, the plasticizers significantly reduced the modulus of slurries and extended the linear region. This might be attributed to the fact that the material exhibited high viscosity (
3.4 Evaluation of the elastic Lissajous curves for the casting slurry
The mechanical transient characteristics during the LAOS loading period were analyzed by using Lissajous curve tracing. The original data were obtained from the steady-state periodic stress response. Since the Lissajous curve of the dissipative suspension system was not flat, a discrete filter was used to smooth the data and further for Lissajous curve analysis. The shape of the curve loop and the stress-elastic component provided important insights for evaluating the nonlinear response of material to applied deformation. The results of LAOS tests were first qualitatively described by Lissajous curves and then analyzed quantitatively using the LAOS nonlinear rheological parameters.
More information about LAOS tests could be obtained by plotting Lissajous curves with different strain amplitudes in the same graph. The elastic Lissajous curves of the casting slurry at 0.5 Hz with different plasticizer contents are given in Figure 6(a). With the increase of initial strain amplitude, the loop area of curves increased gradually. The curves changed from the initial narrow ellipse to a wider elliptical trajectory, indicating an enhancement in the nonlinearity of the casting slurry and an increase in viscosity. This had been confirmed in previous articles [38,39].
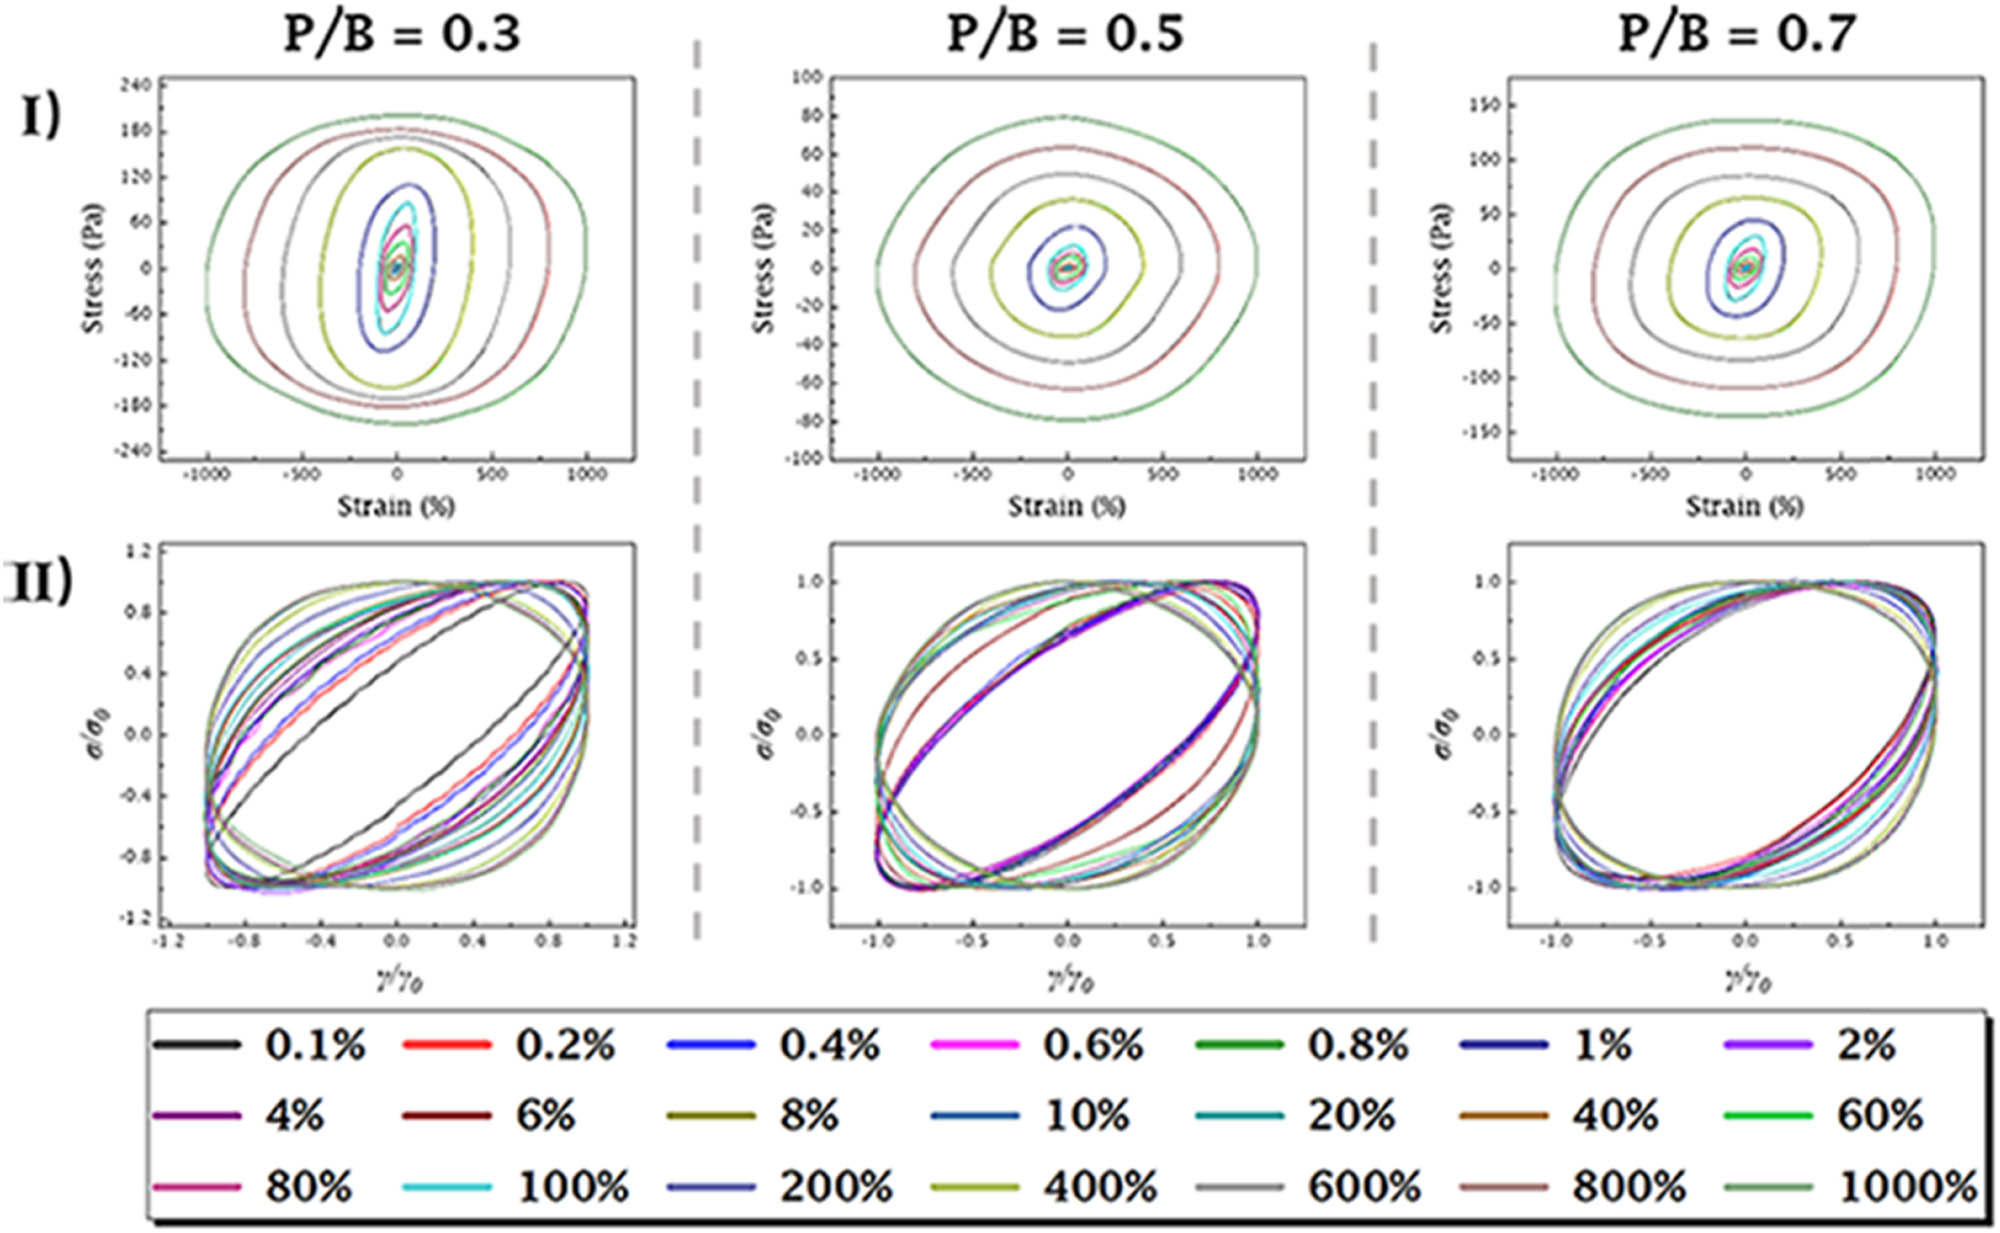
(I) Elastic Lissajous curves and (II) normalized elastic Lissajous curves with different plasticizer contents at 0.5 Hz.
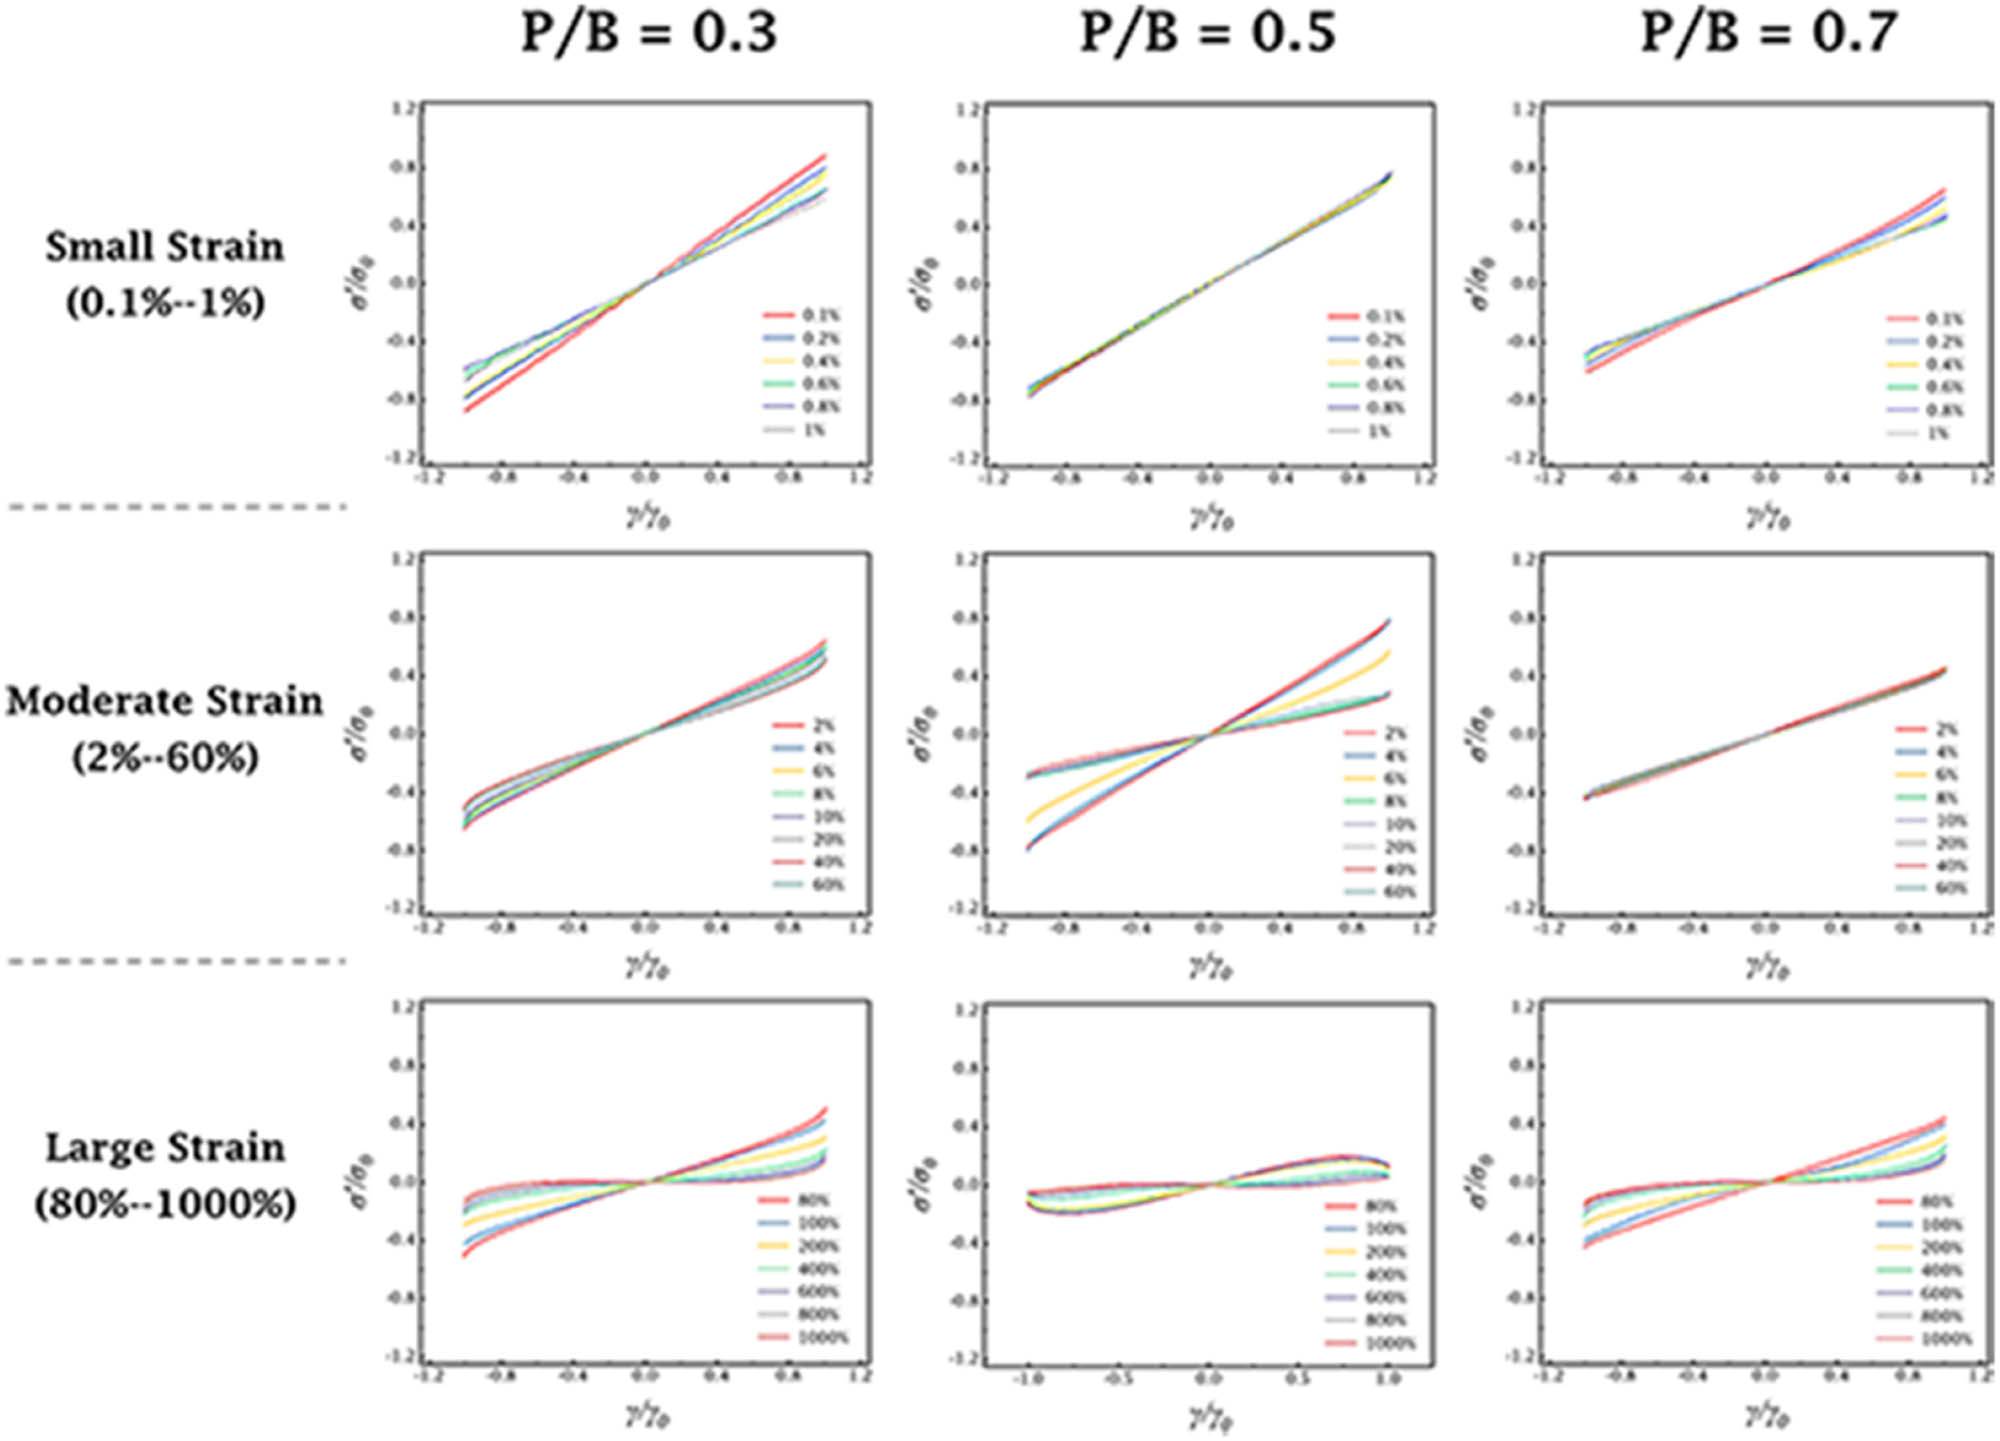
In order to more conveniently compare the loop shapes of Lissajous curves under different strains, the obtained curves were plotted normalized. The longitudinal stress response and horizontal strain amplitude data were scaled to obtain the maximum normalization result (σ/σ max and γ/γ 0), with feature scaling ensuring that the values were between −1 and 1. For the convenience of observation, the Lissajous–Bowditch curves were grouped into three sections based on the results of the strain sweep tests, which were small strain (0.1–1%), moderate strain (2–60%), and large strain (80–1,000%). The results are shown in Figure 7. Figure 6(b) shows directly the variation of the elastic Lissajous curve with the initial strain. Stress response showed an increasing trend after removing the initial narrow elliptical shape when P/B = 0.3. The transition region was not obvious during the tests as the strain increased. This could also be confirmed by the strain sweep tests in Figure 5(b). On the whole, the casting slurry was in an unstable state, and the structure was more prone to deformation when the plasticizer content was 0.3. This fact could be inferred that the internal structure of slurry was unstable, and the elastic behavior was more easily transformed into the viscous behavior of liquids [40,41]. This inference was shown in the normalized graph as the uniform and dense distribution of stress response curves. When the plasticizer content was P/B = 0.5, the Lissajous curve had the more sustained small and narrow elliptical trajectory in the linear region, showing the stronger relative elastic dominance behavior. As the plasticizer content was further increased to 0.7, it was obvious that the Lissajous curve still had a wide trajectory even in the linear region. The elastic behavior of casting slurry was weak, and the liquid-like viscous behavior began to dominate. Meanwhile, the curve showed a nearly rectangular shape under high strain amplitudes, indicating that the structural network had changed and kept in a more viscous dominant state [10,25,42]. The fluidity of slurry was increased and the formability was weakened, which was unfavorable in tape casting.
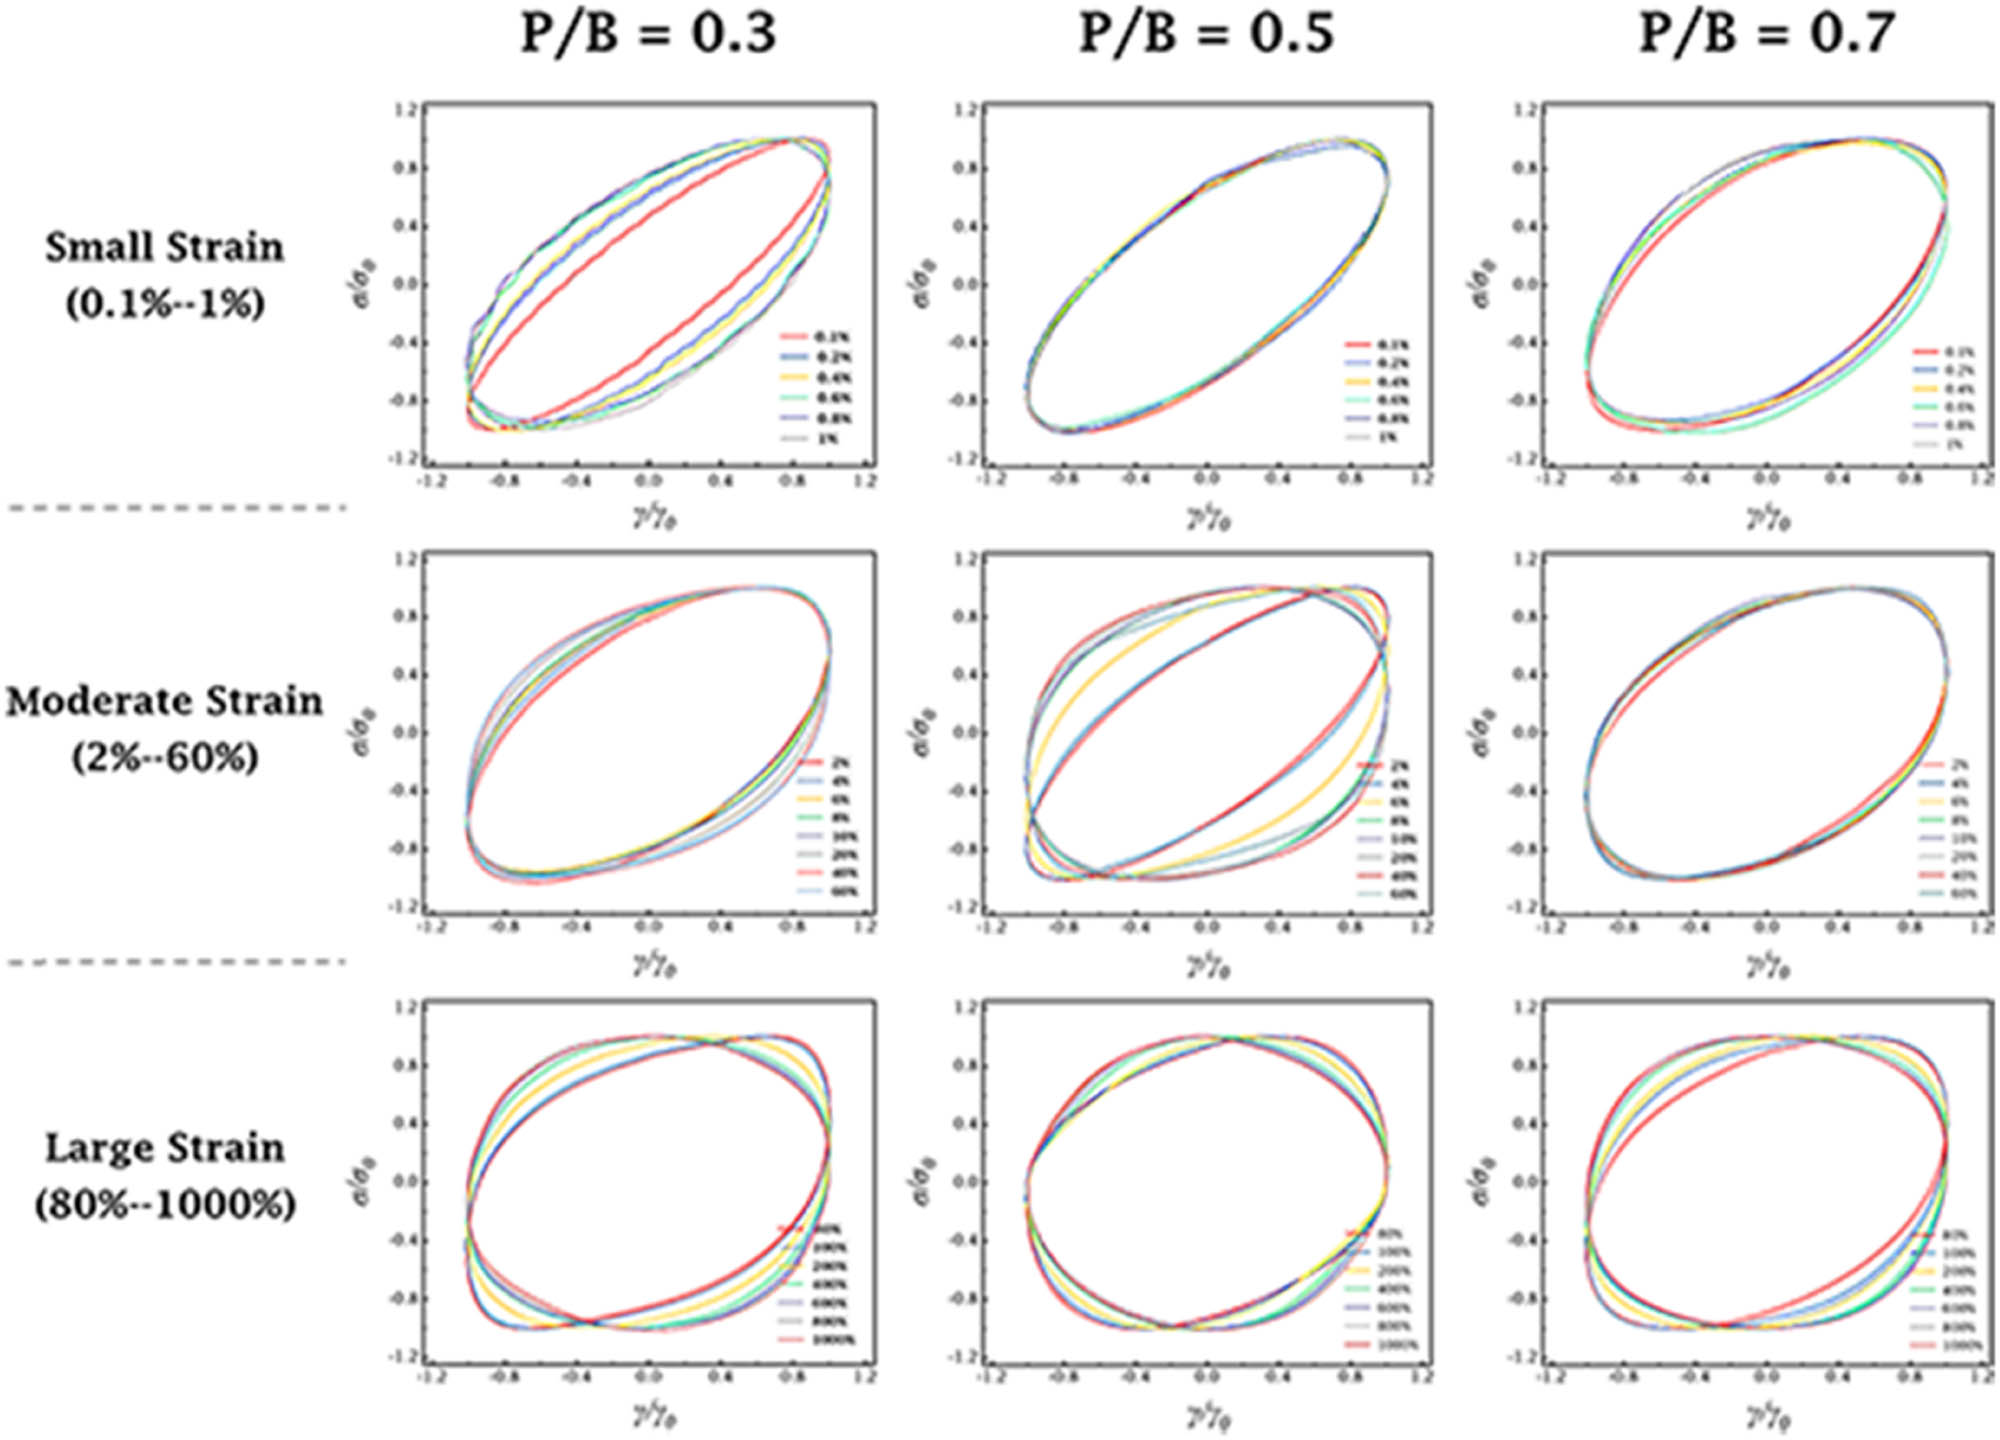
Elastic normalized Lissajous–Bowditch curves under different initial strain amplitudes.
3.5 Geometrical interpretation – intra-cycle and inter-cycle
Although the Lissajous curves roughly analyzed the degree of elastic change and structural damage of casting slurry during the shearing process, a feasible geometric decomposition method was used to independently analyze the changes in the slurry structure with an intra-cycle and an inter-cycle. Cho et al. [43] proposed using symmetry parameters to decompose the nonlinear stress response into the superposition of elastic and viscous stresses,
where
According to the property of Chebyshev polynomials
The calculation of the average component in equation (4) could be reflected on the image as the geometrically averaged curve. The rotational properties of the elastic Lissajous curve could also be reflected by the variation of the
According to equation (4), we plotted the elastic stress decomposition curves at different strains and further obtained information about the evolution of
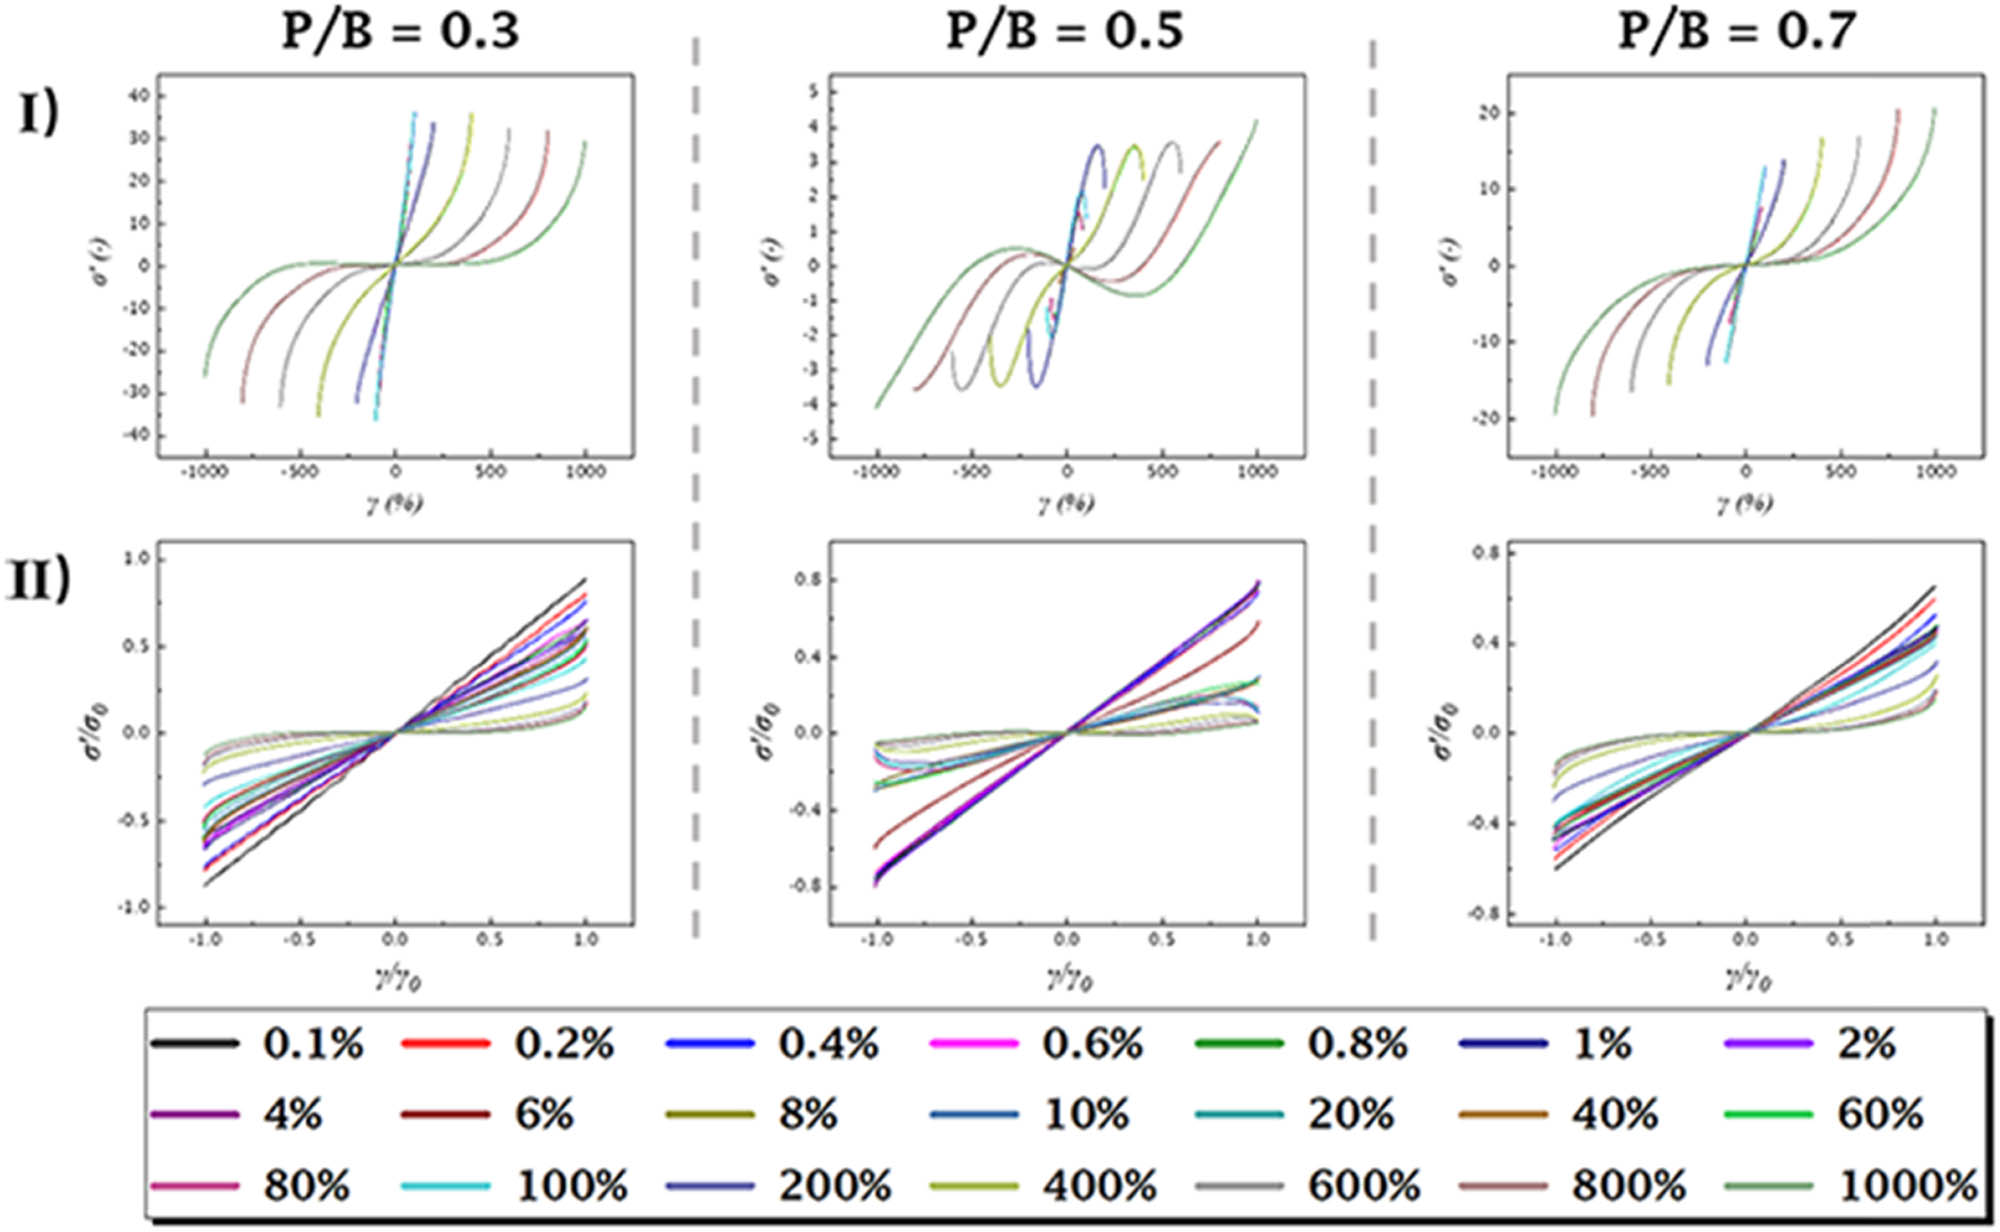
(I) Elastic
Elastic
Ewoldt et al. [38] first defined the concepts of intra-cycle and inter-cycle, providing the physical explanation for the higher Fourier coefficients which were used to describe nonlinear stress responses. The rheological behavior of the material in a stress-strain cycle was called intra-cyclic when the strain oscillated between the largest and smallest amplitudes. Inter-cycle was the behavior of changes between successive oscillations that occurred in extended cycles with different maximum applied strains [38,40,42]. In other words, the inter-cycle was the average variation of each oscillation cycle, while the intra-cycle described the internal path of the oscillation cycle. Thus, the Lissajous and
In order to better show the effect of plasticizer on the slurry structural response, Figure 10 plotted the stress–strain curves with strain from 40 to 400% by the multiple Y-axis method. When the strain amplitude was 40%, the stress responses of all slurries showed the upward curved trajectory of the Lissajous curves, indicating intra-cycle strain-stiffening. As the strain amplitude was increased to 80%, the casting slurry with a plasticizer content of P/B = 0.5 showed a diametrically opposite trend. The stress response indicated the concave downward nature of the Lissajous curve, signifying intra-cycle strain-softening. The buildup kinetics of the material was higher than the flow-induced breakage kinetics in the highly non-linear regime, leading to intra-cycle strain-stiffening and approximate elastic behavior [25]. As shown in Figure 11, the slurry structure under applied strain was significantly affected by the plasticizer when P/B = 0.5 for the softened and uniformly distributed structure [44,45]. If the content of the plasticizer continued to increase, the superfluous plasticizer segments would aggregate with each other to cause the flocculation phenomenon [6,7,46,47], resulting in a slurry still showing near-elastic behavior. Although all the complex fluids showed the same strong strain overshoot phenomenon in strain tests, the flow-induced microstructure evolution due to LAOS shear was different.
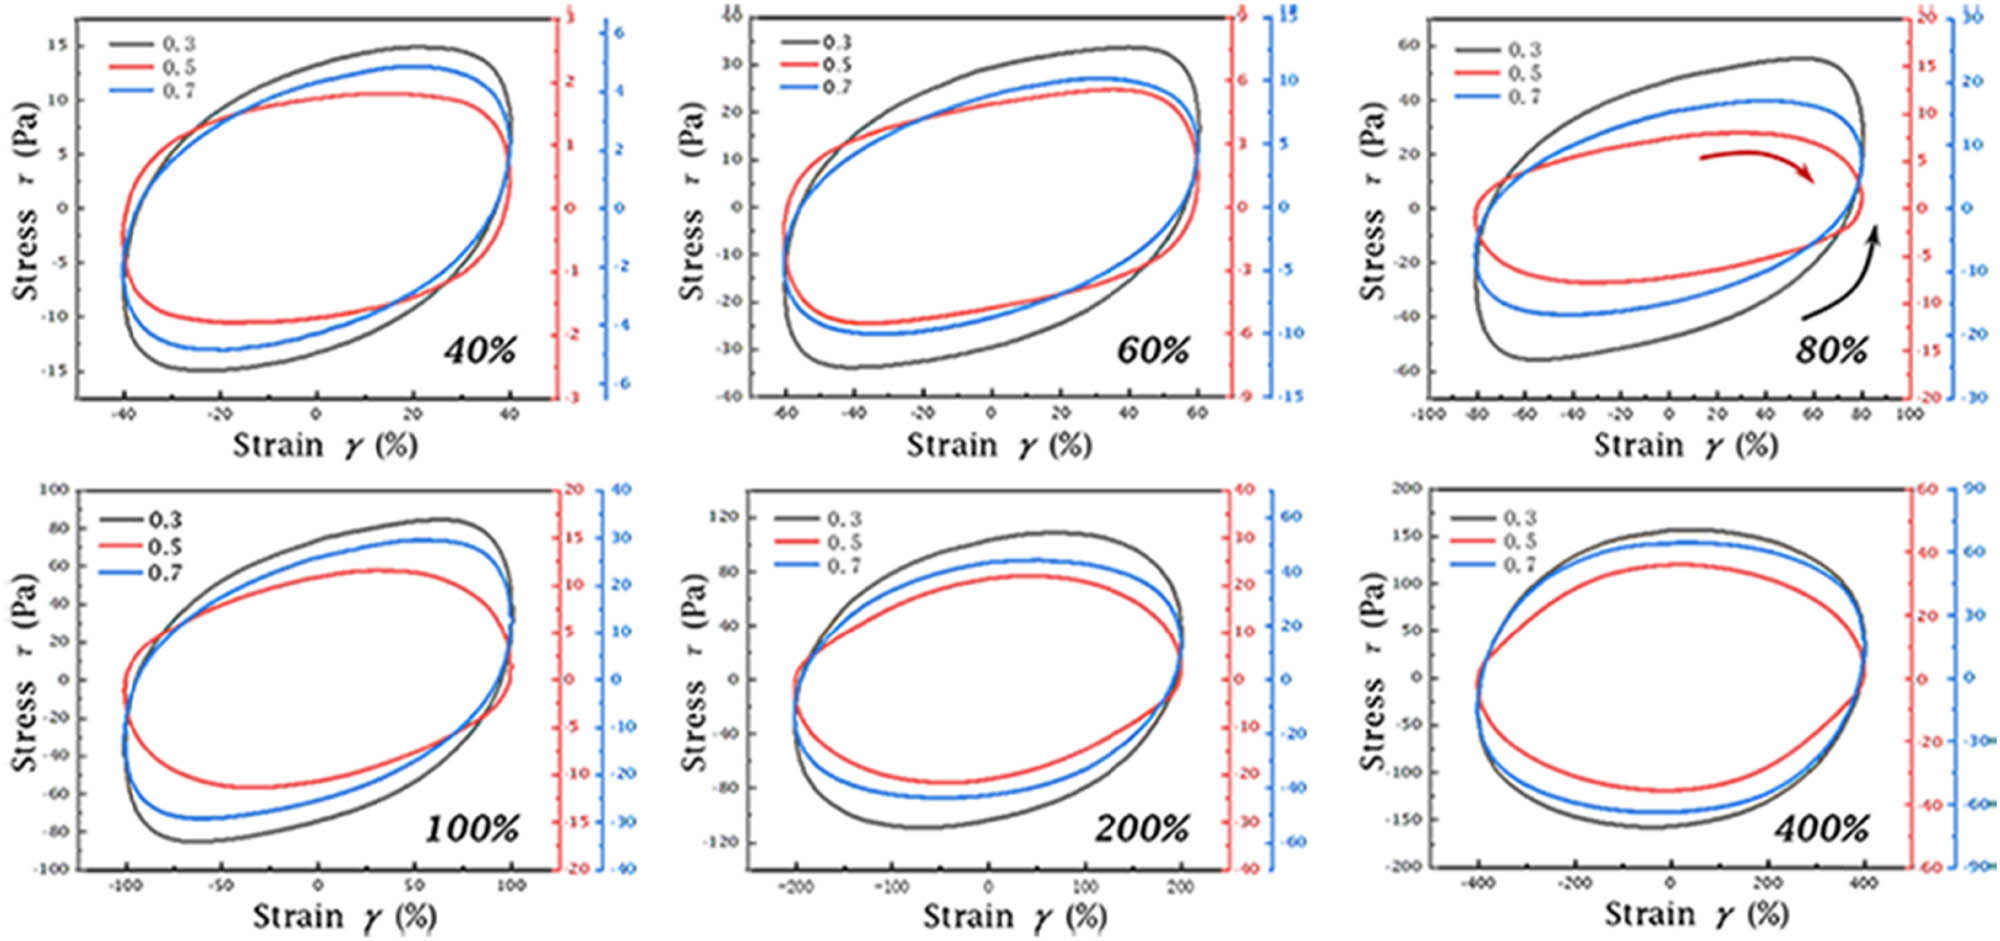
Collection of curves with strain amplitudes increasing from 40 to 400%.
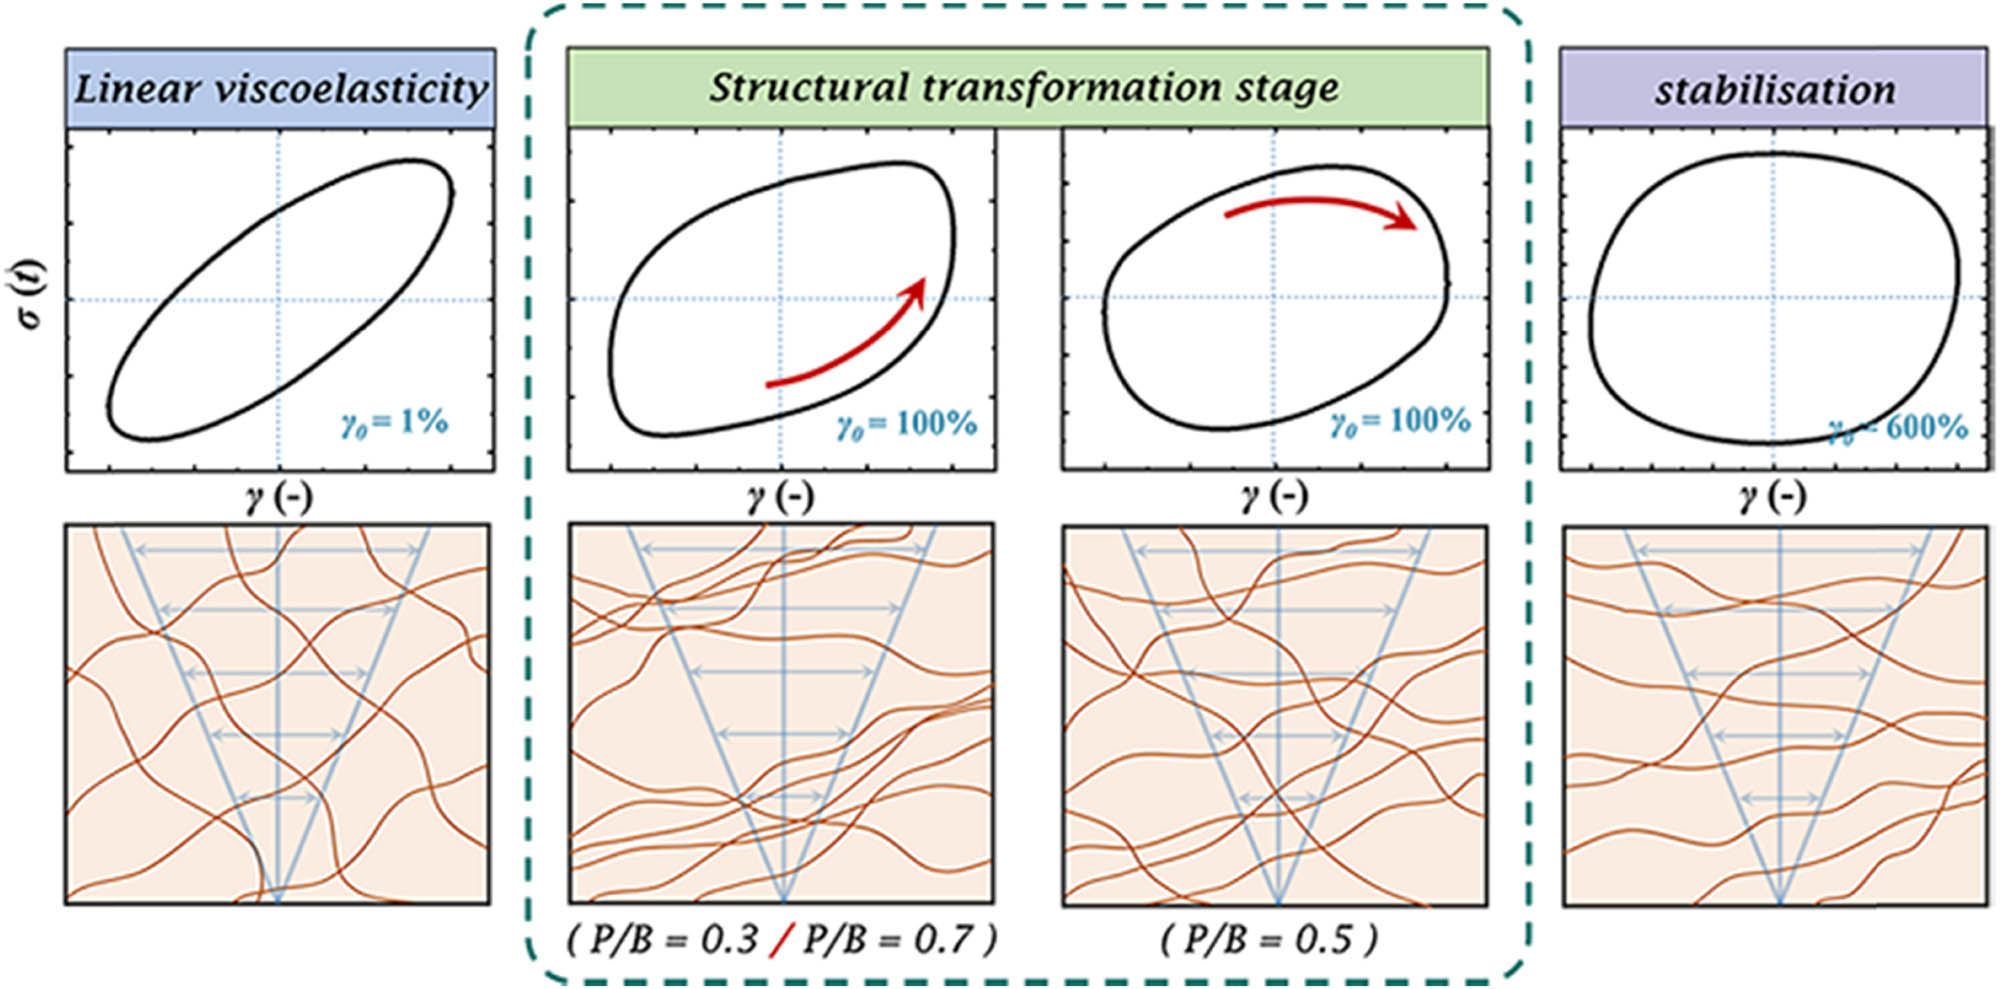
Responses of the internal structure to the applied strain at different plasticizer contents.
To make the understanding of the inter-cycle behavior of slurry easier, in Figure 12, the Lissajous and
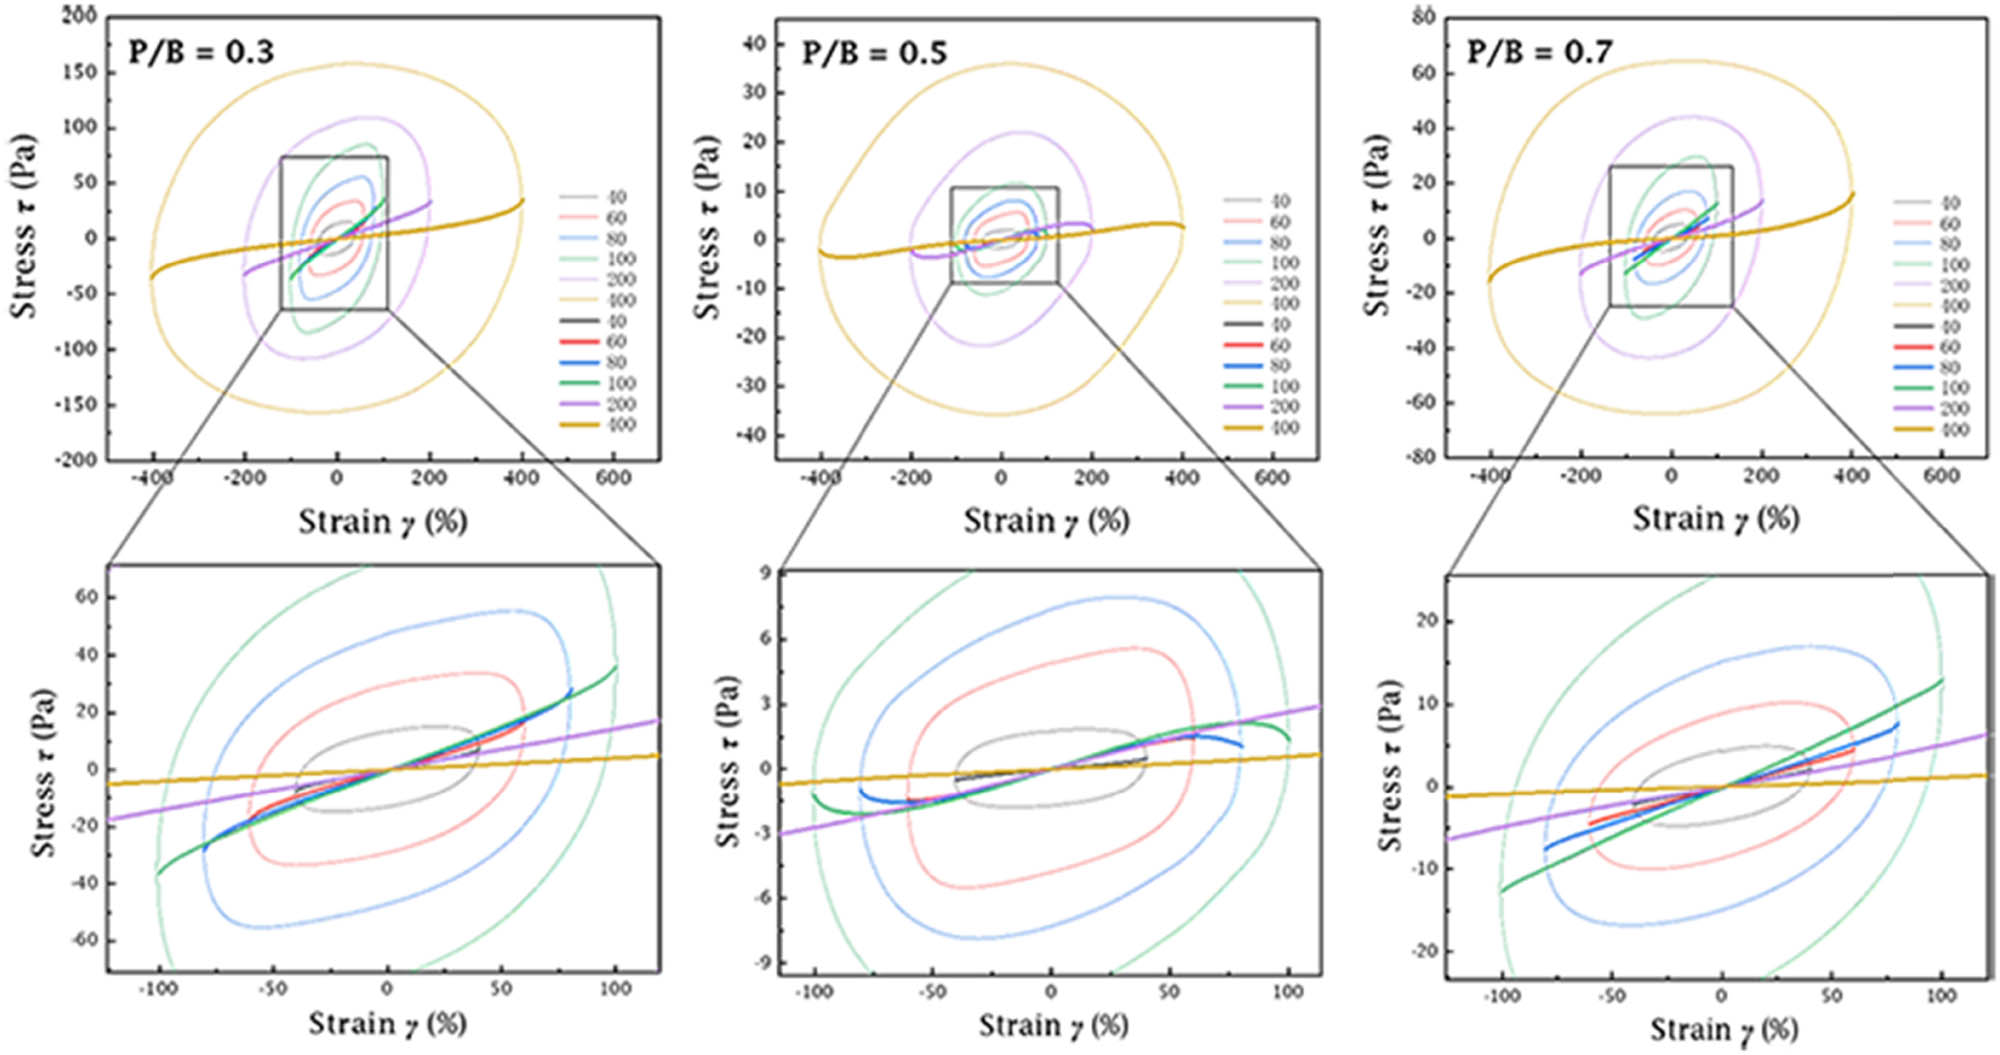
Lissajous and
Based on the above conclusions, it could be deduced that the coexistence of strain-softening between successive oscillations and strain-stiffening within the oscillation cycle was contradictory. The problem arose from the conjugation relationship between strain-stiffening in the local oscillation period and nonlinear response in the continuous oscillation period [49]. In the same repetitive cycles at each test point, the material stiffened intra-cycle and exhibited inter-cycle strain-softening throughout the LAOS tests. Therefore, there was a certain amount of variability within the strain sweep and local oscillation cycles over the entire time scale of the test [40,50]. In addition, the intra-cycle and inter-cycle definitions were based on different nonlinear parameters. Both were defined by the modulus of elasticity
3.6 Analysis of LAOS nonlinear elastic parameters
It was not rigorous to obtain the changes in the slurry structure just by observing the trajectory of the Lissajous and
where
Obviously, when
The calculated nonlinear elastic parameters (
(a) Large and minimum strain modulus (
As the applied strain reached the LAOS region (
3.7 Mechanism of plasticizers in slurry
Mastering the mechanism of plasticizer in casting slurry could better understand the variation of LAOS curves throughout the entire test. Figure 14 shows the effect of DOP as the plasticizer on the casting slurry. Due to the presence of both polar and non-polar structures in DOP molecules, its mechanism could be divided into two parts: (a) conjugation effect: the benzene ring in DOP contained six non-hybridized
Effect of DOP as the plasticizer on the casting slurry. (a) Interaction: Conjugation effect, and (b) non-polar parts: Isolation and masking.
3.8 Comprehensive performance evaluation of green tapes
The ultimate goal of adding plasticizers to the casting slurry was to make the fabricated green tapes that had better flexibility and high strength. This ensured the completion of subsequent LTCC production processes such as punching, lamination, and screen-printing. Only theoretical studies could not determine the optimum amount of plasticizer, and the comprehensive performance of the green tapes was needed as reference.
Figure 15(a)–(d) shows the maximum tensile strength, elongation at break, tensile modulus, and yield elongation of green tapes with different plasticizer contents both parallel and perpendicular to the casting direction. Comparing the maximum tensile strength in different directions with the same content of plasticizer, the stress in the parallel direction was slightly higher than that in the vertical direction. This could be attributed to the mechanical properties of green tapes, which were anisotropic [1]. The polymers were likely oriented preferentially by the shear imposed between the substrate and the blade during the casting [56]. It was obvious that the tensile strength and flexibility of green tapes showed an opposite trend with the increase of plasticizer content. The two properties reached equilibrium at P/B = 0.5. At this point, the green tapes had a high tensile strength of 4.39107 MPa with an excellent yield elongation of 13.36527%. The tensile tests were in accord with the Lissajous and
Comparison of tensile properties of green tapes with different plasticizer contents parallel and perpendicular to the casting direction. Maximum tensile strength and elongation at break of green tapes (a) parallel and (b) perpendicular to the casting direction. Tensile modulus and yield elongation of green tapes (c) parallel and (d) perpendicular to the casting direction.
The sintering shrinkage determined the quality of the co-firing matching between the green tapes and the conductor pastes. The sintering shrinkage and morphological changes of green tapes in the Z-axis direction with different plasticizer contents are given in Figure 16. Different samples showed sinter densification at the same temperature, indicating that all samples had the same sintering activity, and powders in green tapes were distributed uniformly [57]. At the same time,
(a) Morphological changes and (b) sintering shrinkage of green tapes in the Z-axis direction.
The SEM images of the surface microstructure of green tapes and the cross-sections of sintered substrates with different plasticizer contents are shown in Figure 17. The plasticizer content significantly affected the surface microstructure of green tapes. When the plasticizer content was insufficient, the surface exhibited undesirable microstructural features. During the drying process, the internal network structure of the slurry was overly rigid and the polymer matrix was relatively less fluid, making it more prone to surface defects such as cracks, voids, and uneven particle distribution. As the plasticizer content increased, the surface quality of green tapes improved. However, excessive plasticizer could lead to some issues such as phase separation, increased surface roughness, and uneven particle distribution, thereby affecting the uniformity of the microstructure. More importantly, an excessive amount of plasticizer could result in uneven solvent evaporation during the drying process, directly affecting the sinter densification and the propagation of defects during sintering. This was further confirmed by the cross-sectional SEM images of the sintered substrates.
SEM images of (I) surface microstructure of green tapes and (II) cross-sections of sintered substrates at different plasticizer contents.
As shown in Figure 17(b), the presence of pore defects during sintering could be attributed to the unique properties of the glass-ceramic material system employed. Specifically, during the sintering of glass powders, melt flow occurred as the glass reached its softening point. This phenomenon could lead to the entrapment of gas, resulting in the formation of pores [58,59]. It is worth noting that this issue is a common challenge in LTCC glass–ceramic systems due to the intrinsic properties of the CBL glass and its interaction with the ceramic phase during the sintering process. Similar findings have been reported in other studies, showing the difficulty in completely eliminating pores in such systems [19,24,60–62]. Further optimization of the sintering protocol or surface modification of the powders may help mitigate these defects.
In order to confirm the co-firing matching with the conductor silver paste, the green tapes with the plasticizer content of P/B = 0.5 were cut, punched, laminated, screen-printed, and co-fired. Figure 18 shows the surface morphology and elemental distribution of the printed lines after co-firing. The green tapes perfectly co-fired matching with the silver paste without peeling or silver diffusion, confirmed by the compatibility between the substrate and the silver film in Figure 18(b). The results of elemental mapping shown in Figure 18(d) further indicated that there was almost no permeation of Ag into the substrate, which ensured the quality of the substrate and conductivity of the circuit.
Co-fired matching of silver paste and green tapes with the plasticizer content of P/B = 0.5. (a) SEM and (b) 3D SEM images and EDS elemental (c) line scan and (d) mapping scan for the co-fired substrate.
4 Conclusions
In this study, the LAOS protocol of casting slurry with different additives was explored for the first time. The scheme enabled the characterization of all rheological properties of complex fluids in a single test. The main purpose of this study was to demonstrate that the internal structure of casting slurry with the plasticizer content could be inferred from rheological test results. It could also be confirmed by product performances.
The deviation from the sine shape in the output stress signal indicated the beginning of transition from linear to non-linear, which was also an indication of the beginning of microstructural decay in the casting slurry. At the plasticizer content of P/B = 0.5, the casting slurry had a longer LVE region. This can be attributed to the fact that the optimal plasticizer content improved the uniformity of polymer long chains, which was a clear sign of more flexible and stable structure. Additionally, the elastic Lissajous curves from the LAOS tests indicated that the slurry with this content exhibited a more sustained narrow elliptical trajectory within the linear zone. The internal network structure of the slurry was more stable under the dominance of elastic behavior. In the transition region, intra-cycle strain-softening indicated a uniformly distributed polymer network, consistent with the intended effect of the added additives. The nonlinear parameters were quantitatively determined using the LAOS theory, providing data to supplement the qualitative analysis of Lissajous curves. Furthermore, in order to confirm the conclusions obtained from the LAOS tests, this study combined the rheological data with the product properties to test the tensile mechanical properties of green tapes. As a result, the tensile strength and flexibility of green tapes were balanced at the content P/B = 0.5, with a high tensile strength of 4.39107 MPa and an excellent yield elongation of 13.36527%. Then, the good co-firing matching characteristics with conductor silver paste also ensured its wide application foundation. To summarize, the results of this study could to a certain extent help qualitatively select the content of additives from theory, saving the experimental time and reducing the production costs. On this basis, it also provided a new strategy for the development of other casting slurries in the future.
Acknowledgements
We thank Jinyu Lv for advice on experimental design and Baojing Zhu for the timely help in glass melting.
-
Funding information: This research work was supported by the Young Elite Scientists Sponsorship Program of BAST (No. BYESS2023435).
-
Author contributions: Zibin Lv: overall experiment and writing – original draft. Yun Hai: research methods and review. Enxia Guo: investigation. Hua Na: visualization. Yu Cao: investigation. Bo Xu: prepared experimental samples. Bin Han: project administration. Chengkui Zu: reviewed the manuscript abstract, introduction, and conclusion content.
-
Conflict of interest: The authors declare no conflicts of interest.
-
Ethical approval: The conducted research is not related to either human or animal use.
-
Data availability statement: The datasets generated during and/or analyzed during the current study are available from the corresponding author on reasonable request.
Appendix A: Supplementary LAOS tests at longer rest times
In the supplementary experiments, we employed the 3ITT test in oscillation mode to observe the recovery process of the casting slurry over an extended period. This allowed us to calculate the structural recovery ratio of the slurry after pre-shearing. The details of the 3ITT test and the corresponding results are illustrated in Figure A1. “The structural recovery ratio at a given time” and “the time required to achieve a specific recovery ratio” are presented in the supplementary table (Table A1).
Structural recovery ratio at a given time and the time required to achieve a specific recovery ratio of the 3ITT test
| Given recovery ratio (25%) | Given recovery ratio (50%) | Given recovery time (60 s) | Given recovery time (240 s) | Given recovery time (440 s) | |
|---|---|---|---|---|---|
| P/B = 0.5 | — | 15.113 s | 55.976% | 65.024% | 69.446% |
We selected the casting slurry with P/B = 0.5 for the supplementary experiments. The temperature was kept constant at 20 ± 0.1°C using the Peltier system. During the initial measurement section and the final recovery section, a small strain amplitude of 0.2% was applied to ensure that the slurry remained within the linear viscoelastic region. In between, a rotational shear test of 5 s−1 applied for 30 s was used to simulate the pre-shear condition. As shown in Figure A1, after rotational shear, the viscosity of the casting slurry gradually recovered over time, indicating an increasing structural recovery ratio. The structure recovery ratio of the slurry reached 50% after 15.113 s. Within the given 60 s, the structural recovery ratio reached 55.976%. With further time extension, the recovery ratio of the slurry increased to 65.024% at 240 s and to 69.446% at 440 s. These results suggested that the structural recovery capacity of the slurry diminished over time. Therefore, in order to further investigate the effect of rest time on the LAOS tests, we conducted supplementary experiments using the same casting slurry with P/B = 0.5. The results are shown in Figure A2.
(a) The details and (b) corresponding results of the 3ITT test for casting slurry with P/B = 0.5.
Supplementary experiments of (a) the elastic Lissajous curves and (b) the normalized elastic Lissajous curves of the same casting slurry with P/B = 0.5.
By comparing the elastic Lissajous curves for two different rest times, it was clear that the results of experiments conducted with 60 s rest time were in trend with the results of experiments with a longer rest time. This indicated that the rest time of the slurry did not significantly affect the qualitative analysis results of the LAOS tests. However, the 60 s rest time might result in slightly lower complex viscosity compared to the true equilibrium state, potentially affecting the accuracy of quantitative analysis in LAOS tests. On the other hand, this study focused on comparing the effects of different plasticizer contents on the performance of casting slurry. Therefore, it was essential to ensure that all tests were conducted under consistent experimental conditions.
In summary, although the rest time of 60 s did not allow for full recovery to equilibrium, supplementary experiments conducted over longer rest times demonstrated that the original testing protocol had no significant effect on the conclusions of this study. Considering the volatile nature of the casting slurry (even with the use of a solvent trap), the choice of 60 s as the rest time remained a reasonable experimental choice without compromising the reliability of the results. But, in future studies, we will give priority to longer rest times to enhance the accuracy of experimental data and the rigor of our conclusions.
References
[1] Marie J, Bourret J, Geffroy PM, Chartier T, Bienia M, Chaleix V, et al. Impact of bio-based binders on rheological properties of aqueous alumina slurries for tape casting. J Eur Ceram Soc. 2021;41(11):5593–601. 10.1016/j.jeurceramsoc.2021.03.049.Search in Google Scholar
[2] Bulatova R, Jabbari M, Kaiser A, Della-Negra M, Andersen KB, Gurauskis J, et al. Thickness control and interface quality as functions of slurry formulation and casting speed in side-by-side tape casting. J Eur Ceram Soc. 2014;34(16):4285–95. 10.1016/j.jeurceramsoc.2014.07.013.Search in Google Scholar
[3] Belon R, Boulesteix R, Geffroy PM, Maître A, Sallé C, Chartier T. Tape casting of multilayer YAG-Nd:YAG transparent ceramics for laser applications: Study of green tapes properties. J Eur Ceram Soc. 2019;39(6):2161–7. 10.1016/j.jeurceramsoc.2019.01.038.Search in Google Scholar
[4] Heunisch A, Dellert A, Roosen A. Effect of powder, binder and process parameters on anisotropic shrinkage in tape cast ceramic products. J Eur Ceram Soc. 2010;30(16):3397–406. 10.1016/j.jeurceramsoc.2010.08.012.Search in Google Scholar
[5] Chae-Woong C, Yong-Sang C, Jeong-Gu Y, Kim J, Paik U. Effects of PVB on the gelation behavior of BaTiO3-based dielectric particles and glass suspension. J Eur Ceram Soc. 2003;23(13):2315–22. 10.1016/S0955-2219(03)00087-6.Search in Google Scholar
[6] Xin M, Zhang LM, Chang Y, Ren LC, Luo XF, Zhou HQ. Modification of tape casting slurry via effective plasticization by butyl benzyl phthalate of CaO-SiO2-B2O3 glass–ceramics. J Mater Sci-Mater Electron. 2018;29(24):20546–53. 10.1007/s10854-018-0207-6.Search in Google Scholar
[7] Li J, Wang D, Shan Y, Zhou HQ. Influence of binder content and the ratio of plasticizer to binder on tape casting and sintering performance of CaO-B2O3-SiO2-Al2O3 glass/Al2O3 ceramics. J Mater Sci-Mater Electron. 2020;31(22):20022–32. 10.1007/s10854-020-04524-y.Search in Google Scholar
[8] Foghmoes S, Klemensø T, Brodersen K, Bentzen JJ, Della-Negra M. Citrate- and glycerol triesters as novel dual-functional dispersants and plasticisers for ceramic processing. Ceram Int. 2018;44(8):9132–9. 10.1016/j.ceramint.2018.02.121.Search in Google Scholar
[9] Heymann L, Aksel N. Transition pathways between solid and liquid state in suspensions. Phys Rev E. 2007;75:17358346. 10.1103/PhysRevE.75.021505.Search in Google Scholar PubMed
[10] Hyun K, Wilhelm M, Klein CO, Cho KS, Nam JG, Ahn KH, et al. A review of nonlinear oscillatory shear tests: Analysis and application of large amplitude oscillatory shear (LAOS). Prog Polym Sci. 2011;36(12):1697–753. 10.1016/j.progpolymsci.2011.02.002.Search in Google Scholar
[11] Surendra NG, Christopher AR. Fourier-transform mechanical analysis for determining the nonlinear viscoelastic properties of polymers. Polym Eng Sci. 1987;27(2):165–78. 10.1002/pen.760270211.Search in Google Scholar
[12] Yosick JA, Giacomin AJ, Moldenaers P. A kinetic network model for nonlinear flow behavior of molten plastics in both shear and extension. J Non-Newton Fluid Mech. 1997;69(1):103–23. 10.1016/S0377-0257(96)01535-2.Search in Google Scholar
[13] Mingeun K, Kim MC, Myung JS, Reza S, Choi WJ, Kyu H. Clay dispersion assessment via FT-Rheology for polypropylene/clay nanocomposites fabricated by an electric field. ACS Appl Polym Mater. 2023;5(9):7069–78. 10.1021/acsapm.3c01104.Search in Google Scholar
[14] Wehrli MC, Ini S, Jekle M, Kratky T, Becker T. Resilience study of wheat protein networks with large amplitude oscillatory shear rheology. LWT-Food Sci Technol. 2023;178:114596. 10.1016/j.lwt.2023.114596.Search in Google Scholar
[15] Goudoulas TB, Germann N. Phase transition kinetics and rheology of gelat-in-alginate mixtures. Food Hydrocoll. 2017;66:49–60. 10.1016/j.foodhyd.2016.12.018.Search in Google Scholar
[16] He Z, Rui J, Li Y. Dynamic rheological behavior of low water-to-binder ratio mortars under large amplitude oscillatory shear (LAOS). J Wuhan Univ Technol. 2018;33(3):608–18. 10.1007/s11595-018-1868-y.Search in Google Scholar
[17] Bae JE, Lee M, Cho KS, Seo KH, Kang DG. Comparison of stress-controlled and strain-controlled rheometers for large amplitude oscillatory shear. Rheol Acta. 2013;52(10):841–57. 10.1007/s00397-013-0720-8.Search in Google Scholar
[18] Mistler RE, Twiname ER. Tape casting: Theory and practice. Westerville, OH: Wiley-American Ceramic Society; 2000.Search in Google Scholar
[19] Xia YS, Hu YK, Ren LC, Luo XF, Gong WY, Zhou HQ. Manufacturing a high performance film of CaO-B2O3-SiO2 glass-ceramic powder with surface modification for LTCC application. J Eur Ceram Soc. 2018;38(1):253–61. 10.1016/j.jeurceramsoc.2017.08.003.Search in Google Scholar
[20] Luo MX, Qi XJ, Ren TX, Huang YX, Keller AA, Wang H, et al. Heteroaggregation of CeO2 and TiO2 engineered nanoparticles in the aqueous phase: Application of turbiscan stability index and fluorescence excitation-emission matrix (EEM) spectra. Colloid Surf A. 2017;533:9–19. 10.1016/j.colsurfa.2017.08.014.Search in Google Scholar
[21] Huang K, Liu R, Zhang Y, Guan X. Characteristics of two cedarwood essential oil emulsions and their antioxidant and antibacterial activities. Food Chem. 2021;346:128970. 10.1016/j.foodchem.2020.128970.Search in Google Scholar PubMed
[22] Chen WJ, Zhou JY, Zhang F, Li XK, Guo JY. Stability study of low-cost carbon quantum dots nanofluids with saline water and their application investigation for the performance improvement of solar still. Diam Relat Mater. 2023;138:110194. 10.1016/j.diamond.2023.110194.Search in Google Scholar
[23] Joanna G, Agnieszka G, Łukasz Z, Marek N, Zuzanna G, Radosław L. Influence of TMAH and NaOH on the stability of SiC aqueous suspensions. Ceram Int. 2020;46:11208–17. 10.1016/j.ceramint.2020.01.142.Search in Google Scholar
[24] Lv ZB, Hai Y, Guo EX, Cao Y, Zhang YS, Xu B, et al. Modification of CaO-B2O3-La2O3 glass powder and its application in low-temperature co-fired ceramic substrate. Ceram Int. 2022;48:35536–47. 10.1016/j.ceramint.2022.08.160.Search in Google Scholar
[25] Conte T, Chaouche M. Rheological behavior of cement pastes under Large Amplitude Oscillatory Shear. Cem Concr Res. 2016;89:332–44. 10.1016/j.cemconres.2016.07.014.Search in Google Scholar
[26] Thiedeitz M, Kränkel T, Gehlen C. Viscoelastoplastic classification of cementitious suspensions: transient and non‑linear flow analysis in rotational and oscillatory shear flows. Rheol Acta. 2022;61(8):549–70. 10.1007/s00397-022-01358-9.Search in Google Scholar
[27] Lee S, Lee K, Jang Y, Bae J. Fabrication of solid oxide fuel cells (SOFCs) by solvent-controlled co-tape casting technique. Int J Hydrogen Energ. 2017;42(3):1648–60. 10.1016/j.ijhydene.2016.07.066.Search in Google Scholar
[28] Bitterlich B, Lutz C, Roosen A. Rheological characterization of water-based slurries for the tape casting process. Ceram Int. 2002;28(6):675–83. 10.1016/S0272-8842(02)00027-5.Search in Google Scholar
[29] Sakar-Deliormanlı A, Celik E, Polat M. Preparation of the Pb(Mg1/3Nb2/3)O3 films by aqueous tape casting. J Eur Ceram Soc. 2009;29(1):115–23. 10.1016/j.jeurceramsoc.2008.05.031.Search in Google Scholar
[30] Kristoffersson A, Carlström E. Tape casting of alumina in water with an acrylic latex binder. J Eur Ceram Soc. 1997;17(2):289–97. 10.1016/S0955-2219(96)00143-4.Search in Google Scholar
[31] Tirtaatmadja V, Tam KC, Jenkins RD. Superposition of oscillations on steady shear flow as a technique for investigating the structure of associative polymers. Macromolecules. 1997;30(5):1426–33. 10.1021/ma960098v.Search in Google Scholar
[32] Gisler T, Ball RC, Weitz DA. Strain hardening of fractal colloidal gels. Phys Rev Lett. 1999;82(5):1064–7. 10.1103/PhysRevLett.82.1064.Search in Google Scholar
[33] Zhang JX, Jiang DL, Tan SH, Gui LH, Ruan ML. Aqueous processing of SiC green sheets II: Binder and plasticizer. J Mater Res. 2002;17(8):2019–25. 10.1557/JMR.2002.0299.Search in Google Scholar
[34] Kim JC, Auh KH, Schilling CH. Effects of monosaccharides and disaccharides on the rheological behavior of dense alumina slurries II. Oscillation testing method. J Korean Ceram. 1999;5(1):25–9.Search in Google Scholar
[35] Stukalin EB, Douglas JF, Freed KF. Plasticization and antiplasticization of polymer melts diluted by low molar mass species. J Chem Phys. 2010;132:084504. 10.1063/1.3304738.Search in Google Scholar PubMed
[36] Simon PP, Ploehn HJ. Modeling the effect of plasticizer on the viscoelastic response of crosslinked polymers using the tube-junction model. J Rheol. 2000;44:169–83. 10.1122/1.551082.Search in Google Scholar
[37] Ferry JD. Viscoelastic properties of polymers. 3rd edn. New York: Wiley; 1980.Search in Google Scholar
[38] Ewoldt RH, Hosoi AE, McKinley GH. New measures for characterizing nonlinear viscoelasticity in large amplitude oscillatory shear. J Rheol. 2008;52(6):1427–58. 10.1122/1.2970095.Search in Google Scholar
[39] Yazar G, Duvarci O, Tavman S, Kokini J. Non-linear rheological behavior of gluten-free flour doughs and correlations of LAOS parameters with gluten-free bread properties. J Cereal Sci. 2017;74:28–36. 10.1016/j.jcs.2017.01.008.Search in Google Scholar
[40] Ettehadi A, Tezcan M, Altun G. Rheological behavior of water-clay suspensions under large amplitude oscillatory shear. Rheol Acta. 2020;59(9):685–6. 10.1007/s00397-020-01221-9.Search in Google Scholar
[41] Hong JS, Kong HJ, Hyun K, Bergfreund J, Fischer P, Ahn KH. Rheological analysis of oil-water emulsions stabilized with clay particles by LAOS and interfacial shear moduli measurements. Rheol Acta. 2019;58(8):453–66. 10.1007/s00397-019-01144-0.Search in Google Scholar
[42] Ettehadi A, Ülker C, Altun G. Nonlinear viscoelastic rheological behavior of bentonite and sepiolite drilling fluids under large amplitude oscillatory shear. J Pet Sci Eng. 2021;208:109210. 10.1016/j.petrol.2021.109210.Search in Google Scholar
[43] Cho KS, Hyun K, Ahn KH, Lee SJ. A geometrical interpretation of large amplitude oscillatory shear response. J Rheol. 2005;49(3):747–58. 10.1122/1.1895801.Search in Google Scholar
[44] Kamkar M, Salehiyan R, Goudoulas TB, Abbasi M, Saengow C, Erfanian E, et al. Large amplitude oscillatory shear flow: Microstructural assessment of polymeric systems. Prog Polym Sci. 2022;132:101580. 10.1016/j.progpolymsci.2022.101580.Search in Google Scholar
[45] John J, Ray D, Aswal VK, Deshpande AP, Varughese S. Dissipation and strain-stiffening behavior of pectin-Ca gels under LAOS. Soft Matter. 2019;15(34):6852–66. 10.1039/c9sm00709a.Search in Google Scholar PubMed
[46] Ren LC, Luo XF, Zhou HQ. The tape casting process for manufacturing low-temperature co-fired ceramic green sheets: A review. J Am Ceram Soc. 2018;101(9):3874–89. 10.1111/jace.15694.Search in Google Scholar
[47] Kim DH, Lim KY, Paik U, Jung YG. Effects of chemical structure and molecular weight of plasticizer on physical properties of green tape in BaTiO3/PVB system. J Eur Ceram Soc. 2004;24(5):733–8. 10.1016/S0955-2219(03)00256-5.Search in Google Scholar
[48] Liu HF, Li HY, Zhao Y, Wang XF, Li HY, Zhang JJ. Nonlinear viscoelastic characteristic investigations of waxy crude oils under stress‑controlled large amplitude oscillatory shear (LAOStress). Rheol Acta. 2022;61(7):483–97. 10.1007/s00397-022-01343-2.Search in Google Scholar
[49] Saint-Michel B, Gibaud T, Manneville S. Predicting and assessing rupture in protein gels under oscillatory shear. Soft Matter. 2017;13(14):2643–53. 10.1039/b000000x.Search in Google Scholar
[50] Khandavalli S, Rothstein JP. Large amplitude oscillatory shear rheology of three different shear-thickening particle dispersions. Rheol Acta. 2015;54(7):601–18. 10.1007/s00397-015-0855-x.Search in Google Scholar
[51] Wang JJ, Zhao J, Mao JY, Liu WL, Ji HH, Zhang J, et al. Enhanced plasticity of spontaneous coagulation cast oxide ceramic green bodies. J Adv Ceram. 2024;13(5):568–78. 10.26599/JAC.2024.9220879.Search in Google Scholar
[52] Hu SS, Zhang MT, Wei YF, Qi R, Zhu YJ, Chen SJ. Interfacial effects of plasticizers on the properties of cellulose diacetate materials. Cellulose. 2022;29:7849–61. 10.21203/rs.3.rs-924710/v1.Search in Google Scholar
[53] Wypych G. Effect of plasticizers on properties of plasticized materials. In Handbook of plasticizers. 3rd edn. Toronto, Ontario, Canada: ChemTec Publishing; 2017. p. 209–332.10.1016/B978-1-895198-97-3.50012-3Search in Google Scholar
[54] Vasiliy T, Marina M, Valeriy S, Zhanna V, Tamara O, Irina B. The effect of plasticization on the properties of poly(urethaneureas) based on oligoether diols, 2,4-toluenediisocyanate, and aromatic diamines. J Elastomers Plast. 2019;51:337–58. 10.1177/0095244318784626.Search in Google Scholar
[55] Ewoldt RH, McKinley GH. On secondary loops in LAOS via self-intersection of Lissajous-Bowditch curves. Rheol Acta. 2010;49(2):213–9. 10.1007/s00397-009-0408-2.Search in Google Scholar
[56] Doreau F, Tarı G, Guedes M, Chartier T, Pagnoux C, Ferreira JMF. Mechanical and lamination properties of alumina green tapes obtained by aqueous tape-casting. J Eur Ceram Soc. 1999;19(16):2867–73. 10.1016/S0955-2219(99)00052-7.Search in Google Scholar
[57] Bian JJ, Yu Q, He JJ. Tape casting and characterization of Li2.08TiO3-LiF glass free LTCC for microwave applications. J Eur Ceram Soc. 2017;37(2):647–53. 10.1016/j.jeurceramsoc.2016.09.022.Search in Google Scholar
[58] Ewsuk KG. Effects of trapped gases on ceramic-filled-glass composite densification. Solid State Phenom. 1992;26:63–72. 10.4028/www.scientific.net/SSP.25-26.63.Search in Google Scholar
[59] Kemethmüller S, Hagymasi M, Stiegelschmitt A, Roosen A. Viscous flow as the driving force for the densification of low-temperature co-fired ceramics. J Am Ceram. 2007;90(1):64–70. 10.1111/j.1551-2916.2006.01362.x.Search in Google Scholar
[60] Marko H, Darko B, Jaroslaw K, Janez H, Jena C, Leszek G, et al. Thick-film PTC thermistors and LTCC structures: The dependence of the electrical and microstructural characteristics on the firing temperature. J Eur Ceram Soc. 2007;27:2237–43. 10.1016/j.jeurceramsoc.2006.08.005.Search in Google Scholar
[61] Fu Y, Li J, Li PZ, Tao HJ, Luo XF, Wang DJ, et al. Fabrication of a high-performance film of CaO-B2O3-SiO2 glass-ceramic via surface modification with titanate coupling agent. J Alloy Compd. 2020;815:152387. 10.1016/j.jallcom.2019.152387.Search in Google Scholar
[62] Qi SS, Zuo RZ, Ma ZS. Densification kinetics and anisotropic microstructure evolution in LTCC films constrained by rigid substrate. Ceram Int. 2016;42:3388–96. 10.1016/j.ceramint.2015.10.133.Search in Google Scholar
© 2025 the author(s), published by De Gruyter
This work is licensed under the Creative Commons Attribution 4.0 International License.
Articles in the same Issue
- Research Articles
- Lie symmetry analysis of bio-nano-slip flow in a conical gap between a rotating disk and cone with Stefan blowing
- Mathematical modelling of MHD hybrid nanofluid flow in a convergent and divergent channel under variable thermal conductivity effect
- Advanced ANN computational procedure for thermal transport prediction in polymer-based ternary radiative Carreau nanofluid with extreme shear rates over bullet surface
- Effects of Ca(OH)2 on mechanical damage and energy evolution characteristics of limestone adsorbed with H2S
- Effect of plasticizer content on the rheological behavior of LTCC casting slurry under large amplitude oscillating shear
- Studying the role of fine materials characteristics on the packing density and rheological properties of blended cement pastes
- Deep learning-based image analysis for confirming segregation in fresh self-consolidating concrete
- MHD Casson nanofluid flow over a three-dimensional exponentially stretching surface with waste discharge concentration: A revised Buongiorno’s model
- Rheological behavior of fire-fighting foams during their application – a new experimental set-up and protocol for foam performance qualification
- Viscoelastic characterization of corn starch paste: (II) The first normal stress difference of a cross-linked waxy corn starch paste
- An innovative rheometric tool to study chemorheology
- Effect of polymer modification on bitumen rheology: A comparative study of bitumens obtained from different sources
- Rheological and irreversibility analysis of ternary nanofluid flow over an inclined radiative MHD cylinder with porous media and couple stress
- Rheological analysis of saliva samples in the context of phonation in ectodermal dysplasia
- Brief Report
- Correlations for friction factor of Carreau fluids in a laminar tube flow
- Special Issue on the Rheological Properties of Low-carbon Cementitious Materials for Conventional and 3D Printing Applications
- Rheological and mechanical properties of self-compacting concrete with recycled coarse aggregate from the demolition of large panel system buildings
- Effect of the combined use of polyacrylamide and accelerators on the static yield stress evolution of cement paste and its mechanisms
- Special Issue on The rheological test, modeling and numerical simulation of rock material - Part II
- Revealing the interfacial dynamics of Escherichia coli growth and biofilm formation with integrated micro- and macro-scale approaches
- Construction of a model for predicting sensory attributes of cosmetic creams using instrumental parameters based on machine learning
- Effect of flaw inclination angle and crack arrest holes on mechanical behavior and failure mechanism of pre-cracked granite under uniaxial compression
- Special Issue on The rheology of emerging plant-based food systems
- Rheological properties of pea protein melts used for producing meat analogues
- Understanding the large deformation response of paste-like 3D food printing inks
- Seeing the unseen: Laser speckles as a tool for coagulation tracking
- Composition, structure, and interfacial rheological properties of walnut glutelin
- Microstructure and rheology of heated foams stabilized by faba bean isolate and their comparison to egg white foams
- Rheological analysis of swelling food soils for optimized cleaning in plant-based food production
- Multiscale monitoring of oleogels during thermal transition
- Special Issue on Hydromechanical coupling and rheological mechanism of geomaterials
- Rheological behavior of geopolymer dope solution activated by alkaline activator at different temperature
- Special Issue on Rheology of Petroleum, Bitumen, and Building Materials
- Rheological investigation and optimization of crumb rubber-modified bitumen production conditions in the plant and laboratory