Comprehensive physical and chemical characterization highlights the uniqueness of enzymatic gelatin in terms of surface properties
-
Weijie Zhang
 ,
Ying Wang
,
Ying Wang

Abstract
To shorten the long process of conventional alkaline extraction of gelatin, an enzyme-aided method was demonstrated, which was simpler, more effective, and environmental friendly. The main properties of enzymatic gelatin and conventional alkaline gelatin were comprehensively analyzed, including rheological properties, foaming properties, emulsifying properties, water absorption capacity, and thermal stability. It was found that enzymatic gelatin exhibits neutral isoelectric points of 7.4–7.8, higher imino acid content (21.85%, on average), and excellent emulsifying properties, thermal stability, and foaming properties (181%, on average), but lower water absorption properties (5.8 g‧g−1, on average). These findings would be beneficial for the future applications of enzymatic gelatin.
1 Introduction
Gelatin is derived from the partial degradation of collagen, which is a major constituent of animal skin and bone. It is used in numerous industrial applications, such as food processing, pharmaceutical manufacture, and photography, owing to its unique physicochemical properties and excellent biocompatibility and biodegradability [1]. Moreover, gelatin could be extracted from many sources, such as aquatic animals [2,3,4], mammals [5,6], poultry [7,8], and so on. Conventionally, gelatin is prepared by the acidic or alkaline hydrolysis of collagen [9]. In recent years, enzyme aided gelatin extraction process has attracted increasing research attention due to its high production efficiency and low pollution [10,11].
In a typical gelatin extraction process, first the insoluble collagen is treated with acid, alkali, or enzyme to destroy its natural triple helix structure, which result in sufficient swelling. Subsequently gelatinized collagen is converted into gelatin with partial cleavage of hydrogen and covalent bonds by thermal denaturation. Of the various commercially available proteolytic enzymes, acid aspartic enzyme is preferred in gelatin extraction [2,12,13]. They can cleave the telopeptide region of collagen, which is crucial in disrupting the intramolecular and intermolecular covalent cross-linking of native collagen. Currently, despite the lack of widespread market application, gelatin prepared by enzyme-aided degradation of collagen has high gel strength and viscosity [14], which can meet the requirements of Chinese pharmacopoeia and European pharmacopoeia, and is bound to become the main product classification in the future gelatin market. Furthermore, with the aid of enzyme, a complete gelatin extraction process can be shortened to just 3 days from about 40–60 days for the conventional alkaline extraction. And the long extraction process might confront more difficulties in temperature and humidity change, which could easily affect the qualities of gelatin. In addition to gel strength and viscosity, a series of functional characteristics such as the sol-gel point, foaming ability, emulsifying property, water holding capacity, and so on have great influences on the properties of the final product. Because the mechanism of collagen by enzymatic hydrolysis is different from that by alkaline, the different properties of these two types of gelatin need to be further studied including the freezing point, foaming capacity, emulsifying property, and water holding capacity.
Thus, major issues that the industry is concerned about are: (1) When taking the yield and gel strength of gelatin as criteria, will the enzyme-aided extraction process conditions be constrained to a very small range of options, or on the contrary show a relatively wider selection range? (2) Whether the physical and chemical properties of the enzymatic gelatin show diversified characteristics due to the difference in the extraction condition? (3) What unique properties will they share when compared with conventional alkaline extracted gelatin? In the current study, a series of process parameter combinations were tried, including temperature, extraction duration, pH, enzyme concentration, etc. For samples that meet the yield and gel strength requirements, their physical and chemical properties were compared in detail with alkaline gelatin, including rheological, emulsifying, foaming, isoelectric point, and water absorption capacity. And the difference in amino acids composition and structure between enzymatic gelatin and alkaline gelatin were also analyzed.
2 Materials and methods
2.1 Chemicals and materials
All bovine bones used in this work were from the same batch, kindly provided by the gelatin manufacturer. Hydrochloric acid, calcium hydroxide, and polyacrylamide were purchased from Pecking Reagent (Beijing, China). Amino acid standard substances were purchased from Sigma-Aldrich (Shanghai, China). All water used in this work was distilled water.
2.2 Gelatin extraction
2.2.1 Alkaline gelatin
First, the bovine bones were defatted and cut into granules with the size of 5–10 mm. Then, bovine bone granules were immerged into HCl solutions to remove the inorganic component. Then, the bone granules were soaked into lime milk for 50 days to break the triple helix structure and remove the non-collagenous impurities. In order to make collagen fully contact with the lime milk and reduce the growth of bacteria, new lime milk should be replaced every 5–10 days. Four alkaline gelatin samples, LB-1, LB-2, LB-3, and LB-4, were batch extracted in a multi-stage batch process [15] at temperatures between 55°C and 70°C to improve the yield, as shown in Figure 1. When the time and temperature of extraction increase, the chains of collagen would be inevitably broken and cleaved, and impurities would be more likely to be dissolved out into the product. As a result, the properties of alkaline gelatin decrease with batch increases. And as the first batch of alkaline gelatin, LB-1 has the best quality among four alkaline gelatin samples.
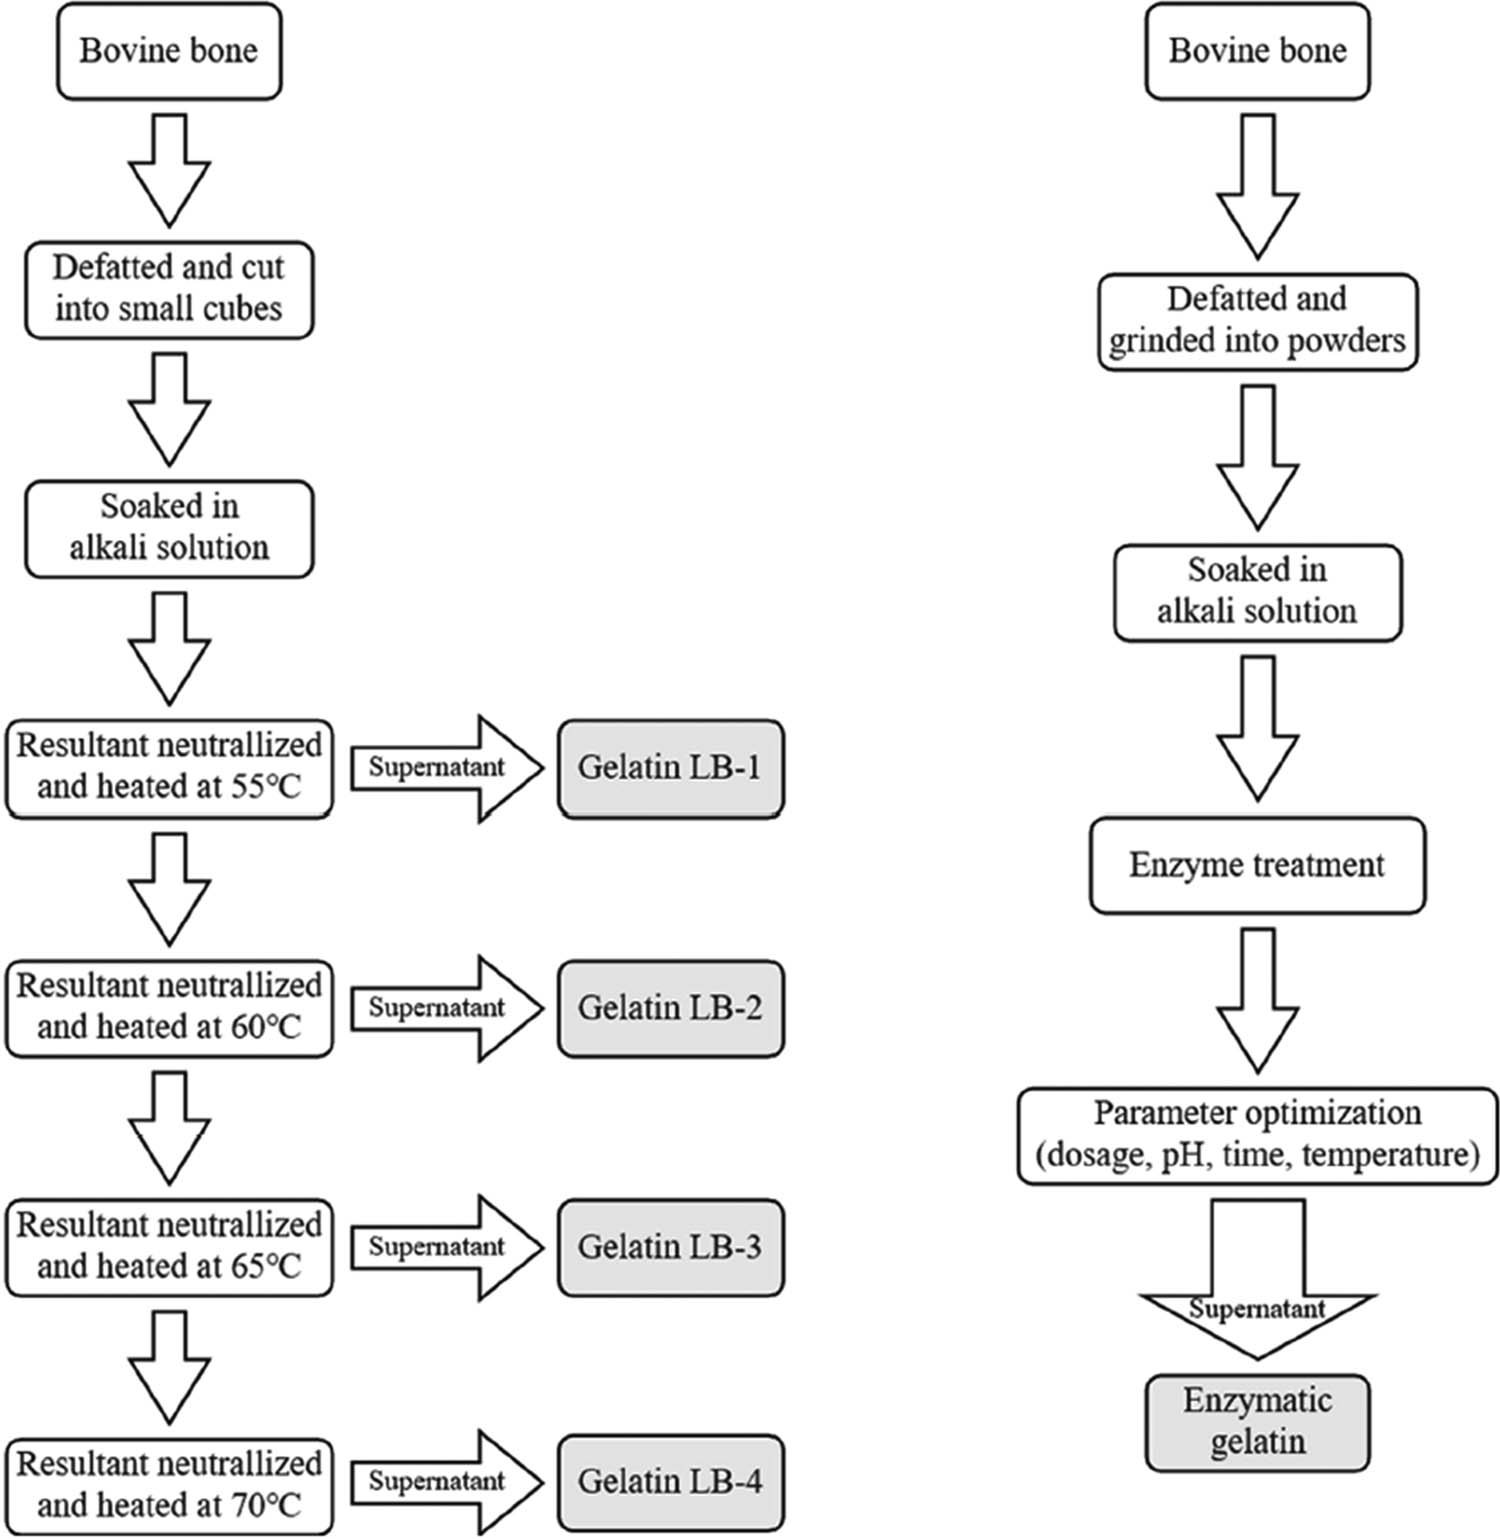
Schematic diagram of extractions of alkaline gelatin and enzymatic gelatin.
2.2.2 Enzymatic gelatin
Bovine bones were defatted and ground into powders in order to increase the chance of contact with the enzyme. The degreased bovine bone powders were stirred in HCl solution to remove inorganic substances and other impurities, and then centrifuged. The sediments were divided into portions of 100 g randomly and treated with the enzyme. After enzymatic treatments, the solid–liquid mixtures were separated by centrifugation, and enzymatic gelatin samples were obtained after freeze-drying the supernatants.
2.3 Gelatin quality
2.3.1 Water and ash contents
The water and ash contents were determined according to the AOAC standard methods 930.15 and 942.05.
2.3.2 Color and clarity
The color and clarity were determined with a spectrophotometer using 6.67% (w/v) gelatin solution at a wavelength of 450 and 620 nm [15].
2.3.3 Gel strength
The gel strength was determined on 6.67% (w/v) gelatin solution by a CT3 texture analyzer (Brookfield Co., USA) with a 1.27 cm diameter flat-faced cylindrical plunger, using the official procedure of the Gelatin Manufacturers Institute of America, Inc. (GMIA). 6.67% (w/v) gelatin solution was first dissolved in a 60°C water bath and then matured in a bloom jar at 10°C for 17 h to form stable gels. Gel strength was the maximum force when the gel was compressed 4 mm by the plunger at the speed of 0.5 mm·s−1.
2.3.4 Viscosity
The determination of viscosity was performed on a vertical capillary viscometer, Bertrand Viscosity Tester ND-1 (Guoming Medical Equipment Co., Ltd, Tianjin, China), according to the official procedure of GMIA. In this apparatus, the viscosity was worked out by the time of samples flowing through the same path by the force of Gravity at 60°C.
2.3.5 Gelling temperature
The measuring apparatus of gelling temperature is depicted in Figure 2, according to Muyonga [16] with minor modifications. Solutions of the gelatin samples (10% w/v, 50 mL) at 35°C were poured into the inner test tube (labeled “c” in Figure 2), which was surrounded by an outer tube containing water at 35°C to serve as a buffer layer (labeled “b” in Figure 2). The inner and outer tubes were suspended in a transparent glass beaker containing water at 15 ± 1°C (labeled “a” in Figure 2). When a thermometer was inserted into the inner test tube and moved in a circular manner, air bubbles began to rise constantly. As the temperature of the gelatin solution gradually decreased, the rising of the bubbles slowed down. When the gelatin solution started to form a gel and the bubbles stopped rising, the thermometer was lifted slightly, at which point the temperature rose slightly and then fell, and the highest temperature at the time of temperature rise was defined as the gelling point.
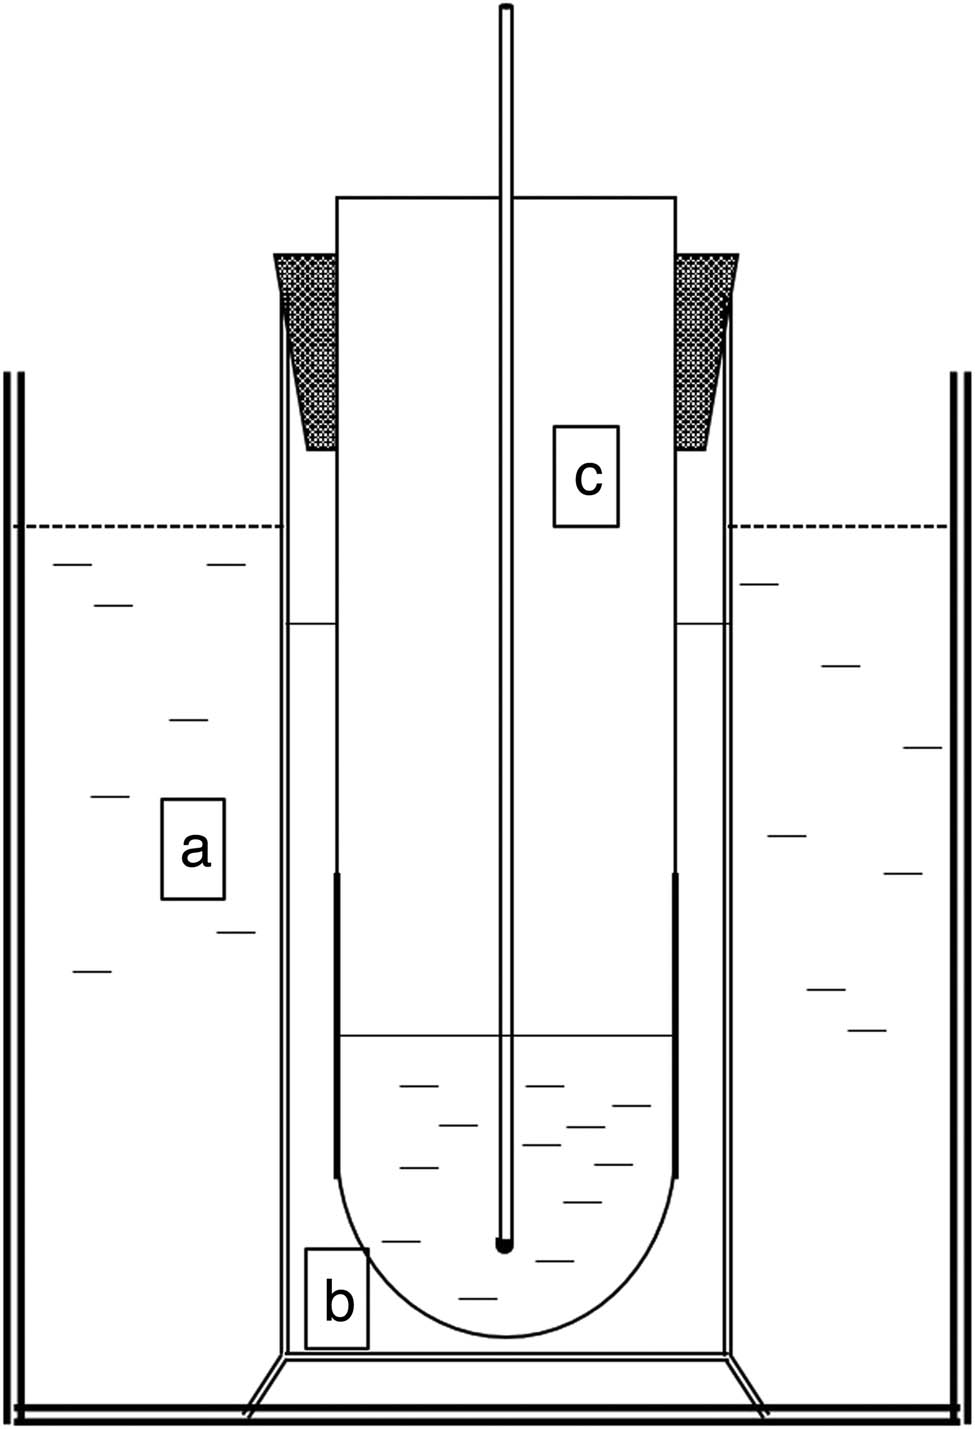
Apparatus used to determine the gelling temperature; (a) transparent glass beaker with water at 15°C, (b) buffer layer containing water at 35°C, and (c) inner test tube with gelatin samples.
2.4 Composition and molecular structure
2.4.1 Amino acid analysis
The gelatin samples were transferred to ampoules under nitrogen and subjected to hydrolysis in 6 M HCl at 110°C for 24 h [17]. The hydrolyzed samples were then quantitatively transferred into evaporating dishes with water and heated to 60°C to remove the residual hydrochloric acid. The resulting residues were diluted with loading buffer, filtered through 0.45 μm membrane filters, and injected into an amino acid analyzer Biochrom 30+ series (Biochrom Ltd., Cambourne, Cambridge, UK).
2.4.2 Electrophoretic analysis
The SDS-PAGE experiment was performed using a gradient polyacrylamide gel from 4% to 12%, according to a previous report with minor modifications [10]. The gelatin samples (4.7 mg·mL−1, 2 μL) and a wide-range (60–260 kDa) protein marker (Invitrogen, LC5800) were separately loaded into different wells. Electrophoresis was conducted using a vertical electrophoresis apparatus at a constant voltage of 120 V for 60 min. The gel was stained with Instant Blue (Sigma) to visualize the bands and destained in water. Four samples of alkaline gelatin and three samples of enzymatic gelatin were analyzed.
2.4.3 Isoelectric point determination
The isoelectric points of the gelatin samples were determined by a pH-meter [15]. Solutions of the gelatin samples (0.5% w/v, 100 mL) were stirred in a water bath maintained at 30°C for 1 h with 2.5 g cationic resin and 2.5 g anionic resin, followed by filtration and collection of the supernatants. The pH of the supernatant was taken as the isoelectric point of the gelatin sample.
2.4.4 Circular dichroism spectroscopy
The structures of the gelatin samples were analyzed using a circular dichroism spectrometer J-810 (Jasco Corporation, Tokyo, Japan). Spectra of solutions of the gelatin samples (0.5 mg·mL−1) were obtained in the far-UV region from 190 to 260 nm at room temperature [14].
2.4.5 Raman spectroscopy
Raman spectra of gelatin samples were measured by Renishaw inVia (Wotton-under-Edge, UK) equipped with a 633 nm laser of 50 mW of power, according to Cao [13]. Data acquisition was performed in a range of 700–1,800 cm−1.
2.4.6 Thermogravimetric analysis
Thermogravimetric analysis of the gelatin samples was conducted using a simultaneous thermal analyzer STA 409 PC (NETZSCH-Feinmahltechnik GmbH, Selb, Germany) under N2 atmosphere from 20°C to 550°C at a heating rate of 10°C·min−1, according to Otalora [18] with modification.
2.5 Foaming properties
The foam expansion (FE) and foam stability (FS) of solutions of the gelatin samples were measured according to a previously described method [5]. The gelatin solutions (2% w/v, 100 mL) were homogenized with a homogenizer at a speed of 12,000 rpm for 1 min, transferred into a measuring cylinder, and placed in a 60°C water bath. The volumes of the gelatin solutions were measured every 5 min after homogenization for 1 h. The FE and FS were calculated as per Eqs. 1 and 2:
where V T is the total solution volume immediately after homogenization, V 0 is the solution volume prior to homogenization, and V t is the solution volume t min after homogenization.
2.6 Emulsifying properties
The emulsion activity index (EAI) and emulsion stability index (ESI) of the gelatin samples were determined according to a previously reported method [19] with minor modifications. The gelatin solutions (2% w/v, 30 mL) were homogenized with 10 mL of soybean oil at 24,000 rpm for 1 min to form emulsions. At 0 and 10 min after homogenization, 100 μL samples of the emulsions were withdrawn from the bottom using a pipette and diluted with 5 mL of 0.1% SDS solution. The solutions were mixed thoroughly using a vortex mixer for 20 s, and the absorbance was measured at 500 nm using a UV-Vis spectrophotometer after being diluted 10 times. The EAI and ESI were calculated as per Eqs. 3 and 4:
where A t is the absorbance of the diluted solution at 500 nm, N is the dilution factor, φ is the soybean oil volume fraction, and C is the gelatin concentration.
2.7 Water absorption capacity
Gelatin samples (2 g) were immersed in water for 10, 20, 30, 40, 50, or 60 min, according to Li et al. [17] with modification. After removing the samples from the water, the excess water was removed from the sample surface by vacuum filtration and the samples were reweighed. The water absorption capacity was calculated as per Eq. 5:
where W t is the weight of the gelatin sample after immersion in water for 10, 20, 30, 40, 50, or 60 min and W 0 is the initial weight of the gelatin sample.
2.8 Statistical analysis
The data were presented as mean values ± standard deviation (SD). Statistical analysis was performed by SPSS software. The differences between the mean values were compared by one-way ANOVA procedure. The difference was considered significant at p < 0.05.
3 Results and discussion
3.1 Yield and quality
To activate the enzyme efficiently, the conditions of enzymatic treatments were ranged within the dosage of 30–50 U·g−1, pH of 2.5–4.5, temperature of 50–60°C, and treatment time of 45–75 min. Gel strength, viscosity, and yields of 9 samples were tested, and the results are shown in Table 1. The yields of all 9 enzymatic gelatin samples were above 14%, while the sum yield of LB-1, LB-2, LB-3, and LB-4 was about 14%. Almost all 9 enzymatic gelatin samples exhibited gel strength similar or above that of alkaline gelatin LB-1. It was indicated that taking yield and gel strength as criteria, the enzyme-aided extraction process conditions would be constrained to a relatively wider selection range. Most importantly, these relatively diverse enzyme-aided extraction conditions provide an excellent opportunity to examine whether there are common functional characteristics that distinguish enzymatic gelatin from conventional gelatin. Three enzymatic gelatin samples, with their gel strength similar to alkaline gelatin LB-1, were studied in detail and listed as EB-1, EB-2, and EB-3.
Conditions of enzymatic hydrolysis process
| Enzyme dosage (U·g−1) | Treatment time (min) | pH | Extraction temperature (°C) | Yield (%) | Gel strength (Bloom g) | Viscosity (mPa·s) | |
|---|---|---|---|---|---|---|---|
| 1(EB-1) | 30 | 75 | 4.5 | 60 | 17.31 | 269 | 4.55 |
| 2 | 40 | 45 | 3.5 | 60 | 17.13 | 280 | 3.71 |
| 3 | 50 | 60 | 2.5 | 60 | 17.49 | 292 | 3.36 |
| 4(EB-2) | 50 | 45 | 4.5 | 55 | 17.62 | 269 | 4.14 |
| 5 | 40 | 75 | 2.5 | 55 | 16.97 | 293 | 3.32 |
| 6(EB-3) | 30 | 60 | 3.5 | 55 | 14.56 | 270 | 4.31 |
| 7 | 40 | 60 | 4.5 | 50 | 15.84 | 284 | 4.27 |
| 8 | 50 | 75 | 3.5 | 50 | 16.98 | 302 | 3.86 |
| 9 | 30 | 45 | 2.5 | 50 | 14.18 | 284 | 4.31 |
The water content of a particular gelatin sample is determined by the drying parameters used during production. The ash content, however, is an indicator of the gelatin purity. All gelatin samples show similar water and ash contents.
Gel strength and viscosity were key characteristics of gelatin. As shown in Table 2, enzymatic and alkaline gelatin all exhibited high gel strength above 210 g, which could be designated as high-Bloom gelatin [15]. Gel strength decreased when the batch number of alkaline gelatin increased. Commonly, the decrease in gel strength was related to fragmentation of collagen chains during extraction [4]. LB-2, 3, and 4 showed no existence of β and γ chains, as shown in Figure 3, resulting in the fact that their gel strength was lower than LB-1 and EB-1 to 3.
Composition and quality of enzymatic and alkaline gelatin
| Sample | Moisture (%) | Ash (%) | Gel strength (Bloom g) | Viscosity (mPa·s) | Gelling temperature (°C) | Clarity | Color | Isoelectric point |
|---|---|---|---|---|---|---|---|---|
| LB-1 | 10.81 ± 0.03a | <1 | 273 ± 7.07a | 4.69 ± 0.06a | 24.7 ± 0.15a | 97.1 ± 1.98a | 88.8 ± 1.77a | 4.74 ± 0.02a |
| LB-2 | 10.73 ± 0.01b | <1 | 248 ± 0b | 4.67 ± 0.13a | 23.9 ± 0.05b | 93.5 ± 0.78b | 80.3 ± 0.42b | 5.00 ± 0.01b |
| LB-3 | 10.58 ± 0.01c | <1 | 228 ± 2.83c | 4.91 ± 0.06b | 23.9 ± 0.31b | 94.2 ± 1.27b | 80.3 ± 0.92b | 5.03 ± 0.01b |
| LB-4 | 10.81 ± 0.04a | <1 | 211 ± 3.54d | 5.22 ± 0.08c | 23.8 ± 0.26b | 91.6 ± 0.99c | 75.7 ± 0.14c | 5.03 ± 0.00b |
| EB-1 | 10.61 ± 0.04d | <1 | 269 ± 3.74a | 4.51 ± 0.07d | 25.6 ± 0.33c | 94.9 ± 0.09b | 83.7 ± 0.08d | 7.60 ± 0.04c |
| EB-2 | 10.41 ± 0.10e | <1 | 270 ± 2.83a | 4.16 ± 0.10e | 26.1 ± 0.29cd | 90.7 ± 0.05c | 71.5 ± 0.05e | 7.79 ± 0.05d |
| EB-3 | 10.06 ± 0.07f | <1 | 267 ± 3.40a | 4.31 ± 0.04f | 26.2 ± 0.10d | 97.4 ± 0.09a | 88.3 ± 0.05a | 7.43 ± 0.04e |
Different superscripts in the same column indicate significant differences (p < 0.05).

SDS-PAGE of the gelatin samples. Lane 1: sample EB-1; lane 2: sample EB-2; lane 3: sample EB-3; lane 4: sample LB-1; lane 5: sample LB-2; lane 6: sample LB-3; and lane 7: sample LB-4.
In the conventional extraction method, when gel strength was high, the viscosity was low and the color and clarity were light. Similar results were observed from LB-1 to 4 in Table 2. However, things were different when it came to enzymatic and alkaline gelatin. Enzymatic gelatin had lower viscosity than alkaline gelatin, with similar gel strength. And the differences might be influenced by the distinguishing isoelectric points [20].
The mean gelling temperatures for the various gelatin samples are listed in Table 2. The enzymatic gelatin samples displayed higher gelling points than the average of alkaline gelatin samples by 1.3°C, indicating that the gels derived from the enzymatic gelatin samples possessed better thermostability, which may be related to the concentration of the imino acids proline and hydroxyproline [21]. According to the results of amino acid analysis (Table 3), the enzymatic gelatin samples had an average imino acid content of 21.85%, which was higher than the value of 21.58% observed for the alkaline gelatin sample. Proline and hydroxyproline residues facilitate intra- and intermolecular crosslinking in gelatin solution, thus stabilizing the triple helical structure and improving thermostability. The stable structure of the enzymatic gelatin samples was also confirmed by the circular dichroism spectra. Excellent thermostability is desirable for gelatin in some applications. For example, it helps maintain the gel state within a certain temperature range, leading to a better mouth feel [22] and easier processing.
Amino acid compositions of enzymatic and alkaline gelatin (g/100 g)
| Amino acid | LB-1 | EB-1 | EB-2 | EB-3 | E̅B | |
|---|---|---|---|---|---|---|
| Hydrophilic amino acid | Arg | 6.42 | 6.50 | 6.57 | 6.22 | 6.43 ± 0.19 |
| Asx | 4.36 | 4.37 | 4.51 | 4.33 | 4.40 ± 0.09 | |
| Cys | 0.11 | 0.11 | 0.11 | 0.10 | 0.11 ± 0.01 | |
| Glx | 16.13 | 16.60 | 16.34 | 16.81 | 16.58 ± 0.24 | |
| Gly | 20.48 | 19.76 | 19.85 | 19.25 | 19.62 ± 0.32 | |
| His | 1.21 | 1.24 | 1.23 | 1.30 | 1.26 ± 0.04 | |
| Lys | 3.31 | 3.33 | 3.39 | 3.31 | 3.34 ± 0.04 | |
| Ser | 2.46 | 2.47 | 2.56 | 2.48 | 2.50 ± 0.05 | |
| Thr | 1.82 | 1.77 | 1.84 | 1.77 | 1.79 ± 0.04 | |
| Hyp* | 10.20 | 10.15 | 9.97 | 10.57 | 10.23 ± 0.31 | |
| Hydrophobic amino acid | Pro* | 11.38 | 11.56 | 11.51 | 11.78 | 11.62 ± 0.14 |
| Ala | 11.91 | 11.86 | 11.50 | 11.73 | 11.70 ± 0.18 | |
| Ile | 1.19 | 1.15 | 1.21 | 1.19 | 1.18 ± 0.03 | |
| Leu | 2.34 | 2.37 | 2.50 | 2.41 | 2.43 ± 0.07 | |
| Met | 1.08 | 1.00 | 0.91 | 0.98 | 0.96 ± 0.05 | |
| Phe | 2.77 | 2.73 | 2.81 | 2.69 | 2.74 ± 0.06 | |
| Tyr | 0.63 | 0.88 | 0.95 | 0.88 | 0.90 ± 0.04 | |
| Val | 2.21 | 2.16 | 2.23 | 2.19 | 2.19 ± 0.04 |
*Stands for imino acid.
3.2 Composition and molecular structure
3.2.1 Amino acid composition
The amino acid composition of gelatin, which has a considerable influence on the resulting properties, is mainly dependent on the origin. All of the gelatin samples used in this work were extracted from bovine bones. Table 3 presents the amino acid compositions of the four gelatin samples, which exhibited only minor differences resulting from the different preparation methods. Enzymes are highly selective and only cleave specific bonds, whereas alkalis cleave all peptide bonds indiscriminately. Like the conventional alkaline gelatin sample, all three of the enzymatic gelatin samples were rich in glycine, glutamic acid/glutamine, alanine, proline, and hydroxyproline but low in methionine, tyrosine, and histidine [17]. In a previous study, a regular Gly-X-Y sequence was found in collagen molecules, where Y was always hydroxyproline and X was typically proline [23]. The imino acids, hydroxyproline, and proline affect the gelation property of gelatin. The hydroxyl group of hydroxyproline also plays a role in the formation of hydrogen bonds [9]. Naturally, there should be no existence of cysteine in the structure of type I collagen. However, very low levels of cysteine were detected in all gelatin samples (approximately 0.1 g/100 g). This may indicate that the gelatin samples contained some other protein impurity, such as elastin [24].
3.2.2 Electrophoretic characteristic
The SDS-PAGE results for four batches of alkaline gelatin and the three enzymatic gelatin samples are presented in Figure 3. The gelatin samples produced via both methods contained α1 and α2 chains as the major components and were characterized as type I [25]. And all samples contained γ chain, while β chain could only be observed clearly in EB-3. The absence of β chains in other samples might be attributable to the cleavage of interchain crosslinks [26], and the contents of β and γ chains might be slightly regulated by changing the enzymatic conditions during extraction. Lower molecular weight bands existed in all samples, and a strong band with a lower molecular weight than α chains was observed for EB-3 sample, which may be attributable to degradation of α, β, and γ chains during extraction [19]. A similar result was previously reported in the reference [27]. For alkaline gelatin samples, the contents of α1 and α2 chains decreased as the batch increased, which might explain why the first batch of alkaline gelatin typically exhibits high gel strength [5]. In general, the enzymatic and alkaline samples all displayed little evidence of degradation, indicating high integrity of the collagen chains.
3.2.3 Isoelectric point
As listed in Table 2, the enzymatic gelatin samples displayed isoelectric points around neutral pH (7.43–7.79), whereas that of the alkaline gelatin sample occurred at acidic pH (4.74–5.05), similar to acidic gelatin. Usually, gelatin with high content of basic amino acid displays high isoelectric points, and basic amino acids contain Arg, Lys, and His. As shown in Table 3, EB-1 and EB-2 contained a bit more Arg, Lys, and His, and EB-3 had a higher content of Lys and His than LB-1. According to literature, during alkaline treatment, Asn and Gln in collagen would change into Asp and Glu [28], which are acid amino acids. The increase in acid amino acids would decrease the isoelectric points of gelatin. However, the amino acid analysis made in this work cannot distinguish Asn and Asp, Glu, and Gln, resulting from the hydrolysis of samples in hydrochloric acid. Enzymatic gelatin extraction had no alkaline treatment and alkaline gelatin extraction had a long alkaline treatment process. This might explain the high isoelectric points in the enzymatic gelatin.
3.2.4 Circular dichroism spectroscopy
Circular dichroism spectroscopy was used to evaluate the secondary and tertiary structures of the gelatin chains. As shown in Figure 4a, typical random coil dominated spectra were observed for all four samples, which may be attributable to the low concentration [14]. The band in the region of 220 nm was ascribed to the triple-helix structure [29], and it was readily apparent that this structure was more prominent in the enzymatic gelatin samples than in the alkaline gelatin sample. The intensity ratio of the positive peak to the negative peak (Rpn value) was also used to measure the amount of the triple helical conformation in solution [30]. The Rpn values of the enzymatic gelatin samples were all in excess of 0.061, whereas that of the alkaline gelatin sample was only 0.029. Overall, the circular dichroism spectra indicated that the enzymatic gelatin samples possessed a slightly more stable structure.
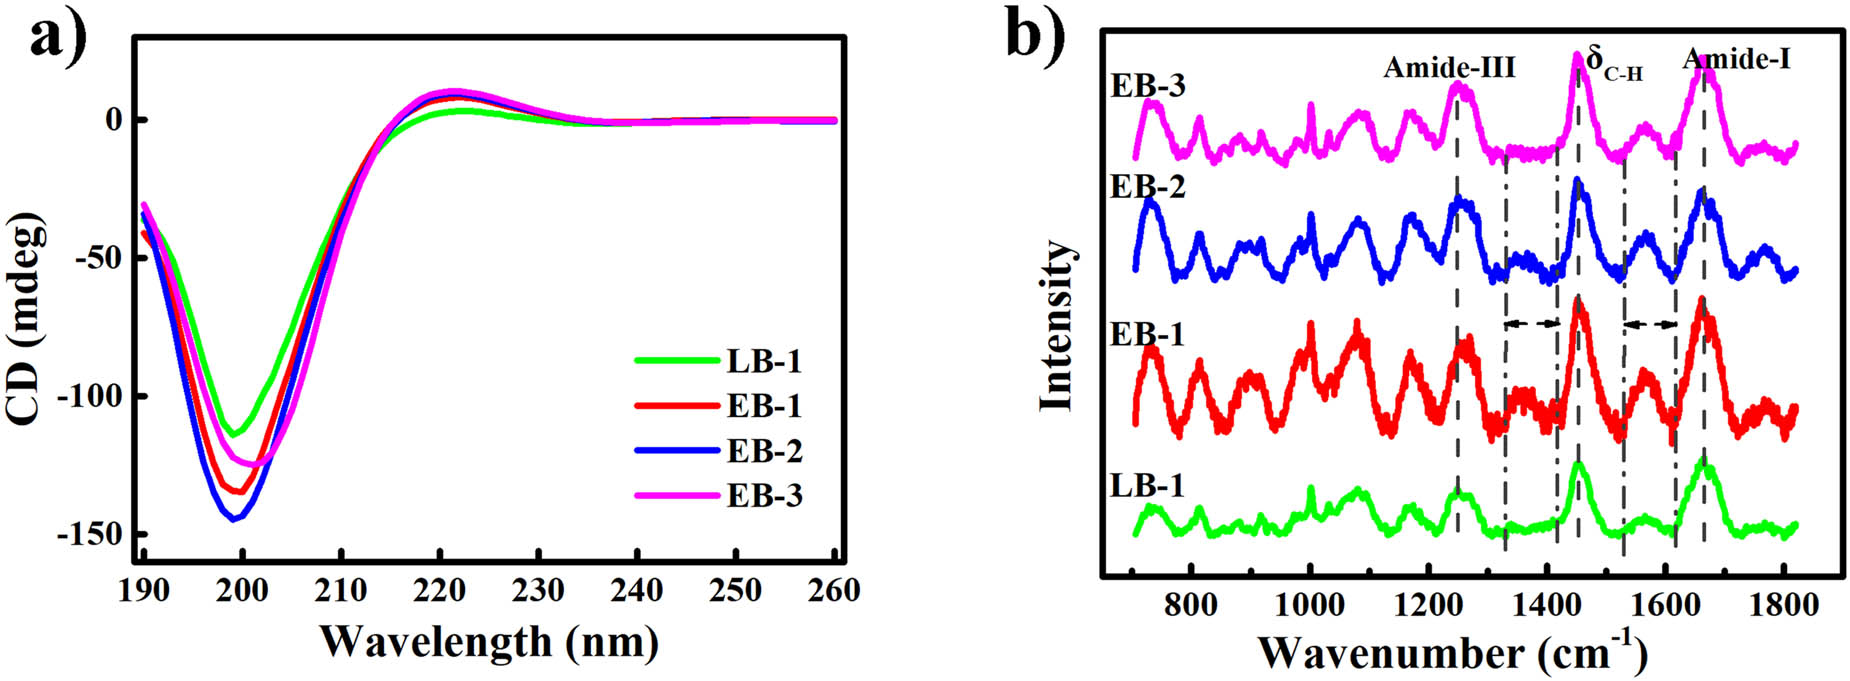
(a) Circular dichroism spectra; (b) Raman spectra of the gelatin samples.
3.2.5 Raman spectroscopy
The characteristic spectrum of organic molecules can be displayed in Raman spectroscopy [31], and Raman spectra of gelatin samples are shown in Figure 4b. Peaks of amide-I, amide-III, and δ C–H were observed in all four gelatin samples. The amplitude of amide-III band, located at approximately 1,249 cm−1, is related to the triple-helix of collagen, according to Muyonga [32]. Amide-III of EB samples had higher amplitudes than LB-1, indicating that enzymatic gelatin samples had higher triple-helix structure, which was in agreement with circular dichroism spectroscopy. Amide-I peak, located at approximately 1,662 cm−1, represents C═O stretching bond of peptide bond [23]. δ C–H peak, located near 1,451 cm−1, is designated as the deformation vibration of C–H bond [13]. Unknown peaks were observed in the range of 1,300–1,400 cm−1 and 1,500–1,600 cm−1 only in enzymatic gelatin samples, EB-1, EB-2, and EB-3. This might be due to the ability of alkali to remove the lipid and other organic impurities during alkaline treatment in the extraction of alkaline gelatin.
3.2.6 Thermogravimetric analysis
The thermogravimetric curves of the gelatin samples are presented in Figure 5. Both types of gelatin exhibited similar curves. All the gelatin samples exhibited two phases of weight loss. The first phase occurred between 20°C and 230°C with a weight loss of approximately 12%, which was in accordance with the water content shown in Table 2. This phase is typically considered to correspond to the evaporation of free and bound water [33]. The second phase of weight loss was ascribed to thermal degradation of the protein [18]. By the end of the heating process, the LB-1 and EB-3 samples had undergone a weight loss of 73%, while the EB-1 and EB-2 samples had lost 69%, which is in accordance with the previous reports [18]. No significant difference in the thermogravimetric curves was observed between the two types of gelatin.
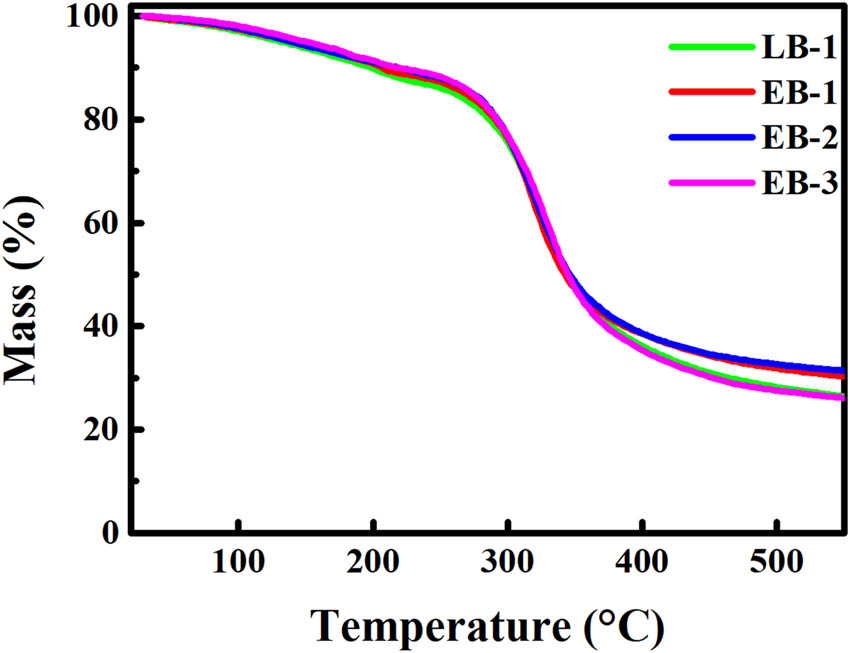
Thermogravimetric curves of the gelatin samples.
3.3 Foaming properties
Foaming properties reflect the ability of gelatin to migrate to the air-water interface and subsequently unfold and rearrange [34], which is closely related to the presence of hydrophobic regions [35]. Greater hydrophobicity is typically required for improved foaming properties. Figure 6 shows the typical FE and FS of the gelatin samples, and by definition, FE was expressed as FS at 0 min. The enzymatic gelatin samples exhibited higher FE values (168–205%) than the alkaline gelatin samples (142%). Protein size, surface charges, surface hydrophobicity, and flexibility can all play a role in foaming properties. As discussed above, the enzymatic gelatin samples had a higher hydrophobic amino acid content than the alkaline gelatin sample, which is considered as one of the possible explanations for the difference in FS between the two types of gelatin [36]. Although the rate of foam disappearance is higher for the enzymatic gelatin samples than for the alkaline gelatin samples, the former samples displayed higher FS values at almost every measured time point up to 30 min. After 30 min, all four samples had stable foam, and their FS stayed below 10%. The high rate of foam disappearance may be explained by the SDS-PAGE results (Figure 3), where the enzymatic gelatin samples clearly contained some low-molecular-weight bands, which could hinder the formation of stable films around gas bubbles [37] and reduce FS. Overall, however, the enzymatic gelatin samples exhibited excellent foaming properties.
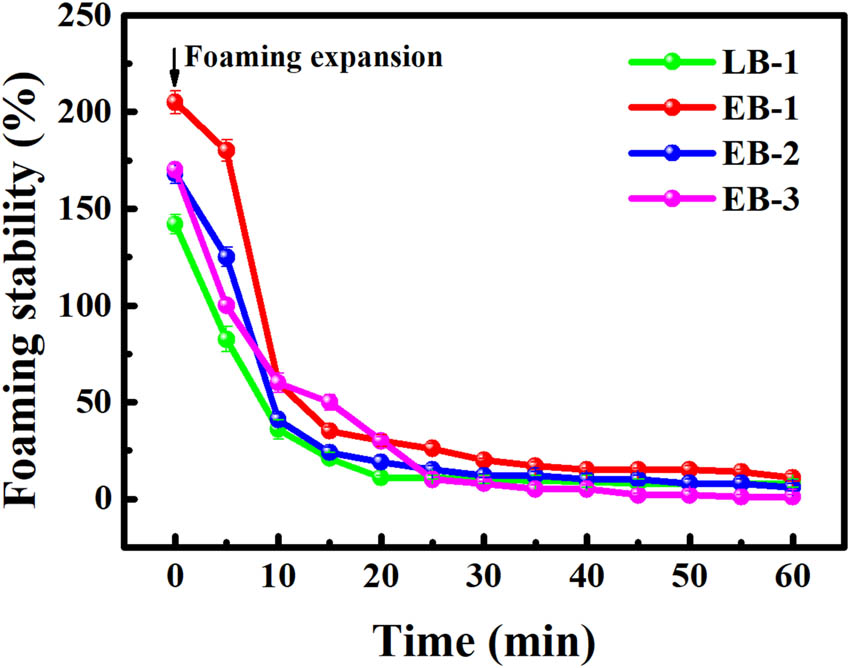
Foaming stability of the gelatin samples.
3.4 Emulsifying properties
Emulsifying properties are related to surface-active properties. The EAI and ESI values of the gelatin samples are listed in Table 4. Three enzymatic gelatin samples showed a little bit higher EAI (11.91, 11.93, and 11.88 m2·g−1) than LB-1 (11.71 m2·g−1). It is readily apparent that the ESI values of the enzymatic gelatin samples (2,668.28–3,885.50 min) were much higher than that of the alkaline gelatin sample (646.19 min). This indicated that the emulsion of enzymatic gelatin was more stable than that of alkaline gelatin. As reported previously, high-molecular-weight and hydrophobic peptides contribute to emulsion stability in gelatin samples [38,39], leading to a higher ESI. The contents of hydrophobic amino acids, namely, Ala, Val, Met, Ile, Leu, Tyr, Phe, and Pro [5], were calculated. The enzymatic gelatin samples contained slightly higher hydrophobic amino acid contents than alkaline gelatin. As shown in Figure 4b, there might be more lipid contents in enzymatic gelatin samples, which would lead to the excellent emulsifying properties. A previous study also reported that enzymatic gelatin samples displayed a slightly higher ESI, as well as superior emulsifying properties, leading to broader applicability in foods, pharmaceuticals, medicines, and other fields [25]. The better foam stability and emulsion stability of enzymatic gelatin were also beneficial for the better texture of frozen dairy products [40].
Emulsifying properties of enzymatic and alkaline gelatin
| Sample | EAI (m2·g−1) | ESI (min) |
|---|---|---|
| LB-1 | 11.71 ± 0.01a | 646.19 ± 13.42a |
| EB-1 | 11.91 ± 0.01b | 5,969.23 ± 1,198.50b |
| EB-2 | 11.93 ± 0.01b | 3,885.50 ± 488.65c |
| EB-3 | 11.88 ± 0.01c | 2,668.28 ± 228.22c |
Different superscripts in the same column indicate significant differences (p < 0.05).
3.5 Water absorption capacity
Water absorption capacity is typically expressed as the amount of water absorbed per gram of gelatin. As shown in Figure 7, the enzymatic gelatin samples exhibited a lower water absorption capacity than the alkaline gelatin sample, which may be attributable to the lower number of hydrophilic groups in the former case. In fact, both types of gelatin displayed an excellent ability to absorb water, with water absorption capacities exceeding 5.0 g·g−1. The lower water absorption capacity of the enzymatic gelatin samples may allow these samples to more easily retain their shape in humid environments and further broaden their application fields.
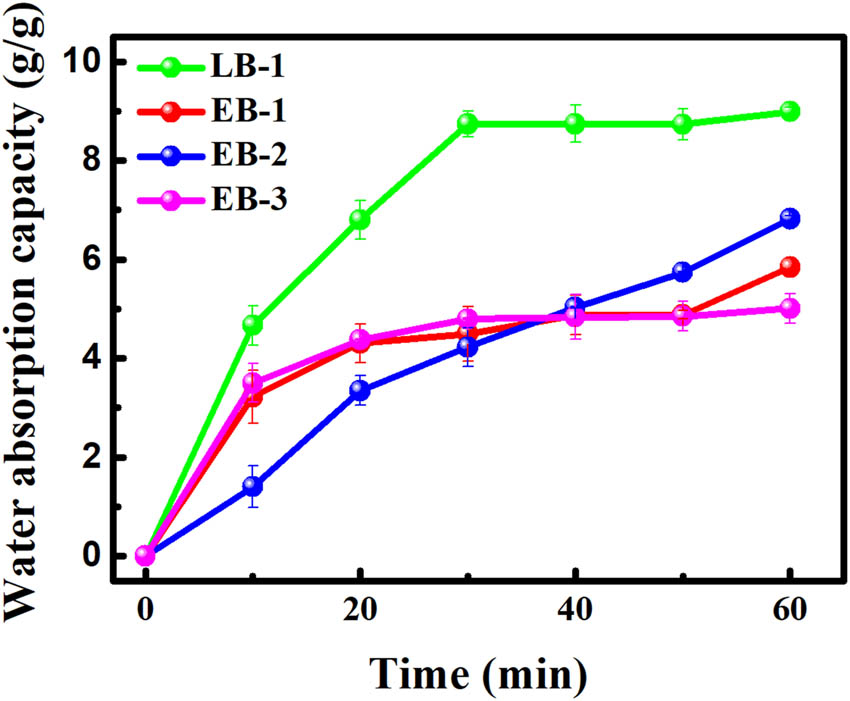
Water absorption capacity of the gelatin samples.
Comparison of properties between enzymatic and alkaline gelatin
| Enzymatic gelatin | Alkaline gelatin | |
|---|---|---|
| Extraction process | △ | ○ |
| Color and clarity | △ | △ |
| Gel strength | △ | △ |
| Viscosity | ○ | △ |
| Gelling temperature | △ | ○ |
| Foaming property | △ | ○ |
| Emulsifying property | △ | ○ |
| Water absorption capacity | ○ | △ |
| Thermostability | △ | △ |
△ Stands for excellent property; ○ stands for acceptable property.
4 Conclusion
In this work, an enzyme-aided method was demonstrated to largely shorten the long process of conventional alkaline extraction of gelatin, and the fundamental properties of enzymatic gelatin and alkaline gelatin were comprehensively compared and rationalized (Table 5). Compared with alkaline gelatin, enzymatic gelatin showed many similar structures and properties, including gel strength, thermostability, etc. However, in terms of surface properties, including emulsification and foaming properties, enzymatic gelatin differs significantly from conventional gelatin. The main reason may be attributed to the minor differences in the amino acid composition, resulting from the alkaline-induced side-chain deamination as well as the distinguishing bond-breaking ways. The unique physicochemical properties demonstrated in this study will contribute to the in-depth and wide application of gelatin products in food, pharmaceuticals, and other industries.
Acknowlegments
The authors acknowledge the financial support from International Partnership Program of Chinese Academy of Sciences, Science and Technology Service Network Initiative of Chinese Academy of Sciences, and InnerMongolia Special Fund for Transformation of Scientific and Technological Achievements.
-
Funding information: This research was funded by International Partnership Program of Chinese Academy of Sciences (Grant number 1A1111KYSB20180007), Science and Technology Service Network Initiative of Chinese Academy of Sciences (Grant number KFJSTSQYZX101), and Inner Mongolia Special Fund for Transformation of Scientific and Technological Achievements (Grant number 2021CG0036).
-
Author contributions: Weijie Zhang: conceptualization, formal analysis, investigation, writing – original draft, and writing – review and editing; Bing Zhang: conceptualization, formal analysis, funding acquisition, supervision, and writing – review and editing; Ying Wang: methodology and writing – review and editing; Weipeng Lu: methodology and writing – review and editing; Jianing Wang: methodology and writing – review and editing; Yihu Wang: methodology and writing – review and editing; Yanchuan Guo: conceptualization, funding acquisition, supervision and writing – review and editing.
-
Conflict of interest: Authors state no conflict of interest.
References
[1] Erge A, Zorba O. Optimization of gelatin extraction from chicken mechanically deboned meat residue using alkaline pre-treatment. LWT-Food Sci Technol. 2018;97:205–12. 10.1016/j.lwt.2018.06.057.Search in Google Scholar
[2] Moosavi-Nasab M, Yazdani-Dehnavi M, Mirzapour-Kouhdasht A. The effects of enzymatically aided acid-swelling process on gelatin extracted from fish by-products. Food Sci Nutr. 2020;8(9):5017–25. 10.1002/fsn3.1799.Search in Google Scholar PubMed PubMed Central
[3] Nalinanon S, Benjakul S, Visessanguan W, Kishimura H. Improvement of gelatin extraction from bigeye snapper skin using pepsin-aided process in combination with protease inhibitor. Food Hydrocolloid. 2008;22(4):615–22. 10.1016/j.foodhyd.2007.01.012.Search in Google Scholar
[4] Karim AA, Bhat R. Fish gelatin: properties, challenges, and prospects as an alternative to mammalian gelatins. Food Hydrocolloid. 2009;23(3):563–76. 10.1016/j.foodhyd.2008.07.002.Search in Google Scholar
[5] Roy BC, Omana DA, Betti M, Bruce HL. Extraction and Characterization of Gelatin from Bovine Lung. Food Sci Technol Res. 2017;23(2):255–66. 10.3136/fstr.23.255.Search in Google Scholar
[6] Samatra MY, Azmi A, Shaarani SM, Razali UH. Characterisation of gelatin extracted from buffalo (Bubalus bubalis) bone using papain pre-treatment. J Agric Food Eng. 2020;1(4):1–5. 10.37865/jafe.2020.0027.Search in Google Scholar
[7] Dhakal D, Koomsap P, Lamichhane A, Sadiq MB, Anal AK. Optimization of collagen extraction from chicken feet by papain hydrolysis and synthesis of chicken feet collagen based biopolymeric fibres. Food Biosci. 2018;23:23–30. 10.1016/j.fbio.2018.03.003.Search in Google Scholar
[8] Abedinia A, Ariffin F, Huda N, Nafchi AM. Extraction and characterization of gelatin from the feet of Pekin duck (Anas platyrhynchos domestica) as affected by acid, alkaline, and enzyme pretreatment. Int J Biol Macromol. 2018;109:855–62. 10.1016/j.ijbiomac.2017.01.139.Search in Google Scholar PubMed
[9] Duconseille A, Astruc T, Quintana N, Meersman F, Sante-Lhoutellier V. Gelatin structure and composition linked to hard capsule dissolution: A review. Food Hydrocolloid. 2015;43:360–76. 10.1016/j.foodhyd.2014.06.006.Search in Google Scholar
[10] Roy BC, Das C, Hong H, Betti M, Bruce HL. Extraction and characterization of gelatin from bovine heart. Food Biosci. 2017;20(20):116–24. 10.1016/j.fbio.2017.09.004.Search in Google Scholar
[11] Lin L, Regenstein JM, Lv S, Lu J, Jiang S. An overview of gelatin derived from aquatic animals: Properties and modification. Trends Food Sci Tech. 2017;68:102–12. 10.1016/j.tifs.2017.08.012.Search in Google Scholar
[12] Ahmad T, Ismail A, Ahmad SA, Khalil KA, Kumar Y, Adeyemi KD, et al. Recent advances on the role of process variables affecting gelatin yield and characteristics with special reference to enzymatic extraction: A review. Food Hydrocolloid. 2017;63:85–96. 10.1016/j.foodhyd.2016.08.007.Search in Google Scholar
[13] Cao S, Wang Y, Xing L, Zhang W, Zhou G. Structure and physical properties of gelatin from bovine bone collagen influenced by acid pretreatment and pepsin. Food Bioprod Process. 2020;121:213–23. 10.1016/j.fbp.2020.03.001.Search in Google Scholar
[14] Ma Y, Zeng X, Ma X, Yang R, Zhao W. A simple and eco-friendly method of gelatin production from bone: One-step biocatalysis. J Clean Prod. 2019;209:916–26. 10.1016/j.jclepro.2018.10.313.Search in Google Scholar
[15] Schrieber R, Gareis H. Gelatine handbook: Theory and industrial practice. KGaA, Weinheim: WILEY-VCH Verlag GmbH & Co., 2007.10.1002/9783527610969Search in Google Scholar
[16] Muyonga JH, Cole CGB, Duodu KG. Extraction and physico-chemical characterisation of Nile perch (Lates niloticus) skin and bone gelatin. Food Hydrocolloid. 2004;18(4):581–92. 10.1016/j.foodhyd.2003.08.009.Search in Google Scholar
[17] Li F, Jia DY, Yao K. Amino acid composition and functional properties of collagen polypeptide from Yak (Bos grunniens) bone. LWT-Food Sci Technol. 2009;42(5):945–9. 10.1016/j.lwt.2008.12.005.Search in Google Scholar
[18] Otalora MC, Castano JAG, Wilches-Torres A. Preparation, study and characterization of complex coacervates formed between gelatin and cactus mucilage extracted from cladodes of Opuntia ficus-indica. LWT-Food Sci Technol. 2019;112:108234. 10.1016/j.lwt.2019.06.001.Search in Google Scholar
[19] Duan R, Zhang J, Liu L, Cui W, Regenstein JM. The functional properties and application of gelatin derived from the skin of channel catfish (Ictalurus punctatus). Food Chem. 2018;239:464–9. 10.1016/j.foodchem.2017.06.145.Search in Google Scholar PubMed
[20] Yuan XJ, Qiao CD, Li JY, Zhang HY, Li TD. Viscometric study of the gelatin solutions ranging from dilute to extremely dilute concentrations. J Macromol Sci B. 2011;50(8):1481–90. 10.1080/00222348.2010.518540.Search in Google Scholar
[21] Veeruraj A, Arumugam M, Balasubramanian T. Isolation and characterization of thermostable collagen from the marine eel-fish (Evenchelys macrura). Process Biochem. 2013;48(10):1592–602. 10.1016/j.procbio.2013.07.011.Search in Google Scholar
[22] Sinthusamran S, Benjakul S, Kishimura H. Characteristics and gel properties of gelatin from skin of seabass (Lates calcarifer) as influenced by extraction conditions. Food Chem. 2014;152(152):276–84. 10.1016/j.foodchem.2013.11.109.Search in Google Scholar
[23] Nagarajan M, Benjakul S, Prodpran T, Songtipya P, Kishimura H. Characteristics and functional properties of gelatin from splendid squid (Loligo formosana) skin as affected by extraction temperatures. Food Hydrocolloid. 2012;29(2):389–97. 10.1016/j.foodhyd.2012.04.001.Search in Google Scholar
[24] Kim JS, Park JW. Partially purified collagen from refiner discharge of Pacific whiting surimi processing. J Food Sci. 2005;70(8):C511–6. 10.1111/j.1365-2621.2005.tb11510.x.Search in Google Scholar
[25] Lassoued I, Jridi M, Nasri R, Dammak A, Hajji M, Nasri M, et al. Characteristics and functional properties of gelatin from thornback ray skin obtained by pepsin-aided process in comparison with commercial halal bovine gelatin. Food Hydrocolloid. 2014;41:309–18. 10.1016/j.foodhyd.2014.04.029.Search in Google Scholar
[26] Sai-Ut S, Jongjareonrak A, Rawdkuen S. Re-extraction, recovery, and characteristics of skin gelatin from farmed Giant Catfish. Food Bioprocess Tech. 2012;5(4):1197–205. 10.1007/s11947-010-0408-3.Search in Google Scholar
[27] Abdelmalek BE, Gomez-Estaca J, Sila A, Martinez-Alvarez O, Gomez-Guillen MC, Chaabouni-Ellouz S, et al. Characteristics and functional properties of gelatin extracted from squid (Loligo vulgaris) skin. LWT-Food Sci Technol. 2016;65:924–31. 10.1016/j.lwt.2015.09.024.Search in Google Scholar
[28] Veis A. The science and technology of gelatin. J Colloid Interf Sci. 1978;66(2):373–4. 10.1016/0021-9797(78)90323-5.Search in Google Scholar
[29] Mu C, Li D, Lin W, Ding Y, Zhang G. Temperature induced denaturation of collagen in acidic solution. Biopolymers. 2007;86(4):282–7. 10.1002/bip.20742.Search in Google Scholar PubMed
[30] Gayatri R, Sharma AK, Rajaram R, Ramasami T. Chromium(III)-induced structural changes and self-assembly of collagen. Biochem Bioph Res Co. 2001;283(1):229–35. 10.1006/bbrc.2001.4713.Search in Google Scholar PubMed
[31] Nguyen TT, Gobinet C, Feru J, Brassart PS, Manfait M, Piot O. Characterization of Type I and IV collagens by Raman microspectroscopy: identification of spectral markers of the dermo-epidermal junction. Spectroscopy. 2014;27:421–7. 10.1155/2012/686183.Search in Google Scholar
[32] Muyonga JH, Cole CGB, Duodu KG. Fourier transform infrared (FTIR) spectroscopic study of acid soluble collagen and gelatin from skins and bones of young and adult Nile perch (Lates niloticus). Food Chem. 2004;86(3):325–32. 10.1016/j.foodchem.2003.09.038.Search in Google Scholar
[33] Ali AMM, Prodpran T, Benjakul S. Effect of squalene as a glycerol substitute on morphological and barrier properties of golden carp (Probarbus Jullieni) skin gelatin film. Food Hydrocolloid. 2019;97:105–201. 10.1016/j.foodhyd.2019.105201.Search in Google Scholar
[34] Shakila RJ, Jeevithan E, Varatharajakumar A, Jeyasekaran G, Sukumar D. Functional characterization of gelatin extracted from bones of red snapper and grouper in comparison with mammalian gelatin. LWT-Food Sci Technol. 2012;48(1):30–6. 10.1016/j.lwt.2012.03.007.Search in Google Scholar
[35] Mutilangi W, Panyam D, Kilara A. Functional properties of hydrolysates from proteolysis of heat‐denatured whey protein isolate. J Food Sci. 1996;61(2):270–5. 10.1111/j.1365-2621.1996.tb14174.x.Search in Google Scholar
[36] Sila A, Martinez-Alvarez O, Haddar A, Gomez-Guillen MC, Nasri M, Montero MP, et al. Recovery, viscoelastic and functional properties of Barbel skin gelatine: investigation of anti-DPP-IV and anti-prolyl endopeptidase activities of generated gelatine polypeptides. Food Chem. 2015;168:478–86. 10.1016/j.foodchem.2014.07.086.Search in Google Scholar PubMed
[37] Sila A, Martinez-Alvarez O, Krichen F, Gomez-Guillen MC, Bougatef A. Gelatin prepared from European eel (Anguilla anguilla) skin: Physicochemical, textural, viscoelastic and surface properties. Colloid Surface A. 2017;529(529):643–50. 10.1016/j.colsurfa.2017.06.032.Search in Google Scholar
[38] Surh J, Decker EA, McClements DJ. Properties and stability of oil-in-water emulsions stabilized by fish gelatin. Food Hydrocolloid. 2006;20(5):596–606. 10.1016/j.foodhyd.2005.06.002.Search in Google Scholar
[39] Mutilangi W, Panyam D, Kilara A. Hydrolysates from proteolysis of heat-denatured whey proteins. J Food Sci. 1995;60(5):1104–9. 10.1111/j.1365-2621.1995.tb06302.x.Search in Google Scholar
[40] Guinard JX, Zoumas-Morse C, Mori L, Uatoni B, Panyam D, Kilara A. Sugar and Fat Effects on Sensory Properties of Ice Cream. J Food Sci. 2010;62(5):1087–94. 10.1111/j.1365-2621.1997.tb15044.x.Search in Google Scholar
© 2022 Weijie Zhang et al., published by De Gruyter
This work is licensed under the Creative Commons Attribution 4.0 International License.
Articles in the same Issue
- Research Articles
- Kinetic study on the reaction between Incoloy 825 alloy and low-fluoride slag for electroslag remelting
- Black pepper (Piper nigrum) fruit-based gold nanoparticles (BP-AuNPs): Synthesis, characterization, biological activities, and catalytic applications – A green approach
- Protective role of foliar application of green-synthesized silver nanoparticles against wheat stripe rust disease caused by Puccinia striiformis
- Effects of nitrogen and phosphorus on Microcystis aeruginosa growth and microcystin production
- Efficient degradation of methyl orange and methylene blue in aqueous solution using a novel Fenton-like catalyst of CuCo-ZIFs
- Synthesis of biological base oils by a green process
- Efficient pilot-scale synthesis of the key cefonicid intermediate at room temperature
- Synthesis and characterization of noble metal/metal oxide nanoparticles and their potential antidiabetic effect on biochemical parameters and wound healing
- Regioselectivity in the reaction of 5-amino-3-anilino-1H-pyrazole-4-carbonitrile with cinnamonitriles and enaminones: Synthesis of functionally substituted pyrazolo[1,5-a]pyrimidine derivatives
- A numerical study on the in-nozzle cavitating flow and near-field atomization of cylindrical, V-type, and Y-type intersecting hole nozzles using the LES-VOF method
- Synthesis and characterization of Ce-doped TiO2 nanoparticles and their enhanced anticancer activity in Y79 retinoblastoma cancer cells
- Aspects of the physiochemical properties of SARS-CoV-2 to prevent S-protein receptor binding using Arabic gum
- Sonochemical synthesis of protein microcapsules loaded with traditional Chinese herb extracts
- MW-assisted hydrolysis of phosphinates in the presence of PTSA as the catalyst, and as a MW absorber
- Fabrication of silicotungstic acid immobilized on Ce-based MOF and embedded in Zr-based MOF matrix for green fatty acid esterification
- Superior photocatalytic degradation performance for gaseous toluene by 3D g-C3N4-reduced graphene oxide gels
- Catalytic performance of Na/Ca-based fluxes for coal char gasification
- Slow pyrolysis of waste navel orange peels with metal oxide catalysts to produce high-grade bio-oil
- Development and butyrylcholinesterase/monoamine oxidase inhibition potential of PVA-Berberis lycium nanofibers
- Influence of biosynthesized silver nanoparticles using red alga Corallina elongata on broiler chicks’ performance
- Green synthesis, characterization, cytotoxicity, and antimicrobial activity of iron oxide nanoparticles using Nigella sativa seed extract
- Vitamin supplements enhance Spirulina platensis biomass and phytochemical contents
- Malachite green dye removal using ceramsite-supported nanoscale zero-valent iron in a fixed-bed reactor
- Green synthesis of manganese-doped superparamagnetic iron oxide nanoparticles for the effective removal of Pb(ii) from aqueous solutions
- Desalination technology for energy-efficient and low-cost water production: A bibliometric analysis
- Biological fabrication of zinc oxide nanoparticles from Nepeta cataria potentially produces apoptosis through inhibition of proliferative markers in ovarian cancer
- Effect of stabilizers on Mn ZnSe quantum dots synthesized by using green method
- Calcium oxide addition and ultrasonic pretreatment-assisted hydrothermal carbonization of granatum for adsorption of lead
- Fe3O4@SiO2 nanoflakes synthesized using biogenic silica from Salacca zalacca leaf ash and the mechanistic insight into adsorption and photocatalytic wet peroxidation of dye
- Facile route of synthesis of silver nanoparticles templated bacterial cellulose, characterization, and its antibacterial application
- Synergistic in vitro anticancer actions of decorated selenium nanoparticles with fucoidan/Reishi extract against colorectal adenocarcinoma cells
- Preparation of the micro-size flake silver powders by using a micro-jet reactor
- Effect of direct coal liquefaction residue on the properties of fine blue-coke-based activated coke
- Integration of microwave co-torrefaction with helical lift for pellet fuel production
- Cytotoxicity of green-synthesized silver nanoparticles by Adansonia digitata fruit extract against HTC116 and SW480 human colon cancer cell lines
- Optimization of biochar preparation process and carbon sequestration effect of pruned wolfberry branches
- Anticancer potential of biogenic silver nanoparticles using the stem extract of Commiphora gileadensis against human colon cancer cells
- Fabrication and characterization of lysine hydrochloride Cu(ii) complexes and their potential for bombing bacterial resistance
- First report of biocellulose production by an indigenous yeast, Pichia kudriavzevii USM-YBP2
- Biosynthesis and characterization of silver nanoparticles prepared using seeds of Sisymbrium irio and evaluation of their antifungal and cytotoxic activities
- Synthesis, characterization, and photocatalysis of a rare-earth cerium/silver/zinc oxide inorganic nanocomposite
- Developing a plastic cycle toward circular economy practice
- Fabrication of CsPb1−xMnxBr3−2xCl2x (x = 0–0.5) quantum dots for near UV photodetector application
- Anti-colon cancer activities of green-synthesized Moringa oleifera–AgNPs against human colon cancer cells
- Phosphorus removal from aqueous solution by adsorption using wetland-based biochar: Batch experiment
- A low-cost and eco-friendly fabrication of an MCDI-utilized PVA/SSA/GA cation exchange membrane
- Synthesis, microstructure, and phase transition characteristics of Gd/Nd-doped nano VO2 powders
- Biomediated synthesis of ZnO quantum dots decorated attapulgite nanocomposites for improved antibacterial properties
- Preparation of metal–organic frameworks by microwave-assisted ball milling for the removal of CR from wastewater
- A green approach in the biological base oil process
- A cost-effective and eco-friendly biosorption technology for complete removal of nickel ions from an aqueous solution: Optimization of process variables
- Protective role of Spirulina platensis liquid extract against salinity stress effects on Triticum aestivum L.
- Comprehensive physical and chemical characterization highlights the uniqueness of enzymatic gelatin in terms of surface properties
- Effectiveness of different accelerated green synthesis methods in zinc oxide nanoparticles using red pepper extract: Synthesis and characterization
- Blueprinting morpho-anatomical episodes via green silver nanoparticles foliation
- A numerical study on the effects of bowl and nozzle geometry on performances of an engine fueled with diesel or bio-diesel fuels
- Liquid-phase hydrogenation of carbon tetrachloride catalyzed by three-dimensional graphene-supported palladium catalyst
- The catalytic performance of acid-modified Hβ molecular sieves for environmentally friendly acylation of 2-methylnaphthalene
- A study of the precipitation of cerium oxide synthesized from rare earth sources used as the catalyst for biodiesel production
- Larvicidal potential of Cipadessa baccifera leaf extract-synthesized zinc nanoparticles against three major mosquito vectors
- Fabrication of green nanoinsecticides from agri-waste of corn silk and its larvicidal and antibiofilm properties
- Palladium-mediated base-free and solvent-free synthesis of aromatic azo compounds from anilines catalyzed by copper acetate
- Study on the functionalization of activated carbon and the effect of binder toward capacitive deionization application
- Co-chlorination of low-density polyethylene in paraffin: An intensified green process alternative to conventional solvent-based chlorination
- Antioxidant and photocatalytic properties of zinc oxide nanoparticles phyto-fabricated using the aqueous leaf extract of Sida acuta
- Recovery of cobalt from spent lithium-ion battery cathode materials by using choline chloride-based deep eutectic solvent
- Synthesis of insoluble sulfur and development of green technology based on Aspen Plus simulation
- Photodegradation of methyl orange under solar irradiation on Fe-doped ZnO nanoparticles synthesized using wild olive leaf extract
- A facile and universal method to purify silica from natural sand
- Green synthesis of silver nanoparticles using Atalantia monophylla: A potential eco-friendly agent for controlling blood-sucking vectors
- Endophytic bacterial strain, Brevibacillus brevis-mediated green synthesis of copper oxide nanoparticles, characterization, antifungal, in vitro cytotoxicity, and larvicidal activity
- Off-gas detection and treatment for green air-plasma process
- Ultrasonic-assisted food grade nanoemulsion preparation from clove bud essential oil and evaluation of its antioxidant and antibacterial activity
- Construction of mercury ion fluorescence system in water samples and art materials and fluorescence detection method for rhodamine B derivatives
- Hydroxyapatite/TPU/PLA nanocomposites: Morphological, dynamic-mechanical, and thermal study
- Potential of anaerobic co-digestion of acidic fruit processing waste and waste-activated sludge for biogas production
- Synthesis and characterization of ZnO–TiO2–chitosan–escin metallic nanocomposites: Evaluation of their antimicrobial and anticancer activities
- Nitrogen removal characteristics of wet–dry alternative constructed wetlands
- Structural properties and reactivity variations of wheat straw char catalysts in volatile reforming
- Microfluidic plasma: Novel process intensification strategy
- Antibacterial and photocatalytic activity of visible-light-induced synthesized gold nanoparticles by using Lantana camara flower extract
- Antimicrobial edible materials via nano-modifications for food safety applications
- Biosynthesis of nano-curcumin/nano-selenium composite and their potentialities as bactericides against fish-borne pathogens
- Exploring the effect of silver nanoparticles on gene expression in colon cancer cell line HCT116
- Chemical synthesis, characterization, and dose optimization of chitosan-based nanoparticles of clodinofop propargyl and fenoxaprop-p-ethyl for management of Phalaris minor (little seed canary grass): First report
- Double [3 + 2] cycloadditions for diastereoselective synthesis of spirooxindole pyrrolizidines
- Green synthesis of silver nanoparticles and their antibacterial activities
- Review Articles
- A comprehensive review on green synthesis of titanium dioxide nanoparticles and their diverse biomedical applications
- Applications of polyaniline-impregnated silica gel-based nanocomposites in wastewater treatment as an efficient adsorbent of some important organic dyes
- Green synthesis of nano-propolis and nanoparticles (Se and Ag) from ethanolic extract of propolis, their biochemical characterization: A review
- Advances in novel activation methods to perform green organic synthesis using recyclable heteropolyacid catalysis
- Limitations of nanomaterials insights in green chemistry sustainable route: Review on novel applications
- Special Issue: Use of magnetic resonance in profiling bioactive metabolites and its applications (Guest Editors: Plalanoivel Velmurugan et al.)
- Stomach-affecting intestinal parasites as a precursor model of Pheretima posthuma treated with anthelmintic drug from Dodonaea viscosa Linn.
- Anti-asthmatic activity of Saudi herbal composites from plants Bacopa monnieri and Euphorbia hirta on Guinea pigs
- Embedding green synthesized zinc oxide nanoparticles in cotton fabrics and assessment of their antibacterial wound healing and cytotoxic properties: An eco-friendly approach
- Synthetic pathway of 2-fluoro-N,N-diphenylbenzamide with opto-electrical properties: NMR, FT-IR, UV-Vis spectroscopic, and DFT computational studies of the first-order nonlinear optical organic single crystal