Yb3+-containing chitosan hydrogels induce B-16 melanoma cell anoikis via a Fak-dependent pathway
-
Yu Miao
 and
Shumin Zhou
and
Shumin Zhou

Abstract
Melanoma is the most lethal dermal tumor, and a high recurrence rate and skin defects are two main serious problems. An antimelanoma material,which effectively inhibits tumor recurrence and possesses excellent biocompatibility, is urgently needed to treat melanoma. In this study, we developed a novel antitumor Yb3+ [Yb(NO3)3]containing chitosan hydrogel (Yb-CS hydrogel) by dissolving Yb(NO3)3 and chitosan in acetic acid solution and forming composite hydrogels by a freeze-drying process after adding NaOH to the mixed solution. In vitro studies demonstrated that the Yb3+ produces effect of inducing cell death in Yb-CS hydrogel. Moreover, we found that the Yb-CS hydrogel inhibited a focal adhesion kinase (FAK)-dependent signaling pathway and induced B-16 cell anoikis. However, the Yb-CS hydrogel was less effective on L929 normal mouse dermal cells. In vivo studies showed that the Yb-CS hydrogel inhibited the recurrence of melanoma in a mouse bare xenograft tumor model. We concluded that the Yb-CS hydrogel could potentially be used in the antimelanoma field, especially in the inhibition of melanoma recurrence.
1 Introduction
Melanoma, which is responsible for over 75% of skin cancer-related deaths and threatens the lives of approximately 50,000 patients each year [1], has the highest morbidity among lethal dermal neoplasms. Melanoma morbidity has increased by 199% from 1975 to 2010 according to the Surveillance, Epidemiology, and End Results (SEER) database [2]. More than 95% of melanoma tumors occur in the skin, with a high malignance and high potential for metastasis [3]. Currently, the main treatments for melanoma include surgical resection, chemotherapies, radiotherapies, targeted therapies and immunotherapies [4]. However, the high recurrence rate (up to 30% for localized melanoma and 60% for regional nodal disease) [5] and skin defects after surgery remain the two main serious problems suffered by melanoma patients [6, 7]. In fact, there is still no international consensus on a standard adjuvant therapy for preventing recurrence in patients because of the serious side effects of adjuvant therapy, [1] low sensitivity to chemotherapy or radiotherapy [8] and drug resistance [9]. Therefore, the development of an effective adjuvant treatment to inhibit the relapse of melanoma remains urgently needed in the clinic worldwide.
Lanthanides have been widely studied as antitumor chemotherapeutic reagents in various types of malignant tumors, e.g., lanthanum (La) in cervical cancer, [10] ovarian cancer [11] and gastric cancer [12]; gadolinium (Gd) in osteosarcoma, [13] prostate cancer [14] and liver cancer [15]; and cerium (Ce) in breast cancer [16]. However, for decades, ytterbium (Yb), which also belongs to the lanthanide series, has been mainly used as a radioembolization element rather than a chemotherapeutic reagent for treating tumors [17, 18]. Therefore, we hypothesized that yttrium also has the capability of inhibiting tumor cell growth. As reported in many previous studies, lanthanides show anticancer effects by suppressing cell proliferation and inducing cell apoptosis at higher concentrations, but lanthanides promote cell growth at low concentrations [19]. Therefore, maintaining suitable concentrations of Yb3+ ions is the key to achieving therapeutic effects.
In present study, an Yb3+-containing chitosan hydrogel (Yb-CS hydrogel) that selectively induced anoikis (a special type of programmed cell death) in B-16 mouse melanoma cells with less effects on L929 normal skin dermal cells is developed. Moreover, the Yb-CS hydrogel had no harmful influence on skin union and did not cause peripheral normal tissue damage. Therefore, the development of the Yb-CS hydrogel not only provides a new material for accompanying therapeutic strategies for melanoma but also facilitates the application of yttrium for tumor treatment.
2 Materials and methods
2.1 Preparation of the Yb3+-containing chitosan hydrogel
Yb3+solutions (10−2 M) were prepared by dissolving Yb(NO3)3·5H2O(Aladdin, Shanghai, China) in 2.0 wt% acetic acid solution. Chitosan (CS) powder (0.5 g) was dis-solved in the Yb3+solution (20 ml) under magnetic stirring. After stirring for 2 h, the mixed solutions (0.5 ml) were transferred to molds in 24-well plates. The samples were treated with 5.0 wt% sodium hydroxide solutions at 37∘C for 3 h and then washed with 10−2 M Yb(NO3)3 solution up to pH=7.0. The products (Yb3+-containing CS hydrogels) are abbreviated as Yb-CS hydrogels. In addition, CS hydrogels without Yb3+ ions were developed under the same conditions as a negative control.
2.2 The release of Yb3+ from Yb-CS hydrogels
The release experiment was carried out in an 80 rpm oscillator at 37∘C. Three slices of Yb-CS hydrogels were immersed in 5 ml deionized water. At predetermined time-points (3, 6, 12, 24, 48, 72, 96 and 120 h), 1.0 ml of release medium was removed to determine the concentrations of Yb3+ ions and wasreplaced with the same volume of deionized water. The Yb3+ concentrations were determined by inductively coupled plasma/optical emission spectrometry (ICP/OES; Perkin Elmer, OPTIMA 3300 DV).
2.3 Characterization
Water in the Yb-CS and CS hydrogels was removed by a freeze-drying method to characterize their morphology, phase and thermal performance. For biological tests, the hydrogels were not freeze-dried. Scanning electron microscopy (SEM; JEOL, JSM-6380LV) and energy-dispersive spectrometry (EDS)were used to characterize the morphology and element distribution of the samples. The phases of the Yb-CS and CS hydrogels were determined by X-ray powder diffraction (XRD; D/max-III C). The functional groups of the samples were characterized in a wavenumber range of of 4000-400 cm−1 at a resolution of 2 cm−1 by Fourier transform infrared spectroscopy (FTIR; Nicolet 5DX). The thermal performances of the samples were detected by thermogravimetric analysis (TG-DTA, Perkin-Elmer).
2.4 Cell culture
Cell lines (B-16 mouse melanoma cells and L929 mouse skin fibroblast cells) were purchased from CCTCC (China Centre for Type Culture Collection). Both cell lines were cultured in DMEM (GIBCO, USA) supplemented with 10% FBS (GIBCO, USA) and 1% penicillin/streptomycin. The cells were grown in a humidified atmosphere with 5% CO2 at 37∘C.
2.5 Cell proliferation assays
A Cell Counting Kit-8 assay (CCK-8, Beyotime, China) was used to detect cell viability. Cells were seeded in 96-well plates at a density of 3000 cells/well and treated with CS hydrogels and Yb-CS hydrogels with Yb3+ concentrations of 0.1 and 1.0 mmol/L after cell adhesion. Then, the absorbance was measured at a wavelength of 450 nm for 5 days using a Bio-Tek microplate reader ELX800 (Bio Tek, USA).
For real-time cell analysis, B-16 and L929 cells were seeded at a density of 5×10³ cells/well into an E-plate 16 (ACEA Biosciences, CA, USA), respectively. Then, the cells were treated with Yb3+ at concentrations of 0, 0.01, 0.1, 0.5, 1.0, and 1.5 mmol/L in a total 200 μL medium and monitored on the xCELLigence Real-Time Cell Analyzer Dual Plate (RTCA DP) instrument (ACEA Biosciences, USA). The detection interval was1 h, and the total detection duration was 120 h. Data were collected using RTCA software (Version 2.0; ACEA Biosciences Inc., San Diego, CA, USA).
2.6 Cell apoptosis analysis
For on-gel apoptosis assays, B-16 and L929 cells were seeded in 96-well plates at a density of 1×10⁴ cells/well and covered with CS hydrogels and Yb-CS hydrogels containing Yb3+ at concentrations of 0.1, 1.0, and 1.5 mmol/ L. Approximately 24 h later, the cells were washed with 1× phosphate-buffered saline (PBS) and stained with annexin V and propidium iodide (PI) (Dojindo Laboratories, Japan) for approximately 20 min. Images were acquired using a Leica DMi6000 B microscope.
For FCM-based apoptosis assays, cells were seeded in 6-well plates at a density of 3×10⁵ cells/well and treated with Yb3+ at concentrations of 0, 0.01, 0.1, 1.0, and 1.5 mmol/L after 24 h. Then, the cells were collected and washed with PBS followed by staining with annexin V and PI (Dojindo Laboratories, Japan) for approximately 20 min. The apoptosis rates of these cells were analyzed by a FAC-SCalibur BD flow cytometer.
2.7 Cell adhesion assay
For on-gel adhesion assays, B-16 and L929 cells were seeded at a density of 1×10⁴ cells/well in 96-well plates filled with hydrogels containing Yb3+ at concentrations of 0, 0.01, 0.1, 0.5, 1.0, and 1.5 mmol/L. Approximately 2 h later, the cells were washed with 1×PBS 3 times and stained with SYBR Green I for 20 min, followed by analysis under a Leica Dmi6000 B microscope.
For real-time cell analysis, B-16 and L929 cells were seeded at a density of 5×10³ cells/well into an E-plate 16 (ACEA Biosciences, San Diego, CA). Then, the cells were treated with Yb3+ at concentrations of 0, 0.01, 0.1, 0.5, 1.0, and 1.5 mmol/L in a total of 200 μL medium and monitored on an xCELLigence Real-Time Cell Analyzer Dual Plate (RTCA DP) instrument (ACEA Biosciences, USA). The detection interval was 1 min, and the total detection duration was 6 h. Data were collected using RTCA software (Version 2.0; ACEA Biosciences Inc., San Diego, CA, USA).
2.8 Cytoskeletal staining
To detect morphological changes related to anoikis of B-16 and L929 cells treated with Yb3+ at different concentrations, cytoskeletal staining was carried out. B-16 and L929 cells were seeded in 96-well plates at a density of 1×10⁴ cells/well and treated with Yb3+ at concentrations of 0, 0.01, 0.1, 0.5, 1.0, and 1.5 mmol/L after cell adhesion. Twenty-four hours later, the cells were fixed with 4% paraformaldehyde for 30 min at room temperature (RT), washed 3 times with PBS, and permeabilized with 0.1% Triton X-100 (Sigma-Aldrich, MO, USA) for 5 min. After washing with PBS, the cells were incubated with fluorescent phalloidin (1:50 dilution) for 30 min according to the manufacturer’s directions. Images were analyzed and acquired by a DM6000B Leica fluorescence microscope.
2.9 Western blotting
Cells were seeded in 6-well plates at a density of 3×10⁵ cells/well and treated with CS hydrogels, Yb-CS hydrogels and Yb3+ at concentrations of 0, 0.01, 0.1, 0.5, 1.0, and 1.5 mmol/ L after cell adhesion. Approximately 24 h later, the cells were collected and lysed using RIPA Lysis Buffer (Santa Cruz, TX, USA). Western blotting was performed as previously described [20]. Primary antibodies specific to PARP, caspase-3, caspase-9, Fak, P-Fak, Akt, P-Akt (1:1,000 dilution; Cell Signaling Technology, USA) and β-actin (1:5,000 dilution; Cell Signaling Technology, USA) were used. The blots were then incubated with goat anti-rabbit or anti-mouse secondary antibodies (1:3,000 dilution; Cell Signaling Technology, USA) and visualized using enhanced chemiluminescence.
2.10 Mouse experiment
Approximately 5×10⁵ B-16 melanoma cells were injected into both sides of the abdomen in subcutaneous tissues of Sprague-Dawley (SD) mice. After 10 days of tumor cell inoculation, both sides of the tumor were partially resected (approximately 5 mm3 of tumor tissue remained). Then, we covered the wound with an Yb-CS hydrogel on the left side and a blank hydrogel on the right side. Then, the wound was sutured, and the remaining open area was covered with gauze and a plastic protector to prevent the mice from biting each other. Recurrence of melanoma was analyzed at 2 weeks after resection.
2.11 Immunohistochemistry (IHC) staining
IHC staining was carried out as described previously [21]. Briefly, hematoxylin and eosin (HE) staining was performed to analyze the histological features and structures of skin and melanoma. IHC staining of the ki-67 antigen was employed to analyze cell proliferation. Images were acquired using a DM4000B Leica microscope.
2.12 Statistical analysis
Statistical analysis was performed with SPSS (version 17.0) and GraphPad Prism 6.0 software. Data were analyzed using two-tailed Student’s t-test for comparisons between two groups. For experiments involving more than two groups, ANOVA followed by Bonferroni’s multiple comparisons test was employed. P<0.05 was considered statistically significant and labeled as “*”, and p<0.01 was considered statistically significant and labeled as “**”.
3 Results
3.1 Morphology of Yb-CS hydrogels
The Yb-CS hydrogels were fabricated by the following steps: (i) CS and Yb(NO3)3 were dissolved in acetic acid solution; and (ii) the mixed solution was treated with NaOH solution, resulting in the formation of composite hydro-gels, as shown in Figure 1. SEM imaging revealed that the Yb-CS hydrogels exhibited rough surfaces (Figure 1a), which originated from the evaporation of water during the freeze-drying process. The Yb-CS hydrogels mainly included the elements C, O, Yb and N (Figure 1d). The C element was derived from the CS in the hydrogels, the Yb and N elements were derived from the Yb3+ and NO3ions, and the O element was derived from both the CS and NO3ions. The Yb and C element distribution images suggested that the Yb3+ ions were uniformly dispersed throughout the hydrogels (Figure 1b and 1c).
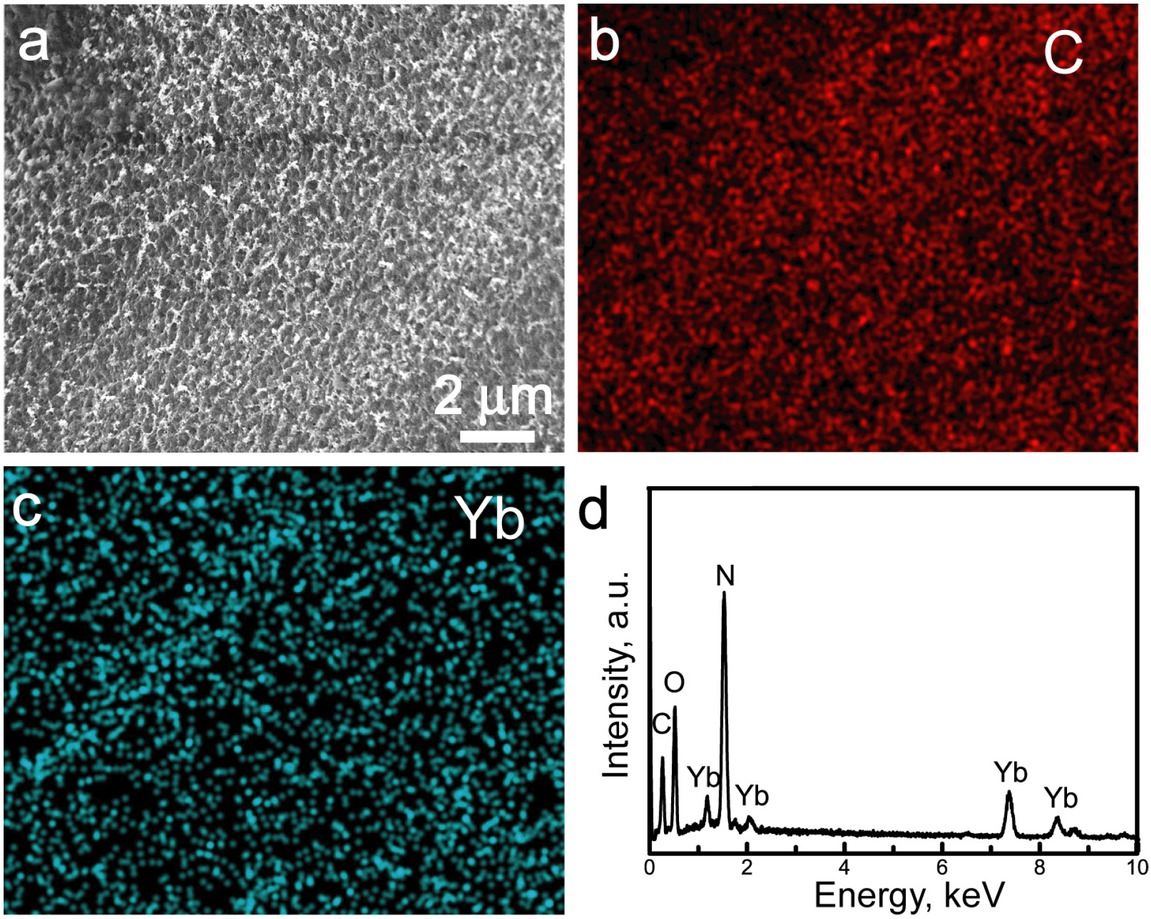
(a) SEM image; (b) C element distribution image; (c) Yb element distribution image; (d) EDS spectrum of the Yb-CS hydrogels
3.2 Structure and thermal property of Yb-CS hydrogels
The phase structures and functional groups of the Yb-CS hydrogels were characterized by XRD and FTIR, and the blank CS hydrogels were used as the control group (Figure 2a and 2b). The XRD patterns indicated that both the blank CS hydrogels and Yb-CS hydrogels exhibited amorphous phases, as confirmed by the halo peaks at approximately 20~30∘ (Figure 2a). Moreover, peaks attributed to Yb-containing compounds were not detected in the XRD pattern, suggesting that the Yb element existed as Yb3+ ions in the hydrogels.
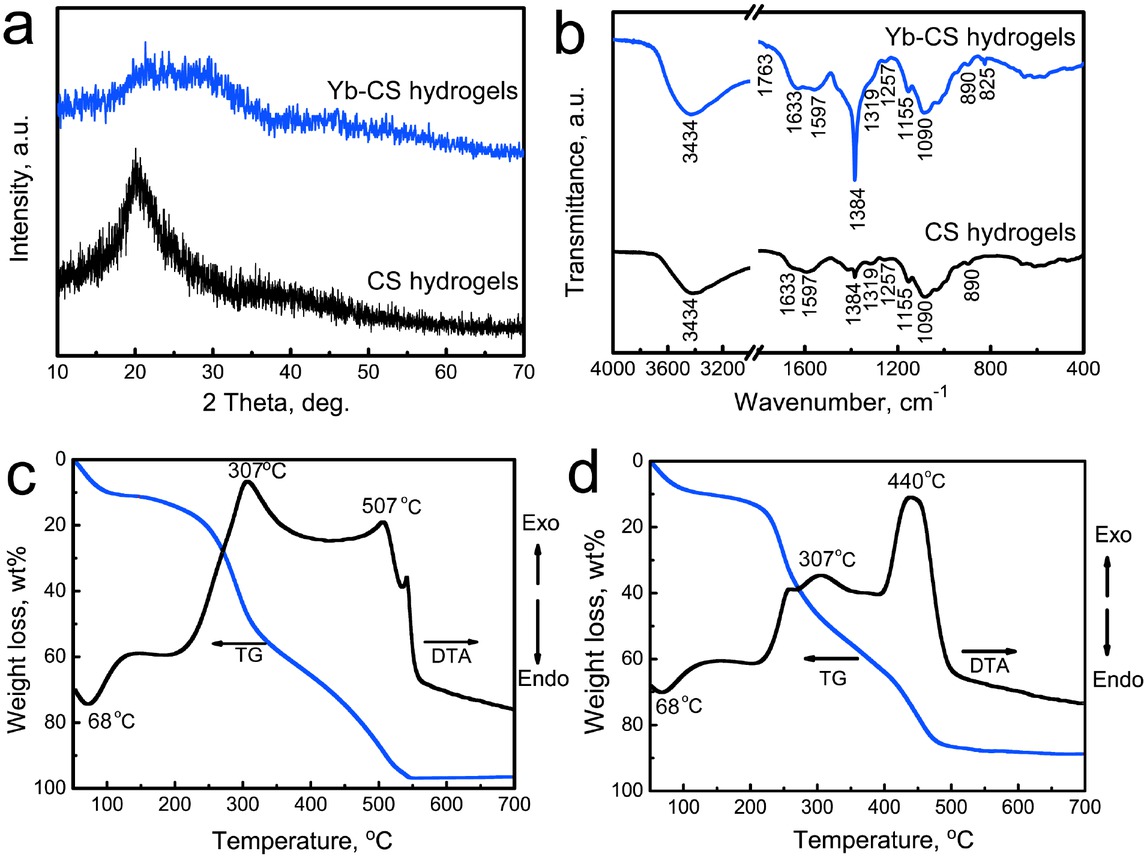
(a) XRD patterns; (b) FTIR spectra of the CS and Yb-CS hydrogels. TG-DTA curves: (c) CS hydrogels; (d) Yb-CS hydrogels
Functional groups of the control CS hydrogels and Yb-CS hydrogels were detected by FTIR. For both samples, characteristic bands attributed to CS were detected (Figure 2b). The broad peak at approximately 3434 cm−1 was ascribed to the stretching vibration of the –OH and/or – NH2 groups [22]. The band at 1597 cm−1 corresponded to the N–H deformation vibration of the amino group, and the band at 890 cm−1 corresponded to the N–H wagging vibration [23]. The characteristic bands attributed to C– N in the primary and secondary amide groups were located at 1384 and 1319/1257 cm−1, respectively [22]. The bands at 1090 and 1155 cm−1 were ascribed to the C–O stretching vibration and bridge oxygen stretching vibration, respectively [24]. Characteristic bands attributed to NO3ions were detected in the Yb-CS hydrogels but not in the blank CS hydrogels. The bands at 1762 and 825 cm−1 were attributed to stretching modes of NO3ions. The peak at 1383 cm−1 became strong, which was attributed to the v3 stretching vibration of the NO3ions as well as C–N in the primary amide groups (Figure 2b) [25].
After the freeze-drying process, the thermal behaviors of the CS and Yb-CS hydrogels were detected by TG-DTA (Figures 2c and 2d). For the control CS hydrogels, a weight loss of approximately 15.0% at approximately 50~100∘C was attributed to the loss of adsorbed water. The corresponding endothermic peak was observed at approximately 68∘C. In the temperature range of 100-550∘C, a weight loss of approximately 85% was detected, as shown in Figure 2c. Two exothermic peaks at approximately 307 and 440∘C were ascribed to depolymerization of acetylated/deacetylated units of the CS chain and the decomposition of CS, respectively. The TG-DTA curves of the Yb-CS hydrogels were similar to those of the pure CS hydrogels (Figure 2c and 2d). Notably, a strong exothermic peak was observed at approximately 507∘C, which was attributed to the decomposition of NO3ions in the hydrogels.
3.3 Yb3+ ions release property of Yb-CS hydrogels
The in vitro release performance of Yb3+ ions was analyzed after the Yb-CS hydrogels were immersed in deionized water. The concentrations of Yb3+ ions were determined by ICP/OES at different timepoints (Figure 3a and 3b). The release rate of Yb3+ ions was mainly correlated to the concentration gradient between the release medium and the hydrogels. In the first stage (within 24 h after immersion), Yb3+ ions were quickly released from the Yb-CS hydrogels because of the high concentration gradient. With increasing concentrations of Yb3+ ions in the medium, the Yb3+ release rate decreased gradually to a dynamic equilibrium. After 5 days, the cumulative release concentration and cumulative release ratio were 1.30 mM and 43.3%, respec- tively.
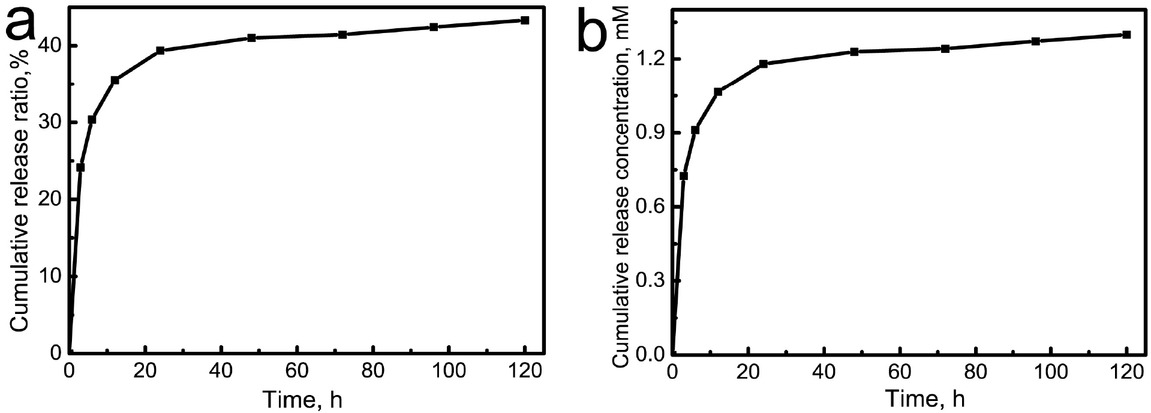
In vitro Yb3+ release profiles from the Yb-CS hydrogels: (i) cumulative release concentration; (j) cumulative release ratio
3.4 The Yb-CS hydrogel induces the apoptosis of B-16 and L929 cells
To analyze whether the Yb3+-containing hydrogel inhibits the progression of melanoma cells in the skin microenvironment, the B-16 mouse melanoma cell line and the L929 dermal fibroblast cell line were cultured and treated with no hydrogels (control), blank hydrogels and hydrogels containing Yb3+ at different concentrations (0.1 and 1 mM). Cell viability was detected by a CCK-8 assay kit. The results showed that there was no difference between the control group and the blank CS hydrogel group; however, the fold change significantly decreased (P<0.01) for cells treated with CS hydrogels containing high concentrations of Yb3+ compared with those in the control group and blank CS hydrogel group (Figure 4a). To verify whether this decrease in cell viability was attributed to cell apoptosis, we determined the apoptosis rates of B-16 and L929 cells on the hydrogels using an annexin V and PI staining kit and analyzed the staining by fluorescence microscopy. A typical early apoptotic phenomenon was observed in the Yb-CS hydrogel-treated B-16 cells with increasing Yb3+ concentrations because the number of annexin V-positive cells increased with increasing Yb3+ concentrations (Figure 4b). Then, we detected typical apoptosis proteins, PARP and cleaved-PARP. The results showed that the expression level of cleaved-PARP (the active form of PARP) greatly increased in the Yb-CS hydrogel (1.0 mM)-treated group,while the expression level of PARP (the inactive form of PARP) decreased in the Yb-CS hydrogel group compared with that in the control and blank CS hydrogel groups (Figure 4c).However, both PARP and cleaved-PARP showed no differences between the control and blank CS hydrogel groups. These data indicated that Yb3+ plays a crucial role in inducing cell apoptosis in Yb-CS hydrogels.
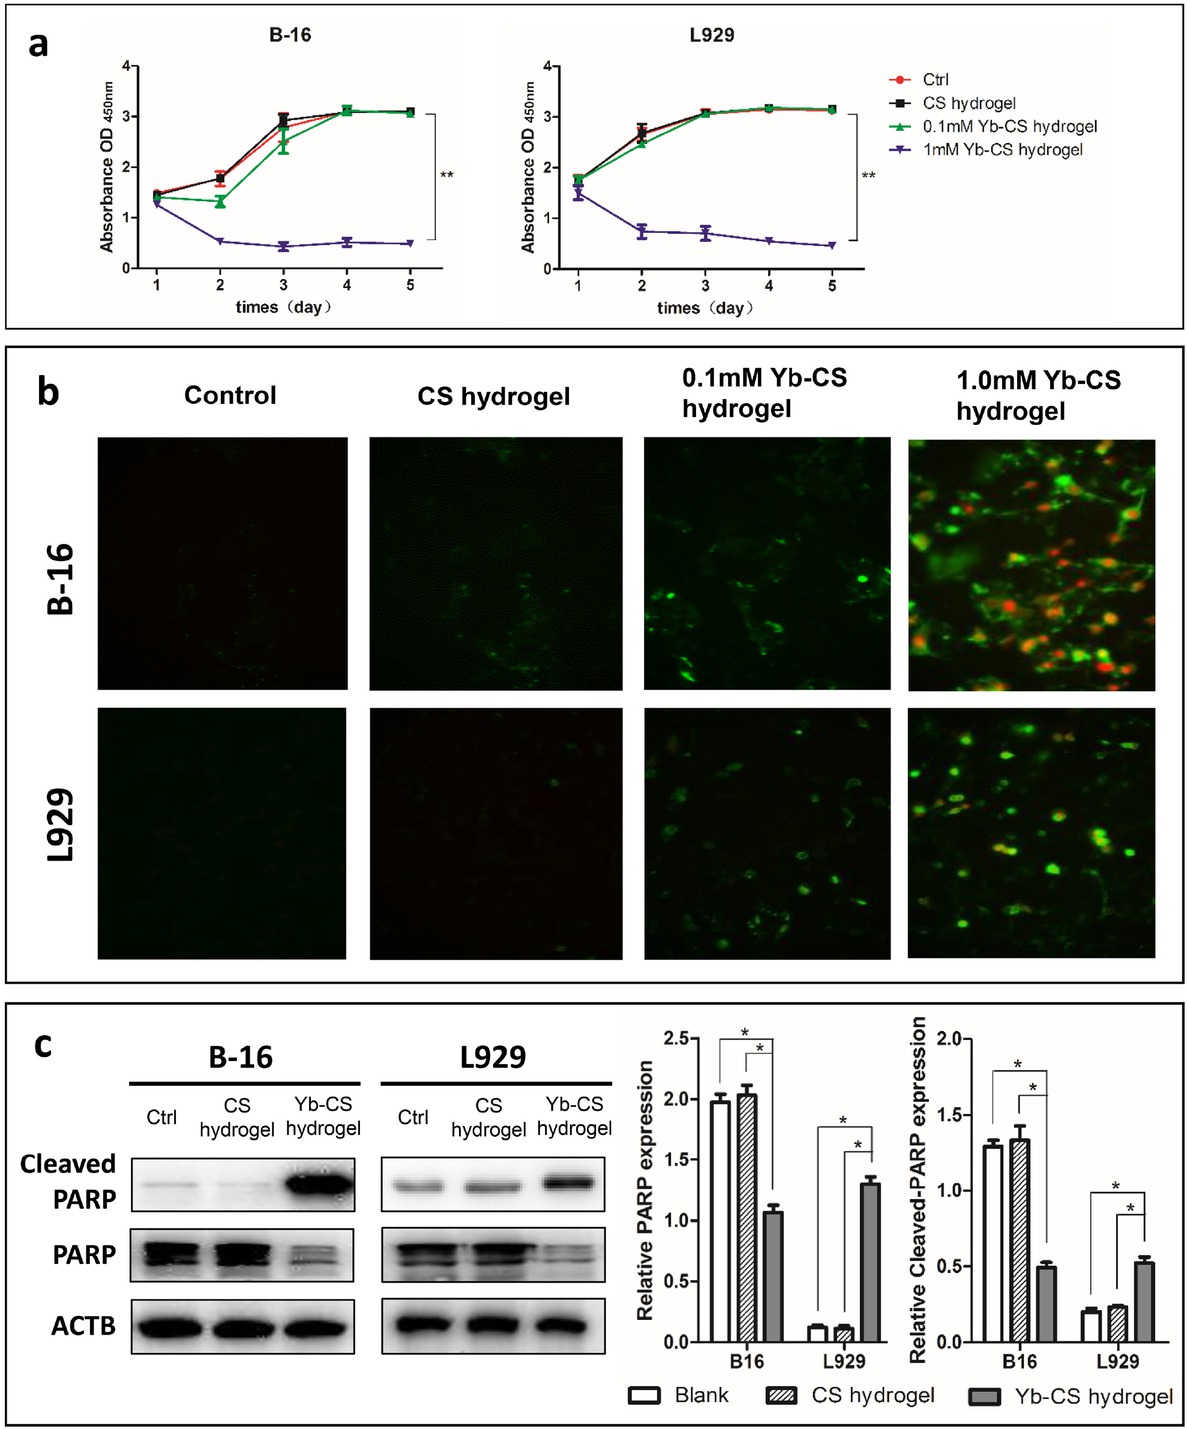
Yb3+ is the main factor that induces apoptosis in the Yb-CS hydrogel. (a) The absorption values of B-16 and L929 cells decreased in the Yb-CS hydrogel group. (b) Annexin V (green) and PI (red) double staining of B-16 and L929 cells on hydrogels containing Yb3+ at different concentrations. (c) Western blot of apoptosis marker proteins (PARP and its cleaved form) in B-16 and L929 cells treated with no hydrogels (control), blank CS hydrogels and Yb-CS hydrogels. *p<0.05, **p<0.01
3.5 The Yb-CS hydrogel inhibits melanoma relapse in mouse models
To analyze the in vivo effect of Yb3+-containing hydrogels on melanoma, a C57 melanoma mouse model was employed. The procedure of the mouse experiment is described in Figure 5a. Briefly, xenografts on both sides of tumor-bare mice were partially resected (approximately 5 mm3 of the tumor remained) at 10 days after tumor formation. The tumor remnants were used to determine whether the Yb-CS hydrogel (1.0 mM) inhibits the recurrence of melanoma. Then, we covered the wound with a hydrogel containing Yb3+on the left side and a blank hydrogel on the other side (Figure 5b-5e). After 2 weeks, the abdomen side covered with the Yb3+-containing hydrogel was cured with only one exception (1 out of 5 mice) (Figure 5f), while the other side, which was covered with the blank hydrogel, showed an obviously relapsing melanoma (5 out of 5 mice) (Figure 5g). To confirm the recurrence of melanoma, HE staining and IHC of ki-67 of skin tissues from both sides of the mice with xenografts were performed. Obvious melanoma tissue was observed under the epidermal tissue from the control side of the mice (Figure 5k-5m), whereas only some gel remnants were observed under the epidermal tissue from the Yb3+-containing gel-covered side of the mice (Figure 5h-5j). In addition, ki-67 staining of the neoplasm under the epidermal tissue from the control side of the mice was deeply stained, which verified that these tissues were indeed tumor tissues (Figure 5m). Therefore, all the results mentioned above demonstrated that the Yb-CS hydrogel inhibits the recurrence of melanoma in a mouse model.
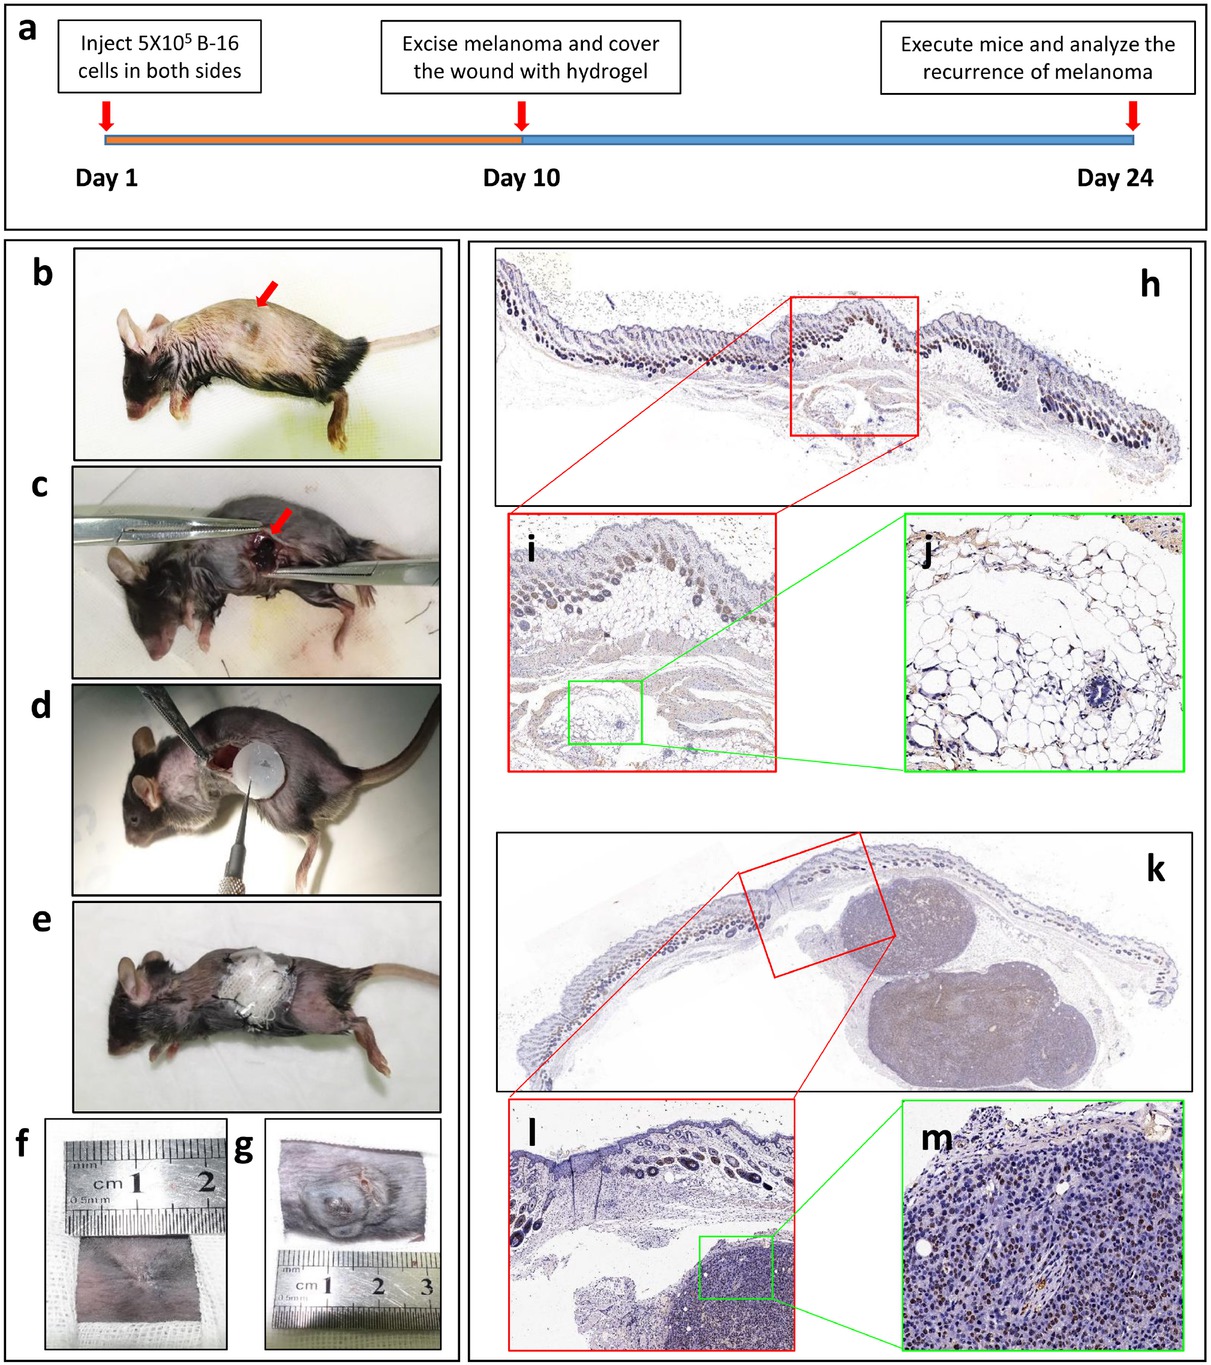
The Yb3+-containing hydrogel inhibits melanoma progression in mouse models. (a) The procedure of the mouse experiment. (b-e) Melanoma cells were injected into both sides of the abdomen in subcutaneous tissues in SD mice. The xenografts were observed approximately 10 days later (b). Both sides of the tumor were incompletely resected (c), and the wounds were covered with an Yb3+-containing hydrogel or a blank hydrogel (d). The wounds were sutured, and the open area remained covered with gauze and a plastic protector (e). The gauze and plastic protector were removed, and the wounds covered with the Yb3+-containing hydrogel (f) and the blank hydrogel (g) were analyzed after 2 weeks to detect the recurrence of melanoma. IHC of ki-67 was carried out on the skin tissues, including the implanted hydrogel (h-j) and relapsed melanoma tissue (k-m)
3.6 Yb3+ induces higher apoptosis rates in B-16 cells than in L929 cells
Because the concentration of Yb3+ in the hydrogel was imprecise and the Yb3+ ion was shown to primarily induce apoptosis, we used the Yb3+ ion instead of the Yb-CS hydrogel to detect variations in the apoptosis level in response to different concentrations of Yb3+. We seeded B-16 and L929 cells into an E-plate with Yb3+ at different concentrations (0, 0.01, 0.1, 0.5, 1.0, and 1.5 mM) (Figure 6a). The cell index was analyzed using an RTCA DP analyzer. The results showed that the cell index of B-16 cells decreased in a dose-dependent manner, whereas that of L929 cells only decreased at concentrations above 1.0 mmol/ L. The data shown in Figure 6a were plotted as a relative bar graph showing certain timepoints (1, 2, 3, 4, and 5 days) and indicated that compared with that of L929 cells, the relative cell index of B-16 cells decreased to a greater degree in the high-dose groups (1.0 and 1.5 mmol/ L) than in the other groups (Figure 6b). L929 cells grew slowly at 5 days after treatment with 1.0 mM Yb3+. These results implied that more B-16 cells may undergo apoptosis under Yb3+ treatment than L929 cells.
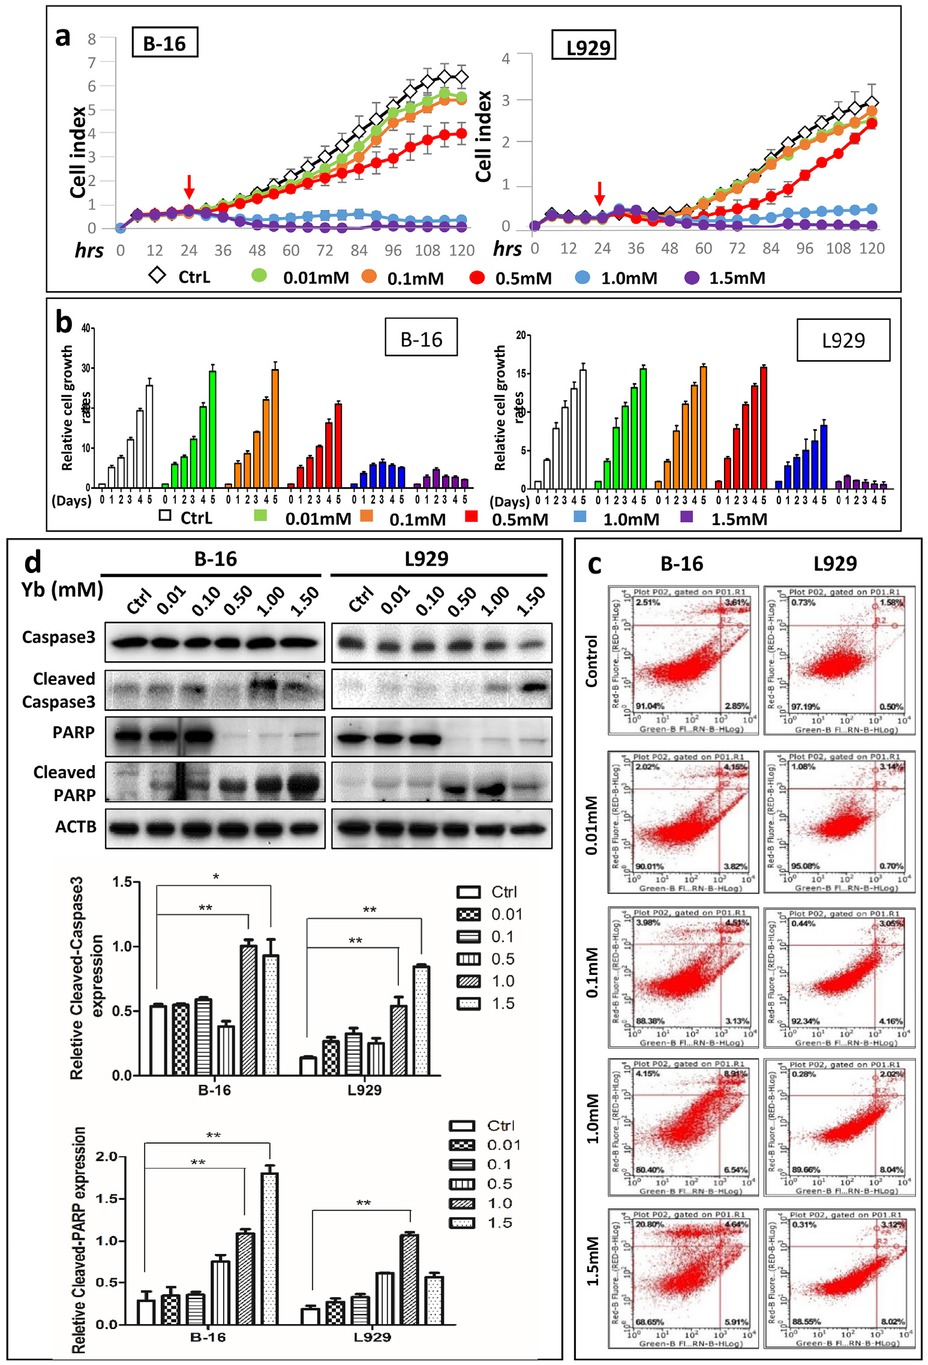
Yb3+ induces higher apoptosis rates in B-16 cells than in L929 cells. (a) RTCA assay results of B-16 and L929 cells in medium containing Yb3+ at different concentrations. Cells were first cultured in regular medium for 24 h (red arrow) and then treated with the Yb3+ ion. (b) Relative cell growth of B-16 and L929 cells at different timepoints (1, 2, 3, 4, and 5 days) obtained from the RTCA data. (c) Flow cytometry results of B-16 and L929 cells treated with medium containing different concentrations of Yb3+ for 24 h. (d) Western blot of apoptosis marker proteins (caspase3 and PARP and their cleaved forms) in B-16 and L929 cells treated with medium containing different concentrations of Yb3+ for 24 h. Relative expression of Cleaved-PARP and Cleaved Caspase3 in B-16 and L929 cells based on the western blot results. *p<0.05, **p<0.01
To more precisely analyze apoptosis, flow cytometry and western blotting of typical apoptosis proteins were performed. In the FCM-based assays, the total percentage of dead cells was 19.8±3.41% (4.96±1.62% early apoptotic cells, 9.24±2.58% late apoptotic cells and 5.43±1.14% dead or necrotic cells) and 8.63±3.7% (5.98±3.79% early apoptotic cells, 2.66±0.57% late apoptotic cells and 0.45±0.24% dead or necrotic cells) for B-16 cells and L929 cells treated with 1.0 mM Yb3+ at 24 h, respectively (Figure 6c). At 24 h after B-16 and L929 cells were treated with 1.5 mmol/ L Yb3+, the total percentage of dead cells was 31.47±2.52% (4.56±1.46% early apoptotic cells, 5.16±2.08% late apoptotic cells and 21.74±0.9% dead or necrotic cells) and 11.53±3.97% (7.99±3.92% early apoptotic cells, 3.22±0.15% late apoptotic cells and 0.31±0.07% dead or necrotic cells), respectively (Table S1). These results indicate that Yb3+ induces more apoptosis in B-16 cells than in L929 cells. To determine whether cells treated with Yb3+ underwent apoptosis, we detected the cleavage of typical apoptosis proteins, PARP and caspase 3 (Table S2). The results showed that the expression levels of cleaved-PARP and cleaved-caspase 3 (the active forms of PARP and caspase 3, respectively) greatly increased after Yb3+ treatment (Figure 6d). However, the expression levels of pro-PARP and pro-caspase 3 (the inactive forms of PARP and caspase 3, respectively) increased (Figure 6d).
The data of FCM-based apoptosis results. B-16 and L929 cells were treated with Yb3+ at 0, 0.1, 0.5, 1.0, 1.5mmol/L. (Mean±SD)
| B16-ctrl | B16-0.1mM | B16-0.5mM | B16-1.0mM | B16-1.5mM | |
|---|---|---|---|---|---|
| Q1 | 2.27±0.44 | 1.97±0.34 | 4.13±0.32 | 5.43±1.14 | 21.74±0.9 |
| Q2 | 91.51±1.46 | 90.4±1.55 | 88.75±1.5 | 80.2±3.41 | 68.53±2.52 |
| Q3 | 2.82±1.08 | 3.54±1.02 | 2.91±0.91 | 4.96±1.62 | 4.56±1.46 |
| Q4 | 3.4±0.73 | 4.1±0.86 | 4.22±0.9 | 9.24±2.58 | 5.16±2.08 |
| Q2+Q3+Q4 | 8.49±1.46 | 9.6±1.55 | 11.25±1.5 | 19.8±3.41 | 31.47±2.52 |
| L929-ctrl | L929-0.1mM | L929-0.5mM | L929-1.0mM | L929-1.5mM | |
|---|---|---|---|---|---|
| Q1 | 1.25±0.46 | 1.06±0.05 | 0.37±0.11 | 0.45±0.24 | 0.31±0.07 |
| Q2 | 95.29±1.82 | 96.25±1.11 | 89.48±5.73 | 90.92±3.47 | 88.47±3.97 |
| Q3 | 0.78±0.62 | 0.64±0.31 | 7.15±4.97 | 5.98±3.79 | 7.99±3.92 |
| Q4 | 2.68±0.96 | 2.06±0.94 | 2.66±0.63 | 2.66±0.57 | 3.22±0.15 |
| Q2+Q3+Q4 | 4.71±1.82 | 3.75±1.11 | 10.52±5.73 | 9.08±3.47 | 11.53±3.97 |
Q1: Upper left quadrant; Q2: left lower quadrant; Q3: right upper quadrant; Q4: right lower quadrant.
Relative protein expression of PARP, Cleaved-PARP, Caspase3, Cleaved-Casepase3 from Western-blot data (Mean±SD)
| PARP | Cleaved-PARP | Caspase3 | Cleaved-Caspase3 | |
|---|---|---|---|---|
| B16-Ctrl | 0.916±0.172 | 0.288±0.108 | 1.088±0.046 | 0.537±0.017 |
| B16-0.01 | 0.842±0.142 | 0.347±0.099 | 0.866±0.029 | 0.549±0.01 |
| B16-0.1 | 0.779±0.134 | 0.356±0.034 | 0.723±0.013 | 0.59±0.015 |
| B16-0.5 | 0.08±0.022 | 0.751±0.077 | 0.69±0.035 | 0.382±0.042 |
| B16-1.0 | 0.091±0.019 | 1.09±0.052 | 0.863±0.047 | 1.004±0.049 |
| B16-1.5 | 0.187±0.032 | 1.804±0.092 | 1.138±0.008 | 0.93±0.126 |
| L929-Ctrl | 0.716±0.067 | 0.187±0.037 | 0.738±0.01 | 0.14±0.01 |
| L929-0.01 | 0.746±0.073 | 0.273±0.042 | 0.638±0.018 | 0.266±0.032 |
| L929-0.1 | 0.885±0.049 | 0.33±0.037 | 0.711±0.03 | 0.326±0.045 |
| L929-0.5 | 0.07±0.018 | 0.613±0.006 | 0.864±0.061 | 0.25±0.041 |
| L929-1.0 | 0.133±0.015 | 1.07±0.034 | 0.71±0.008 | 0.539±0.07 |
| L929-1.5 | 0.183±0.018 | 0.566±0.051 | 0.564±0.012 | 0.844±0.016 |
3.7 Yb3+ ions trigger the anoikis of B-16 cells in a focal adhesion kinase (FAK)-dependent manner
After inducing the apoptosis of B-16 cells by Yb3+, we observed morphological changes in B-16 cells. To visualize these changes, microfilaments (mainly F-actin) were stained with FITC-phalloidin. The results obviously showed that B-16 cell morphology varied from ellipsoidal to slender shapes, whereas nearly no morphological changes were observed in L929 cells after treatment.
The presence of filament structures indicated the shrinkage of entire B-16 cells, which may then induce cell detachment (Figure 7a). Therefore, we hypothesized that Yb3+- containing hydrogels induce cell detachment-dependent apoptosis-anoikis. To verify this hypothesis, cell adhesion assays of B-16 and L929 cells were performed under standard conditions by counting cells that were seeded into hydrogels containing different concentrations (0, 0.01, 0.1, and 1.0 mM) of Yb3+ for 2 h. The results showed that the numbers of B-16 cells decreased with increasing concentrations of Yb3+ (Figure 7b). For an accurate analysis, RTCA assays were employed to show the inhibition of cell adhesion by Yb3+. The results indicated that B-16 cell adhesion was inhibited after treatment with 0.5, 1.0, and 1.5 mMYb3+ (Figure 7c). The relative cell adhesion analysis showed that B-16 cells treated with 0.5, 1.0, and 1.5 mM Yb3+ had significantly lower cell adhesion at 2 h. Furthermore, L929 cells only showed decreased cell adhesion after treatment with 1.5 mM Yb3+ (P<0.05).
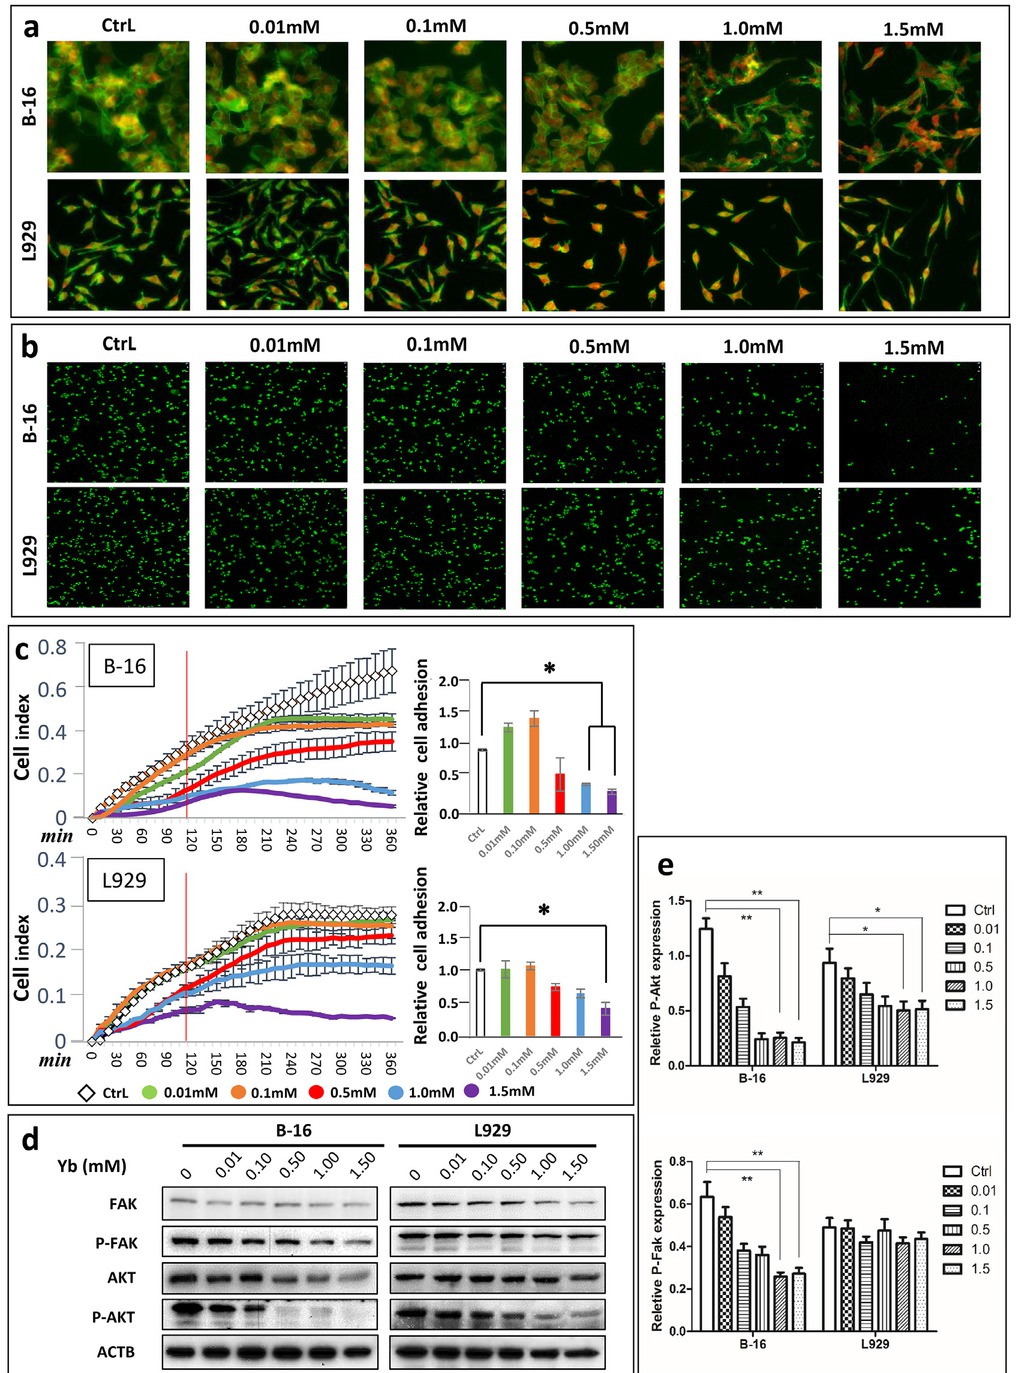
Yb3+ induced the anoikis of B-16 cells by FAK signaling. (a) FITC-phalloidin staining for F-actin in B-16 and L929 cells on hydrogels containing different concentrations of Yb3+. (b) Cell adhesion assays of B-16 and L929 cells on the same hydrogels using SYBR I. (c) RTCA assays for detecting cell adhesion and spreading of B-16 and L929 cells cultured in medium containing different concentrations of Yb3+ within 6 h. The relative cell adhesion rates are shown for the 2 h timepoint (*p<0.05). (d) Western blot of anoikis marker proteins (FAK, Akt and their phosphorylated forms) in B-16 and L929 cells treated with medium containing different concentrations of Yb3+ at 24 h. (e) Relative expression of P-Akt and P-Fak in B-16 and L929 cells based on the results of western blot analysis (*p<0.05, **p<0.01)
To further confirm these results, we determined the expression of marker proteins related to anoikis, including FAK, AKT and their phosphorylated forms. A high phosphorylation level of these proteins indicates high cell adhesion. Our results revealed that the expression levels of p-FAK and P-AKT were apparently decreased after B-16 cells were treated with higher concentrations of Yb3+ (Figure 7d-e), whereas the expression levels of p-FAK and P-AKT were only slightly decreased in L929 cells (Figure 7d). The total expression levels of FAK and AKT in each group of B-16 and L929 cells remained nearly unchanged (Table S3).
Relative protein expression of P-Akt, Akt, P-Fak, Fak from Western-blot data (Mean±SD)
| P-Akt | Akt | P-Fak | Fak | |
|---|---|---|---|---|
| B16-Ctrl | 1.244±0.097 | 0.657±0.049 | 0.634±0.07 | 0.282±0.022 |
| B16-0.01 | 0.813±0.119 | 0.497±0.016 | 0.54±0.045 | 0.2±0.018 |
| B16-0.1 | 0.535±0.075 | 0.462±0.03 | 0.38±0.032 | 0.212±0.016 |
| B16-0.5 | 0.241±0.054 | 0.355±0.025 | 0.36±0.039 | 0.209±0.009 |
| B16-1.0 | 0.254±0.049 | 0.346±0.018 | 0.258±0.02 | 0.177±0.013 |
| B16-1.5 | 0.212±0.041 | 0.428±0.02 | 0.272±0.027 | 0.21±0.018 |
| L929-Ctrl | 0.936±0.129 | 0.401±0.011 | 0.49±0.044 | 0.327±0.022 |
| L929-0.01 | 0.795±0.091 | 0.452±0.003 | 0.484±0.039 | 0.284±0.017 |
| L929-0.1 | 0.648±0.105 | 0.452±0.011 | 0.42±0.028 | 0.255±0.025 |
| L929-0.5 | 0.544±0.086 | 0.435±0.02 | 0.474±0.055 | 0.258±0.03 |
| L929-1.0 | 0.504±0.082 | 0.48±0.019 | 0.415±0.029 | 0.202±0.022 |
| L929-1.5 | 0.515±0.076 | 0.404±0.029 | 0.436±0.03 | 0.184±0.022 |
4 Discussion
Melanoma is a lethal dermal-derived tumor with high relapse potential. However, a postoperative standard adjuvant therapy, which could prevent the relapse of melanoma, has not been developed. In this study, we developed an Yb3+-containing chitosan hydrogel to inhibit the growth of melanoma (Figure 8). Our results clearly showed that chitosan hydrogel containing a high concentration of Yb3+ (0.5~1.5 mM) inhibited the proliferation of B-16 mouse melanoma cells and L929 normal mouse skin fibroblast cells and induced apoptosis. We also demonstrated that Yb3+ is the main factor in the hydrogel that induces apoptosis. Interestingly, upon detecting the effect of Yb3+ ions in inducing apoptosis, we found that under certain conditions (Yb3+ ion concentrations of 0.5 and 1.0 mM), the B16 cell apoptosis phenomenon is more obvious than that of L929 cells, which may mean that B-16 cells are more sensitive to Yb3+ than L929 cells. Furthermore, higher expression levels of cleaved-PARP and cleaved-caspase3 were detected in B-16 cells than in L929 cells. These results were also consistent with the results from the animal experiments. In vivo, Yb3+-containing hydrogels inhibited the growth of melanoma but had no harmful influence on skin union and peripheral normal tissue damage. Moreover, we also showed that cell death induced by Yb3+ ions was anoikis, which was verified by cell adhesion assays and FAK phosphorylation levels of B-16 and L929 cells after treatment with either Yb3+-containing chitosan hydrogels or Yb3+ ions alone. In addition, the morphological changes and cytoskeletal network rearrangement of B-16 and L929 cells treated with Yb3+ also indicated that Yb3+-contained hydrogels induced cell anoikis.
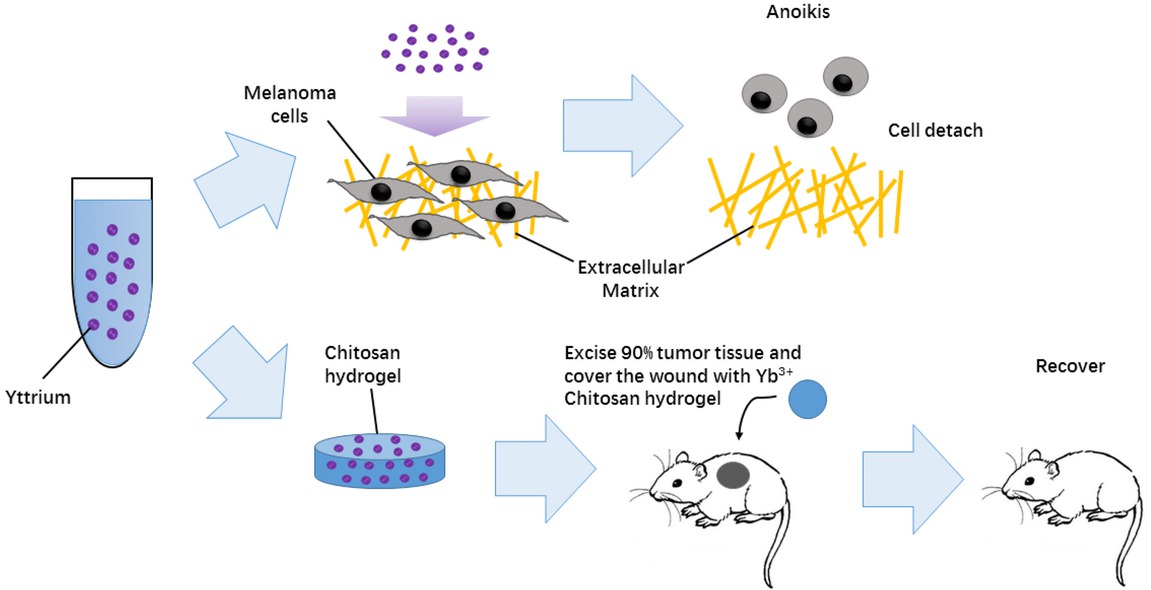
A Yb3+-containing chitosan hydrogel (Yb-CS hydrogel) was reported for the first time to inhibit the FAK-dependent signaling pathway and induce cancer cell anoikis. In vivo, our study showed that the Yb-CS hydrogel inhibited the recurrence of melanoma in a mouse bare xenograft tumor model
Anoikis is a special form of apoptosis characterized by anchorage loss between cells and their surrounding extracellular matrix (ECM) [26]. Similar to classic apoptosis, anoikis could be triggered from either intrinsic pathways, due to the unsteadiness of mitochondria, or extrinsic pathways triggered by cell surface membrane protein kinases [27]. FAK, which is a nonreceptor protein tyrosine kinase, is indispensable in cell-substratum adhesions named focal adhesion complexes. Therefore, FAK is important in the maintenance of normal cell survival. Disruption of FAK signaling results in anoikis of anchoragedependent cells, such as endothelial and epithelial cells.28 Most importantly, FAK is overexpressed in a variety of invasive human tumors and is believed to contribute to malignancies [29]. Moreover, tumor cells with high metastatic potential are inclined to escape from anoikis during hematogenous metastasis and invade other organs. Therefore, the promotion of anoikis by interfering with FAK activity is a promising strategy for the development of anticancer drugs. In 2009, Su et al. [30] reported for the first time that lanthanum citrate (LaCit) at concentrations of 0.001-0.1 mmol/ L induces the anoikis of HeLa cells after 48 h. They also showed that the intrinsic caspase pathway is involved in the anoikis induced by LaCit and reorganization of the actin cytoskeleton, which is consistent with our results. Until now, the study conducted by Su et al. [30]. was the only study of a lanthanide compound inducing tumor cell anoikis. Therefore, our study showed that Yb3+ induced melanoma cell anoikis and validated the hypothesis that lanthanide compounds induce cell anoikis. However, whether anoikis is the only pathway that induces apoptosis still needs to be investigated.
As mentioned above, the results from this study showed that a Yb3+-containing chitosan hydrogel is capable of inducing melanoma cell anoikis, and this is the first study to show that Yb3+ induces the anoikis of tumor cells. Therefore, the novel Yb3+-containing chitosan hydrogel that we developed not only can inhibit the relapse of melanoma cells but also has no harmful influence on skin union and peripheral normal tissue damage, which provides a foundation for applying yttrium-containing compounds to anti-recurrence treatments in melanoma patients.
5 Conclusions
In summary, we reported that an Yb-CS hydrogel induces tumor cell death but has less impact on normal dermal cells, and we also revealed that Yb3+ induces the anoikis of tumor cells through a Fak-dependent pathway. Therefore, the Yb-CS hydrogel could be a suitable and effective strategy for treating melanoma.
Abbreviations
- Yb-CS Hydrogel
[Yb(NO3)3]-containing chitosan hydrogel
- FAK
focal adhesion kinase
- RTCA
real-time cell analyzer
- XRD
X-ray powder diffraction
- TG-DTA
thermogravimetric analysis
Acknowledgement
This study was supported by the Shanghai Jiaotong University Medical and Industry cross fund (Award Number: YG2017MS21) and the National Natural Science Foundation of China (Award Number: No.81501939).
Ethical approval: The conducted research was performed in accordance with relevant regulations and was approved by the Shanghai Jiao Tong University Affiliated Sixth People’s Hospital Ethical Board.
Conflict of Interest: The authors have no conflict of interest regarding the publication of this paper.
References
[1] Corrie P., Hategan M., Fife K., Parkinson C., Management of melanoma, Br. Med. Bull., 2014, 1111, 149-162.10.1093/bmb/ldu019Search in Google Scholar PubMed
[2] Gandolfi G., Dallaglio K., Longo C., Moscarella E., Lallas A., Alfano R. et al., Contemporary and potential future molecular diagnosis of melanoma, Expert Rev. Mol. Diagn., 2016, 169, 975-985.10.1080/14737159.2016.1206473Search in Google Scholar PubMed
[3] Wang Y., Tu Y., Lu J., Tao J., Li Y., c-FLIPp43 induces activation of the nuclear factorkappaB signaling pathway in a dose-dependent manner in the A375 melanoma cell line, Mol. Med. Rep., 2014, 103, 1438-1442.10.3892/mmr.2014.2364Search in Google Scholar PubMed
[4] Menzies A.M., Long G.V., Recent Developments in Melanoma Therapy, JAMA Oncol., 2016, 210, 1259-1260.10.1001/jamaoncol.2016.3418Search in Google Scholar PubMed
[5] Friedman E.B., Shang S., de Miera E.V., Fog J.U., Teilum M.W., Ma M.W. et al., Serum microRNAs as biomarkers for recurrence in melanoma, J. Transl. Med., 2012, 10, 155.10.1186/1479-5876-10-155Search in Google Scholar PubMed PubMed Central
[6] Dabrowski E., Dippel E., Systemic treatment of distant metastatic malignant melanoma, Radiologe, 2015, 552, 99-100, 102-104.10.1007/s00117-014-2759-7Search in Google Scholar PubMed
[7] Dzwierzynski W.W., Managing malignant melanoma, Plast. Reconstr. Surg., 2013, 1323, 446e-460e.10.1097/PRS.0b013e31829ad411Search in Google Scholar PubMed
[8] Bedikian A.Y., Metastatic uveal melanoma therapy: current options, Int Ophthalmol. Clin., 2006, 461, 151-166.10.1097/01.iio.0000195852.08453.deSearch in Google Scholar PubMed
[9] Das Thakur M., Salangsang F., Landman A.S., Sellers W.R., Pryer N.K., Levesque M.P. et al., Modelling vemurafenib resistance in melanoma reveals a strategy to forestall drug resistance, Nature, 2013, 4947436, 251-255.10.1038/nature11814Search in Google Scholar PubMed PubMed Central
[10] Yu L., Xiong J., Guo L., Miao L., Liu S., Guo F., The effects of lanthanumchloride on proliferation and apoptosis of cervical cancer cells: involvement of let-7a and miR-34a microRNAs, Biometals, 2015, 285, 879-890.10.1007/s10534-015-9872-6Search in Google Scholar PubMed
[11] Wang F., Zhu Y., Fang S., Li S., Liu S., Lanthanum chloride enhances cisplatin-induced apoptosis in ovarian cancer cells, Cell Mol. Biol. (Noisy-le-grand), 2016, 627, 1-5.Search in Google Scholar
[12] Shi P., Huang Z., Proteomic detection of changes in protein synthesis induced by lanthanum in BGC-823 human gastric cancer cells, Biometals, 2005, 181, 89-95.10.1007/s10534-004-1812-9Search in Google Scholar PubMed
[13] Tsai Y.F., Huang C.W., Chiang J.H., Tsai F.J., Hsu Y.M., Lu C.C. et al., Gadolinium chloride elicits apoptosis in human osteosarcoma U-2 OS cells through extrinsic signaling, intrinsic pathway and endoplasmic reticulum stress, Oncol. Rep., 2016, 366, 3421-3426.10.3892/or.2016.5174Search in Google Scholar PubMed
[14] Lin C.M., Ma J.M., Zhang L., Hao Z.Y., Zhou J., Zhou Z.Y. et al., Inhibition of Transient Receptor Potential Melastain 7 Enhances Apoptosis Induced by TRAIL in PC-3 cells, Asian Pac. J. Cancer Prev., 2015, 1610, 4469-4475.10.7314/APJCP.2015.16.10.4469Search in Google Scholar
[15] Ye L., Shi Z., Liu H., Yang X., Wang K., GdCl3 induced Hep G2 cell death through mitochondrial and external death pathways without significant elevation of ROS generation, Biol. Trace Elem. Res., 2013, 1511, 148-155.10.1007/s12011-012-9538-ySearch in Google Scholar PubMed
[16] Kumari M., Singh S.P., Chinde S., Rahman M.F., Mahboob M., Grover P., Toxicity study of cerium oxide nanoparticles in human neuroblastoma cells, Int J Toxicol., 2014, 332, 86-97.10.1177/1091581814522305Search in Google Scholar PubMed
[17] Ghahramani M.R., Garibov A.A., Agayev T.N., Production and quality control of radioactive yttrium microspheres for medical applications, Appl. Radiat. Isot., 2014, 85, 87-91.10.1016/j.apradiso.2013.12.009Search in Google Scholar PubMed
[18] Zeng L., Pan Y., Tian Y., Wang X., Ren W., Wang S. et al., Doxorubicin-loaded NaYF4:Yb/Tm-TiO2 inorganic photosensitizers for NIR-triggered photodynamic therapy and enhanced chemotherapy in drug-resistant breast cancers, Biomater., 2015, 57, 93-106.10.1016/j.biomaterials.2015.04.006Search in Google Scholar PubMed
[19] Ding Y., Tian Y., Zeng Z., Shuai P., Lan H., Zhu X. et al., YCl3 Promotes Neuronal Cell Death by Inducing Apoptotic Pathways in Rats, Biomed. Res. Int., 2017, 2017, 2183658.10.1155/2017/2183658Search in Google Scholar PubMed PubMed Central
[20] Chen X., Xie W., Gu P., Cai Q., Wang B., Xie Y. et al., Upregulated WDR5 promotes proliferation, self-renewal and chemoresistance in bladder cancer via mediating H3K4 trimethylation, Sci. Rep., 2015, 5, 8293.Search in Google Scholar
[21] Chen X., Gu P., Xie R., Han J., Liu H., Wang B. et al., Heterogeneous nuclear ribonucleoprotein K is associated with poor prognosis and regulates proliferation and apoptosis in bladder cancer, J. Cell. Mol. Med., 2017, 21, 1266-1279.10.1111/jcmm.12999Search in Google Scholar PubMed PubMed Central
[22] Chen Y., Yu J., Ke Q., Gao Y., Zhang C., Guo Y., Bioinspired fabrication of carbonated hydroxyapatite/chitosan nanohybrid scaffolds loaded with TWS119 for bone regeneration, Chem. Eng. J., 2018, 341, 112-125.10.1016/j.cej.2018.02.010Search in Google Scholar
[23] Tang X., Gan L., Duan Y., Sun Y., Zhang Y., Zhang Z., A novel Cd2+ -imprinted chitosan-based composite membrane for Cd2+ removal from aqueous solution, Mater. Lett., 2017, 198, 121-123.10.1016/j.matlet.2017.04.006Search in Google Scholar
[24] Zhu R., Chen Y.-X., Ke Q.-F., Gao Y.-S., Guo Y.-P., SC79-loaded ZSM-5/chitosan porous scaffolds with enhanced stem cell osteogenic differentiation and bone regeneration, J. Mater. Chem. B, 2017, 525, 5009-5018.10.1039/C7TB00897JSearch in Google Scholar
[25] Ahmed A.A.A., Talib Z.A., Hussein M.Z., Synthesis and optimization of electric conductivity and thermal diffusivity of zincaluminum hydroxide (Zn–Al–NO3–LDH) prepared at different pH values, Mater. Today Proc., 2016, 32, 130-144.10.1016/j.matpr.2016.01.044Search in Google Scholar
[26] Paoli P., Giannoni E., Chiarugi P., Anoikis molecular pathways and its role in cancer progression, Biochim. Biophys. Acta Mol. Cell Res., 2013, 183312, 3481-3498.10.1016/j.bbamcr.2013.06.026Search in Google Scholar PubMed
[27] Frisch S.M., Schaller M., Cieply B., Mechanisms that link the oncogenic epithelial–mesenchymal transition to suppression of anoikis, J. Cell Sci., 2013, 1261, 21-29.10.1242/jcs.120907Search in Google Scholar PubMed PubMed Central
[28] Alanko J., Ivaska J., Endosomes: emerging platforms for integrinmediated FAK signalling, Trends Cell Biol., 2016, 266, 391-398.10.1016/j.tcb.2016.02.001Search in Google Scholar PubMed
[29] Golubovskaya V.M., Conway-Dorsey K., Edmiston S.N., Tse C.-K., Lark A.A., Livasy C.A., et al., FAK overexpression and p53 mutations are highly correlated in human breast cancer, Int. J. Cancer, 2009, 1257, 1735-1738.10.1002/ijc.24486Search in Google Scholar PubMed PubMed Central
[30] Su X., Zheng X., Ni J., Lanthanum citrate induces anoikis of Hela cells, Cancer Lett., 2009, 2852, 200-209.10.1016/j.canlet.2009.05.018Search in Google Scholar PubMed
© 2019 Y. Miao et al., published by De Gruyter
This work is licensed under the Creative Commons Attribution 4.0 Public License.
Articles in the same Issue
- Research Articles
- Investigation of rare earth upconversion fluorescent nanoparticles in biomedical field
- Carbon Nanotubes Coated Paper as Current Collectors for Secondary Li-ion Batteries
- Insight into the working wavelength of hotspot effects generated by popular nanostructures
- Novel Lead-free biocompatible piezoelectric Hydroxyapatite (HA) – BCZT (Ba0.85Ca0.15Zr0.1Ti0.9O3) nanocrystal composites for bone regeneration
- Effect of defects on the motion of carbon nanotube thermal actuator
- Dynamic mechanical behavior of nano-ZnO reinforced dental composite
- Fabrication of Ag Np-coated wetlace nonwoven fabric based on amino-terminated hyperbranched polymer
- Fractal analysis of pore structures in graphene oxide-carbon nanotube based cementitious pastes under different ultrasonication
- Effect of PVA fiber on durability of cementitious composite containing nano-SiO2
- Cr effects on the electrical contact properties of the Al2O3-Cu/15W composites
- Experimental evaluation of self-expandable metallic tracheobronchial stents
- Experimental study on the existence of nano-scale pores and the evolution of organic matter in organic-rich shale
- Mechanical characterizations of braided composite stents made of helical polyethylene terephthalate strips and NiTi wires
- Mechanical properties of boron nitride sheet with randomly distributed vacancy defects
- Fabrication, mechanical properties and failure mechanism of random and aligned nanofiber membrane with different parameters
- Micro- structure and rheological properties of graphene oxide rubber asphalt
- First-principles calculations of mechanical and thermodynamic properties of tungsten-based alloy
- Adsorption performance of hydrophobic/hydrophilic silica aerogel for low concentration organic pollutant in aqueous solution
- Preparation of spherical aminopropyl-functionalized MCM-41 and its application in removal of Pb(II) ion from aqueous solution
- Electrical conductivity anisotropy of copper matrix composites reinforced with SiC whiskers
- Miniature on-fiber extrinsic Fabry-Perot interferometric vibration sensors based on micro-cantilever beam
- Electric-field assisted growth and mechanical bactericidal performance of ZnO nanoarrays with gradient morphologies
- Flexural behavior and mechanical model of aluminum alloy mortise-and-tenon T-joints for electric vehicle
- Synthesis of nano zirconium oxide and its application in dentistry
- Surface modification of nano-sized carbon black for reinforcement of rubber
- Temperature-dependent negative Poisson’s ratio of monolayer graphene: Prediction from molecular dynamics simulations
- Finite element nonlinear transient modelling of carbon nanotubes reinforced fiber/polymer composite spherical shells with a cutout
- Preparation of low-permittivity K2O–B2O3–SiO2–Al2O3 composites without the addition of glass
- Large amplitude vibration of doubly curved FG-GRC laminated panels in thermal environments
- Enhanced flexural properties of aramid fiber/epoxy composites by graphene oxide
- Correlation between electrochemical performance degradation and catalyst structural parameters on polymer electrolyte membrane fuel cell
- Materials characterization of advanced fillers for composites engineering applications
- Humic acid assisted stabilization of dispersed single-walled carbon nanotubes in cementitious composites
- Test on axial compression performance of nano-silica concrete-filled angle steel reinforced GFRP tubular column
- Multi-scale modeling of the lamellar unit of arterial media
- The multiscale enhancement of mechanical properties of 3D MWK composites via poly(oxypropylene) diamines and GO nanoparticles
- Mechanical properties of circular nano-silica concrete filled stainless steel tube stub columns after being exposed to freezing and thawing
- Arc erosion behavior of TiB2/Cu composites with single-scale and dual-scale TiB2 particles
- Yb3+-containing chitosan hydrogels induce B-16 melanoma cell anoikis via a Fak-dependent pathway
- Template-free synthesis of Se-nanorods-rGO nanocomposite for application in supercapacitors
- Effect of graphene oxide on chloride penetration resistance of recycled concrete
- Bending resistance of PVA fiber reinforced cementitious composites containing nano-SiO2
- Review Articles
- Recent development of Supercapacitor Electrode Based on Carbon Materials
- Mechanical contribution of vascular smooth muscle cells in the tunica media of artery
- Applications of polymer-based nanoparticles in vaccine field
- Toxicity of metallic nanoparticles in the central nervous system
- Parameter control and concentration analysis of graphene colloids prepared by electric spark discharge method
- A critique on multi-jet electrospinning: State of the art and future outlook
- Electrospun cellulose acetate nanofibers and Au@AgNPs for antimicrobial activity - A mini review
- Recent progress in supercapacitors based on the advanced carbon electrodes
- Recent progress in shape memory polymer composites: methods, properties, applications and prospects
- In situ capabilities of Small Angle X-ray Scattering
- Review of nano-phase effects in high strength and conductivity copper alloys
- Progress and challenges in p-type oxide-based thin film transistors
- Advanced materials for flexible solar cell applications
- Phenylboronic acid-decorated polymeric nanomaterials for advanced bio-application
- The effect of nano-SiO2 on concrete properties: a review
- A brief review for fluorinated carbon: synthesis, properties and applications
- A review on the mechanical properties for thin film and block structure characterised by using nanoscratch test
- Cotton fibres functionalized with plasmonic nanoparticles to promote the destruction of harmful molecules: an overview