Parameter control and concentration analysis of graphene colloids prepared by electric spark discharge method
-
 ,
,

Abstract
In this study, graphene colloids were prepared using the electric spark discharge method (ESDM) with graphite rods (99.9% purity) in deionized water (DW) at a normal temperature and pressure. Five different types of graphene colloids were prepared using an electrical discharge machine (EDM) with five different pulse cycle switching times (Ton:Toff ) = 10:10, 30:30, 50:50, 70:70, and 90:90 μs. According to the Ultraviolet-visible spectra (UV-Vis) and Zetasizer analysis, the results showed that the 10:10 μs parameter was the most suitable for the preparation of graphene colloids. UV-Vis was also used to detect the concentration of the graphene colloids; a comparison with a graphene oxide (GO) confirmed that this method could be used to calculate the discharge time needed to produce graphene colloids with different concentrations in the ESDM process.
1 Introduction
Graphene is completely different from GO in nature and can be clearly distinguished by chemical bonding. Graphene is a planar film in the form of a hexagonal lattice composed of carbon atoms in the sp2 orbit domain. Graphene has the characteristics of low resistivity, high thermal conductivity, and high mechanical properties [1, 2, 3]. The bond of GO is similar to graphene; however, the carbon atomlayers are destroyed due to oxidation and oxygen atoms are inserted into the gaps between carbon atom layers to form a structure in which the carbon atom layer coexists with the oxygen atom [4]. GO has high hydrophilicity and mechanical properties [5], and it has high dispersion stability in water [6]. Based on these advantages, graphene and GO have numerous applications, including transparent electrodes, supercapacitors, composite materials, and solar cells [7, 8, 9, 10]. There are numerous chemical preparation methods for graphene, including chemical vapor deposition [11], chemical exfoliation [12], the Hummers method [13], and the epitaxial growth method [14], of which the Hummers method is the method that can produce GO with different concentrations in large quantities and with properties that are closely related to this study. Although it could be known from the literature [15] that the peaks of the UV-Vis characteristics of GO and graphene are completely different (230 and 262 nm, respectively), from the viewpoint of the chemical bond, the difference between the two is only whether the oxygen atom is inserted into the broken carbon atom layers or not; the orbital domain formed by the carbon itself does not change dramatically. Under such conditions, a GO can be used to detect the concentration of graphene colloids prepared by ESDM.
Previous studies on graphene colloids made with self-developed micro-EDM devices have been published [16]. Limited by the PID parameters of the VisSim program in micro-EDM, Ton:Toff can only be set to 10:10 μs, however no research has been done on other Ton:Toff parameters, and at the same time, the results of nanometer colloids fabricated by micro-EDM and EDM are totally different. In this study, five different Ton:Toff parameters were used to prepare graphene colloids through EDM, and the quality of the finished products was determined by the results of UV-Vis and Zetasizer analysis. Finally, the best quality finished products were analyzed using Raman and Transmission electron microscope (TEM) analysis. After finding the optimum preparation parameters, it is difficult to control the discharge process of graphene colloids prepared by the physical method and it is not easy to obtain graphene colloids with a specific concentration. Therefore, it is a very important topic to develop a new EDM qualitative and quantitative method to prepare graphene colloids with specific concentrations at different discharge times; at the same time, it is also a major research focus for the preparation of nanometer colloids by ESDM. Because ESDM cannot control the concentration of nanometer colloids as meticulously as the chemical method in the process, the new qualitative and quantitative method provides a mechanism for judging the concentration, which can be used to accurately grasp the concentration of nanometer colloids during ESDM preparation.
2 Experimental system and method
2.1 Experimental system
In this experiment, graphene colloidswere prepared using an EDM. The principle is to use electric energy to convert heat energy and to melt the lower electrode rapidly without direct contact between the upper and lower electrodes. This method is called ESDM. The schematic diagram of the EDM is shown in Figure 1. The upper and lower electrodes are made of a conductive material, the dielectric fluid is made of insulating DW [17]. The upper electrodes slowly approach the lower electrodes using Pulse Width Modulation (PWM) as a servo control until the electrodes are immersed in the DW. When the distance between the two electrodes is about 30 μm, the electric field intensity on the surface of the electrode will exceed the insulating withstand voltage of the DW, resulting in the insulation being destroyed, a high-temperature arc forming between the two electrodes.

EDM
The EDM related parameters include Ton:Toff , the current segment, and high-low voltage switching. Ton:Toff was the most important parameter in this study and was set according to the principle of PWM. The current segment potential (IP) consists of seven segments in which the larger the IP value, the higher the discharge current (Igap) between electrodes and the faster the processing speed; however, a lower processing fineness will result in the larger the size of the prepared nanoparticles. EDM is a transistor discharge circuit and the switch of the processing power supply can be controlled. In the process of a continuous discharge, it can be controlled by PWM. The arc discharge process is shown in Figure 2. The voltage and current between the two electrodes in EDM are the Vgap and Igap signal values, respectively, and the concept of Vgap is the potential difference. When the transistor in the power supply is turned on the DC pulse will be Ton; conversely, when the transistor is open, the discharge cutoff is Toff , and Ton and Toff combine to form a fixed discharge pulse wave period. The time ratio of Ton to the wave period is called the duty cycle. In order to find a suitable PWM for preparing nanometer colloids with any metal or conductive electrode, the time setting and duty cycle of Ton and Toff are very important. The arc discharge process is as follows. At the beginning of the first cycle, when the Ton time begins, the Vgap rises, and the distance between the two electrodes is 30 μm, the electric field intensity will reach the maximum, the dielectric liquid insulation will gradually be destroyed, and the arc will form after the electrons are generated. Next is ionization, in which the dielectric fluid is completely destroyed and forms a low-resistance channel. When Igap rises, Vgapdrops, electrons flow rapidly to the upper electrode (anode), and cations are generated. Arc melting then occurs. Based on the successful stage of discharge, Igap maintains its maximum value. Under the action of repeated ionization, positive and negative ions hit the metal surface and kinetic energy converts into heat energy to generate a discharge arc, which melts the two electrodes. The surfaces of the electrodes peel off metal particles and the Ton time ends. Regarding the discharge cutoff, when Toff time starts, Vgap and Igap drop, the electrode no longer supplies electrons, the ionization disappears, and the metal particles become suspended in the dielectric fluid. Finally, the discharge ends when the first cycle ends, the Toff time is over, there is no Vgap and Igap, the surface temperature of the electrode is lowered, and the withstand voltage of the dielectric fluid is restored, waiting for the electric discharge machining for the next cycle.

Arc discharge process: (a) discharge begins; (b) ionization; (c) melting; (d) discharge cut-off; (e) insulation restored
2.2 Electrode material and GO solution
The electrode material was made of a graphite blocks with 99% purity. Through lathe processing, whole graphite blocks were made into graphite rods, which could be used as electrodes. Because the discharge process used point discharge, the discharge end of the electrode required a small surface area (about 1 to 2 mm in diameter); however, as graphite is not ductile and its structure is brittle, graphite rods with diameters of 1 to 2 mm would be difficult to fabricate and easily broken. Therefore, the graphite block was made into graphite rods with a diameter of about 1 cm, and one end of the rod was sharpened to complete the small surface area required for the tip discharge, as shown in Figure 3. In addition, this study used a GO prepared by the Hummers method to dissolve GO in DW at a concentration of 1000 ppm, as shown in Figure 4. The solution of GO was diluted to different ratios for qualitative and quantitative analysis of the concentration.

Graphite rod electrode

GO solution
2.3 Experimental method
In this study, EDM was used to prepare graphene colloids, and the most suitable parameters for preparing graphene colloids were found through different Ton:Toff parameter settings. In this study, five different Ton:Toff parameters were used, whichwere 10:10, 30:30, 50:50, 70:70 and 90:90 μs, respectively. The environmental parameter settings are shown in Table 1. In addition to the five different Ton:Toff parameters, the current segment was set to the second segment, and at this time, the current value was about 6.4 A. There was no need to turn on the high-low voltage switching button, and the no-load voltage was 140 V. The dielectric fluid was 150 mL DWwith a discharge time of five minutes for preparation at normal pressure and temperature. After the five groups of different Ton:Toff graphene colloids were prepared, in order to compare the advantages and disadvantages of graphene colloids, UV-Vis and a Zetasizer were used for analysis and comparison, and the most suitable preparation parameters were obtained according to the results. Using UV-Vis spectrum (9423UVA1002E Helios Omega) for optical analysis of the ultraviolet section [18], the characteristic peak of graphene was around 260 nm, thus confirming that graphene was indeed formed in the colloids. In addition, the size ratios of concentration could be distinguished by the absorbance; the greater the value, the higher the concentration, thereby indicating a higher discharge success rate. Absorbance has no units, therefore the values were only applicable to the UV-Vis spectrum of the same models. The suspension stability of graphene sheets in the graphene colloids was confirmed using the
Environmental parameter settings
| Material | Graphite |
|---|---|
| Ton:Toff (μs) | 10:10, 30:30, 50:50, 70:70, |
| 90:90 | |
| Current segment (IP) | 2 |
| Voltage (V) | 140 |
| Dielectric fluid | DW |
| Capacity (mL) | 150 |
| Discharge time (min) | 5 |
| Temperature (∘) | 25 |
Zetasizer (NanoZS90, Malvern) electrophoretic measurement technique, and the suspension stability was determined according to the zeta potential. When the absolute value of the zeta potential was greater than −30 mV, the sample was considered to have high suspension stability [19]. After the detection of the graphene colloids prepared using five different Ton:Toff parameters, the data were compared to find the most suitable Ton:Toff parameters for the preparing graphene colloids, and Raman spectroscopy (Ramboss 500i, DONGWOO) and TEM (HRTEM, JEM2100F) were used for analysis. The Raman analysis detected the D, G and 2D-band of graphene and inferred the number of graphene layers and defect degree [20]. TEM analysis was used to observe the distribution and interlayer distance of the graphene sheets [21].
Because absorbance is proportional to concentration, the basic qualitative and quantitative analysis of the graphene concentration was conducted using the UV-Vis spectra. The standard solution uses a GO to estimate the concentration of graphene prepared by ESDM. Most UV-Vis spectra studies do not pay attention to the numerical value of absorbance and prefer optic analysis; however, for qualitative and quantitative analysis, this value is an effective and highly reliable reference, and the only condition is that the same model UV-Vis spectroscope must be used. For the standard solution, this study used a GO fabricated using the Hummers method and prepared five different concentrations, including 5, 10, 15, 20 and 25 ppm. After measuring the absorbance, the results could be integrated into a fitted curve (1). In addition, the graphene prepared by ESDM required five different discharge times, including five, 10, 15, 20 and 25 minutes. After preparation, the absorbance was also measured and the results could be also integrated into a fitted curve (2). The feasibility of this qualitative and quantitative analysis method was confirmed by cross-comparison of the two results and actual verification. The practical verification steps were as follows: (a) prepare a GO below 25 ppm and measure the absorbance; (b) substitute the absorbance into Eq. (1) and (2) to calculate the concentration of the GO and the discharge time required to prepare graphene colloids; (c) prepare graphene colloids based on the calculated discharge time and measure the absorbance; (d) substitute the measured absorbance into Eq. (1) to obtain the concentration of the graphene colloids; and (e) compare the concentration of the graphene colloids with that of the GO.
3 Results and discussion
3.1 UV-Vis and zeta potential detection of different Ton:Toff
In this study, EDM was used to prepare graphene colloids with five different Ton-Toff parameters, and the discharge time was five minutes. The numerical values of the absorbance and zeta potential are shown in Table 2 and the UV-Vis spectra are shown in Figure 5. The results indicated that the graphene colloids with five different preparation parameters had nearly the same conjugated structure and the characteristic peaks were all at 256 nm. Due to different preparation parameters, the graphene colloids also had different absorption values. The maximum absorption value could be obtained at 50:50 μs, which indicated that the discharge success rate was higher, and that this parameter could be suitable for preparing graphene colloids. The zeta potential values for the different preparation parameters are shown in Figure 6. The zeta potential at 10:10 μs was −43.8 mV, and the actual test results were as shown in Figure 7. It was also found that the zeta potential at 30:30 μs was −35.1mV, therefore it could be concluded that graphene colloids prepared at 10:10 and 30:30 μs could obtain high suspension stability. After comparing the UV-Vis spectra and zeta potential, it was known the absorbance of 50:50 μs was the largest while that of 10:10 μs was the smallest, and that the success discharge times of 50:50 μs was better than that of 10:10 μs. However, the obtainment of stable suspended and dispersed graphene colloids remained the most important purpose. As 10:10 μs had the highest zeta potential, it was the most suitable for preparing graphene colloids.

UV-Vis of different Ton:Toff
Absorbance and zeta potential of different Ton:Toff
| Ton:Toff (μs) | Absorbance | Zeta potential (mV) |
|---|---|---|
| 10:10 | 0.336 | −43.8 |
| 30:30 | 0.404 | −35.1 |
| 50:50 | 0.477 | −22.3 |
| 70:70 | 0.419 | −23.8 |
| 90:90 | 0.405 | −24.5 |

Zeta potential of different Ton:Toff

Zeta potential of 10:10 μs
3.2 Graphene colloid analysis (10:10 μs)
Based on the results of the above discussion, the optimum Ton:Toff parameter for preparing graphene colloids was 10:10 μs. Raman and TEM analysis were used to confirm the results and the quality of the finished products. The Raman detection results are shown in Figure 8. There were three distinct D, G, and 2D-band characteristic peaks, and some layers of graphene could be judged through the intensity of the characteristic peaks from G and 2D. The D-band was the disordered vibration peak of graphene at 1331 cm−1, which was used to represent the structural defects of graphene. The G-band was the main characteristic peak of graphene at 1579 cm−1, which was caused by the structural vibration of the sp2 carbon atom. The 2D-band was a second-order Raman peak of two-phonon resonance at 2700 cm−1, which was used to represent the interlayer stacking mode of carbon atoms in graphene. The TEM images are shown in Figure 9. From Figure 9(a) and (b), it could be clearly seen that the thickness of the graphene sheets was smaller in the shallower areas and larger in the darker areas. Figure 9(c) shows the existence of lattice lines, which represented the interlayer distance of the graphene sheets. The distance was 0.35 nm.
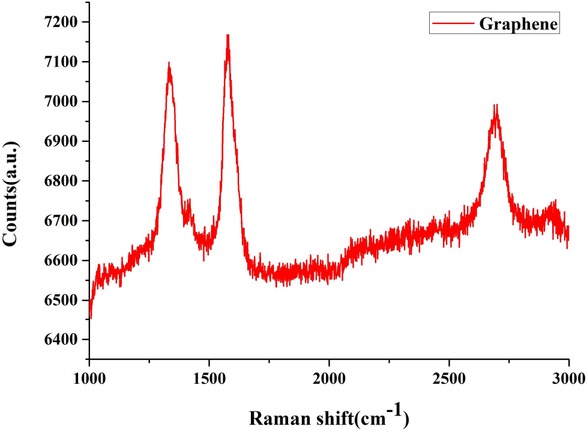
Raman of graphene

TEM images of the graphene scale bar: (a) 100; (b) 20; (c) 5 nm
3.3 Qualitative and quantitative concentration analysis of graphene colloids
The UV-Vis detection results for the five GO with different concentrations (5, 10, 15, 20 and 25 ppm), are shown in Figure 10(a), which indicates that the GO had an obvious characteristic peak at 232 nm. This represented a typical GO map, in which the higher the concentration, the greater the absorbance will be. The test results could be integrated into a fitted curve (1). Eq. (1) was y=137.82x4-292.67x3+196.14x2-23.343x+5.6519, as shown in Figure 10(b). According to Eq. (1), for an unknown concentration of a GO, the same model UV-Vis could be used to detect the absorbance and then enter the formula to calculate the concentration of the GO.

Different concentrations of GO (a) UV-Vis; (b) Eq. (1)
Next, the discharge time required for the graphene colloids prepared by EDM was calculated using the UV-Vis detection results of the GO. Figure 11(a) are the UV-Vis detection results for graphene colloids prepared at five different discharge times (5, 10, 15, 20 and 25 minutes), showing that the characteristic peak value of graphene was 260 nm, and that the longer the discharge time, the larger the absorbance would be. The detection results could be integrated into a fitted curve (2). Eq. (2) was y=-23.348x3+44.558x2+7.876x-1.5891, as shown in Figure 11(b). According to Eq. (2), the known absorbance of the GO could be substituted into Eq. (2) to calculate the discharge time required for preparing graphene by EDM. After discharge, graphene colloids with the same concentration as that of the GO could then be obtained.

Different discharge time of graphene (a) UV-Vis; (b) Eq. (2)
3.4 Graphene colloids concentration analysis and verification
When preparing the unknown concentration GO, its absorbance was detected to be 0.338, as shown in Figure 12 (a). Substituting 0.338 into Eq. (1) revealed that the concentration was 10 ppm. Substituting 0.338 into Eq. (2) revealed that if graphene colloids with the same concentration were to be prepared, the discharge time would take five minutes. After preparation of the graphene colloids was completed, the absorbance was detected to be 0.32, as shown in Figure 12(b). Substituting 0.32 into Eq. (1) revealed

10 ppm UV-Vis: (a)GO solution; (b)graphene colloids
the concentration of the graphene to be 10 ppm. The results showed that this method was indeed suitable for the qualitative and quantitative analysis of graphene colloid concentration. The only restriction was to use a specific UV-Vis spectroscope to obtain the approximate absorbance.
4 Conclusion
This study found the most suitable Ton:Toff parameters for preparing graphene colloids in EDM and used a GO as the standard solution. Basic qualitative and quantitative analysis of the concentration was carried out by UV-Vis, and no dispersants or strong oxidants were added during the process of study. The findings of this study represent the most environment friendly, fast and optimal method for preparing graphene colloids at present. The contributions of this study were as follows.
ESDM can be used to prepare nanometer colloids under normal temperature and pressure and can obtain graphene colloids with high suspension property without adding dispersants or chemicals, which indicates that the process will not be suspicious of environmental pollution and is harmless to the human body.
By comparing the UV-Vis with the zeta potential for graphene colloids prepared by ESDM, it was found that when Ton:Toff was 10:10 μs the zeta potential was -43.8 mV, which had the best suspension mechanism and was the most suitable for preparing graphene colloids.
The Raman spectra could obtain complete D, G and 2D-band characteristics, while the TEM analysis clearly showed the distribution of the graphene layers. The inter-layer distance of graphene was about 0.35 nm.
Different concentrations of GO were used as standard solutions, and qualitative and quantitative analysis of the concentration was carried out through absorbance in UV-Vis. Eq. (1) was used to calculate the concentration, and Eq. (2) was used to calculate the discharge time.
The experimental results showed that the absorbance of a GO with an unknown concentration was 0.338 (10 ppm) and the discharge time was five minutes. The absorbance of graphene colloids prepared after five minutes of ESDM discharge was 0.32 (10 ppm).
Through the conversion of Eq. (1) and (2), the concentration of nanometer colloids could be controlled in the environment using ESDM. The application of ESDM to nanometer colloid concentrations is an area of future study.
Acknowledgement
The authors would like to thank the Precision Research and Analysis Center, NTUT for technical supporting this research.
Conflict of Interest
Conflict of Interests: The author(s) declare no potential conflicts of interest with respect to the research, authorship, and/or publication of this article.
References
[1] Geim A.K., Graphene: status and prospects, Science, 2009, 324, 1530-1534.10.1126/science.1158877Suche in Google Scholar PubMed
[2] Balandin A.A., Ghosh S., Bao W. et al., Superior thermal conductivity of single-layer grapheme, Nano Lett., 2008, 8, 902-907.10.1021/nl0731872Suche in Google Scholar PubMed
[3] Lee C., Wei X., Kysar J.W. et al., Measurement of the elastic properties and intrinsic strength of monolayer graphene, Science, 2008, 321, 385-388.10.1126/science.1157996Suche in Google Scholar PubMed
[4] Radic S., Geitner N.K., Podila R. et al., Competitive binding of natural amphiphiles with graphene derivatives, Sci. Rep., 2013, 3, 2273.10.1038/srep02273Suche in Google Scholar PubMed PubMed Central
[5] Kang H., Zuo K., Wang Z. et al., Using a green method to develop graphene oxide/elastomers nanocomposites with combination of high barrier and mechanical performance, Comp. Sci. Technol., 2014, 92, 1-8.10.1016/j.compscitech.2013.12.004Suche in Google Scholar
[6] Zhou Y., Bao Q., Tang L.A.L. et al., Hydrothermal dehydration for the “green” reduction of exfoliated graphene oxide to graphene and demonstration of tunable optical limiting properties, Chem. Mater., 2009, 21, 2950-2956.10.1021/cm9006603Suche in Google Scholar
[7] Li Z. Y., Akhtar M. S., Kuk J. H. et al., Graphene application as a counter electrode material for dye-sensitized solar cell, Mater. Lett., 2012, 86, 96-99.10.1016/j.matlet.2012.07.006Suche in Google Scholar
[8] Abellán G., Coronado E., Martí Gastaldo C., et al. Magnetic nanocomposites formed by FeNi3 nanoparticles embedded in grapheme, Application as supercapacitors, Particle & Particle Syst. Charact., 2013, 30, 853-863.10.1002/ppsc.201300186Suche in Google Scholar
[9] Zhang X.Y., Li H.P., Cui X.L. et al. Graphene/TiO 2 nanocomposites: synthesis, characterization and application in hydrogen evolution from water photocatalytic splitting, J. Mater. Chem., 2010, 20, 2801-2806.10.1039/b917240hSuche in Google Scholar
[10] Pang S., Hernandez Y., Feng X., et al. Graphene as transparent electrode material for organic electronics, Adv. Mater., 2011, 23, 2779-2795.10.1002/adma.201100304Suche in Google Scholar PubMed
[11] Wang X., You H., Liu F., et al. Large-scale synthesis of few-layered graphene using CVD, Chem. Vap. Depos., 2009, 15, 53-56.10.1002/cvde.200806737Suche in Google Scholar
[12] Stankovich S., Dikin D.A., Piner R.D. et al., Synthesis of graphene-based nanosheets via chemical reduction of exfoliated graphite oxide, Carbon, 2007, 45, 1558-1565.10.1016/j.carbon.2007.02.034Suche in Google Scholar
[13] Stankovich S., Dikin D.A., Dommett G.H., et al., Graphene-based composite materials, Science, Nature, 2006, 442, 282.10.1038/nature04969Suche in Google Scholar PubMed
[14] Berger C., Song Z., Li X. et al., Electronic confinement and coherence in patterned epitaxial graphene, Science, 2006, 312, 1191-1196.10.1126/science.1125925Suche in Google Scholar PubMed
[15] Çiplak Z., Yildiz N., Çalimli A., Investigation of graphene/Ag nanocomposites synthesis parameters for two different synthesis methods, Fuller., Nanotub. Carbon Nanostr., 2015, 23, 361-370.10.1080/1536383X.2014.894025Suche in Google Scholar
[16] Tseng K.H., Chou C.J., Shih S.H. et al., Submerged arc discharge for producing nanoscale graphene in deionised water, IET Micro & Nano Lett., 2018, 13, 31-34.10.1049/mnl.2017.0387Suche in Google Scholar
[17] Jeswani M.L., Effect of the addition of graphite powder to kerosene used as the dielectric fluid in electrical discharge machining, Wear, 1981, 70, 133-139.10.1016/0043-1648(81)90148-4Suche in Google Scholar
[18] Johra F.T., Lee J.W., Jung W.G., Facile and safe graphene preparation on solution based platform, J. Industr. Eng. Chem., 2014, 20, 2883-2887.10.1016/j.jiec.2013.11.022Suche in Google Scholar
[19] Tseng K.H., Chung M.Y., Chiu J.L., Suspension stability of nano-Au and nano-Ag colloids prepared by electrical spark discharge method, J. Clust. Sci., 2017, 28, 2653-2668.10.1007/s10876-017-1249-2Suche in Google Scholar
[20] Malard L.M., Pimenta M.A.A., Dresselhaus G., Raman spectroscopy in graphene, Phys. Rep., 2009, 473, 51-87.10.1016/j.physrep.2009.02.003Suche in Google Scholar
[21] Yang Z., Bhowmick S., Sen F.G., et al., Roles of sliding-induced defects and dissociated water molecules on low friction of graphene, Sci. Rep., 2018, 8, 121.10.1038/s41598-017-17971-1Suche in Google Scholar PubMed PubMed Central
© 2019 K.-H. Tseng et al., published by De Gruyter
This work is licensed under the Creative Commons Attribution 4.0 Public License.
Artikel in diesem Heft
- Research Articles
- Investigation of rare earth upconversion fluorescent nanoparticles in biomedical field
- Carbon Nanotubes Coated Paper as Current Collectors for Secondary Li-ion Batteries
- Insight into the working wavelength of hotspot effects generated by popular nanostructures
- Novel Lead-free biocompatible piezoelectric Hydroxyapatite (HA) – BCZT (Ba0.85Ca0.15Zr0.1Ti0.9O3) nanocrystal composites for bone regeneration
- Effect of defects on the motion of carbon nanotube thermal actuator
- Dynamic mechanical behavior of nano-ZnO reinforced dental composite
- Fabrication of Ag Np-coated wetlace nonwoven fabric based on amino-terminated hyperbranched polymer
- Fractal analysis of pore structures in graphene oxide-carbon nanotube based cementitious pastes under different ultrasonication
- Effect of PVA fiber on durability of cementitious composite containing nano-SiO2
- Cr effects on the electrical contact properties of the Al2O3-Cu/15W composites
- Experimental evaluation of self-expandable metallic tracheobronchial stents
- Experimental study on the existence of nano-scale pores and the evolution of organic matter in organic-rich shale
- Mechanical characterizations of braided composite stents made of helical polyethylene terephthalate strips and NiTi wires
- Mechanical properties of boron nitride sheet with randomly distributed vacancy defects
- Fabrication, mechanical properties and failure mechanism of random and aligned nanofiber membrane with different parameters
- Micro- structure and rheological properties of graphene oxide rubber asphalt
- First-principles calculations of mechanical and thermodynamic properties of tungsten-based alloy
- Adsorption performance of hydrophobic/hydrophilic silica aerogel for low concentration organic pollutant in aqueous solution
- Preparation of spherical aminopropyl-functionalized MCM-41 and its application in removal of Pb(II) ion from aqueous solution
- Electrical conductivity anisotropy of copper matrix composites reinforced with SiC whiskers
- Miniature on-fiber extrinsic Fabry-Perot interferometric vibration sensors based on micro-cantilever beam
- Electric-field assisted growth and mechanical bactericidal performance of ZnO nanoarrays with gradient morphologies
- Flexural behavior and mechanical model of aluminum alloy mortise-and-tenon T-joints for electric vehicle
- Synthesis of nano zirconium oxide and its application in dentistry
- Surface modification of nano-sized carbon black for reinforcement of rubber
- Temperature-dependent negative Poisson’s ratio of monolayer graphene: Prediction from molecular dynamics simulations
- Finite element nonlinear transient modelling of carbon nanotubes reinforced fiber/polymer composite spherical shells with a cutout
- Preparation of low-permittivity K2O–B2O3–SiO2–Al2O3 composites without the addition of glass
- Large amplitude vibration of doubly curved FG-GRC laminated panels in thermal environments
- Enhanced flexural properties of aramid fiber/epoxy composites by graphene oxide
- Correlation between electrochemical performance degradation and catalyst structural parameters on polymer electrolyte membrane fuel cell
- Materials characterization of advanced fillers for composites engineering applications
- Humic acid assisted stabilization of dispersed single-walled carbon nanotubes in cementitious composites
- Test on axial compression performance of nano-silica concrete-filled angle steel reinforced GFRP tubular column
- Multi-scale modeling of the lamellar unit of arterial media
- The multiscale enhancement of mechanical properties of 3D MWK composites via poly(oxypropylene) diamines and GO nanoparticles
- Mechanical properties of circular nano-silica concrete filled stainless steel tube stub columns after being exposed to freezing and thawing
- Arc erosion behavior of TiB2/Cu composites with single-scale and dual-scale TiB2 particles
- Yb3+-containing chitosan hydrogels induce B-16 melanoma cell anoikis via a Fak-dependent pathway
- Template-free synthesis of Se-nanorods-rGO nanocomposite for application in supercapacitors
- Effect of graphene oxide on chloride penetration resistance of recycled concrete
- Bending resistance of PVA fiber reinforced cementitious composites containing nano-SiO2
- Review Articles
- Recent development of Supercapacitor Electrode Based on Carbon Materials
- Mechanical contribution of vascular smooth muscle cells in the tunica media of artery
- Applications of polymer-based nanoparticles in vaccine field
- Toxicity of metallic nanoparticles in the central nervous system
- Parameter control and concentration analysis of graphene colloids prepared by electric spark discharge method
- A critique on multi-jet electrospinning: State of the art and future outlook
- Electrospun cellulose acetate nanofibers and Au@AgNPs for antimicrobial activity - A mini review
- Recent progress in supercapacitors based on the advanced carbon electrodes
- Recent progress in shape memory polymer composites: methods, properties, applications and prospects
- In situ capabilities of Small Angle X-ray Scattering
- Review of nano-phase effects in high strength and conductivity copper alloys
- Progress and challenges in p-type oxide-based thin film transistors
- Advanced materials for flexible solar cell applications
- Phenylboronic acid-decorated polymeric nanomaterials for advanced bio-application
- The effect of nano-SiO2 on concrete properties: a review
- A brief review for fluorinated carbon: synthesis, properties and applications
- A review on the mechanical properties for thin film and block structure characterised by using nanoscratch test
- Cotton fibres functionalized with plasmonic nanoparticles to promote the destruction of harmful molecules: an overview