Abstract
A proper excitation wavelength is much important for the application of surface-enhanced Raman spectroscopy (SERS) in the biochemical field. Here, based on a SERS substrate model with an incident Gaussian beam, we investigate the dependence of the electric field enhancement on the incident wavelength of the excitation laser for popular nanostructures, including nanosphere dimer, nanorod dimer, and nanorod arrays. The results in the present manuscript indicate that both the nanosphere and nanorod dimer present a much broader plasmonic excitation wavelength range extending to the near-infrared region. The enhancement effect of Nanorod arrays is strongly dependent on the incident direction of excitation light. Finally, according to the conclusions above, a SERS substrate consisting of nanocubes based on the SPP eigen-mode is proposed and the electric field enhancement is homogeneous, and insensitive to the polarization of the incident laser. The enhancement factor is not ultrahigh; however, good homogeneousness permits for quantitative detection of lower concentration components in mixtures.
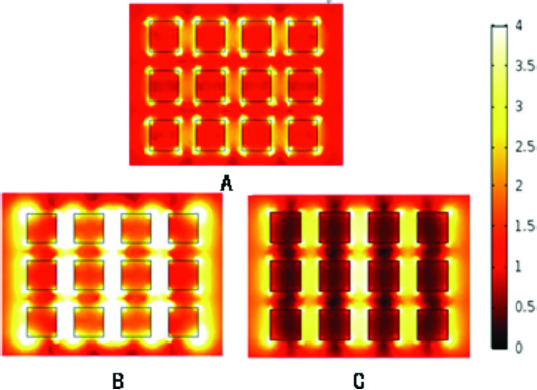
Graphical abstract: By investigating the dependence of the electric field enhancement on the incident wavelength of the excitation laser for popular nanostructures, we propose a SERS substrate consisting of Au nanocubes based on the SPP eigenmode. The electric field enhancement is homogeneous, and insensitive to the polarization of the incident laser. Though the enhancement factor is not ultrahigh, good homogeneousness permits for quantitative detection of lower concentration components in mixtures.
1 Introduction
Surface-enhanced Raman scattering (SERS) is a technique that enhances Raman signal as much as 1010~1011 by adsorbing molecules of interest on specific noble metal nanostructures. Therefore, various SERS substrates have been developed for the biochemical detection and imaging in recent years. Nanoparticles such as nanospheres [1], nanorods [2], and nanoshells [3] are the most popular nanostructures used as SERS substrates. Nanoparticle dimers are also proposed for SERS application because they have a much greater enhancement factor than single nanoparticles [4, 5, 6] (greater than 1010). SERS phenomenon could be explained by plasmon resonance [7] (electromagnetic enhancement mechanism) or charge transfer resonance (chemical enhancement mechanism) [8, 9]. We give priority to the electromagnetic mechanism for designing specific metal nanostructure. The electromagnetic mechanism can also provide us quantitative explanations for unexpected SERS spectral changes. As we know, surface plasmon polaritons are excited when the incident laser wavelength overlaps with the extinction spectrum of nanostructures. Hence, the electric field around the nano-particle is enhanced significantly and the radiation intensity that passes through the nanostructure suspension solution decreases. Therefore, optical properties of nanoparticles were inspected by analyzing UV–vis spectra at all times [10]. However, what is the electric field like when the laser beam is focused on these nanostructures, and how are the electric field distribution and enhancement related to the excitation wavelength? Recent studies show that the effect of SERS on nanorod arrays are strongly dependent on the polarization and angle of the incident laser [11]. However, the connection between the excitation wavelength and the structure size has not been systematically explored for optimization of SERS detection sensitivity. In some conditions, the selection of the excitation laser wavelength is still bewildering, especially for chemists and biologists.
Most commercial lasers possess linear polarization, the electric field of the optical wave possessing a variable magnitude but a constant direction along a straight line perpendicular to the direction of the wave. Here, we build an active electronicmagnetic model with the incidence of linear polarization Gaussian optical beam and study the relationship between the working wavelength and the enhancement factor of popular hotspot structures, including nanosphere dimer, nanorod dimers, and nanorod arrays distributed on a plane. In the last section of this paper, we propose a novel uniform SERS substrate, which is easy to fabricate. We evaluate the detection limit, homogeneity and stability of the enhancement along with its insensitivity to polarization (Figure S1 and Figure S2 in supplementary materials).
2 Results and Discussions
2.1 Nanosphere Dimer
Nanosphere dimer is experimentally verified to have strong near-field enhancement, and it has been applied to SERS detection [12, 13] and imaging [14, 15, 16]. Chemists and biologists have found it useful for various applications in the biochemical field. At the same time, it is also a basic unit of the nano cluster system. Therefore, it would be of great significance to explore the characteristics of Nanosphere dimer upon the excitation laser with varying wavelengths, polarization, and incident direction. In 2009, Xia prepared dimers of silver nanospheres and explored experimentally the influence of the laser polarization on SERS effects and observed a wider working wavelength compared with single silver sphere [12]. In 2011, Blaber applied gold nanosphere dimers for SERS in the infrared region [17]. Here, to fully examine the wavelength dependence characteristics, we calculated the electric field distribution of an Au nanosphere dimer with the radius 50nm and varying top-to-top distance D(3nm, 5nm, 10nm, 20nm) upon an incident linear polarization light (E = Ey (x, y) ey, as shown in Figure 1(A)). The surrounded medium is considered as a water solution with the refractive index n=1.4. The experimental permittivity values of Au [18], varying with the working wavelength, were used for our calculation. Different from the single nanosphere, the hotspot effect is witnessed while the Gaussian beam is incident on the nanosphere dimer. The electric field around two nanospheres is similar to that of a single nanosphere while D is relatively large. However, a coupling of plasmon resonance between two nanospheres occurs, and the hotspot effects progressively enhance with the shrinkage of the gap (shown in Figure 1(B)).
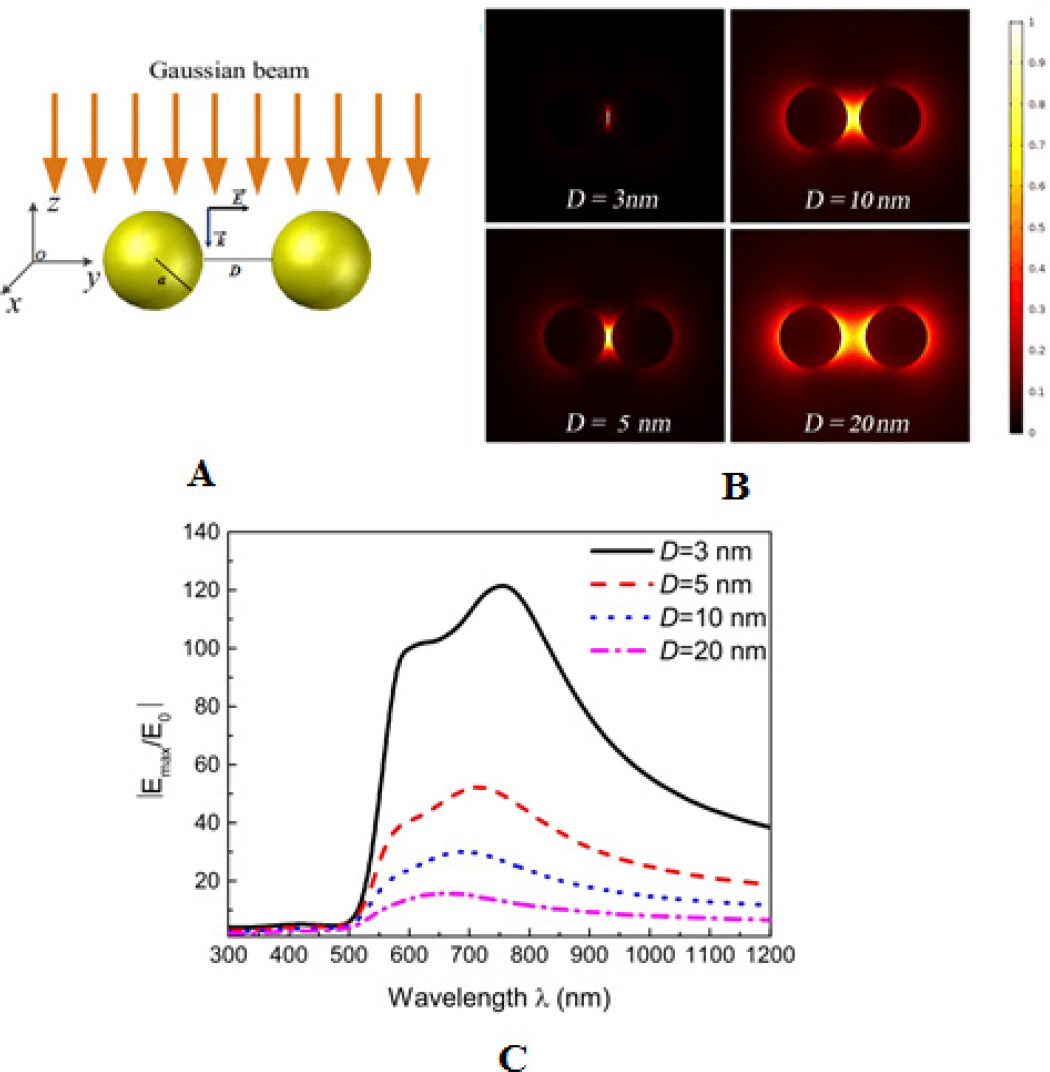
(A) Schematic diagram for the Gaussian beam incident on Au nanosphere dimer in the rectangular coordinate system; (B) The electric field distribution (|E| ) around Au nanosphere dimer excited by incident Gaussian beam at λ0 = 633nm; (C) The curve of |Emax/E0|with the working wavelength (|Emax| is the maximum electric field on the straight line connecting the centers of the spheres, |E0|=1V/m is the amplitude of the incident Gaussian beam)
The enhancement factor (EF) of SERS can be estimated by the following formula [19]
Where, |E0| = 1V/m is the modulus of incident field and Eloc is the local electric field distribution on SERS substrate. Here, we calculated
2.2 Nanorods Structures
Nanorods are still common nanostructures for constructing SERS tags because a single nanorod demonstrates a much broader surface plasmon resonance band than a single Nanosphere, extending to near-infrared wavelength [21]. Except for single nanorods, ordered Au nanorods arrays have also been developed as SERS substrates that produce a reproducible and strong SERS signal [22, 23]. Researchers further developed a geckoinspired
inspired SERS platform composed of poly dimethylsiloxane nanorod arrays covered by silver nanoparticles [24]. For all those SERS structures, the wavelength and polarization orientation of the excitation light is very important for plasmon-induced electric field enhancement [25, 26].
The excitation laser can be incident on nanorod arrays from the longitudinal direction (Figure 2(A)) or the side direction (Figure 2(B)). Nanorod arrays are composed of numerous nanorod dimers, so we first analyze the nanorod dimer. Here, to fully examine the wavelength dependence characteristics, we calculated the electric field distribution of an Au nanorod dimer with the radius a=50nm, height h=2a=100nm and varying top-to-top distance D (3nm, 5nm, 10nm, 20nm). The surrounded medium is considered as a water solution with the refractive index n=1.4. In both incident cases, we set the polarization of the incident light as y direction to keep it in line with the dimer mode electric field. If the incident light is polarized along
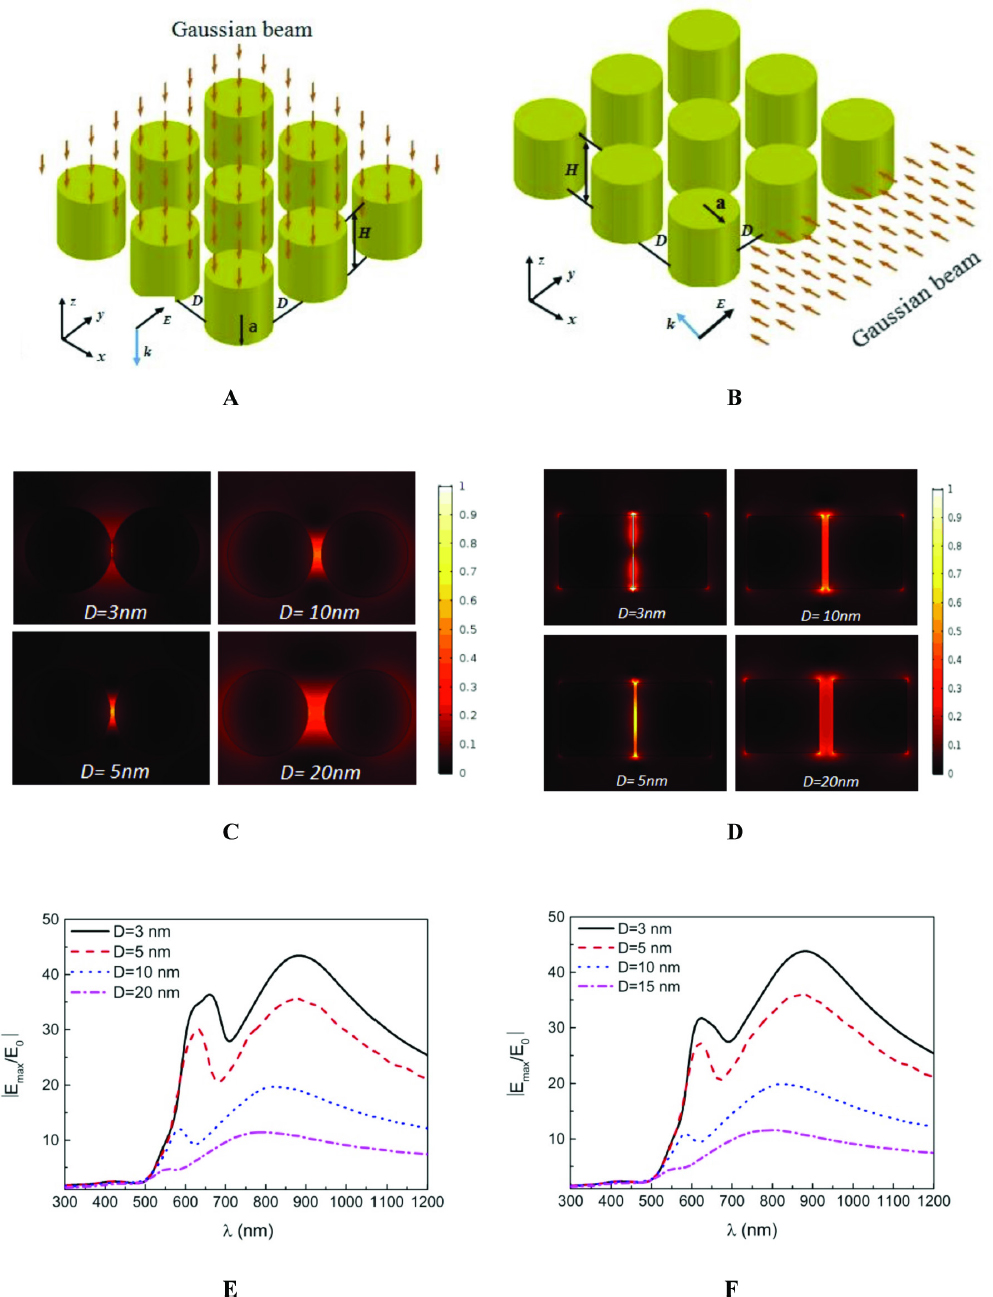
(A) Schematic diagram for the Gaussian beam incident on Au nanorod arrays from the longitudinal direction; (B) Schematic diagram for the Gaussian beam incident on Au nanorod arrays from the side direction; (C) Electric field distribution (|E|) around the Au nanorod dimer on the x-y section with the Gaussian beam longitudinal incident (λ0 = 633nm); (D) Electric field distribution (|E| ) around Au nanorod dimer on y-z section with the Gaussian beam side incident (λ0 = 633nm); (E) The curve of |Emax/E0| with the working wavelength for longitudinal incidence; (F) The curve of |Emax/E0 | with the working wavelength for side incidence; (|Emax| is the maximum electric field on the plane formed by the long axis of two nanorods, |E0| =1V/m is the amplitude of the incident Gaussian beam)
z or x direction, the hotspot will not be excited. The maximum electric field |Emax| on the plane formed by the long axis of two nanorods are calculated and the relative value
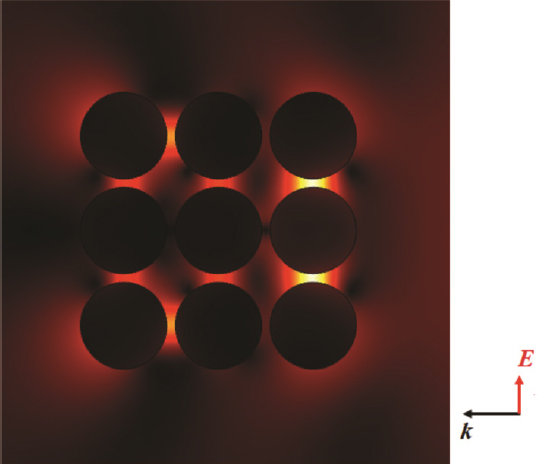
Electric field distribution (|E| ) of Au nanorod arrays with a side incident Gaussian beam
2.3 Our Designed Structure and Application
The nanogap SPPs waveguide presents strong mode confinement and relative long propagation distance and the SPPs mode can be excited while the incident field owns the same direction with the electric field of eigenmode. Here, we propose a SERS substrate based on the concept of SPPs waveguide eigenmode. The substrate is composed of Au nanocube arrays and could be fabricated by electron beam lithography. It shows strong and homogenous electric field enhancement while the linear polarization light is vertically incident on it. The schematic diagram for the Gaussian beam incident on this structure is given in Figure 4(A). Upon the working wavelength ranging from 300nm to 800nm, the electric field enhancement factor
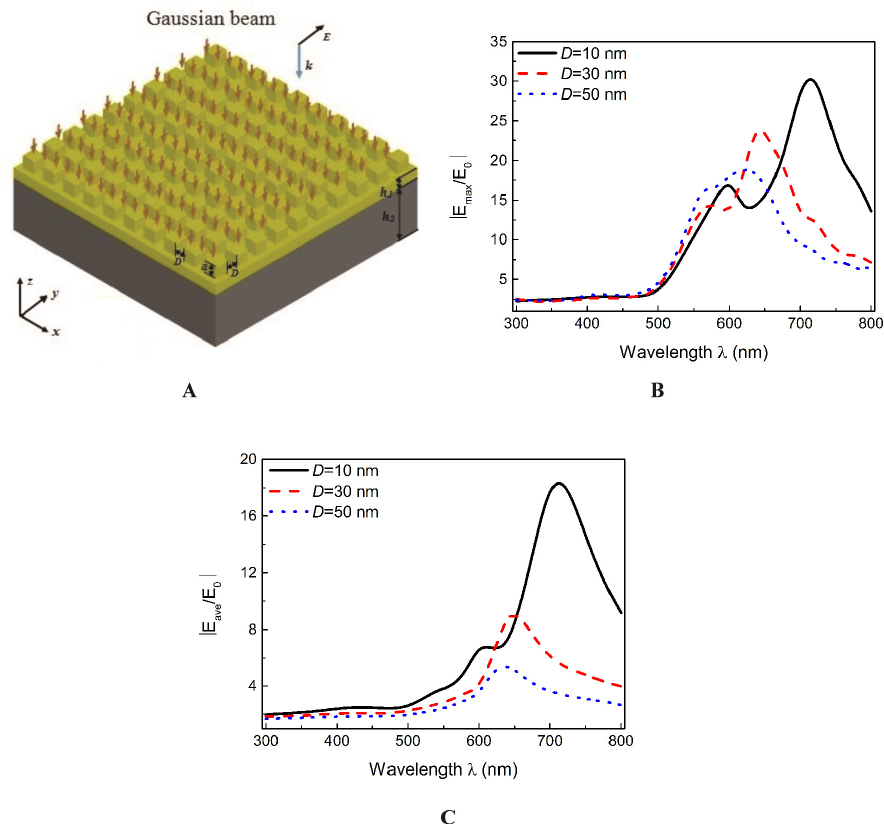
(A) Schematic diagram for the Gaussian beam incident on Au nanocube arrays; (B) The curve of |Emax/E0 | with the working wavelength; (C) The curve of |Eave/E0 | with the working wavelength (|Emax| is the maximum electric field in the space area; |E0|=1V/m is the amplitude of the incident Gaussian beam; |Eave| is obtained by averaging |E| in the whole space area)
In a broad range of visible light and the near-infrared region, our substrate shows good enhancement. Importantly, the hotspot presents a large area, accounting for half of the total substrate area, which leads to a much better average electric enhancement factor (Figure 4(C)).
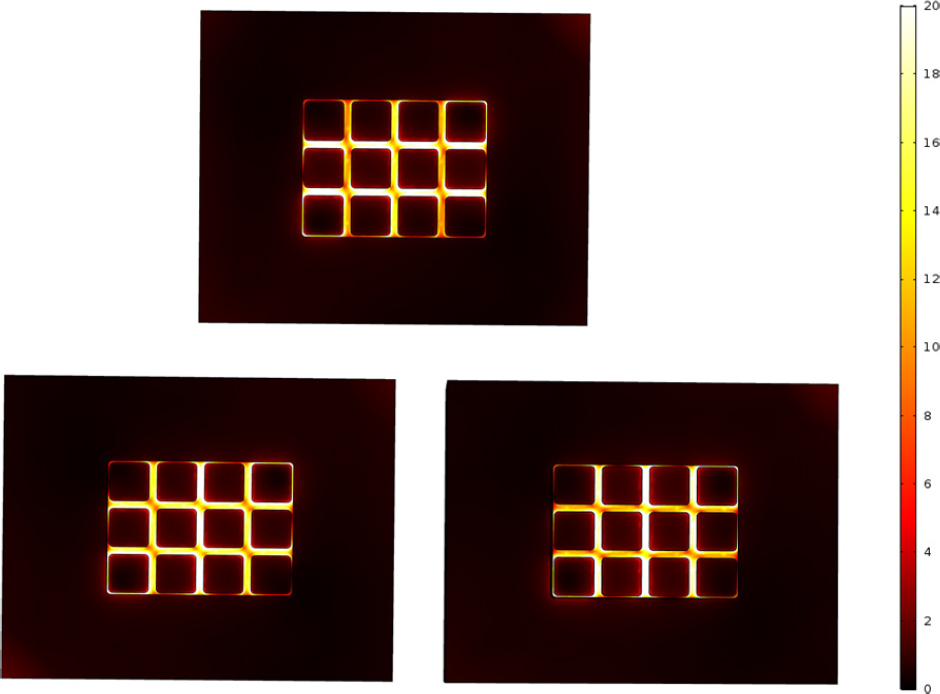
We also calculated the electric field distribution on the x-y section of our designed structure (a=50nm and D=30nm) at three excitation wavelengths 532nm, 633nm and 785nm, as shown in Figure 5. The water solution with the refractive index n=1.4 is considered as the surrounded material. The hotspot effects of this structure are strongly dependent on the excitation wavelength, and the electric field in the gap of nanocube reaches the maximum at 633nm, which is consistent with the wavelength dependence curve (red dash line) in Figure 4(B). To inspect the performance of this substrate, we fabricated this structure by electron beam lithography and detect crystal violet with low concentration on the spontaneous Raman system with 532nm laser excitation. The results indicate that the fluorescent background from crystal violet is significantly quenched by this substrate; the Raman signal with excellent SNR is acquired and the detection limit is as low as 10−7 M (Figure 6(C)). Furthermore, we mapped a 10um×10um area to acquire the Raman spectra from distributed points on our substrates, the intensity shows few changes and a few spots are caused by slight variation of SERS signal (Figure 6(C)). Due to the limitation of our equipment, we didn’t perform our experiments on more excitation wavelengths though we believe that the higher detection limit could be achieved at 633nm excitation. It is commonly used for Raman signal excitation in the biological detection field. In the future work, we will develop 633nm Raman system and apply our substrates for specific detection in biological field such as cell and tissue. Particularly worth mentioning is that, the molecular adsorption on plasmonic nanostructures and the interaction between adsorbed molecules and enhanced electric-field play a great role for the SERS signal of specific components.
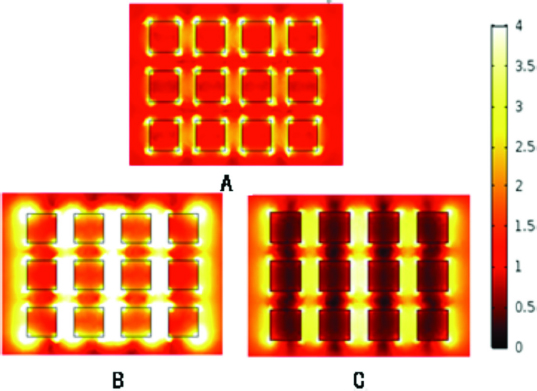
Electric field distribution on the x-y section with D=30nm at: (A) λ0 = 532nm; (B) λ0 = 633nm; (C) λ0 = 785nm
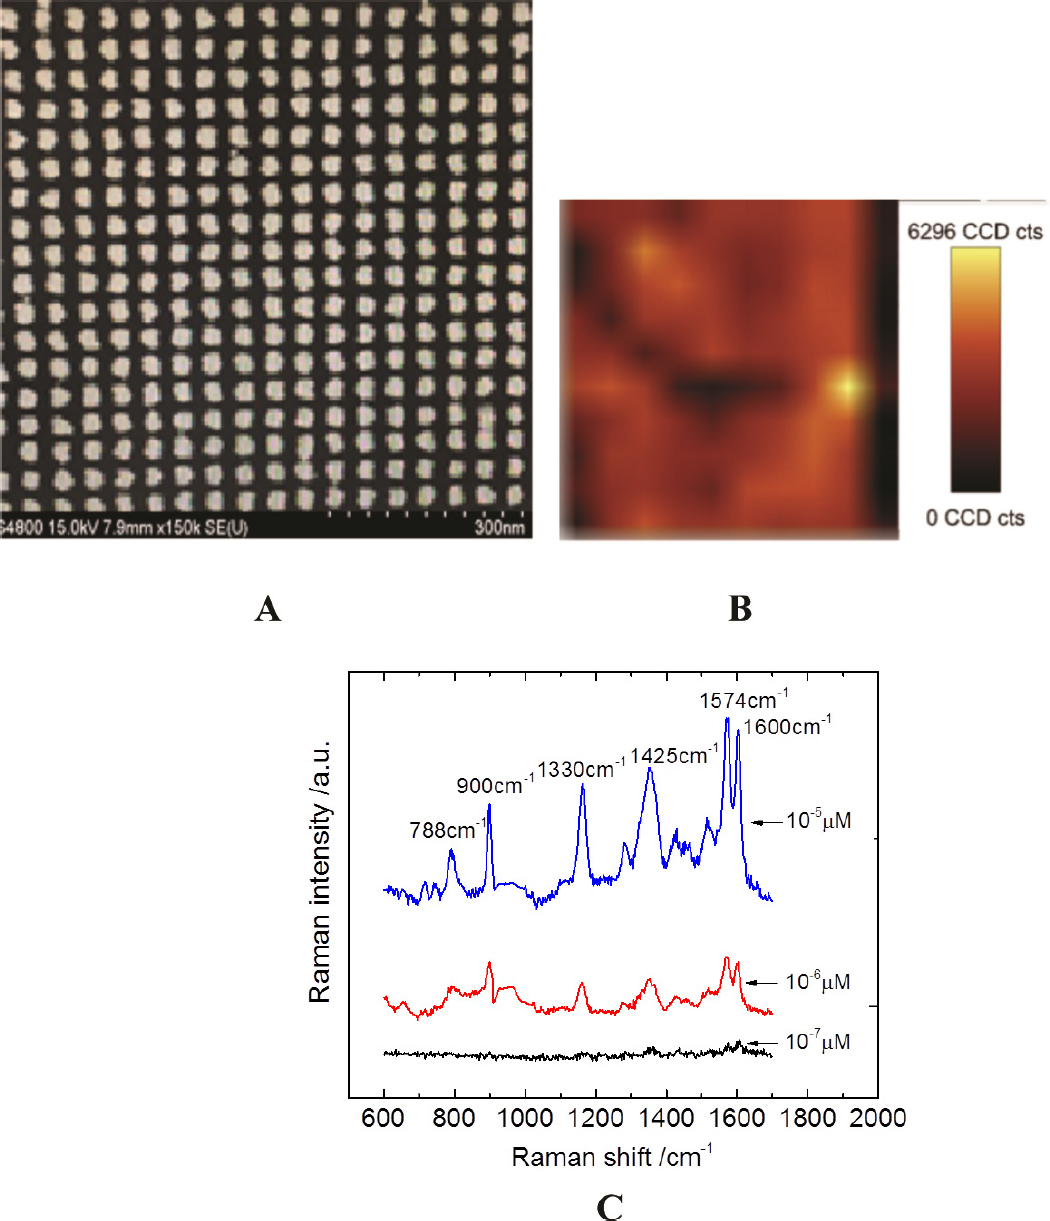
(A) Top-view SEM image of our nanocube arrays substrate; (B) mapping of SERS signals (1330cm−1) at a 10um×10um substrate area with 10μM Crystal Violet concentration; (C) SERS signals of crystal violet enhanced by our SERS substrate with concentrations 10−5 , 10−6 and 10−7 M (Laser wavelength: 532nm, Power: 3mW, Accumulation time: 1s)
2.4 Experimental Section
Sample preparation
PMMA was spanned at 3000 rpm on the SiO2/Si wafer using 5% 950 K PMMA solution in MIBK. The PMMA-coated wafer is annealed at 175 ∘C for 90 min. The e-beam vector-scan system with a 30nmbeam size is used for fabrication. After exposure, the pattern is developed in a 1:3 mixture of MIBK and isopropanol at 21.2 ∘C. The Au cube arrays are
produced by e-beam evaporation of 5nm Ti and 45 nm Au using the developed patterns as a template. Our SERS substrate is obtained after the lift-off process in hot acetone ~90 ∘C. Crystal Violet (Amresco0528) was purchased from Amresco. The substrate is cleaned out before usage. 1μL water solutions of Crystal Violet with 10−5μM, 10−6μM and 10−7μM concentrations are allowed to stand for 2hs to ensure a thin layer coverage on the nanostructure.
Raman spectra measurement
Raman spectroscopy was performed using Alpha 300R confocal Raman microscope system (WITec, Germany) equipped with 532 nm (Verdi V-6) as laser sources for excitation, and ACTON 300i spectrometer with Pixis Spec 10100 CCD camera (Princeton Instruments, Trenton, NJ). The laser beam was focused into the sample by a Zeiss LD EC Epiplan-Neofluar 50x objective lens with NA 0.55 (Nikon, Japan).
Numerical calculation
The characteristics and the electromagnetic field distributions of all nanostructures were calculated based on 3D FEM methods (COMSOL Multiphysics) with perfect matching boundary condition. In calculations, a linearly polarized Gaussian beam was used to illuminate the nanostructures and non-uniform meshes were employed to save computation time (the maximum mesh λ0/8 and the minimum mesh 2nm is used for validity of our calculation). The dielectric function of gold was taken from a fitting model offered by COMSOL software. We considered the surrounded medium as the water solution with the refraction index n=1.4 for all nanostructures.
3 Conclusion
The present paper established an active model of SERS substrate and investigated the dependence of electric field enhancement on the excitation wave length for several typical hotspot nanostructures based on this active model. The results are of great value for designing novel SERS substrate and selection of the excitation wavelength in SERS experiments. Furthermore, we proposed a nanotube array of SERS substrate with high SERS activity, stability, and reproducibility. This substrate is manufactured by electron beam lithography, its shape and spatial arrangement being finely controlled. The enhancement factor of our substrate is not as high as that of NS dimer with a small gap, but the SERS signal can be obtained over the whole sample surface, rather than at discrete points. In addition, we believe that further optimization of the electron beam lithography process will increase the electric field enhancement factor. In addition, this substrate has exhibited long-standing stability and can be used repeatedly after ultrasonic cleaning; hence, this substrate is more applicative for liquid bulk detection in the biological and chemical fields.
Acknowledgement
This work was supported by the National Natural Science Foundation of China (NSFC) (Grant Nos. 61405083), the Fundamental Research Funds for the Central Universities (lzujbky-2018-129), and the Natural Science Foundation of Gansu Province of China (Grant Nos. 17JR5RA197).
Supplementary information
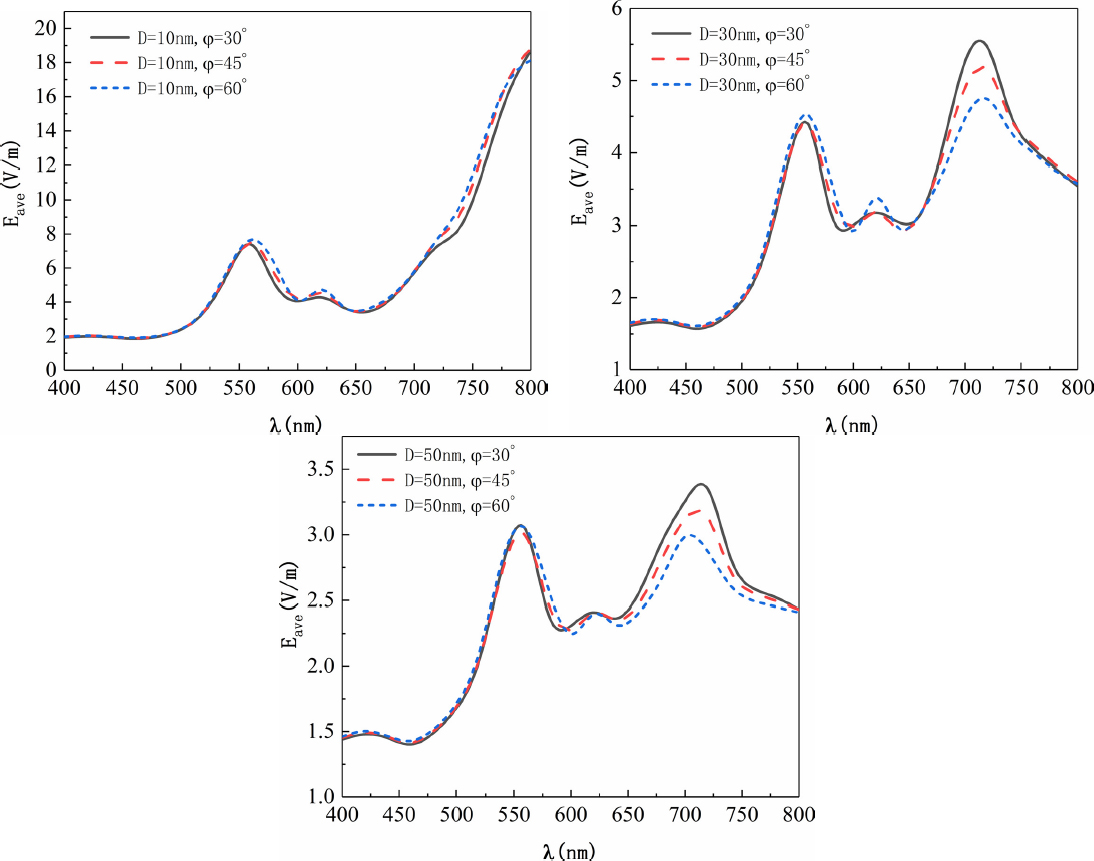
Curve of average electric field enhancement with the working wavelength (E0 is the amplitude of the incident Gaussian beam; |Eave| is obtained by averaging |E| in the whole space area)
Electric field distribution on the x-y section with D=30nm and various polarization:
References
[1] Sprague-Klein, E.A., M.O. McAnally, D.V. Zhdanov, A.B. Zrimsek, V.A. Apkarian, T. Seideman, G.C. Schatz, and R.P. Van Duyne, Observation of Single Molecule Plasmon-Driven Electron Transfer in Isotopically Edited 4,4’-Bipyridine Gold Nanosphere Oligomers. J Am Chem Soc,2017. 139(42): 15212-15221.10.1021/jacs.7b08868Suche in Google Scholar PubMed
[2] Zhan, P., P.K. Dutta, P. Wang, G. Song, M. Dai, S.X. Zhao, Z.G. Wang, P. Yin, W. Zhang, B. Ding, and Y. Ke, Reconfigurable Three-Dimensional Gold Nanorod Plasmonic Nanostructures Organized on DNA Origami Tripod. ACS Nano,2017. 11(2): 1172-1179.10.1021/acsnano.6b06861Suche in Google Scholar PubMed PubMed Central
[3] Sun, D., Y. Tian, Y. Zhang, Z. Xu, M.Y. Sfeir, M. Cotlet, and O. Gang, Light-Harvesting Nanoparticle Core-Shell Clusters with Controllable Optical Output. ACS Nano,2015. 9(6): 5657-5665.10.1021/nn507331zSuche in Google Scholar PubMed
[4] Tan, X.B., Z.Y. Wang, J. Yang, C.Y. Song, R.H. Zhang, and Y.P. Cui, Polyvinylpyrrolidone- (PVP-) coated silver aggregates for high performance surface-enhanced Raman scattering in living cells. Nanotechnology,2009. 20(44).10.1088/0957-4484/20/44/445102Suche in Google Scholar PubMed
[5] Huang, P.J., L.L. Tay, J. Tanha, S. Ryan, and L.K. Chau, Single-Domain Antibody-Conjugated Nanoaggregate-Embedded Beads for Targeted Detection of Pathogenic Bacteria. Chemistry-a European Journal,2009. 15(37): 9330-9334.10.1002/chem.200901397Suche in Google Scholar PubMed
[6] Huang, P.J., L.K. Chau, T.S. Yang, L.L. Tay, and T.T. Lin, Nanoaggregate-Embedded Beads as Novel Raman Labels for Biodetection. Advanced Functional Materials,2009. 19(2): 242-248.10.1002/adfm.200800961Suche in Google Scholar
[7] Itoh, T., Y.S. Yamamoto, and Y. Ozaki, Plasmon-enhanced spectroscopy of absorption and spontaneous emissions explained using cavity quantum optics. Chem Soc Rev,2017. 46(13): 3904-3921.10.1039/C7CS00155JSuche in Google Scholar PubMed
[8] Yamamoto, Y.S. and T. Itoh, Why and how do the shapes of surface-enhanced Raman scattering spectra change? Recent progress from mechanistic studies. Journal of Raman Spectroscopy,2016. 47(1): 78-88.10.1002/jrs.4874Suche in Google Scholar
[9] Yamamoto, Y.S., Y. Ozaki, and T. Itoh, Recent progress and frontiers in the electromagnetic mechanismof surface-enhanced Raman scattering. Journal of Photochemistry and Photobiology C: Photochemistry Reviews,2014. 21: 81-104.10.1016/j.jphotochemrev.2014.10.001Suche in Google Scholar
[10] Song, C., Z. Wang, R. Zhang, J. Yang, X. Tan, and Y. Cui, Highly sensitive immunoassay based on Raman reporter-labeled immuno-Au aggregates and SERS-active immune substrate. Biosens Bioelectron,2009. 25(4): 826-831.10.1016/j.bios.2009.08.035Suche in Google Scholar PubMed
[11] Subr, M., M. Petr, O. Kylian, J. Stepanek, M. Veis, and M. Prochazka, Anisotropic Optical Response of Silver Nanorod Arrays: Surface Enhanced Raman Scattering Polarization and Angular Dependences Confronted with Ellipsometric Parameters. Sci Rep,2017. 7(1): 4293.10.1038/s41598-017-04565-0Suche in Google Scholar PubMed PubMed Central
[12] Li, W., P.H. Camargo, X. Lu, and Y. Xia, Dimers of silver nanospheres: facile synthesis and their use as hot spots for surface-enhanced Raman scattering. Nano Lett,2009. 9(1): 485-490.10.1021/nl803621xSuche in Google Scholar PubMed PubMed Central
[13] Li, W., P.H. Camargo, L. Au, Q. Zhang, M. Rycenga, and Y. Xia, Etching and dimerization: a simple and versatile route to dimers of silver nanospheres with a range of sizes. Angew Chem Int Ed Engl,2010. 49(1): 164-168.10.1002/anie.200905245Suche in Google Scholar PubMed PubMed Central
[14] Lim, D.K., K.S. Jeon, H.M. Kim, J.M. Nam, and Y.D. Suh, Nanogap-engineerable Raman-active nanodumbbells for single-molecule detection. Nat Mater,2010. 9(1): 60-67.10.1038/nmat2596Suche in Google Scholar PubMed
[15] Cong, V.T., N.H. Ly, S.J. Son, J. Min, and S.W. Joo, Silica-encapsulated gold nanoparticle dimers for organelle-targeted cellular delivery. Chem Commun (Camb),2017. 53(36): 5009-5012.10.1039/C7CC01229BSuche in Google Scholar
[16] Lu, H., L. Zhu, C. Zhang, K. Chen, and Y. Cui, Mixing Assisted “Hot Spots” Occupying SERS Strategy for Highly Sensitive In Situ Study. Analytical Chemistry,2018.10.1021/acs.analchem.7b04929Suche in Google Scholar PubMed
[17] Blaber, M.G. and G.C. Schatz, Extending SERS into the infrared with gold nanosphere dimers. Chemical communications (Cambridge, England),2011. 47(13): 3769-3771.10.1039/c0cc05089jSuche in Google Scholar PubMed
[18] Johnson, P.B. and R.W. Christy, Optical Constants of the Noble Metals. Physical Review B,1972. 6(12): 4370-4379.10.1103/PhysRevB.6.4370Suche in Google Scholar
[19] Le Ru, E.C., P.G. Etchegoin, and ebrary Inc., Principles of surface-enhanced Raman spectroscopy and related plasmonic effects 2009, Elsevier: Amsterdam ; Boston. p. xxiii, 663 p.10.1016/B978-0-444-52779-0.00005-2Suche in Google Scholar
[20] Zuloaga, J. and P. Nordlander, On the Energy Shift between Near-Field and Far-Field Peak Intensities in Localized Plasmon Systems. Nano Lett,2011. 11(3): 1280-1283.10.1021/nl1043242Suche in Google Scholar PubMed
[21] Wang, Y., Y. Wang, W. Wang, K. Sun, and L. Chen, Reporter-Embedded SERS Tags from Gold Nanorod Seeds: Selective Immobilization of Reporter Molecules at the Tip of Nanorods. ACS Appl Mater Interfaces,2016.10.1021/acsami.6b04216Suche in Google Scholar PubMed
[22] Huang, Z., G. Meng, B. Chen, C. Zhu, F. Han, X. Hu, and X. Wang, Surface-Enhanced Raman Scattering from Au-Nanorod Arrays with Sub-5-nm Gaps Stuck Out of an AAO Template. J Nanosci Nanotechnol,2016. 16(1): 934-938.10.1166/jnn.2016.10809Suche in Google Scholar PubMed
[23] De, R., Y.S. Shin, C.L. Lee, and M.K. Oh, Long-Standing Stability of Silver Nanorod Array Substrates Functionalized Using a Series of Thiols for a SERS-Based Sensing Application. Appl Spectrosc,2016. 70(7): 1137-1149.10.1177/0003702816652327Suche in Google Scholar PubMed
[24] Wang, P., L. Wu, Z. Lu, Q. Li, W. Yin, F. Ding, and H. Han, Gecko-Inspired Nanotentacle Surface-Enhanced Raman Spectroscopy Substrate for Sampling and Reliable Detection of Pesticide Residues in Fruits and Vegetables. Anal Chem,2017. 89(4): 2424-2431.10.1021/acs.analchem.6b04324Suche in Google Scholar PubMed
[25] Ming, T., L. Zhao, Z. Yang, H. Chen, L. Sun, J. Wang, and C. Yan, Strong Polarization Dependence of Plasmon-Enhanced Fluorescence on Single Gold Nanorods. Nano Lett,2009. 9(11): 3896-3903.10.1021/nl902095qSuche in Google Scholar PubMed
[26] Zhang, M., C. Li, C. Wang, C. Zhang, Z. Wang, Q. Han, and H. Zheng, Polarization dependence of plasmon enhanced fluorescence on Au nanorod array. Appl Opt,2017. 56(3): 375-379.10.1364/AO.56.000375Suche in Google Scholar PubMed
© 2019 Z. Wang et al., published by De Gruyter
This work is licensed under the Creative Commons Attribution 4.0 Public License.
Artikel in diesem Heft
- Research Articles
- Investigation of rare earth upconversion fluorescent nanoparticles in biomedical field
- Carbon Nanotubes Coated Paper as Current Collectors for Secondary Li-ion Batteries
- Insight into the working wavelength of hotspot effects generated by popular nanostructures
- Novel Lead-free biocompatible piezoelectric Hydroxyapatite (HA) – BCZT (Ba0.85Ca0.15Zr0.1Ti0.9O3) nanocrystal composites for bone regeneration
- Effect of defects on the motion of carbon nanotube thermal actuator
- Dynamic mechanical behavior of nano-ZnO reinforced dental composite
- Fabrication of Ag Np-coated wetlace nonwoven fabric based on amino-terminated hyperbranched polymer
- Fractal analysis of pore structures in graphene oxide-carbon nanotube based cementitious pastes under different ultrasonication
- Effect of PVA fiber on durability of cementitious composite containing nano-SiO2
- Cr effects on the electrical contact properties of the Al2O3-Cu/15W composites
- Experimental evaluation of self-expandable metallic tracheobronchial stents
- Experimental study on the existence of nano-scale pores and the evolution of organic matter in organic-rich shale
- Mechanical characterizations of braided composite stents made of helical polyethylene terephthalate strips and NiTi wires
- Mechanical properties of boron nitride sheet with randomly distributed vacancy defects
- Fabrication, mechanical properties and failure mechanism of random and aligned nanofiber membrane with different parameters
- Micro- structure and rheological properties of graphene oxide rubber asphalt
- First-principles calculations of mechanical and thermodynamic properties of tungsten-based alloy
- Adsorption performance of hydrophobic/hydrophilic silica aerogel for low concentration organic pollutant in aqueous solution
- Preparation of spherical aminopropyl-functionalized MCM-41 and its application in removal of Pb(II) ion from aqueous solution
- Electrical conductivity anisotropy of copper matrix composites reinforced with SiC whiskers
- Miniature on-fiber extrinsic Fabry-Perot interferometric vibration sensors based on micro-cantilever beam
- Electric-field assisted growth and mechanical bactericidal performance of ZnO nanoarrays with gradient morphologies
- Flexural behavior and mechanical model of aluminum alloy mortise-and-tenon T-joints for electric vehicle
- Synthesis of nano zirconium oxide and its application in dentistry
- Surface modification of nano-sized carbon black for reinforcement of rubber
- Temperature-dependent negative Poisson’s ratio of monolayer graphene: Prediction from molecular dynamics simulations
- Finite element nonlinear transient modelling of carbon nanotubes reinforced fiber/polymer composite spherical shells with a cutout
- Preparation of low-permittivity K2O–B2O3–SiO2–Al2O3 composites without the addition of glass
- Large amplitude vibration of doubly curved FG-GRC laminated panels in thermal environments
- Enhanced flexural properties of aramid fiber/epoxy composites by graphene oxide
- Correlation between electrochemical performance degradation and catalyst structural parameters on polymer electrolyte membrane fuel cell
- Materials characterization of advanced fillers for composites engineering applications
- Humic acid assisted stabilization of dispersed single-walled carbon nanotubes in cementitious composites
- Test on axial compression performance of nano-silica concrete-filled angle steel reinforced GFRP tubular column
- Multi-scale modeling of the lamellar unit of arterial media
- The multiscale enhancement of mechanical properties of 3D MWK composites via poly(oxypropylene) diamines and GO nanoparticles
- Mechanical properties of circular nano-silica concrete filled stainless steel tube stub columns after being exposed to freezing and thawing
- Arc erosion behavior of TiB2/Cu composites with single-scale and dual-scale TiB2 particles
- Yb3+-containing chitosan hydrogels induce B-16 melanoma cell anoikis via a Fak-dependent pathway
- Template-free synthesis of Se-nanorods-rGO nanocomposite for application in supercapacitors
- Effect of graphene oxide on chloride penetration resistance of recycled concrete
- Bending resistance of PVA fiber reinforced cementitious composites containing nano-SiO2
- Review Articles
- Recent development of Supercapacitor Electrode Based on Carbon Materials
- Mechanical contribution of vascular smooth muscle cells in the tunica media of artery
- Applications of polymer-based nanoparticles in vaccine field
- Toxicity of metallic nanoparticles in the central nervous system
- Parameter control and concentration analysis of graphene colloids prepared by electric spark discharge method
- A critique on multi-jet electrospinning: State of the art and future outlook
- Electrospun cellulose acetate nanofibers and Au@AgNPs for antimicrobial activity - A mini review
- Recent progress in supercapacitors based on the advanced carbon electrodes
- Recent progress in shape memory polymer composites: methods, properties, applications and prospects
- In situ capabilities of Small Angle X-ray Scattering
- Review of nano-phase effects in high strength and conductivity copper alloys
- Progress and challenges in p-type oxide-based thin film transistors
- Advanced materials for flexible solar cell applications
- Phenylboronic acid-decorated polymeric nanomaterials for advanced bio-application
- The effect of nano-SiO2 on concrete properties: a review
- A brief review for fluorinated carbon: synthesis, properties and applications
- A review on the mechanical properties for thin film and block structure characterised by using nanoscratch test
- Cotton fibres functionalized with plasmonic nanoparticles to promote the destruction of harmful molecules: an overview

