Performance evaluation and optimization of fixture adapter for oil drilling top drives
-
Achille Louodom Chedjou


Abstract
A top drive is an essential mechanical device in oil field drilling since it provides the necessary torque for the drilling operations. Manufacturers in the oil and gas industry typically perform in-housing testing and classify the Safe Working Load of top drives. Testing a top drive requires a unique test stand, thus making testing top drives from other manufacturers a difficult challenge. A fixture adapter can be designed using geometric constraints and intuition to make testing apparatus semi-universal, yet they are often bulky and heavy, posing more significant safety concerns. This study aims to first numerically assess the existing fixture adapter and then structurally optimize it for enhancing its structural integrity and efficiency under various severe working environments. Therefore, finite element analysis (FEA) was performed on the existing fixture adapter, and compliance minimization topology optimization was employed. Four load and boundary conditions were used from the three most frequent operation scenarios for the fixture adapters: (i) drilling standby, (ii) staging area, (iii) drilling make-up, and (iv) break-up. The FEA results indicated that no safety factor was compromised with a 50% and 60% mass retention constraint via topology optimization compared to the original fixture adapter. The optimized fixture adapter was also tested under compression using printed 3D prototypes to validate the finite analysis and topology optimization processes.
1 Introduction
Oil and natural gas provide over half of the world’s energy [1]. According to the Manufacturing Energy Consumption Survey 2018, fuel use accounted for about 68% and nonfuel sources/feedstocks accounted for about 32% of the total energy use by US manufacturers in 2018 [2]. While there have been “renewable” and “sustainable” energy initiatives, they have primarily been prohibitively expensive, complex, or unreliable. The strategies of many countries are often woven around and influenced by available resources such as mineral deposits, oil, and natural gas [2]. Crude oil and natural gas are complex mixtures of hydrocarbons, non-hydrocarbons, and other trace elements. They are usually stored in the sedimentary rock of deep formations [3], sometimes even offshore, under deep waters. Oil well exploration encompasses techniques to search for hydrogen deposits, also known as geologic reservoirs, under the earth’s surface.
Oil well drilling involves cutting a circular cross-section hole into the earth to allow oil and natural gas extraction from reservoirs. The drilling for natural gas or oil wells is done following the exploration of the oil well. Today’s modern drilling rig uses top drives, which provide the torque necessary for drilling operations. The top drive can be described as a big electrical motor traveling vertically up and down in a drilling position and imparting essential torque to the drill pipe. There are several top drive manufacturers, and each manufacturer develops its own designs, which are generally classified based on their Safe Working Load as well as the type and size of the motor that provides the torque for drilling operations. For example, there are models of 175, 250, 275, 350, 500, 750, and 1,000-ton units.
Top drive manufacturers should conduct in-house testing to ensure the product meets the technical requirements per the Factory Acceptance Test and is in conformity with the American petroleum institute specs. A typical testing site is equipped with a hydraulic or electrical motor with a dynamometer to apply and measure the necessary torque during testing, which stays around 30,000 lb-ft. A duty top drive weighing up to 36,000 lb is mounted on a huge, heavy test stand. Beacuse of this high load nature of top drives, recent studies in the oil rig community have focused on patents for novel top drives [4,5], as well as the characterization [6] and modeling for performance evaluation of a specific type of top drives and its components [7].
Each manufacturer will equip the test site with an extensive test stand to perform the torque test on top drives. However, it is problematic for a manufacturer to service different configurations because there exists a design discrepancy in the mounting mechanism among top drives from different manufacturers. To perform the test on other arrangements, the manufacturer will thus have to build a big test stand for each type of configuration, which poses preventable space and financial issues. The proposed work demonstrates an attempt to design a fixture adapter that allows testing and servicing top drives from two drilling equipment manufacturers (e.g., Canrig and Tesco). The adapter should have the necessary structural stiffness to handle the stress from various configurations of top drives without excessive material usage, which can lead to potential weight-related issues. Topology optimization is used to achieve the structure that would give the minimum strain energy against the three most dominant configurations of testing apparatus (i.e., standing, staging, and operating).
Topology optimization is a newer branch of structural optimization techniques that is widely used in various industries and defense technologies. The primary benefit of topology optimization over traditional structural optimization methods, including size or shape optimization, is that it does not require a specific initial structure. Among many successful implementations, the weight of each wing was reduced by 500 kg by designing the wing box ribs using topology optimization [8]. Multimaterial structures were designed for maximum heat conductivity [9]. Topology optimization has shown its efficacy in optimizing automotive parts such as exhaust manifolds [10], knuckle joints [11], and other parts [12,13,14], to name a few. Structural optimization methods are now being applied to more complex problems, such as biomedical bone implant designs [15] and multiphysics problems [14,16,17] in larger design domains with advancements in parallel computation capabilities and efficient algorithms [18,19,20].
The initial design of the fixture adapter is proposed based on experience, intuition, and literature study, which can withstand up to 30,000 lb-ft of applied torque. The structural characteristic will be evaluated using various loadings; (i) standing: a planar component supports the upright position of the top drive during idling, (ii) staging: the fixture adapter supports the whole weight of the top drive when the assembly is not on the crane and is in the staging area, and (iii) operating: support the top drive from rotating during torque testing. The loading scenario with the highest risk of failure will be explored such that the final geometry attains a safety factor of at least 1.5. Then, the topology optimized models will be mechanically assessed in simple compression testing for proof of concept.
2 Materials and methods
The presented study starts with the proposition of an initial design obtained using SolidWorks and optimized via topology optimization with a parametric study (PS).
2.1 The initial design requirements
The fixture adapter that will accommodate the Tesco Top Drives on the Canrig test stand is designed in SolidWorks in this step. Because the system (top drive on the fixture adapter) is supposed to move vertically on the test stand via a guide runner, the design should possess mounting mechanisms to make its installation onto the test stand possible and guarantee its functionality (Figure 1a). The design should be able to receive and hold different models and configurations of top drives, especially Tesco EX300 and ES300 top drives with different mounting bases and Canrig top drive (Figure 1b and c). The adapter also needs to withstand the stresses resulting from a maximum torque of 30,000 lb-ft during torque tests.

Top drive test stand and various top drives that need to be accommodated: (a) Canrig test stand, (b) Tesco EX300, and (c) Canrig top drive.
To fulfill the geometric requirement for guide runners and to make the test site semi-universal, the fixture adapter in Figure 2 is proposed. It consists of four major planar supports made of 1-in thick ASTM A36 steel with a horizontal brace made of ASTM A500 high-strength steel. AISI 4140 and ASTM A106B pins were selected to secure the top drive onto the fixture.

(a) The initial design of the fixture adapter (yellow) is mounted on a guide runner (gray). (b) Fixture adapter with Tesco top drive is test fitted onto Canrig test stand.
2.2 Numerical modeling
The structural performance of the fixture adapter is assessed using finite element analysis (FEA) using boundary conditions and scenarios during the top drive torque test and test preparations. The goal is to ensure that the fixture adapter can sustain the loads and loading conditions that will be applied to it during torque testing.
2.2.1 System description, boundary conditions, and loads
Two significant loads are involved in this fixture adapter study: the weight of the top drive and the torque generated by the top drive during the make-up and break-up procedures. The numerical values of these parameters are provided in Table 1. It is assumed that stress values are the same regardless of the quill’s rotation direction (e.g., make-up vs break-up).
The boundary condition for the fixture adapter
| Load type | Value | Unit |
|---|---|---|
| The torque generated by the top drive | 30,000 | lb-ft |
| Top drive weight | 36,000 | lb |
There are four loading scenarios exist from three distinct scenarios, as described below and in Table 2.
Load cases and scenarios
| Load case | Scenario | Description |
|---|---|---|
| Load case 1 | Top drive in drilling standby position | The quill’s axis is vertical. The fixture adapter holds the top drive on the test stand. No torque is applied |
| Load case 2 | Top drive in the staging area | The top drive sits on the fixture adapter. The quill’s axis is horizontal |
| Load case 3 | Torque make-up | The crane holds top drive. The make-up torque test is in progress |
| Load case 4 | Torque break-up | The applied torque during make-up and break-up are similar, with the only difference being the rotation of the quill is in the opposite direction of each other |
Load scenarios
The planar component supports the upright position of the top drive during idling. The planar support will experience a minor bending moment due to the weight of the top drive.
The fixture adapter supports the whole weight of the top drive when the assembly is not on the crane and is in the staging area.
The fixture adapter prevents the top drive from rotating during torque testing. A primary torsion about the axis of the top drive will be applied to the fixture.
2.2.2 Forces generated in pipes and pins from make-up and break-up
The weight of the top drive will be applied straightforwardly during the study in Ansys. Yet, for the torque, due to the position of the quill or the dyno’s axis, which is far from the pipes and pins receiving the torque, it is crucial to calculate the forces resulting from the torque. The following diagrams and parameters in Figure 3 were used to compute the forces required to generate the maximum torque of 30,000 lb-ft. The resulting force values are tabulated in Table 3.

Load diagrams and parameters used to compute the equivalent loads for input torque. The 30,000 lb-ft of torque is translated into forces at the respective locations.
Equivalent loads on pin and pipe for input torque during make-up and break-up
| Pin | Pipe | |||
|---|---|---|---|---|
|
|
|
|
|
|
| lb | 1248.35 | 754.84 | 1090.56 | 968.93 |
2.2.3 Meshing
Due to their acute angles, tetrahedron elements were used to mesh the eight pins. Because high-wingspan geometry preparation is unnecessary, the multizone method with an element size of 0.75″ is used on the rest of the fixture adapter, resulting in the mesh shown in Figure 4.

Fixture adapter design meshing in Ansys.
2.3 FEA
2.3.1 Load case 1 – drilling standby position
2.3.1.1 Loads and boundary conditions
In load case 1, the weight of the top drive is transmitted to the adapter via four pins, with the possibility of adjusting in two different positions. Since there are four pins equally loaded, each pin will support a load of 36,000/4 = 9,000 lb. Because of the possibility of adjusting in two positions, all the pins receive an equal force of 9,000 lb, or each hole receiving the pins is charged with 4,500 lb. Fixed supports are applied to the four pads where the adapter is attached to the guide runner (Figure 5); fixed supports are in purple.

Load and boundary conditions for load case 1.
2.3.1.2 Results
The equivalent von Mises stress plot over the entire body with the averaged display option is shown in Figure 6. The maximum value is around 23 kpsi, which occurs at both ends of the high strength steel (HSS) (8 × 6 × 3/8) and at the filled radius of 1.50 in, in the interior flat plates. This resulted in a minimum safety factor of 1.59 for the fixture adapter.

Equivalent (von Mises) stress and safety factor plot for load case 1 – Drilling standby position.
2.3.2 Load case 2 – staging area position
Load case 2 analyzes the situation when the assembly of the top drive on the test stand is in the staging area. This occurs at the beginning of test preparation when the top drive is placed on the fixture adapter before moving to the testing in the drilling position. In this case, the quill’s axis sits horizontally, parallel to the floor. This loading condition also appears at the end of the testing, before the top drive was removed from the test stand, when the top drive was brought back to the horizontal position. In this case, the top drive sits on six pipes, and the weight of the top drive 36,000 lb is transferred to the adapter frame via the pipes.
2.3.2.1 Loads and boundary conditions
The weight of the top drive is transmitted to the adapter via six steel pipes. Since there are six pipes, it is assumed that each pipe will hold a load of 36,000/6 = 6,000 lb, as shown in Figure 7. The fixed support is kept the same as load case 1.
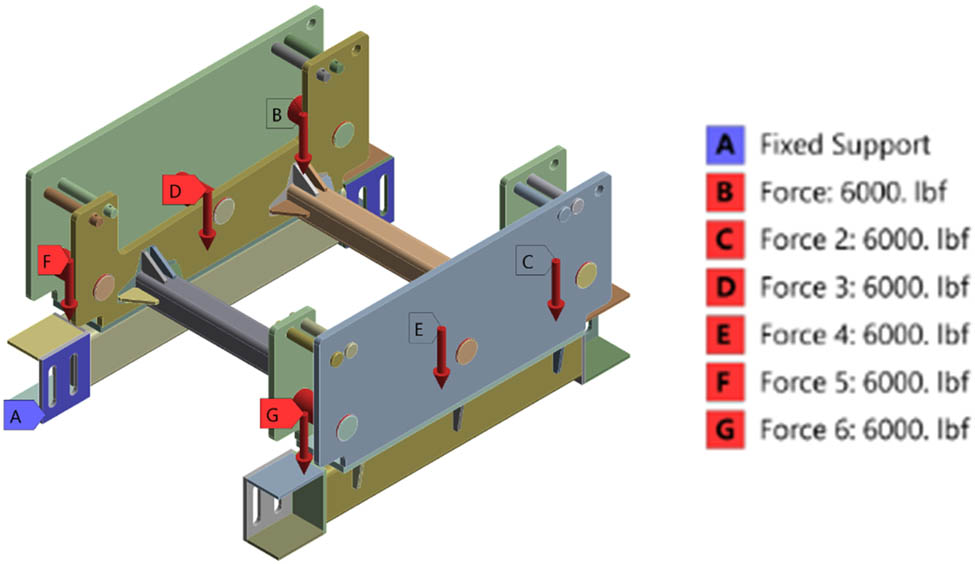
Load and boundary conditions for load case 2.
2.3.2.2 Results
The equivalent stress (von Mises) plot showed the maximum stress value of 6081.7 psi (Figure 8, red tag). The areas of maximum stress are at both ends of the HSS (8 × 6 × 3/8) and at filled radii of R = 0.75 in, at the bottom of the big flat plates. Due to the relatively smaller stress values compared to load case 1, a minimum safety factor of 5.99 is observed, which occurs in higher-stress areas.

Equivalent (von Mises) stress and safety factor plot for load case 2 – Staging area position.
2.3.3 Load case 3 – torque make-up and break-up
Load case 3 analyzes the fixture adapter in a torque testing situation. The top drive is in the drilling position (the quill’s axis is vertical), aligned, and connected to the dynamometer’s axis. Here, the torque from the top drive is transferred to the fixture adapter. The fixture adapter will keep the top drive from rotating. About 30,000 lb-ft, corresponding to the torque capacity of the 500-ton top drives, was used. Most top drives have a torque capacity equal to or below that value.
2.3.3.1 Loads and boundary conditions
When the test stand is in a torque-testing scenario, it is expected that loads generated by the applied torque will get transmitted through the pipes and pins that hold the top drive through the planar structure. Thus, 30,000 lb-ft of torque is simulated via the forces computed in Section 2.2.2. The fixture adapter will sit on the guide runners, so the fixed support is at the attachment point between the fixture adapter and the guide runner. The boundary condition is provided in Figure 9.

Load and boundary conditions for load case 3.
2.3.3.2 Results
The von Mises stress plot over the entire geometry revealed a maximum stress value of 9216.5 psi, which occurred at the location that connects the pin to the planar support structure, as shown in Figure 10. The minimum safety factor for this load case is computed to be 5.99. This safety factor value is similar to load case 2; however, the different material properties led to a higher maximum stress than in load case 2.

Equivalent (Von-Mises) stress and safety factor plot for load case 3 – Torque make-up and break-up.
2.4 Structural optimization
2.4.1 Topology optimization formulation
The above static studies do not reveal any concerns regarding the numbers and plots obtained for the load cases studied. The stress contour shows that the fixture adapter is within its elastic limit for each load case scenario (see von Mises stress plots in each load case studied above). Load case 1 shows a smaller safety factor of 1.59, while the other cases offer a minimum safety factor >3. This indicates that the fixture adapter has room for improvement in structural efficiency, potentially leading to a weight reduction. In this study, traditional topology optimization for minimum compliance is used to reduce the weight of the fixture adapter while maximizing the structural stiffness using Ansys. The general multi-loading topology optimization problem has the following form:
where
Here,
2.4.2 Analysis settings in Ansys workbench
Figure 11 illustrates the platform for the multi-loading problem feeding the topology optimization within the Ansys workbench. The two torque scenarios (torque make-up and break-up) are similar in the fact that the rotation of the quill is in the opposite direction of each other. The

The platform for the multi-loading problem for structural topology optimization within Ansys Workbench.
In order to promote timely convergence, the following termination conditions and analysis settings were employed.
The maximum number of iterations was set to 500;
The convergence accuracy of 0.1% was used;
The minimum normalized density (
2.4.3 Design domain and response constraints
In this study, the design domain is limited to the planar support structure for simplicity. Including all geometries in the optimization could result in a better overall objective (i.e., compliance). Yet, sharp corners and kinks would require significantly increased computation time. The base geometry is excluded since the proper connection to the guide runner is essential. The pins, pipes, and crossover brace bars are also excluded from topology optimization for the same reason. There is a total of four planar support structures considered as design regions in the fixture adapter, as shown in Figure 12.

Topology optimization design domain. Optimization regions in blue and exclusion regions in red.
The response constraint can be a mass or volume constraint obtained by setting up a percentage of mass or volume to retain in the optimized model. The response can also be defined by a stress constraint, a deformation constraint reaction force, and a natural frequency. Assuming that the material density does not change, the mass constraint is similar to the volume constraint (

Topology optimized results from PS1 (
3 Topology optimization results and design validation
Topology-optimized results from Ansys Mechanical often require postprocessing since the results usually contain sharp edges and unclear boundaries, which are not feasible for manufacturing. Thus, the optimized geometries were first identified by drawing density isolines, which were then manually processed (surface representation, i.e., stl
3.1 Parametric study 1 (PS1)
The density isolines using
3.2 Parametric study 2 (PS2)
The density isolines using

Topology optimized results from PS2 (
3.3 Parametric study 3 (PS3)
This parametric is conducted to place higher importance on the stresses associated with the torque testing (make-up and break-up). The weights on the torque testing are double than those for drilling in the standby position and staging scenarios (Table 4). The density isolines using
Analysis settings for PS within topology optimization
| Parametric study | Study 1 (PS1) | Study 2 (PS2) | Study 3 (PS3) | ||
|---|---|---|---|---|---|
| Mass retention constraint | 50% | 60% | 50% | ||
| Weights (w) | Boundary condition 1 | Load case 1 | 1 | 1 | 1 |
| Boundary condition 2 | Load case 2 | 1 | 1 | 1 | |
| Boundary condition 3 | Make-up | 1 | 1 | 2 | |
| Break-up | 1 | 1 | 2 | ||

Topology optimized results from PS3 (
3.4 Numerical validation
Since optimized fixture adapter geometries are manually processed, there is a chance that the structural characteristic or optimality might have been affected. Thus, all models were subject to numerical validation using the same boundary conditions used in Section 2 with the same analysis settings. The structural responses of PS1, PS2, and PS3 results are shown in Figures 16–18 and Table 5. The dimensions of the part are provided in Figure 5.

Structural response of topology-optimized result from PS1 against three load cases.

Structural response of topology-optimized result from PS2 against three load cases.

Structural response of topology-optimized result from PS3 against three load cases.
Summary of numerical validation study results (SF-safety factor)
| Boundary Condition | Original | PS1 | PS2 | PS3 | |
|---|---|---|---|---|---|
| BC1 | SF | 1.59 | 1.59 | 1.7064 | 1.5832 |
|
|
23,039 | 39,874 | 32,432 | 36,297 | |
|
|
0.016 | 0.024 | 0.0201 | 0.0243 | |
| BC2 | SF | 5.99 | 4.99 | 6.2226 | 6.2686 |
|
|
6081.7 | 7262.2 | 7024.1 | 6949.6 | |
|
|
0.003 | 0.0039 | 0.0039 | 0.0038 | |
| BC3 | SF | 5.99 | 4.0245 | 4.1202 | 3.911 |
|
|
9216.5 | 20,757 | 20,182 | 23,012 | |
|
|
0.016 | 0.0221 | 0.0209 | 0.0208 |
Topology-optimized results from the parametric results show a slight compromise in a safety factor and increased maximum stress. Yet, they are all within the elastic limit. However, it can be seen that more areas with non-zero stresses are observed against all boundary conditions, indicating better materials utilization. It is also worth noting that the PS2 result against load case 1 has a higher safety factor than the original due to the lack of sharp corners that acted as stress concentration points in the original model.
3.5 Proof of concept mechanical testing
The mechanical (physical) validation of the new fixture adapter design was conducted in a simplified environment using 3D-printed objects as proof of concept. This mechanical testing has limitations because it uses ABS plastic with vastly different mechanical characteristics from the set of metals used in the actual model. The loads applied to 3D-printed models are similar to those in load case 2 but not precisely replicate it. However, this mechanical testing is expected to show how the load transfer mechanism works in the optimized models.
The mechanical validation step will include the original and optimized models from validation study 1 and validation study 2. Validation study 3 is excluded from the testing because the safety factor obtained during the numerical validation fell below the threshold of 1.59. As a first step in creating the 3D samples, the geometries are converted into STL files, the type of file the 3D printer reads. The machine employed to make the testing samples is the Stratasys uPrint SE Plus 3D Printer. A scale of 1/12 is applied to the geometries. The material used for the samples is ABSplus™ thermoplastic. Layer thickness is set to 0.013 in (0.330 mm). The three pieces are printed simultaneously in 12 h. The finished models are shown in Figure 19.

3D-printed models of PS1 (left), PS2 (center), and the original fixture adapter. The parts are printed as shown.
A simple compression load with displacement control of 0.02 in/min was applied to the 3D-printed models using an Instron 5,582 testing frame. A customized fixture was used to keep the optimized models horizontal during the testing (Figure 20). The load and displacement data collected were processed in MATLAB and plotted to compare the structural responses of the different samples. Figure 21 shows all three plots combined for better comparison.

The simple compression testing setup on optimized and original fixture adapter. A customized fixture was used for optimized models to keep the structure as horizontal as possible during the testing.

Force vs displacement curve of specimens under compression tests.
The specimen of the original revised model shows a maximum load capacity of 794 lb. The model specimen from PS1 shows a mass load capacity of 430 lb, representing a 46% loss compared to the original sample. The specimen model from PS2 has a maximum load capacity of 446 lb, representing a 44% loss compared to the specimen from the original model. Comparing both optimized samples and since their losses are close to each other, it is preferable to consider the optimized model from PS1 because this represents the lighter model.
4 Conclusions
In this study, the base fixture adapter that satisfies the geometric requirements of the test stand and top drive mounting configurations was designed first. Ansys Workbench was used to perform FEA on the initial design based on load and boundary conditions commonly applied in top-drive torque tests and testing preparation, and boundary conditions were defined based on three operation scenarios. The resulting stress plots revealed the materials’ underutilization in localized regions, indicating potential targets for improvements in design and material load efficiency. The FEA-based analysis and design method has shown its efficacy on other underwater mechanical components, such as the structural performance of composite seafloor pipelines [24,25]. Multi-loading topology optimization was formulated to redistribute materials for enhanced structural stiffness and material utilization. A PS was also performed by varying response constraints (50% mass reduction and 60% mass retention on the side plates) and adding different weight factors between loading scenarios. This approach allowed us to obtain three optimized parametric models, namely, PS1, PS2, and PS3.
Subsequently, samples of optimized models were fabricated using 3D printing to validate the findings further, and then compression test experiments were performed on the optimized and 3D-printed prototype models (PS1, PS2, and PS3). A MATLAB code was written to plot the curves’ force vs displacement of the geometries. It was found that the test results of the optimized model geometries and their values of maximum load to sustain in compression were fairly close to the results from FEA numerical validation. In addition, it was found that among the three geometries of PS1, PS2, and PS3, the PS1 (50% mass constraint) showed the best alignment of validation between the mechanical testing and FEA numerical simulation while maintaining acceptable safety factor values. This study clearly showed that the topology optimization technique was an efficient tool in redesigning the existing fixture adapters, resulting in an optimal design with a considerable reduction of materials – a 50% mass reduction of side plates and a total of 22% in the entire geometry, with acceptable safety factor values. The topology optimization also resulted in reduced material costs and a weight of 170.5 kg (375.6 lb), which would make the fixture adapter easier to handle, creating a safer environment for the top drive torque testing. Future work could focus on reducing the discrepancy between the loading scenario used in the numerical simulation and the mechanical experiment to quantify the structural efficiency in real-world settings.
-
Funding information: The authors would like to appreciate the financial support from the National Science Foundation via award #2107140 and the Department of Energy via award DENA0003987, as well as the Research & Innovation for Scholarly Excellence grant from the Division of Research & Innovation at Prairie View A&M University.
-
Author contributions: A.L.C. contributed to the study’s methodology, analysis, and validation and wrote the original draft. M.Q. contributed to the study’s analysis, validation, and editing. X.P. edited the initial draft. J.Z. took part in editing, logistics, and supervision. J.P. contributed to the study’s conceptualization, methodology, validation, supervision, and edited the draft.
-
Conflict of interest: The authors state that there is no conflict of interest.
References
[1] TIGER GENERAL. The Importance of Oil and Gas In Today’s Economy; 2016 June 23. 2021; Available from: The Importance of Oil and Gas In Today’s Economy | Tiger General.Suche in Google Scholar
[2] Diugwu IA, Ijaiya MA, Mohammed M, Egila AE. The effect of gas production, utilization, and flaring on the economic growth of Nigeria. Nat Resour. 2013;4(4):341–8.10.4236/nr.2013.44041Suche in Google Scholar
[3] Caineng Z, Guangming Z, Guangya Z, Wang H, Guosheng Z, Li J, et al. Formation, distribution, potential and prediction of global conventional and unconventional hydrocarbon resources. Pet Explor Dev. 2015;42(1):14–28.10.1016/S1876-3804(15)60002-7Suche in Google Scholar
[4] Reddy P, Gupta A, Bailey SM. Drilling rig employing top drive. US Pat US9,790,751 B2, 2017.Suche in Google Scholar
[5] De Mul AA, Roodenburg J. A drilling rig with a top drive system operable in a drilling mode and a tripping mode. US Pat US11,512,532 B2, 2018.Suche in Google Scholar
[6] Chen K, Zhong X, Cheng Z, Lu Y, Lu Q. Identification of a laboratory slide drilling experiment: The relationship between the top drive rotation and the tool-face angle. International Design Engineering Technical Conferences and Computers and Information in Engineering Conference; 2019 Aug 19–21; Anaheim (CA), USA. American Society of Mechanical Engineers; 2019.10.1115/DETC2019-97322Suche in Google Scholar
[7] Inoma JE, Pavlou D, Zec J. Implementation of linear, double-linear, and nonlinear fatigue damage accumulation rules for fatigue life prediction of offshore drilling top-drive tie-rods. IOP Conf Ser: Mater Sci Eng. 2019;700:012025.10.1088/1757-899X/700/1/012025Suche in Google Scholar
[8] Krog L, Tucker A, Kemp M, Boyd R. Topology optimisation of aircraft wing box ribs. In 10th AIAA/ISSMO Multidisciplinary Analysis and Optimization Conference, 2004, p. 4481.10.2514/6.2004-4481Suche in Google Scholar
[9] Park J, Nguyen TH, Shah JJ, Sutradhar A. Conceptual design of efficient heat conductors using multi-material topology optimization. Eng Optim. 2019;51(5):796–814.10.1080/0305215X.2018.1497613Suche in Google Scholar
[10] Hopf A, Bartsch G, Krämer F, Weber C. CFD topology and shape optimization for port development of integrated exhaust manifolds. SAE Technical Paper; 2017.10.4271/2017-01-1339Suche in Google Scholar
[11] Jain N. Topological optimization of the fork-end of a knuckle joint. J Mech Behav Mater. 2018;27(3–4):20180022.10.1515/jmbm-2018-0022Suche in Google Scholar
[12] Da’Quan L, Zhou J, Park J. The use of topology optimization in enhancing the structural property of an automotive front sub-frame. 2022 ASEE Gulf Southwest Annual Conference; 2022 Mar 16–22; Prairie View (TX), USA. ASEE; 2022.Suche in Google Scholar
[13] Mantovani S, Barbieri S, Giacopini M, Croce A, Sola A, Bassoli E. Synergy between topology optimization and additive manufacturing in the automotive field. Proc Inst Mech Eng Part B J Eng Manuf. 2021;235(3):555–67.10.1177/0954405420949209Suche in Google Scholar
[14] Matsimbi M, Nziu PK, Masu LM, Maringa M. Topology optimization of automotive body structures: A review. Int J Eng Res Technol. 2020;13(12):4282–96.Suche in Google Scholar
[15] Park J. Topology optimization to design bone replacement shapes in craniofacial reconstructive surgery: Design, simulation and experimental validation [dissertation]. Columbus (OH): Ohio State University; 2013.Suche in Google Scholar
[16] Tian J, Zhao X, Gu XD, Chen S, Designing ferromagnetic soft robots (FerroSoRo) with level-set-based multiphysics topology optimization. In 2020 IEEE International Conference on Robotics and Automation (ICRA); 2020 31 May-31 Aug; Paris, France. IEEE, 2020.10.1109/ICRA40945.2020.9197457Suche in Google Scholar
[17] Yoon GH, Choi H, Hur S. Multiphysics topology optimization for piezoelectric acoustic focuser. Comput Methods Appl Mech Eng. 2018;332:600–23.10.1016/j.cma.2017.12.002Suche in Google Scholar
[18] Kumar A, Sharma R, Gupta AK. Experimental investigation of WEDM process through integrated desirability and machine learning technique on implant material. J Mech Behav Mater. 2021;30(1):38–48.10.1515/jmbm-2021-0005Suche in Google Scholar
[19] Lei X, Liu C, Du Z, Zhang W, Guo X. Machine learning-driven real-time topology optimization under moving morphable component-based framework. J Appl Mech. 2019;86(1):011004.10.1115/1.4041319Suche in Google Scholar
[20] Senhora FV, Chi H, Zhang Y, Mirabella L, Tang TLE, Paulino GH. Machine learning for topology optimization: Physics-based learning through an independent training strategy. Comput Methods Appl Mech Eng. 2022;398:115116.10.1016/j.cma.2022.115116Suche in Google Scholar
[21] Bendsøe MP, Sigmund O. Material interpolation schemes in topology optimization. Arch Appl Mech. 1999;69(9):635–54.10.1007/s004190050248Suche in Google Scholar
[22] Rozvany GI, Zhou M, Birker T. Generalized shape optimization without homogenization. Struct Optim. 1992;4(3–4):250–2.10.1007/BF01742754Suche in Google Scholar
[23] Bendsoe MP, Sigmund O. Topology optimization: Theory, methods, and applications. Berlin/Heidelberg, Germany: Springer Science & Business Media; 2003.Suche in Google Scholar
[24] Thang V, Hui D, Marshall PW, Zhou J. Performance of steel–polymer–steel seafloor pipeline buried in earthquake fault zones. Arch Civ Mech Eng. 2022;22(4):1–15.10.1007/s43452-022-00495-5Suche in Google Scholar
[25] Thang V, Hui D, Zhou J, Marshall PW. Failure prevention of seafloor composite pipelines using enhanced strain-based design. Rev Adv Mater Sci. 2022;61(1):306–21.10.1515/rams-2022-0035Suche in Google Scholar
© 2023 the author(s), published by De Gruyter
This work is licensed under the Creative Commons Attribution 4.0 International License.
Artikel in diesem Heft
- Research Articles
- The regularization of spectral methods for hyperbolic Volterra integrodifferential equations with fractional power elliptic operator
- Analytical and numerical study for the generalized q-deformed sinh-Gordon equation
- Dynamics and attitude control of space-based synthetic aperture radar
- A new optimal multistep optimal homotopy asymptotic method to solve nonlinear system of two biological species
- Dynamical aspects of transient electro-osmotic flow of Burgers' fluid with zeta potential in cylindrical tube
- Self-optimization examination system based on improved particle swarm optimization
- Overlapping grid SQLM for third-grade modified nanofluid flow deformed by porous stretchable/shrinkable Riga plate
- Research on indoor localization algorithm based on time unsynchronization
- Performance evaluation and optimization of fixture adapter for oil drilling top drives
- Nonlinear adaptive sliding mode control with application to quadcopters
- Numerical simulation of Burgers’ equations via quartic HB-spline DQM
- Bond performance between recycled concrete and steel bar after high temperature
- Deformable Laplace transform and its applications
- A comparative study for the numerical approximation of 1D and 2D hyperbolic telegraph equations with UAT and UAH tension B-spline DQM
- Numerical approximations of CNLS equations via UAH tension B-spline DQM
- Nonlinear numerical simulation of bond performance between recycled concrete and corroded steel bars
- An iterative approach using Sawi transform for fractional telegraph equation in diversified dimensions
- Investigation of magnetized convection for second-grade nanofluids via Prabhakar differentiation
- Influence of the blade size on the dynamic characteristic damage identification of wind turbine blades
- Cilia and electroosmosis induced double diffusive transport of hybrid nanofluids through microchannel and entropy analysis
- Semi-analytical approximation of time-fractional telegraph equation via natural transform in Caputo derivative
- Analytical solutions of fractional couple stress fluid flow for an engineering problem
- Simulations of fractional time-derivative against proportional time-delay for solving and investigating the generalized perturbed-KdV equation
- Pricing weather derivatives in an uncertain environment
- Variational principles for a double Rayleigh beam system undergoing vibrations and connected by a nonlinear Winkler–Pasternak elastic layer
- Novel soliton structures of truncated M-fractional (4+1)-dim Fokas wave model
- Safety decision analysis of collapse accident based on “accident tree–analytic hierarchy process”
- Derivation of septic B-spline function in n-dimensional to solve n-dimensional partial differential equations
- Development of a gray box system identification model to estimate the parameters affecting traffic accidents
- Homotopy analysis method for discrete quasi-reversibility mollification method of nonhomogeneous backward heat conduction problem
- New kink-periodic and convex–concave-periodic solutions to the modified regularized long wave equation by means of modified rational trigonometric–hyperbolic functions
- Explicit Chebyshev Petrov–Galerkin scheme for time-fractional fourth-order uniform Euler–Bernoulli pinned–pinned beam equation
- NASA DART mission: A preliminary mathematical dynamical model and its nonlinear circuit emulation
- Nonlinear dynamic responses of ballasted railway tracks using concrete sleepers incorporated with reinforced fibres and pre-treated crumb rubber
- Two-component excitation governance of giant wave clusters with the partially nonlocal nonlinearity
- Bifurcation analysis and control of the valve-controlled hydraulic cylinder system
- Engineering fault intelligent monitoring system based on Internet of Things and GIS
- Traveling wave solutions of the generalized scale-invariant analog of the KdV equation by tanh–coth method
- Electric vehicle wireless charging system for the foreign object detection with the inducted coil with magnetic field variation
- Dynamical structures of wave front to the fractional generalized equal width-Burgers model via two analytic schemes: Effects of parameters and fractionality
- Theoretical and numerical analysis of nonlinear Boussinesq equation under fractal fractional derivative
- Research on the artificial control method of the gas nuclei spectrum in the small-scale experimental pool under atmospheric pressure
- Mathematical analysis of the transmission dynamics of viral infection with effective control policies via fractional derivative
- On duality principles and related convex dual formulations suitable for local and global non-convex variational optimization
- Study on the breaking characteristics of glass-like brittle materials
- The construction and development of economic education model in universities based on the spatial Durbin model
- Homoclinic breather, periodic wave, lump solution, and M-shaped rational solutions for cold bosonic atoms in a zig-zag optical lattice
- Fractional insights into Zika virus transmission: Exploring preventive measures from a dynamical perspective
- Rapid Communication
- Influence of joint flexibility on buckling analysis of free–free beams
- Special Issue: Recent trends and emergence of technology in nonlinear engineering and its applications - Part II
- Research on optimization of crane fault predictive control system based on data mining
- Nonlinear computer image scene and target information extraction based on big data technology
- Nonlinear analysis and processing of software development data under Internet of things monitoring system
- Nonlinear remote monitoring system of manipulator based on network communication technology
- Nonlinear bridge deflection monitoring and prediction system based on network communication
- Cross-modal multi-label image classification modeling and recognition based on nonlinear
- Application of nonlinear clustering optimization algorithm in web data mining of cloud computing
- Optimization of information acquisition security of broadband carrier communication based on linear equation
- A review of tiger conservation studies using nonlinear trajectory: A telemetry data approach
- Multiwireless sensors for electrical measurement based on nonlinear improved data fusion algorithm
- Realization of optimization design of electromechanical integration PLC program system based on 3D model
- Research on nonlinear tracking and evaluation of sports 3D vision action
- Analysis of bridge vibration response for identification of bridge damage using BP neural network
- Numerical analysis of vibration response of elastic tube bundle of heat exchanger based on fluid structure coupling analysis
- Establishment of nonlinear network security situational awareness model based on random forest under the background of big data
- Research and implementation of non-linear management and monitoring system for classified information network
- Study of time-fractional delayed differential equations via new integral transform-based variation iteration technique
- Exhaustive study on post effect processing of 3D image based on nonlinear digital watermarking algorithm
- A versatile dynamic noise control framework based on computer simulation and modeling
- A novel hybrid ensemble convolutional neural network for face recognition by optimizing hyperparameters
- Numerical analysis of uneven settlement of highway subgrade based on nonlinear algorithm
- Experimental design and data analysis and optimization of mechanical condition diagnosis for transformer sets
- Special Issue: Reliable and Robust Fuzzy Logic Control System for Industry 4.0
- Framework for identifying network attacks through packet inspection using machine learning
- Convolutional neural network for UAV image processing and navigation in tree plantations based on deep learning
- Analysis of multimedia technology and mobile learning in English teaching in colleges and universities
- A deep learning-based mathematical modeling strategy for classifying musical genres in musical industry
- An effective framework to improve the managerial activities in global software development
- Simulation of three-dimensional temperature field in high-frequency welding based on nonlinear finite element method
- Multi-objective optimization model of transmission error of nonlinear dynamic load of double helical gears
- Fault diagnosis of electrical equipment based on virtual simulation technology
- Application of fractional-order nonlinear equations in coordinated control of multi-agent systems
- Research on railroad locomotive driving safety assistance technology based on electromechanical coupling analysis
- Risk assessment of computer network information using a proposed approach: Fuzzy hierarchical reasoning model based on scientific inversion parallel programming
- Special Issue: Dynamic Engineering and Control Methods for the Nonlinear Systems - Part I
- The application of iterative hard threshold algorithm based on nonlinear optimal compression sensing and electronic information technology in the field of automatic control
- Equilibrium stability of dynamic duopoly Cournot game under heterogeneous strategies, asymmetric information, and one-way R&D spillovers
- Mathematical prediction model construction of network packet loss rate and nonlinear mapping user experience under the Internet of Things
- Target recognition and detection system based on sensor and nonlinear machine vision fusion
- Risk analysis of bridge ship collision based on AIS data model and nonlinear finite element
- Video face target detection and tracking algorithm based on nonlinear sequence Monte Carlo filtering technique
- Adaptive fuzzy extended state observer for a class of nonlinear systems with output constraint