Engineering fault intelligent monitoring system based on Internet of Things and GIS
-
Xiaoxing Su


Abstract
The power grid (referred to as PG for convenience) structure is becoming increasingly complex. Aiming at the problem that it is difficult for traditional PG monitoring methods to accurately detect PG faults, an intelligent PG fault monitoring system is constructed using Internet of Things (IoT) and geographic information system (GIS) to improve the effectiveness of fault monitoring. The sensor equipment is used to collect the current information in the circuit, and the change of induced current is used to judge the cause of the fault, and the fault information is transmitted to the monitoring center through communication technology. The staff can directly locate the geographical location of the fault in the visual interface. One hundred overhead lines of Xianyang Power Supply Company are selected for analysis, and the performance of the traditional PG monitoring method and intelligent PG fault monitoring system is compared. The average fault detection accuracy of the traditional PG monitoring method and the system proposed in this article is 72.0 and 94.8%, respectively. The average fault location accuracy of the traditional PG monitoring method and this system is 80.8 and 96.5%, respectively. The intelligent monitoring system of PG fault based on IoT and GIS has high accuracy in PG fault detection and fault location, which can improve the effectiveness of fault monitoring.
1 Introduction
With the development of the power system (PWS), the scale and complexity of the PWS are constantly increasing, and the PWS can meet the increasing demand for electricity. However, the expansion of the PWS has also led to an increase in the frequency of power grid (PG) failures, which are prone to occur in transmission, power supply, and consumption processes, resulting in low reliability of power supply. Therefore, conducting safe, reliable, and accurate fault monitoring of the PG system helps to ensure the safety of power transmission. Electricity is an important pillar of economic development, and the PWS has evolved from traditional power networks to various forms of PG through continuous iterative updates. The traditional method of monitoring power equipment is manual inspection, which requires relevant testing personnel to use their senses and matching testing instruments on-site to perform simple monitoring of power equipment. This monitoring method has many drawbacks, such as high labor intensity, scattered testing quality, and susceptibility to subjective factors. Solar power generation, wind power generation, and fuel cell power generation are all main power sources today [1,2]. With the development of communication and intelligent technologies, smart grids are considered an effective solution for PWS fault monitoring. By conducting comprehensive fault monitoring of the PWS, the safety of power transmission is ensured. In the era of the Internet of Things (IoT), using sensors can quickly and accurately obtain information about PG fault nodes, and through wireless sensing systems, fault information interconnection can be achieved, thereby achieving informatization and automation of PG faults. When monitoring PG faults, it is not only necessary to obtain fault information in a timely manner but also to locate the fault location to timely eliminate the potential safety hazards of power faults.
The construction of the PWS can provide continuous power supply services to users, thereby ensuring the quality of power supply. However, when the PWS network encounters faults, it can cause power interruption. In order to ensure the stability of the PWS, many people monitor PWS faults. Gopakumar et al. proposed an intelligent backup monitoring system for detecting and classifying transmission line faults that occur in the PG. By using the measured values of phasor measurement units on the generator bus, transmission line faults that occurred at any location within the PG were identified and classified. The system proposed by Gopakumar et al. could greatly assist the system protection center in locating faults and restoring the line as soon as possible [3]. Abbasi et al. believed that power transformers were an important component of every country’s PG, and they could cause faults during operation. Therefore, it was necessary to continuously monitor it [4]. The research of Patel and Shah pointed out that the PWS could meet the power demand of users through a continuous and stable power supply. As the main source of power generation, power plants would generate many potential safety hazards during their work. The safety of power generation facilities was effectively improved through power failure monitoring of nuclear power plants, fossil fuel power station, and solar energy–related failed power plants [5]. Yasinzadeh and Mahdi proposed a new anti-spoofing algorithm based on PG infrastructure, which could incorporate any existing anti-spoofing algorithm to enhance the spoofing detection process, achieve PG protection by refining forged measurements, and monitor and manage PG faults [6]. Intelligent monitoring of PWS faults can effectively protect circuits and provide users with stable electricity, but there is a lack of using the IoT to collect PWS fault information.
The IoT technology is constantly developing, and sensors can accurately obtain circuit component status information. Many people have applied the IoT technology to intelligent monitoring of PG faults. Jiang et al. pointed out that dynamic thermal rating was a technology that could effectively reduce the complexity of smart grid decision-making processes. A dynamic thermal rating monitoring system based on the IoT could be used to achieve reliable and low-cost remote monitoring of the PG. Choosing the 161 kV line in the transmission system of Taiwan Power Company as the experimental target could effectively monitor over 89.6% of high conductor temperature events. The root mean square error of the reconstructed conductor temperature distribution was less than 0.8°C [7]. Liu et al. proposed an application system for monitoring, detection, security, and interactive services of layered power transmission and distribution system, which was based on wireless sensor network technology and ensured the security and stability of power transmission and distribution system operation by monitoring the power transmission and distribution system [8]. Shakya proposed a self-monitoring and analysis system for solar power plants using the IoT and data mining algorithms. The use of IoT technology helps human employers detect the regularity of power generation and fault or defect areas in solar systems [9]. The use of IoT technology to collect and analyze PG fault information can accurately monitor PG faults, but there is a lack of application of Geographic Information System (GIS) to accurately locate fault locations. The existing literature lacks the use of GIS for PG fault location. This article combines IoT technology with GIS technology to collect fault information and conduct geographical location analysis to achieve intelligent monitoring of PG faults.
The occurrence of faults in the PWS during operation poses great harm to the entire PWS. In order to detect potential accidents in advance, monitoring and management of power faults should be carried out. This article designed an intelligent monitoring system for power faults based on the IoT and GIS technology. It collected power network fault information from the IoT, achieved fault information transmission through wireless sensing technology, and used GIS to correspond and analyze fault information with geographical location, thereby helping maintenance personnel quickly locate and understand fault information.
2 Method for intelligent monitoring of PG faults
2.1 Fault data collection
People’s lives cannot function without electricity, and their daily lives and work rely on electricity. Electricity not only provides convenience for people but also promotes social development. With people’s increasing dependence on electricity and the integration of various high-power electrical equipment, the scale of the PG is becoming larger and larger. The PG is the safe and reliable transportation of electricity from power plants to users through transmission, distribution, and other equipment. The purpose of PG construction is to achieve electricity transmission and distribution, thereby meeting the electricity demand of different regions and times and adjusting the balance of electricity supply and demand between regions [10,11].
As a populous country, China has a very large demand for electricity, and its power network is constantly expanding to meet its power supply needs. In 2018, the output value of China’s PG industry achieved 3.25 trillion yuan. The structure of the power network is becoming increasingly complex. Intelligent monitoring of PG faults is necessary.
Continuous power supply is the primary goal of PG enterprises. Once a power network malfunction occurs and is not resolved in a timely manner, it would cause great inconvenience to people’s lives and even cause serious economic losses. The main faults of the circuit include short circuit and open circuit. When a fault occurs, it is necessary to obtain timely information about the fault and develop targeted maintenance plans.
The power fault indicator is a device that helps store maintenance personnel detect fault points by collecting short circuit information in the circuit to determine the occurrence of a fault. With the development of IoT technology, various sensors have emerged, which can quickly collect changes in current signals in circuits and determine the fault status of circuits. The IoT refers to the real-time collection of physical processes that need to be monitored through various information sensors, which exchange the collected physical information through communication media [12,13].
Wireless sensors can quickly and accurately obtain PG information, including circuit voltage information, short-circuit information, open-circuit information, etc. In order to effectively analyze PG fault information, it needs to comprehensively analyze the fault information collected by sensors. There are many types of wireless communication technologies, and common wireless communication technologies are shown in Table 1.
Common wireless communication technologies
| Content | Wireless fidelity | Bluetooth | ZigBee |
|---|---|---|---|
| Price | Expensive | Cheap | Cheap |
| Power consumption | High | Low | Low |
| Security | Low | High | High |
| Transmission rate | 11–54 Mbps | 1 Mpbs | 100 kbps |
| Communication distance | 100–300 m | 2–30 m | 50–300 m |
| Disadvantage | Consume power | Low anti-interference ability | Low speed |
In Table 1, common wireless communication technologies are described, and the characteristics of Wireless fidelity, Bluetooth, and ZigBee technologies are compared [14]. Wireless fidelity consumes a lot of power, and Bluetooth has low antiinterference ability. ZigBee technology is more suitable for wireless sensor communication with the PG.
During the operation of the PG, the most common fault is single-phase ground short circuit, except for the overloading of components such as lines and transformers. Short-circuit faults pose great harm to the PG, thus directly causing large-scale regional power outages and even damaging circuit components, causing significant losses to the PG. During symmetrical faults, the transient time, maximum current, steady-state, and voltage drop values at the machine side and grid side converters of the doubly fed induction generator will decay [15,16]. The causes of short-circuit faults can be divided into natural factors and human factors. The natural factors of short-circuit faults are caused by factors in nature, such as voltage short circuits caused by lightning and short circuits caused by birds and animals crossing wires. Operating personnel’s operational errors can also cause short-circuit faults.
When using a fault indicator to collect circuit fault information, the main method is to determine the type of fault by judging the current information in the fault indicator. The fault indicator uses a sensing device to collect the changes in current in the circuit, mainly detecting the state of the wire when grounded and when short circuited.
The judgment process when a wire is grounded is that the voltage would suddenly drop, and the voltage of the fault relative to the ground would rapidly decrease. When the voltage drops by more than a specified threshold, it indicates the grounding status.
where
Single-phase grounding can cause arcing and trigger higher-order harmonics. This is represented by the fifth harmonic flow as follows:
where
Short circuit is the most common type of fault, which can cause an instantaneous increase in current. The magnitude of short-circuit current is as follows:
The duration of short-circuit current is generally expressed as follows:
where
The principle of using sensors to diagnose faults is mainly to determine the type of fault occurrence by measuring the current threshold, current increment, and short-circuit duration.
2.2 Fault location evaluation
It is essential to locate the faulty circuit. By locating PG faults, maintenance personnel can quickly find the fault location and quickly carry out targeted fault repair to ensure the stable transmission of electricity as much as possible.
GIS is an essential spatial information system that can collect, calculate, and manage geographic data in space [17,18]. GIS can be well applied to intelligent monitoring of PG faults, achieving precise positioning of PG faults. The process of PG fault monitoring includes fault information collection, fault information analysis, fault location, and fault maintenance. When the fault collection device installed on the power line collects fault information, it would upload the fault information, fault time, fault location, and other information of the circuit to the monitoring center. The monitoring center combines the fault information with GIS for analysis to obtain the accurate geographical location of the fault point and surrounding power information.
When a PG fault occurs, real-time positioning of the fault point can also be carried out. The probes of the fault collection device are mainly distributed on the branch lines. When a short-circuit fault occurs on the line, the monitoring nodes at each location would quickly detect the short-circuit current, and the information of the short-circuit fault would also be combined with the positioning communication on the line. After receiving the returned fault location information, the monitoring center can use computer technology to analyze the location of the PG fault point.
GIS is a data management system with a specialized form of information system space, which has a computer system for centralized storage, operation, and display of geographic reference information [19]. The combination of the IoT and GIS can effectively collect and locate PG fault information. The communication master station demodulates and decodes the wireless information sent by the fault collection device and sends it to the distribution control center. By analyzing the network topology of the power network, the fault location is determined and displayed in a real GIS.
2.3 Intelligent monitoring system for PG faults
As the power network becomes increasingly complex, the transmission of electricity is inevitably prone to malfunctions. In order to effectively ensure a stable supply of electricity, it is necessary to conduct intelligent monitoring of PG faults, monitor PG faults, analyze the causes of faults, and locate the location of fault points [20].
The intelligent monitoring process for PG faults is shown in Figure 1.
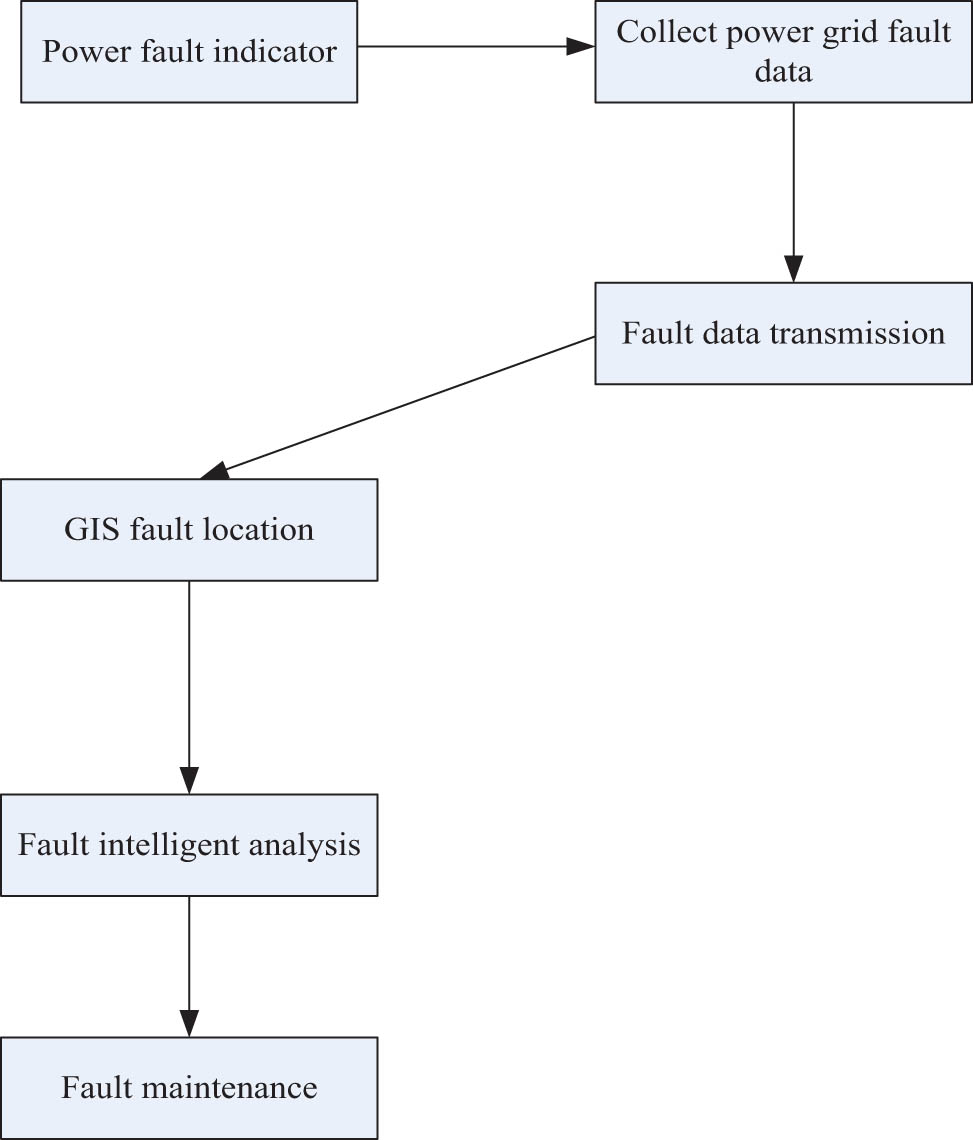
Intelligent monitoring process for PG faults.
With the development of the IoT and GIS, applying them to PG fault monitoring can analyze and determine the location of fault points. In the intelligent monitoring system for PG faults based on the IoT and GIS, it is first necessary to use fault collection devices to obtain circuit information and transmit the collected fault information back to the control center using wireless communication technology. The fault information of the PG is obtained from geographical information data through GIS, and the fault location is achieved through computer technology analysis. The interface of the intelligent monitoring system for PG faults is shown in Figure 2.

Interface diagram of the intelligent monitoring system for PG faults.
In Figure 2, the interface of the intelligent monitoring system for PG faults is described, which is divided into three parts, including system functions such as PG fault analysis and power architecture. The second part is a fault information retrieval function that can input text and analyze, locate, and develop maintenance plans based on the retrieved circuit faults. The third part is to visually locate and display the location of PG fault points.
Traditional fault location is carried out through manual inspection along the line. Although obvious PG fault problems can be detected, the shortcomings of traditional manual fault monitoring are very obvious. Manual inspection requires a large amount of manpower, material resources, and financial resources, and it is difficult for relatively hidden faults to occur. Traditional manual inspection requires inspectors to inspect along the line, which requires a lot of time and human resources, and manual inspection methods are difficult to accurately determine PG faults.
The intelligent monitoring system for PG faults using the IoT and GIS has many advantages. Sensors can quickly obtain circuit fault information and achieve automated fault localization. Maintenance personnel can understand the condition of fault points through a visual management interface and quickly develop targeted maintenance plans. Under the IoT system, circuit fault information can be quickly and accurately collected. The performance of sensor data collection is much better than that of manual inspection. GIS analysis of the collected fault information data can automatically locate faults and achieve intelligent monitoring of PG faults.
However, the intelligent monitoring method for PG faults using the IoT and GIS also has some drawbacks. Sometimes, analyzing the changes in circuit current cannot fully represent the fault situation of the circuit, for example, power outage measures in special circumstances may be mistaken for PG faults.
3 Performance evaluation of intelligent monitoring system for PG faults
3.1 Implementation environment of the intelligent monitoring system for PG faults
Electricity needs to be transmitted through a large PG from power plants to users, and faults are prone to occur during the transmission process, leading to large-scale power outages and affecting industrial production and people’s daily lives.
Traditional PG fault inspection methods are difficult to identify faults in a timely manner. The fault of the PG is usually caused by a short circuit in the line, causing regional power outages and even damaging electrical appliances in the line. This article applies the IoT and GIS to establish an intelligent monitoring system for PG faults. Sensor devices are used to collect PG data, and the collected fault information is uploaded through wireless communication technology. Finally, the fault information is combined with GIS for analysis to locate and analyze the fault point.
To effectively analyze the performance of the intelligent monitoring system for PG faults, this article is needed to analyze the fault monitoring effect in a section of power lines. This article selected 100 overhead lines from Xianyang Power Supply Company in Shaanxi Province, China, for analysis. The voltage of the overhead lines was 10 kV, with a total length of 2,000 km. The experimental period was from January 2020 to June 2020. Under the condition of not affecting the normal operation of the PG, a fault sensor with communication equipment was installed on the line, and the communication method for collecting data from the fault indicator was ZigBee wireless communication.
In the intelligent monitoring system for PG faults, data are collected through multiple sensors and fault information is transmitted to the monitoring center through the ZigBee network, achieving fast and reliable PG fault analysis.
3.2 Comparison of different PG fault monitoring methods
The scale and complexity of the PG are constantly increasing, and grid faults are also prone to occur. Once a fault occurs, it would cause power supply obstacles in the PWS and affect normal electricity usage. The faults in the PG include short circuit, grounding, and open circuit. Timely monitoring of PG faults, analyzing the causes of faults, and accurately locating them can help maintenance personnel carry out rapid repairs.
This article compared and analyzed the intelligent monitoring system for PG faults with the traditional monitoring methods for PG faults. The traditional monitoring method for PG faults used manual inspection and fault diagnosis based on the experience of patrol personnel. In order to comprehensively analyze the performance of the two PG fault monitoring methods, a comparison would be conducted on the accuracy of fault detection, fault positioning, fault monitoring, and power supply effects.
The accuracy of fault detection and fault location can be determined by three indicators: accuracy, precision, and recall. The effectiveness of fault monitoring is mainly judged by analyzing the efficiency of troubleshooting, the real-time nature of fault monitoring, and the convenience of fault monitoring.
TP: actual is a positive example, and the prediction is also a positive example; FP: actual negative case, predicted positive case; FN: actual positive case, predicted negative case; TN: the actual case is negative, and the prediction is also negative. N is the total number of samples.
The accuracy is expressed as follows:
The accuracy is expressed as follows:
The recall rate is expressed as follows:
The efficiency of troubleshooting is expressed as follows:
where m represents the number of faults eliminated, and t represents the time required to eliminate faults.
The real-time performance of fault monitoring is represented as follows:
where h represents the time when the fault occurred, and e represents the time when the fault was discovered by monitoring.
The convenience formula for fault monitoring is expressed as follows:
where U represents a fixed parameter.
The power supply quality is expressed as follows:
where V represents the voltage, I represents the current, and cos b represents the power factor.
The reliability of power supply is expressed as follows:
where t r represents the average power outage time of the user, and t n represents the time during the statistical period.
The formula for PG management level is expressed as follows:
where c represents the management level factor.
There are many triggering factors for PG faults, including complex climate environments and human negligence in management. To effectively evaluate the performance of the two PG fault monitoring methods, experiments would be conducted in groups, and multiple groups of experiments would be set up to eliminate errors.
4 Intelligent monitoring results of PG faults
4.1 Accurate effect of fault detection
There are many faults in the PG. When there is a fault in the PG, it needs to be promptly eliminated to avoid affecting the power supply of the entire power network. PG fault detection is the detection of fault information, including short circuit, open circuit, etc. Traditional manual fault detection is a manual inspection method, and the fault detection of the system in this article is achieved by sensing the changes in current in the circuit through sensors. Figure 3 shows the accurate fault detection effect of the system and traditional PG fault monitoring in this article.
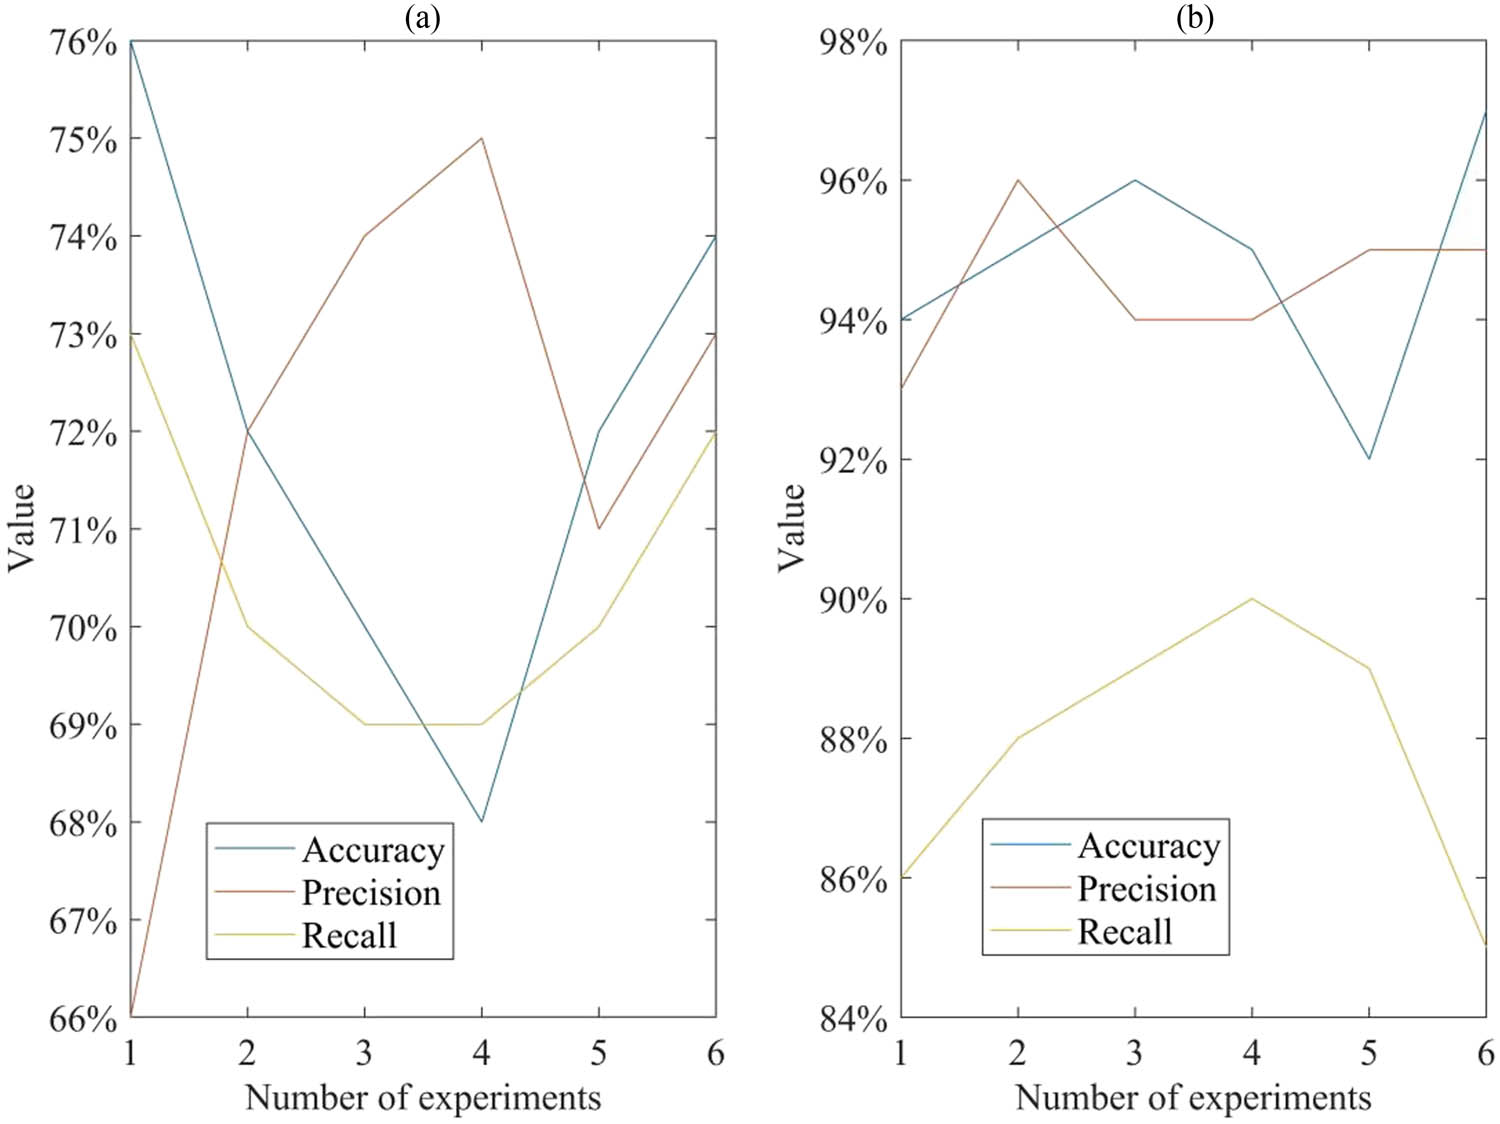
Comparison results of accurate fault detection results. (a) Accurate fault detection effect of traditional PG fault monitoring, (b) accurate fault detection performance of the system in this article.
Figure 3(a) displays the accurate fault detection effect of traditional PG fault monitoring. A total of six experiments were conducted. By measuring, TP: the actual case is positive, and the prediction is also positive; FP: actual negative case, predicted positive case; FN: actual positive case, predicted negative case; TN: actual is a negative example, and prediction is also a negative example to analyze accuracy, recall, and accuracy. The traditional fault detection accuracy achieved the lowest of 68% in the fourth attempt and achieved the highest of 76% in the highest attempt. The accuracy of traditional fault detection fluctuated significantly during the six experiments. This was mainly because traditional manual fault detection relied on the experience of manual detection, and there might be some differences in the experience of different inspection personnel. The traditional fault detection accuracy achieved a lowest of 66% in the first attempt and a highest of 75% in the fourth attempt. The traditional fault detection recall rate was 69% in both the third and fourth attempts, reaching a highest of 73% in the first attempt. The average accuracy of traditional fault detection was 72.0%, while the average accuracy of traditional fault detection was 71.8%. The average recall rate for traditional fault detection was 70.5%. Figure 3(b) displays the accurate fault detection performance of the system in this article. The intelligent monitoring system for PG faults in this article detected and analyzed the changes in current in the circuit through sensors. The accuracy of fault detection in this system was much better than that of traditional fault detection. This was mainly because the data collected by the sensors could more accurately reflect the fault information of the PG. The fault detection accuracy of the system in this article achieved the lowest of 92% in the fifth attempt and a highest of 97% in the sixth attempt. The average detection accuracy was 94.8%. The average detection accuracy of the system in this article was 94.5%, and the average detection recall rate was 87.8%. Applying IoT technology to PG fault detection and utilizing sensors to monitor current changes could effectively improve the accuracy of fault detection.
4.2 Accurate fault location effect
The route of the PWS is very long. When a fault is detected, it is necessary to timely and accurately locate the location of the fault point, providing fault point information for subsequent maintenance. The fault location of the system in this article uses GIS to locate the geographical location in the fault information. The accurate fault location effect of the system and traditional PG fault monitoring in this article is shown in Figure 4.
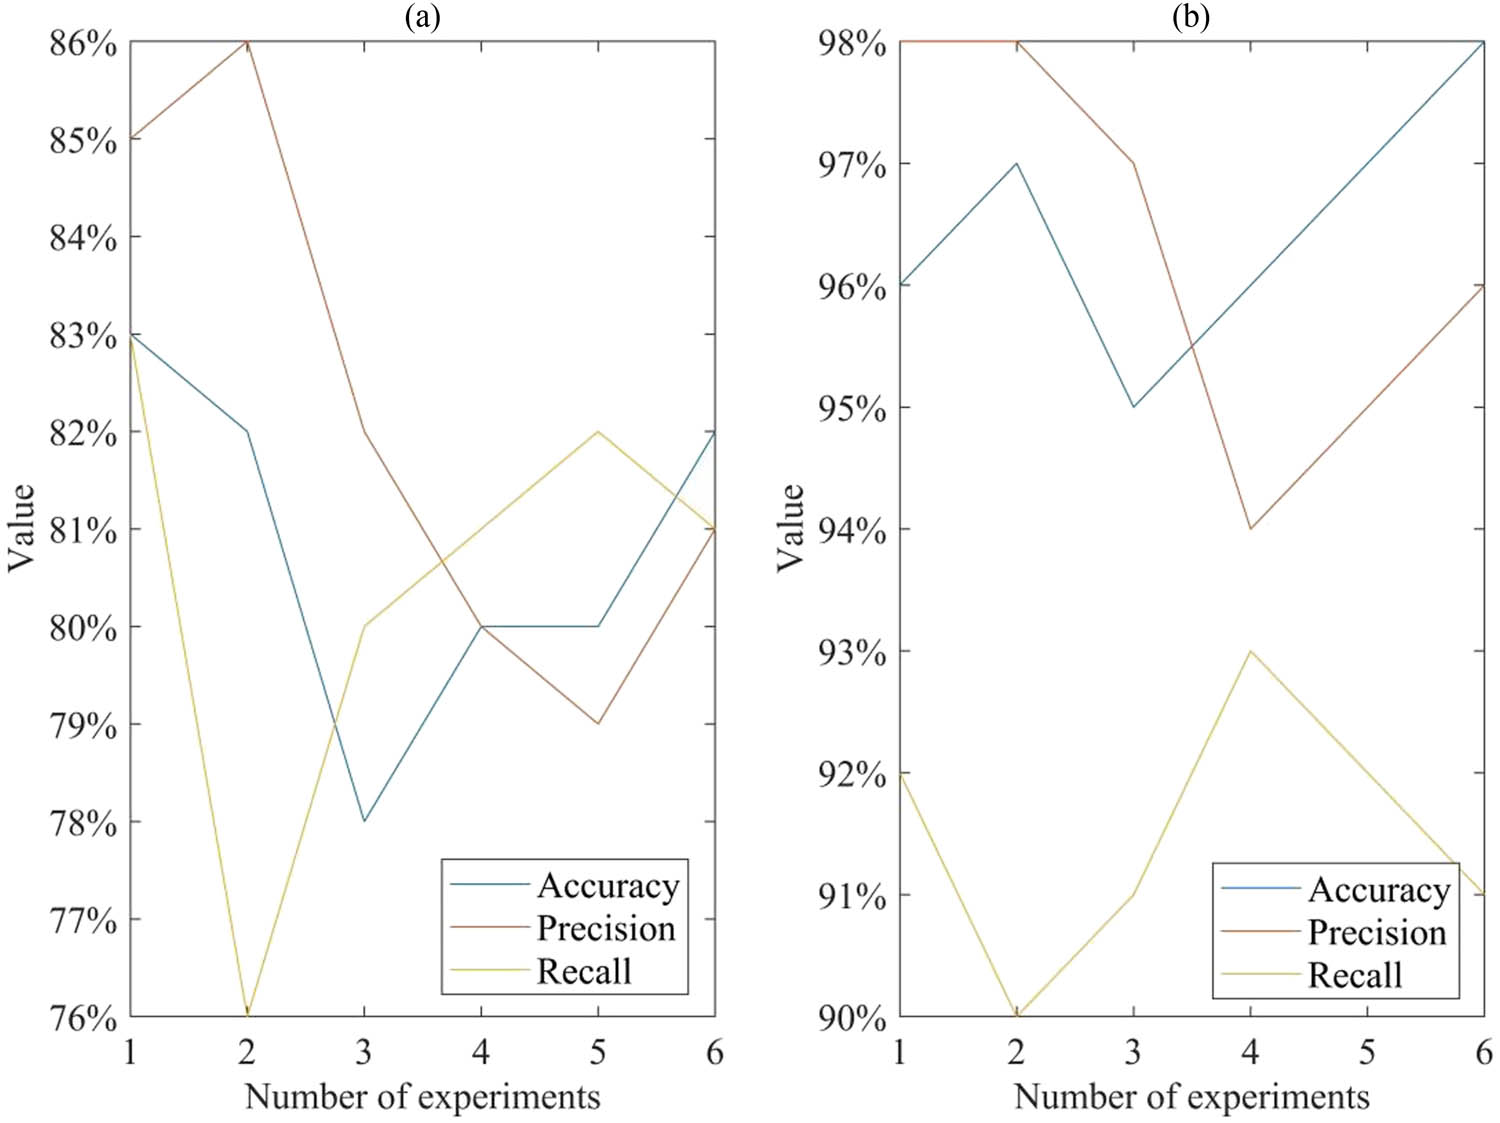
Comparison results of accurate fault location results. (a) Accurate fault location effect of traditional PG fault monitoring, (b) the accurate fault location effect of the system in this article.
Figure 4(a) displays the accurate fault location effect of traditional PG fault monitoring. The traditional fault location accuracy achieved the lowest of 78% in the third attempt and the highest of 83% in the first attempt. The accuracy of traditional fault location did not reach very high standards. This was mainly due to slight errors in marking on the map when manually locating faults. Manual fault information recording could also result in human errors. The traditional fault location accuracy achieved the lowest of 79% in the fifth attempt and the highest of 86% in the second attempt. The average accuracy of traditional fault location was 80.8%, while the average accuracy of traditional fault location was 82.2%. The average recall rate for traditional fault locations was 80.5%. Figure 4(b) displays the accurate fault location effect of the system in this article. The accuracy, precision, and recall rate of the fault location system in this article were higher than the values of traditional fault location. This was mainly because the fault location application of the system in this article, GIS, could accurately connect the fault with the actual geographical location, thereby ensuring the accuracy of fault point positioning. The fault location accuracy of the system in this article achieved the lowest of 95% in the third attempt and the highest of 98% in the sixth attempt. The average accuracy of fault location for the system in this article was 96.5%, and the average positioning accuracy was 96.3%. The average positioning recall rate was 91.5%. After conducting GIS analysis on the collected fault information, the accuracy of fault location could be improved accurately.
4.3 Fault monitoring effect
The occurrence of PG faults can cause regional power outages. This article compares the fault monitoring effectiveness of an intelligent PG fault monitoring system based on the IoT and GIS with traditional PG fault monitoring methods. The efficiency of troubleshooting, real-time performance of fault monitoring, and convenience of fault monitoring were represented by indicators a, b, and c. Figure 5 shows the comparison results.
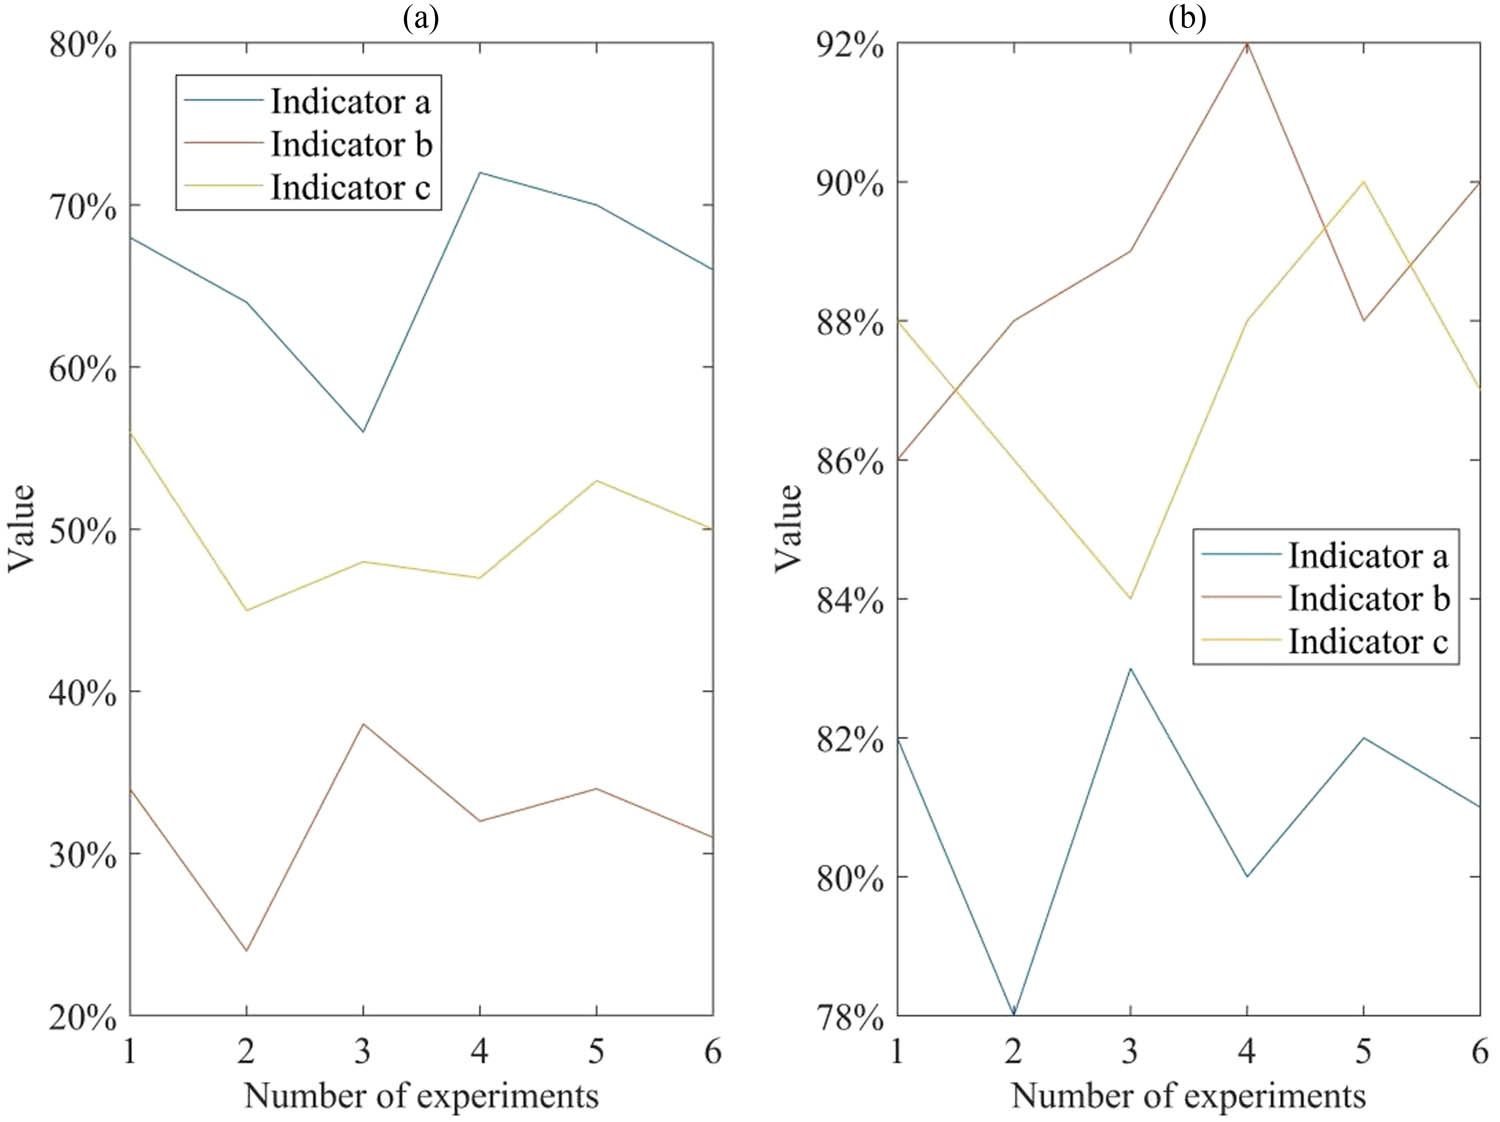
Comparison results of fault monitoring effects. (a) Traditional fault monitoring effect, (b) the effectiveness of system fault monitoring in this article.
Figure 5(a) displays the traditional fault monitoring effect was described. Through six experiments, the efficiency of troubleshooting, real-time monitoring, and convenience of traditional PG fault monitoring methods were analyzed. The traditional troubleshooting efficiency achieved a lowest of 56% in the third attempt and a highest of 72% in the fourth attempt. The average troubleshooting efficiency was 66.0%. The real-time performance of traditional fault monitoring was not good, reaching a lowest of 24% in the second time and a highest of 38% in the third time. The average real-time performance of fault monitoring was 32.2%. The real-time performance of fault monitoring was poor. This was mainly because traditional fault monitoring methods required manual inspection to monitor faults, making it difficult to detect PG faults in a timely manner. The convenience of traditional fault monitoring achieved a lowest of 45% in the second attempt and a highest of 56% in the first attempt. The convenience of average fault monitoring was 49.8%. Figure 5(b) displays the system fault monitoring effect of this article. The troubleshooting efficiency of the system in this article achieved a lowest of 78% in the second attempt and a highest of 83% in the third attempt. The average troubleshooting efficiency was 81.0%. The intelligent monitoring system for PG faults in this article has higher troubleshooting efficiency, real-time fault monitoring, and convenience than traditional methods. The average real-time fault monitoring performance of the system in this article was 88.8%, and the convenience of average fault monitoring was 87.2%. The intelligent monitoring system for PG faults using the IoT and GIS could effectively improve the effectiveness of fault monitoring.
4.4 Power supply effect
The purpose of monitoring PG faults, analyzing the causes of faults, locating the location of fault points, and conducting timely maintenance is to solve PG faults. This article compares the power supply effectiveness of two PG fault monitoring methods. The power supply quality, power supply reliability, and PG management level were represented by indicators d, e, and f. Figure 6 shows the comparison results.
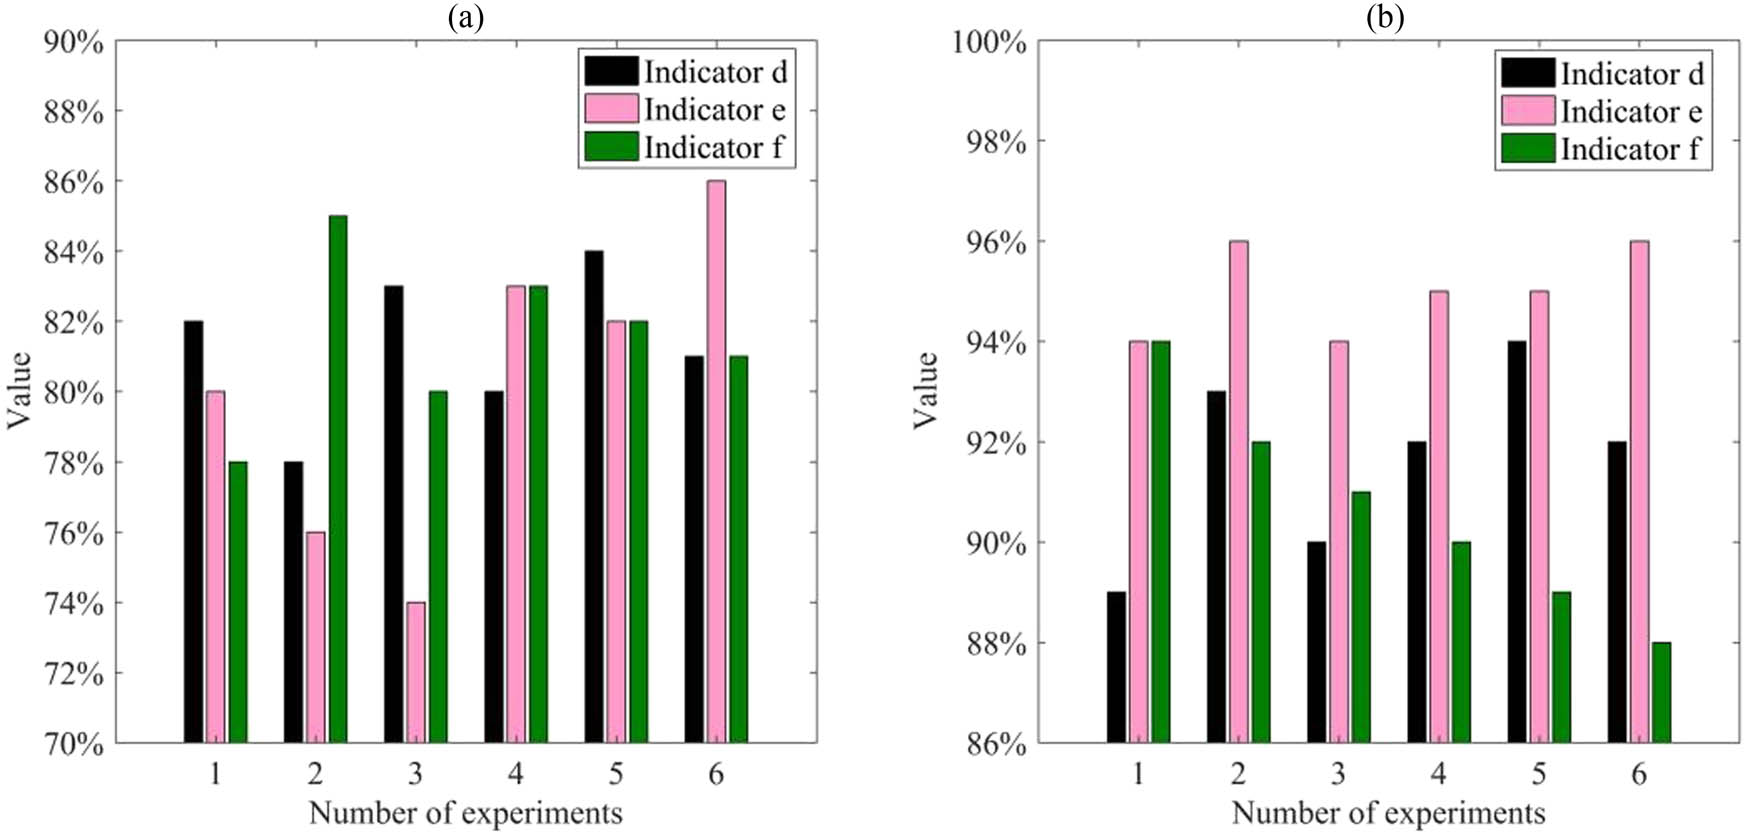
Comparison results of power supply effect. (a) Traditional power supply effect, (b) the power supply effect of the system in this article.
Figure 6(a) displays the power supply effect of the traditional method. The power supply quality of traditional PG fault monitoring methods achieved the lowest of 78% in the second time and the highest of 84% in the fifth time. The average power supply quality was 81.3%. The power supply quality of traditional PG fault monitoring methods did not reach a very high value. This was mainly because traditional PG fault monitoring methods were difficult to accurately analyze the cause of faults and solve the problem. The power supply reliability of traditional PG fault monitoring methods achieved the lowest of 74% in the third time and the highest of 86% in the sixth time. The average power supply reliability was 80.2%. The average PG management level of traditional methods was 81.5%. Figure 6(b) displays the power supply effect of the system in this article was described. The power supply quality, power supply reliability, and PG management level of the system in this article were all higher than traditional methods. This was mainly because the system in this article could use IoT technology to quickly obtain PG information and conduct accurate analysis, thus achieving rapid fault location. The power supply quality of the system in this article achieved the lowest of 89% in the first attempt and a highest of 94% in the fifth attempt. The average power supply quality was 91.7%. The average power supply reliability of the system in this article was 95.0%, and the average PG management level was 90.7%. The intelligent monitoring system for PG faults using the IoT and GIS could improve the quality of power supply.
5 Conclusions
This article applied the IoT and GIS to construct an intelligent monitoring system for PG faults and used sensing devices to collect the changes in current in the circuit. The fault information was transmitted back to the monitoring center through ZigBee communication technology, and the fault information was analyzed using GIS to locate the geographical location of the fault. The experimental results showed that the intelligent monitoring system for PG faults in this article had higher accuracy in fault detection and fault location, which effectively improved the effectiveness of PG fault monitoring. The intelligent monitoring system for PG faults based on the IoT and GIS could accurately locate the fault location, which was conducive to timely fault repair. However, this article only conducted fault monitoring analysis on overhead lines without analyzing cable lines. Conducting experimental analysis on cable lines and observing the fault monitoring effect of the system in this paper would be the direction of future research.
-
Funding information: Author states no funding involved.
-
Author contributions: Author has accepted responsibility for the entire content of this manuscript and approved its submission.
-
Conflict of interest: Author states no conflict of interest.
-
Data availability statement: The data underlying the results presented in the study are available within the manuscript.
References
[1] Hayat MB, Danish A, Keitumetse CM, Lana A, Niaz A. Solar energy—A look into power generation, challenges, and a solar‐powered future. Int J Energy Res. 2019;43(3):1049–67.10.1002/er.4252Search in Google Scholar
[2] Ahmadi MH, Mahyar G, Milad S, Mohammad AN, Ravinder K, Abbas N, et al. Solar power technology for electricity generation: A critical review. Energy Sci Eng. 2018;6(5):340–61.10.1002/ese3.239Search in Google Scholar
[3] Gopakumar P, Balimidi M, Maddikara JBR, Dusmanta KM. Remote monitoring system for real time detection and classification of transmission line faults in a power grid using PMU measurements. Prot Control Mod Power Syst. 2018;3(1):1–10.10.1186/s41601-018-0089-xSearch in Google Scholar
[4] Abbasi AR, Mohammad RM, Zakieh A. Diagnosis and clustering of power transformer winding fault types by cross‐correlation and clustering analysis of FRA results. IET Gener Transm Distrib. 2018;12(19):4301–9.10.1049/iet-gtd.2018.5812Search in Google Scholar
[5] Patel HR, Shah VA. Fault detection and diagnosis methods in power generation plants-the Indian power generation sector perspective): An introductory review. PDPU J Energy Manag. 2018;2(2):31–49.Search in Google Scholar
[6] Yasinzadeh M, Mahdi A. Detection of PMU spoofing in power grid based on phasor measurement analysis. IET Gener Transm Distrib. 2018;12(9):1980–7.10.1049/iet-gtd.2017.1445Search in Google Scholar
[7] Jiang JA, Wang JC, Wu HS, Lee CH, Chou CY, Wu LC, et al. A novel sensor placement strategy for an IoT-based power grid monitoring system. IEEE Internet Things J. 2020;7(8):7773–82.10.1109/JIOT.2020.2991610Search in Google Scholar
[8] Liu J, Ziyan Z, Jerry J, Hu ML. Research and application of wireless sensor network technology in power transmission and distribution system. Intell Converged Netw. 2020;1(2):199–220.10.23919/ICN.2020.0016Search in Google Scholar
[9] Shakya S. A self monitoring and analyzing system for solar power station using IoT and data mining algorithms. J Soft Comput Paradig. 2021;3(2):96–109.10.36548/jscp.2021.2.004Search in Google Scholar
[10] Zhao YH, Loke KF. Predicting electrical power output of combined cycle power plants using a novel artificial neural network optimized by electrostatic discharge algorithm. Measurement. 2022;198:111405.10.1016/j.measurement.2022.111405Search in Google Scholar
[11] Ding J, Cunbin L. Project team incentive of the power grid enterprise in China. Adv Ind Eng Manag. 2019;8(2):82–5.Search in Google Scholar
[12] Ray PP. A survey on Internet of Things architectures. J King Saud Univ-Comput Inf Sci. 2018;30(3):291–319.10.1016/j.jksuci.2016.10.003Search in Google Scholar
[13] Sitton C. Reactive power optimization of power system based on distributed cooperative particle swarm optimization algorithm. Distrib Process Syst. 2020;1(2):46–53.10.38007/DPS.2020.010206Search in Google Scholar
[14] Ahmed N, Sadik KG, Ammar HM, Abdolrasol MGM. Children tracking system based on zigbee wireless network and neural network. J Tech. 2023;5(1):103–13.10.51173/jt.v5i1.838Search in Google Scholar
[15] Nazir MS, Wang Q. Impact of symmetrical short-circuit fault on doubly-fed induction generator controller. Int J Electron. 2020;107(12):2028–43.10.1080/00207217.2020.1756447Search in Google Scholar
[16] Xu G, Wang Z, Zhou J, Li Z, Zhan Y, Zhao H, et al. Rotor loss and thermal analysis of synchronous condenser under single-phase short-circuit fault in the transmission line. IEEE Trans Energy Convers. 2021;37(1):274–85.10.1109/TEC.2021.3109608Search in Google Scholar
[17] McKitrick MK, Nadine S, Crooks VA. Collecting, analyzing, and visualizing location-based social media data: review of methods in GIS-social media analysis. GeoJournal. 2023;88(1):1035–57.10.1007/s10708-022-10584-wSearch in Google Scholar
[18] Prasetyo DY. Implementasi Geographic Information System Gis Penentuan Tampat Ibadah Masjid Di Kecamatan Kempas Kabupaten Indragiri Hilir Provinsi Riau. Sistemasi: J Sist Inf. 2019;8(1):10–8. (in Indonesian)10.32520/stmsi.v8i1.403Search in Google Scholar
[19] Ganiyev Y, Qosimov LM, Murodilov KT. Creating agricultural maps using geo-information systems as an example of Bandikhan district. Finland Int Sci J Educ Soc Sci Humanit. 2023;11(3):1132–40.Search in Google Scholar
[20] Tian C, Xu Z, Wang L, Liu Y. Arc fault detection using artificial intelligence: Challenges and benefits. Math Biosci Eng. 2023;20(7):12404–32.10.3934/mbe.2023552Search in Google Scholar PubMed
© 2023 the author(s), published by De Gruyter
This work is licensed under the Creative Commons Attribution 4.0 International License.
Articles in the same Issue
- Research Articles
- The regularization of spectral methods for hyperbolic Volterra integrodifferential equations with fractional power elliptic operator
- Analytical and numerical study for the generalized q-deformed sinh-Gordon equation
- Dynamics and attitude control of space-based synthetic aperture radar
- A new optimal multistep optimal homotopy asymptotic method to solve nonlinear system of two biological species
- Dynamical aspects of transient electro-osmotic flow of Burgers' fluid with zeta potential in cylindrical tube
- Self-optimization examination system based on improved particle swarm optimization
- Overlapping grid SQLM for third-grade modified nanofluid flow deformed by porous stretchable/shrinkable Riga plate
- Research on indoor localization algorithm based on time unsynchronization
- Performance evaluation and optimization of fixture adapter for oil drilling top drives
- Nonlinear adaptive sliding mode control with application to quadcopters
- Numerical simulation of Burgers’ equations via quartic HB-spline DQM
- Bond performance between recycled concrete and steel bar after high temperature
- Deformable Laplace transform and its applications
- A comparative study for the numerical approximation of 1D and 2D hyperbolic telegraph equations with UAT and UAH tension B-spline DQM
- Numerical approximations of CNLS equations via UAH tension B-spline DQM
- Nonlinear numerical simulation of bond performance between recycled concrete and corroded steel bars
- An iterative approach using Sawi transform for fractional telegraph equation in diversified dimensions
- Investigation of magnetized convection for second-grade nanofluids via Prabhakar differentiation
- Influence of the blade size on the dynamic characteristic damage identification of wind turbine blades
- Cilia and electroosmosis induced double diffusive transport of hybrid nanofluids through microchannel and entropy analysis
- Semi-analytical approximation of time-fractional telegraph equation via natural transform in Caputo derivative
- Analytical solutions of fractional couple stress fluid flow for an engineering problem
- Simulations of fractional time-derivative against proportional time-delay for solving and investigating the generalized perturbed-KdV equation
- Pricing weather derivatives in an uncertain environment
- Variational principles for a double Rayleigh beam system undergoing vibrations and connected by a nonlinear Winkler–Pasternak elastic layer
- Novel soliton structures of truncated M-fractional (4+1)-dim Fokas wave model
- Safety decision analysis of collapse accident based on “accident tree–analytic hierarchy process”
- Derivation of septic B-spline function in n-dimensional to solve n-dimensional partial differential equations
- Development of a gray box system identification model to estimate the parameters affecting traffic accidents
- Homotopy analysis method for discrete quasi-reversibility mollification method of nonhomogeneous backward heat conduction problem
- New kink-periodic and convex–concave-periodic solutions to the modified regularized long wave equation by means of modified rational trigonometric–hyperbolic functions
- Explicit Chebyshev Petrov–Galerkin scheme for time-fractional fourth-order uniform Euler–Bernoulli pinned–pinned beam equation
- NASA DART mission: A preliminary mathematical dynamical model and its nonlinear circuit emulation
- Nonlinear dynamic responses of ballasted railway tracks using concrete sleepers incorporated with reinforced fibres and pre-treated crumb rubber
- Two-component excitation governance of giant wave clusters with the partially nonlocal nonlinearity
- Bifurcation analysis and control of the valve-controlled hydraulic cylinder system
- Engineering fault intelligent monitoring system based on Internet of Things and GIS
- Traveling wave solutions of the generalized scale-invariant analog of the KdV equation by tanh–coth method
- Electric vehicle wireless charging system for the foreign object detection with the inducted coil with magnetic field variation
- Dynamical structures of wave front to the fractional generalized equal width-Burgers model via two analytic schemes: Effects of parameters and fractionality
- Theoretical and numerical analysis of nonlinear Boussinesq equation under fractal fractional derivative
- Research on the artificial control method of the gas nuclei spectrum in the small-scale experimental pool under atmospheric pressure
- Mathematical analysis of the transmission dynamics of viral infection with effective control policies via fractional derivative
- On duality principles and related convex dual formulations suitable for local and global non-convex variational optimization
- Study on the breaking characteristics of glass-like brittle materials
- The construction and development of economic education model in universities based on the spatial Durbin model
- Homoclinic breather, periodic wave, lump solution, and M-shaped rational solutions for cold bosonic atoms in a zig-zag optical lattice
- Fractional insights into Zika virus transmission: Exploring preventive measures from a dynamical perspective
- Rapid Communication
- Influence of joint flexibility on buckling analysis of free–free beams
- Special Issue: Recent trends and emergence of technology in nonlinear engineering and its applications - Part II
- Research on optimization of crane fault predictive control system based on data mining
- Nonlinear computer image scene and target information extraction based on big data technology
- Nonlinear analysis and processing of software development data under Internet of things monitoring system
- Nonlinear remote monitoring system of manipulator based on network communication technology
- Nonlinear bridge deflection monitoring and prediction system based on network communication
- Cross-modal multi-label image classification modeling and recognition based on nonlinear
- Application of nonlinear clustering optimization algorithm in web data mining of cloud computing
- Optimization of information acquisition security of broadband carrier communication based on linear equation
- A review of tiger conservation studies using nonlinear trajectory: A telemetry data approach
- Multiwireless sensors for electrical measurement based on nonlinear improved data fusion algorithm
- Realization of optimization design of electromechanical integration PLC program system based on 3D model
- Research on nonlinear tracking and evaluation of sports 3D vision action
- Analysis of bridge vibration response for identification of bridge damage using BP neural network
- Numerical analysis of vibration response of elastic tube bundle of heat exchanger based on fluid structure coupling analysis
- Establishment of nonlinear network security situational awareness model based on random forest under the background of big data
- Research and implementation of non-linear management and monitoring system for classified information network
- Study of time-fractional delayed differential equations via new integral transform-based variation iteration technique
- Exhaustive study on post effect processing of 3D image based on nonlinear digital watermarking algorithm
- A versatile dynamic noise control framework based on computer simulation and modeling
- A novel hybrid ensemble convolutional neural network for face recognition by optimizing hyperparameters
- Numerical analysis of uneven settlement of highway subgrade based on nonlinear algorithm
- Experimental design and data analysis and optimization of mechanical condition diagnosis for transformer sets
- Special Issue: Reliable and Robust Fuzzy Logic Control System for Industry 4.0
- Framework for identifying network attacks through packet inspection using machine learning
- Convolutional neural network for UAV image processing and navigation in tree plantations based on deep learning
- Analysis of multimedia technology and mobile learning in English teaching in colleges and universities
- A deep learning-based mathematical modeling strategy for classifying musical genres in musical industry
- An effective framework to improve the managerial activities in global software development
- Simulation of three-dimensional temperature field in high-frequency welding based on nonlinear finite element method
- Multi-objective optimization model of transmission error of nonlinear dynamic load of double helical gears
- Fault diagnosis of electrical equipment based on virtual simulation technology
- Application of fractional-order nonlinear equations in coordinated control of multi-agent systems
- Research on railroad locomotive driving safety assistance technology based on electromechanical coupling analysis
- Risk assessment of computer network information using a proposed approach: Fuzzy hierarchical reasoning model based on scientific inversion parallel programming
- Special Issue: Dynamic Engineering and Control Methods for the Nonlinear Systems - Part I
- The application of iterative hard threshold algorithm based on nonlinear optimal compression sensing and electronic information technology in the field of automatic control
- Equilibrium stability of dynamic duopoly Cournot game under heterogeneous strategies, asymmetric information, and one-way R&D spillovers
- Mathematical prediction model construction of network packet loss rate and nonlinear mapping user experience under the Internet of Things
- Target recognition and detection system based on sensor and nonlinear machine vision fusion
- Risk analysis of bridge ship collision based on AIS data model and nonlinear finite element
- Video face target detection and tracking algorithm based on nonlinear sequence Monte Carlo filtering technique
- Adaptive fuzzy extended state observer for a class of nonlinear systems with output constraint