Design of evaluation tool used to improve the production process
-
Hlatká Martina
 ,
Korec Karel
,
Korec Karel

Abstract
This paper is devoted to the use of statistical methods to ensure the highest quality processes. Specifically, it deals with creating an application in MS Excel which evaluates standard statistical parameters and if the required process capability indices are complied with, then it is possible to proceed to SPC (statistical process control). The application was created in MS Excel using the Visual Basic for Application programming language. In addition to the required calculations, the application also generates forms with all important data. This application was designed to reduce reject rate and improve the production process in a contracting company.
1 Introduction
Nowadays we meet with the term quality in all fields. For this reason, the question of quality is inherent in our lives. The concept of quality can be found on the side of supply as well as on the side of demand, whether we evaluate the quality of food, the quality of education, or the quality of services provided. To be able to meet their quality standards, companies must first and foremost focus on the quality of their processes. The process quality is not only characterized by its output, but by all interactions within the process and on its interface. This paper is focused on the use of statistical methods in ensuring the quality of processes in a manufacturing company. The current market situation, whether national or international, is very complex and the market environment is highly competitive. Every organization is fighting for its position on the market and wants to maintain the uniqueness of its products or services. They make an effort to have a competitive advantage and thus a lead over others. The competitive advantage of Chinese companies is in the price of their products, which stem from mass production. Therefore, it is important to think about the competitive advantage of Czech companies. This very quality is one of the competitive advantages of Czech companies. There are many definitions of quality in professional literature. However, it should be noted that quality is associated with customers and their requirements.
2 The assignment and methodology of the study
The paper originated from the requirements of a Czech company Alfa s.r.o., which deals with a specific quality problem. Alfa s.r.o. is engaged in the production of profiles for automotive industry. The company did not wish to be named and therefore it appears in the whole paper under the name Alfa s.r.o. The research will be carried out specifically on a profiled reinforcement for cars. The reinforcement is provided with several openings, some of them for fastening during technological operations and others for mounting directly on the vehicle. Recently, the number of nonconforming products has increased in the production and the company has had long-term problems with evaluating process capability indices as they are called. The values of these indices are a significant feature of the process quality [1]. These are important values for customers, who require a certain minimum threshold for these indices. A specific requirement of the company was to automate the calculations which Alfa s.r.o. has so far done manually and in a very complicated way. The outcome of this paper will be the introduction of SPC (statistical process control). This regulation will be logically linked to the calculated process capability indices and it represents an integral part of the procedures of quality assurance and quality improvement [2]. SPC is particularly important in the regulation of the production process. SPC has a preventive character. By continuous monitoring of quantitative (possibly also qualitative) features, negative trends can be identified. By early intervention, it is possible to prevent the occurrence of non-conformance. The introduction of SPC minimizes the occurrence of rejects and makes the whole process less expensive and more efficient. Another advantage will be that the course of monitored features of quality can be graphically recorded [3, 4]. The solution of SPC regulation will be provided by a tool that will be created in MS Excel. It will be a regulatory card in which the measured values will be recorded manually. Many types of regulatory cards have been described in the literature. The most basic one, based on monitoring deviations from the nominal size, was applied in this case. The values are then converted into graphical output in the form of a line graph that visualizes the entire process. The functionality of this evaluation tool will be verified on a selected product, including the interpretation of all detected data that were recorded on the graphics card.
A process is characterized as “a set of interrelated or interacting activities that transform inputs into outputs”. The process itself can be divided into several sub-processes [5]. Each process or sub-process should have its owner who is responsible for it. The result of each process is a product that can be divided into several categories. The quality of the process is based on several basic areas such as people, machines and tools, materials, procedures, environment, and measurement [6]. It is the appropriate setting of these areas which enables the company to achieve the desired or highest quality of the entire process. The static capability of the process is a determining factor for the quality of the final product. It is evaluated by means of process capability indices Cp and Cpk. The task of statistical process control is to intervene in a process if it shows some signs of instability [7, 8]. The most suitable tool for SPC applications are “Shewhart control charts”. There are two basic types of control charts: for position monitoring (in which the average value of n measurements of a given critical feature is plotted) and for variability monitoring (in which the sample standard deviation [s], or a range [R] of values from n measurements of the given critical feature is plotted). This plotting of values takes place precisely within a specified time interval so as to cover the entire process [9, 10].
2.1 The calculation metodology
In technical practice a product is assessed according to a set of qualitative and quantitative features. Only quantitative indicators will be considered in this study. Table 1 shows the basic variables needed for this study. Some of these basic indicators are explained in more detail below [11].
The overview of used quantities [Source: The authors]
| x | Arithmetic mean of the sample | MZH | Upper control limit |
| xi | i-th sample value | MZD | Lower control limit |
| n | Number of sample values | USL | Upper tolerance limit |
| s | Sample standard deviation | LSL | Lower tolerance limit |
| σ | Standard deviation | R | Range |
| Cp | Process capability index - range | Me | Median |
| Cpk | Process capability index - position | T | Width of the tolerance field |
| ST | Centre of tolerance |
Normal Gaussian probability distribution – this distribution is shown by means of the probability density of Gaussian curve. For quality evaluation, a very important feature of the normal distribution is the possible estimation of frequency occurrence. Within the standard deviation interval (σ), 68.2% of the values occur in the normal distribution. The aim in technical practice is to ensure that all values of the critical feature lie within 6 σ interval. Then there is the evaluation of the mutual ratio of the width of the tolerance field to the variability of the feature measured by the estimate of the standard deviation [12].
Histogram – it is a tool by means of which it is possible to graphically represent the distribution of measured values frequency. In technical practice, the compilation of a histogram is necessary not only for determining the process capability, but also for other control activities [12, 13].
Arithmetic mean – is a quantity that expresses the typical value of a set of many values. It is expressed by the relationship:
Sample standard deviation and standard deviation – the sample standard deviation (s) is the square root of the sample variance. The standard deviation (σ) represents the mean of feature values deviations from its arithmetic mean [14, 15]. They are given by the relationships:
Median and range – are mainly used in SPC. There are several basic types of control charts that monitor the process in terms of mean, median, or range of detected values. It depends on the method of production and the type of measurable feature. Range (R) is the difference between the maximum and minimum measured values. Median (Me) is the middle value when sorting the data by size. When the number of values is odd, it is the arithmetic mean of two middle values [16, 17].
Process capability indicesCpandCpk – Cp index represents the potential of the process. It refers to the ratio of the width of the tolerance field to six times multiplied (sample) standard deviation σ (s). The mentioned potential lies in the ability/capability of the process to maintain a given critical feature not only within the tolerance limits, but especially within 6 σ interval. The position of the measured values within the tolerance field is not determined at this stage of the calculation [18].
Calculating the position of the data within the tolerance field is the task of the other process capability index. If Cp is the potential of the process, then Cpk is the exploitation of that potential. The mean value of the data against the upper/ lower tolerance limit at half of the interval is compared. The smaller value is then considered relevant.
The process capability index (Cp) values are defined by the boundaries against which they are assessed. Interval (0; 1) represents poor quality of the process. Interval <1; 1.33) represents the elementary quality of the process, but does not meet the general process quality requirement. This requirement is to achieve a minimum capability index of 1.33. Consequently, the interval <1.33; 1.67) is generally accepted as evidence of process quality and capability. An interval <1.67; 2.00) is generally required in the automotive industry. The probability distribution characteristics represented by Gaussian curve are derived from these intervals. Knowing the characteristics of Gaussian distribution, the calculated standard deviation, and the width of the tolerance field, it can be easily deduced that, at Cp = 1, there will be 2,700 non-conformities from 1 million pieces; at Cp = 1.33 there will be 64 nonconformities, and at Cp = 1.67, there will be 0.6 nonconforming pieces. All this at the significance level of the test α = 0.05.
Calculation of control limits – the control limits represent a narrowing of the tolerance field. They serve for preventive control of the process—if the monitored feature exceeds this limit (the feature is still inside the tolerance field), the process control is necessary so that the values of the monitored feature return to the centre of the tolerance field [19, 20, 21]. To determine the control limits, it is necessary to know the calculated value of process capability index Cp, the width of the tolerance field T, the tolerance centre ST and the coefficient K2 (this is given by ČSN ISO 8258). The coefficient K3 is used to calculate the control limits for variability monitoring. This coefficient depends on whether the number of measurements n is carried out in the range n = 3 or in the range n = 5. The calculation of control limits is calculated according to the relationship:
2.1.1 Research
The company production batches are of a serial, or in some cases large-scale character. Every piece that leaves production must meet demanding quality criteria. From the time point of view, it is not possible to subject each part to a 100% check, and random control is not a sufficiently robust solution. In the current state of (not) monitoring of the processes it was not possible to react flexibly and only consequences were dealt with usually in the form of a 100% measurement of the faulty batch and sorting of nonconforming pieces. In order to meet demanding customer requirements, a statistical evaluation of the capability of existing processes had to be carried out. This is a difficult and time-consuming procedure, as many ineligible processes were identified and had to be modified (technology adjustment, machine adjustment, measuring instruments, etc.) to become eligible. All this generates a huge amount of data, the processing of which must be as automated as possible. Recently, there has been a significant deterioration in quality in the production process. Approximately 35% of individual products did not reach the required values. Customers are currently requesting re-verification of process capability indices. For each part type at a different time interval. For this reason, a large amount of data is generated which needs to be processed and evaluated. Critical features of a part are measured on the specified measuring instrument. Figure 1 shows the graphical output from the critical point measurement and the prescribed value for a given position in each axis, as well as the actual measured value, the allowed deviation and the actual deviation.

Graphical output from the measuring instrument
A detailed analysis of the current situation made several fundamental findings. The measurement is performed on a high-quality 3D coordinate instrument with sufficient accuracy. Therefore, the measurement methodology is working well. The problem is especially the export of data from this device. Currently, a document created in MS Excel is used for this purpose, which has several dis-advantages. 1. Only 10 values can be exported. In a situation where even 50 values are required for the calculation, the export must be performed multiple times, generating possible errors. 2. The document is very confusing, with many unnecessary fields, the operators largely do not understand it. 3. Some automated calculations are at variance with the methodology for determining process capability indices and the calculated data are therefore irrelevant. 4. The source code of macro (the program in the VBA environment, which is part of MS Excel) is uneditable and confusing. In addition, potential comments are in French; even experienced programmers find it difficult to understand it. This is caused by the fact that this document was provided by the headquarters in France many years ago. At the moment, it is a black box that nobody understands.
Based on these main shortcomings, a new evaluation form must be created. The requirements for the new evaluation form are as follows. 1 Effort for maximum simplicity and clarity so that the form fully fulfils its function and the operator understands it completely. 2 Large-scale data import, even several quality features at once. 3 The output must also be understandable to the customer so that the process capability can be declared without any problems. For this reason, the document will be multilingual— the language will be selectable and the document will be exported in that language. 4 Comprehensible and editable source code to make it easy to respond to changes in the future in a flexible way. Purchasing software would be inefficient, because the acquisition of new development environments ranges from 80,000 to 180,000 CZK. These types of software are much more sophisticated, but they are also often difficult to operate. Their use is one-time and thus uneconomical. A combination of standard MS Excel and VBA functions will be used to meet the requirements of the company. All evaluation functions, be it calculations of individual statistical quantities or graphical outputs, will be provided by calculation or display functions of MS Excel. A program will be created in the VBA environment, sometimes called a macro, which is used for mass automatic import of data from the source file.
The evaluation tool has to fulfil many functions such as clarity, simplicity, user-friendly interface, and above all the possibility of large-scale data processing as data changes based on their import. The identification field is shown in Figure 2.
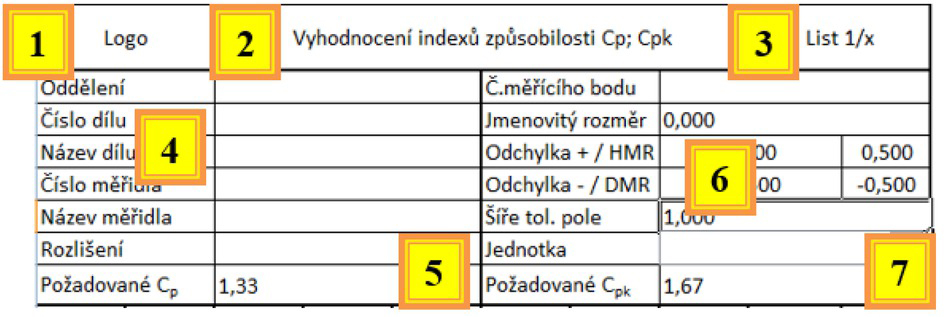
Identification field of the evaluation tool
Company logo that serves as an identifier.
The name of the form, which is multilingual.
Data will be imported en masse; one form will be available for each critical feature. For this reason, they will be numbered.
The identifier of a part and measuring instrument. To measure each measuring point, the measuring instrument has to be precisely specified.
The required values of Cp and Cpk are necessary to determine whether the process is statistically eligible or not. Customers may require different values of eligibility indices.
The values of the specified tolerances and the sub-sequent automatic calculation of the tolerance field width are the basic input values for the calculation of process capability indices.
The SI units used, whether basic or derived, are an essential part of the identification of each dimension.
This is the introductory part of the form. Now there is another part where the measured values will be filled. The column labelled i shows the order number of the measured values. They are listed chronologically. In Xi column, the values are assigned to the order number i. Conditional formatting has been implemented in the evaluation tool, which indicates a field with an off-tolerance value in red. This is shown in Figure 3.

Imported data
In the third part of the form there are graphs that are updated according to the loaded data. In the upper part of the figure, there is a histogram with a Gaussian curve. Its lower part depicts a graph showing the course of the measurement. This allows the operator to detect any fluctuations or inconsistencies. This is shown in Figure 4.

Graphic part of the form
And the last part of the form consists of calculations of basic statistical indicators, including calculation of process capability indices. To these evaluations were added additional calculations (skewness and kurtosis of value distribution), which have the character of additional information in the form of Gaussian curve. Evaluation of the process capability index also includes their evaluation by means of emoticons. It is a visualization so that even an untrained worker can quickly and safely determine the outcome of the process capability index calculation. This is shown in Figure 5.
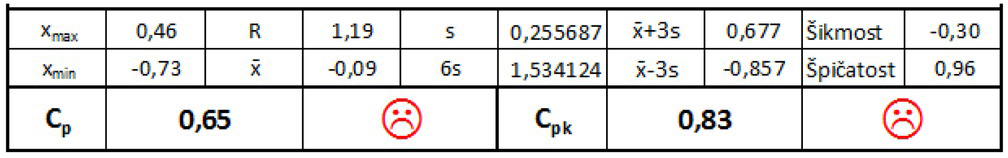
Calculation part of the form
In this research the evaluated quantities are as follows:
Xmax and Xmin are limit values found within a given measuring point, they are source data for further calculations.
R is the difference between the maximum and minimum values found within a given measurement feature. It is only of informative value for research purposes, but is generally an important parameter.
x represents the mean value for all measured values of a given measuring point, it is the source data for further calculations.
s is the sample standard deviation, whose function and purpose have been explained in the methodology, it is the most basic parameter.
x + 3s; x − 3s characterize the probability of occurrence of measured values in the interval of 6s, the centre of this interval being the average value of x.
Skewness and kurtosis are additional information on the distribution of values. The skewness determines in which direction the variable is asymmetrically distributed. Positive values indicate right-hand skewness - most of the measured values are above the average. Negative values logically indicate left-side skewness - most of the measured values are below the average. The ideal (totally symmetrical) distribution of values is characterized by the value 0. The kurtosis then indicates the way in which very high or too low values occur in the frequency distribution. A positive value indicates a “sharper” distribution of values, i.e. a ratio of higher frequencies near the mean. 0 characterizes the normal distribution of values and a negative value indicates that the difference between individual frequencies is minimal, the distribution of values is even.
Evaluation of Cp and Cpk is performed according to the procedures mentioned above. An important visual aspect is the added emoticon, which complements the numerical evaluation. It is a confirmation of a “good” or “bad” result. There are two reasons for its implementation in the evaluation tool. Firstly, it serves as a visual complement to the result and secondly it is a kind of assurance of correct evaluation. It may happen that the resulting process capability index is higher than 1.33, which in most cases indicates a satisfactory result. But the customer may require a capability index higher than 1.67 or even higher, and in this case there is some potential for poor evaluation. An inexperienced operator may consider a result higher than 1.33 good and may not notice that the customer is requesting a higher process capability index value. The added emoticon prevents incorrect evaluation. Moreover, this processed form can generate a summary overview of the evaluation of all measuring points.
Operating the created program is very simple. A manual has been drawn up for this by agreement. An input cutout of the evaluation tool is shown in Figure 6.

Calculation part of the form
The “import” button is used to import data from the source file. When activated, a dialog box appears with the path to the folder with the source files already defined, the operator then just selects the necessary source file.
It is important that the imported data are always in the same fields. Once the evaluation tool is selected and confirmed with the button, they are automatically loaded into the tool. Originally, the data was imported after 10 measurements. Currently, 30 values can be retrieved for each import. For this reason, the import will take place twice. The first 30 values at first import and the remaining 20 values are loaded in the same way. However, the source file must be filled with new data. Information about the required tolerances for each measuring point is copied from the source file together with the measured values. After the import, all the necessary evaluations are automatically performed and the required forms can be printed immediately. The evaluation form can be flipped into several language versions - Czech is set by default and according to customer requirements it is possible to choose German or English version. If necessary, you can easily edit the source code and add another language version. The evaluation tool implements minor functions that do not directly contribute to the program’s functional properties. E.g. all automatic calculations are regulated so that there is no division by zero under any circumstances or error values of type #DIV or #N/A do not appear in empty cells. These cosmetic modifications serve to make the form better arranged.
3 Research findings
Based on the request of the company, an evaluation tool was created to ensure the required quality of pressed products. The basis of the evaluation tool is a macro. It is a program created in the Visual Basic for Application object programming language. The advantage of this programming language is that it is an integral part of MS Excel. With VBA, you can create a wealth of applications that can serve as inspiration or as a basis for the program you create. Data processing is the essence of the evaluation tool. Complex evaluation tool is shown in Figure 7.

Visualization of the evaluation tool
4 Conclusion
This paper was created on the basis of the request of Alfa s.r.o. In order to increase the quality and transparency of their processes, an evaluation tool was designed. This research also entailed increased demands on accuracy and, in particular, knowledge of the methods and procedures used. To be able to design an evaluation system it was necessary to get acquainted with the individual processes and activities taking place in the company. This was largely due to records of rejects of individual products and errors of individual workers in manual calculations. Based on the conducted surveys, there were requirements for an evaluation tool that will be used to evaluate selected statistical characteristics of a given process. A great benefit for the company is the facilitation and abandonment of inefficient and inaccurate calculation of process capability indices. It is the acceleration and accuracy of these calculations that will help to reduce the reject rate of the products, to ensure the preventive character of manufacturing process corrections and, last but not least, owing to the linguistic variability of the forms, to facilitate communication with customers.
References
[1] Nenadál, J., Moderní systémy řízení jakosti: quality management. 2. dopl. vyd. Praha: Management Press, 2002, ISBN 80-7261-071-6.Suche in Google Scholar
[2] Veber. J., Řízení jakosti a ochrana spotřebitele 2., aktualiz. vyd. Praha: Grada, 2007, ISBN 978-80-247-1782-1.Suche in Google Scholar
[3] Sika. R., Jarczyńsky A., Kroma A., Metodology of determination of key casting process parameters on DISA MATCH automatic moulding line affecting the formation of alloy-mould contact defects, Lecture Notes in Mechanical Engineering, 2019,pp. 416-43310.1007/978-3-030-16943-5_36Suche in Google Scholar
[4] Lim. S.A.H., Priyono. A., Mohamad. S.F., Introducing a Six Sigma Process Control Technique in a Food Production Line: Step-by-step Guideline and Critical Elements of the Implementation, IEEE 6th InternationalConference on Industrial Engneering and Applications, 2019, pp.338-34210.1109/IEA.2019.8715119Suche in Google Scholar
[5] Čujan. Z., a Málek. Z., Výrobní a obchodní logistika. Zlín: Univerzita Tomáše Bati ve Zlíně, 2008, ISBN 978-80-7318-730-9.Suche in Google Scholar
[6] Wei. F., Huaxue. J., Yin W., Yuchen. F., The influence of software timing error on measurement accuracy of data aquisition, Measurement and Control, 201910.1177/0020294019858093Suche in Google Scholar
[7] Kupka. K., Statistické řízení jakosti: interaktivní analýza a interpretace dat pro řízení jakosti a ekonomiku. Pardubice: TriloByte, 1997, ISBN 80-238-1818-x.Suche in Google Scholar
[8] Stuchlý, J., Statistika I: cvičení ze statistických metod pro man-agery. Vyd. 1. Praha: Vysoká škola ekonomická, 199, ISBN 80-7079-754-1.Suche in Google Scholar
[9] Budíková. M., Králová M., Maroš B., Průvodce základními statistickými metodami. 1. vyd. Praha: Grada 2010, ISBN 978-80-247-3243-5.Suche in Google Scholar
[10] Hindls. R. S., Statistika pro ekonomy. Praha: Professional Publishing 2006, ISBN: 80-86946-16-9Suche in Google Scholar
[11] Marek. L., Statistika pro ekonomy. Praha: Publishing 2007, ISBN 978-80-86946-40-5Suche in Google Scholar
[12] Walker. I., Výzkumné metody a statistika. Praha: Grada Publishing 2013, ISBN 978-80-247-3920-5Suche in Google Scholar
[13] Neubauer. J., Sedlačík M.,Kříž O., Základy statistiky – aplikace v technickcýh a ekonomických oborech. Praha: Grada Publishing 2016, ISBN 978-80-271-9198Suche in Google Scholar
[14] Sachini W.W.N, Weerabu W.M.S.K, Wickramarchchi. I., (2019), Optimization model to enhance the petroleum distribution network in Sri Lanka, Enginnering and Operations Management, 2019 (3) pp. 887-887Suche in Google Scholar
[15] Moneim. A., Ghazy. M., Hassnien. A., Bayesian Estimation of Parameters of Reliability and Maintainability of a Component under Imperfect Repair and Maintenance, Arabian Journal of Science and Engineerng 2019, 44(3), pp. 2497-250210.1007/s13369-018-3206-2Suche in Google Scholar
[16] Bagga. A., Preet S., Squeeze pack a Transfer algorithm: A new over the top compression application for seamless data transfer over wireless network, International Journal of Innovative Technology and Exploring Engineering, 8 (8 Speciallssue 3) 2019, pp. 175-179Suche in Google Scholar
[17] Tarasova. E.V., Moskvicheva. N.V., Nikulina. E.N., (2019), Simulation – Based Improvement in the models for Tool – Inventory Management at Manufacturing Platns, Russian Engineering Research, 39(2), pp. 160-16610.3103/S1068798X19020102Suche in Google Scholar
[18] Rahmanifard. H., Plaksina. T., Hybrid compressed air energy storage, wind and geothermal energy systems in Alberta: Feasibility simulation and economic assessment, Renewable Energy, 2019, 143, pp.453-47010.1016/j.renene.2019.05.001Suche in Google Scholar
[19] Kim. D-S., Park. K-R., Kim. D-H., Kim. J-M., A comparative study on virtual machine model for testing semi-conductor production equipment (2019) International Journal of Innovative Technology and Exploring Engineering 8(8) 2019, ppů 998-100310.35940/ijitee.I1160.0789S19Suche in Google Scholar
[20] Tsarouhas. P., Statistical analysis of failure data for estimating reliability, availability and maintainability of an automated croissant production line, Journal of Quality in Maintenance Engineering 2019.10.1108/JQME-04-2018-0029Suche in Google Scholar
[21] Safarov. D.T., Kasysnov. S.V., Kondrashov. A.G., Informative value of measrements for quality management of auto parts, Lecture Notes in Mechanical Engineering, pp. 1657-1666, 201910.1007/978-3-319-95630-5_177Suche in Google Scholar
© 2019 H. Martina et al., published by De Gruyter
This work is licensed under the Creative Commons Attribution 4.0 International License.
Artikel in diesem Heft
- Regular Article
- Exploring conditions and usefulness of UAVs in the BRAIN Massive Inspections Protocol
- A hybrid approach for solving multi-mode resource-constrained project scheduling problem in construction
- Identification of geodetic risk factors occurring at the construction project preparation stage
- Multicriteria comparative analysis of pillars strengthening of the historic building
- Methods of habitat reports’ evaluation
- Effect of material and technological factors on the properties of cement-lime mortars and mortars with plasticizing admixture
- Management of Innovation Ecosystems Based on Six Sigma Business Scorecard
- On a Stochastic Regularization Technique for Ill-Conditioned Linear Systems
- Dynamic safety system for collaboration of operators and industrial robots
- Assessment of Decentralized Electricity Production from Hybrid Renewable Energy Sources for Sustainable Energy Development in Nigeria
- Seasonal evaluation of surface water quality at the Tamanduá stream watershed (Aparecida de Goiânia, Goiás, Brazil) using the Water Quality Index
- EFQM model implementation in a Portuguese Higher Education Institution
- Assessment of direct and indirect effects of building developments on the environment
- Accelerated Aging of WPCs Based on Polypropylene and Plywood Production Residues
- Analysis of the Cost of a Building’s Life Cycle in a Probabilistic Approach
- Implementation of Web Services for Data Integration to Improve Performance in The Processing Loan Approval
- Rehabilitation of buildings as an alternative to sustainability in Brazilian constructions
- Synthesis Conditions for LPV Controller with Input Covariance Constraints
- Procurement management in construction: study of Czech municipalities
- Contractor’s bid pricing strategy: a model with correlation among competitors’ prices
- Control of construction projects using the Earned Value Method - case study
- Model supporting decisions on renovation and modernization of public utility buildings
- Cements with calcareous fly ash as component of low clinker eco-self compacting concrete
- Failure Analysis of Super Hard End Mill HSS-Co
- Simulation model for resource-constrained construction project
- Getting efficient choices in buildings by using Genetic Algorithms: Assessment & validation
- Analysis of renewable energy use in single-family housing
- Modeling of the harmonization method for executing a multi-unit construction project
- Effect of foam glass granules fillers modification of lime-sand products on their microstructure
- Volume Optimization of Solid Waste Landfill Using Voronoi Diagram Geometry
- Analysis of occupational accidents in the construction industry with regards to selected time parameters
- Bill of quantities and quantity survey of construction works of renovated buildings - case study
- Cooperation of the PTFE sealing ring with the steel ball of the valve subjected to durability test
- Analytical model assessing the effect of increased traffic flow intensities on the road administration, maintenance and lifetime
- Quartz bentonite sandmix in sand-lime products
- The Issue of a Transport Mode Choice from the Perspective of Enterprise Logistics
- Analysis of workplace injuries in Slovakian state forestry enterprises
- Research into Customer Preferences of Potential Buyers of Simple Wood-based Houses for the Purpose of Using the Target Costing
- Proposal of the Inventory Management Automatic Identification System in the Manufacturing Enterprise Applying the Multi-criteria Analysis Methods
- Hyperboloid offset surface in the architecture and construction industry
- Analysis of the preparatory phase of a construction investment in the area covered by revitalization
- The selection of sealing technologies of the subsoil and hydrotechnical structures and quality assurance
- Impact of high temperature drying process on beech wood containing tension wood
- Prediction of Strength of Remixed Concrete by Application of Orthogonal Decomposition, Neural Analysis and Regression Analysis
- Modelling a production process using a Sankey diagram and Computerized Relative Allocation of Facilities Technique (CRAFT)
- The feasibility of using a low-cost depth camera for 3D scanning in mass customization
- Urban Water Infrastructure Asset Management Plan: Case Study
- Evaluation the effect of lime on the plastic and hardened properties of cement mortar and quantified using Vipulanandan model
- Uplift and Settlement Prediction Model of Marine Clay Soil e Integrated with Polyurethane Foam
- IoT Applications in Wind Energy Conversion Systems
- A new method for graph stream summarization based on both the structure and concepts
- “Zhores” — Petaflops supercomputer for data-driven modeling, machine learning and artificial intelligence installed in Skolkovo Institute of Science and Technology
- Economic Disposal Quantity of Leftovers kept in storage: a Monte Carlo simulation method
- Computer technology of the thermal stress state and fatigue life analysis of turbine engine exhaust support frames
- Statistical model used to assessment the sulphate resistance of mortars with fly ashes
- Application of organization goal-oriented requirement engineering (OGORE) methods in erp-based company business processes
- Influence of Sand Size on Mechanical Properties of Fiber Reinforced Polymer Concrete
- Architecture For Automation System Metrics Collection, Visualization and Data Engineering – HAMK Sheet Metal Center Building Automation Case Study
- Optimization of shape memory alloy braces for concentrically braced steel braced frames
- Topical Issue Modern Manufacturing Technologies
- Feasibility Study of Microneedle Fabrication from a thin Nitinol Wire Using a CW Single-Mode Fiber Laser
- Topical Issue: Progress in area of the flow machines and devices
- Analysis of the influence of a stator type modification on the performance of a pump with a hole impeller
- Investigations of drilled and multi-piped impellers cavitation performance
- The novel solution of ball valve with replaceable orifice. Numerical and field tests
- The flow deteriorations in course of the partial load operation of the middle specific speed Francis turbine
- Numerical analysis of temperature distribution in a brush seal with thermo-regulating bimetal elements
- A new solution of the semi-metallic gasket increasing tightness level
- Design and analysis of the flange-bolted joint with respect to required tightness and strength
- Special Issue: Actual trends in logistics and industrial engineering
- Intelligent programming of robotic flange production by means of CAM programming
- Static testing evaluation of pipe conveyor belt for different tensioning forces
- Design of clamping structure for material flow monitor of pipe conveyors
- Risk Minimisation in Integrated Supply Chains
- Use of simulation model for measurement of MilkRun system performance
- A simulation model for the need for intra-plant transport operation planning by AGV
- Operative production planning utilising quantitative forecasting and Monte Carlo simulations
- Monitoring bulk material pressure on bottom of storage using DEM
- Calibration of Transducers and of a Coil Compression Spring Constant on the Testing Equipment Simulating the Process of a Pallet Positioning in a Rack Cell
- Design of evaluation tool used to improve the production process
- Planning of Optimal Capacity for the Middle-Sized Storage Using a Mathematical Model
- Experimental assessment of the static stiffness of machine parts and structures by changing the magnitude of the hysteresis as a function of loading
- The evaluation of the production of the shaped part using the workshop programming method on the two-spindle multi-axis CTX alpha 500 lathe
- Numerical Modeling of p-v-T Rheological Equation Coefficients for Polypropylene with Variable Chalk Content
- Current options in the life cycle assessment of additive manufacturing products
- Ideal mathematical model of shock compression and shock expansion
- Use of simulation by modelling of conveyor belt contact forces