Evaluation the effect of lime on the plastic and hardened properties of cement mortar and quantified using Vipulanandan model
-
Warzer Qadir


Abstract
In this study, the effect of lime content (L %) on the plastic properties such as water-cement ratio (w/c), setting times, flowability, compressive, flexural and bond strengths of cement mortar were investigated. Based on the information in the literature the amount of lime varied between 0 to 45% (by weight of cement). The experimental results were compared with the data collected from different research studies and quantified using two different models. The plastic and hardened properties of the cement mortar modified with different percentage of lime were conducted according to the ASTM and BS standards. Based on the literature data the water to cement ratio (w/c) ranged between 0.3-0.74 percent, the w/c of 0.5 was selected in this study. The compressive and flexural strengths of cement mortar modified with lime up to 28 days of curing were ranged between 3 MPa to 65 MPa and 2 MPa to 12 MPa respectively. The compressive, flexural and bond strengths of the cement mortar decreased with increasing lime content. Vipulanandan correlation model was used to correlate the relationship between lime with consistency, setting times, flowability and compressive strength of cement mortar. Compressive and flexural strengths of cement mortar modified with lime were quantified very well as a function of w/c, lime content and curing time using nonlinear relationship.
1 Introduction
The mortar is a composite material consisting of a mixture of cementitious material (cement), fine aggregates (sand), an amount of water required for hydration reactions. Mineral admixtures, such as fly ash, lime, and silica fume have been widely used for the manufacture of cement mortar. The addition of mineral additive improved the performance, mechanical properties and durability of cement mortar also, the addition of mineral additives decrease CO2 emission and may also reduce the adverse environmental effect caused by cement production [1, 2, 3, 4, 5, 6, 7, 8].
The Limestone is calcareous sedimentary rock mainly consisting of calcium carbonate (CaCO3), commonly called calcite. Limestone is used in cement and mortar for various purposes, as a raw material for clinker production and as coarse or fine aggregate. Lime is produced by finely grinding limestone in quarrying operations and has been suggested for use as an additive in Ordinary Portland Cement. Replacing of limestone into Ordinary Portland Cement has been studied [4, 9, 10]. Lime has been considering as an inert filler material that improves the hydration rate of cement compounds and consequently increases the strength at early ages. The incorporation of limestone powder with Portland cement has many advantages on initial compressive strength, durability, and workability. Workability, strength, and durability are three basics properties of cement mortar [11, 12, 13, 14, 15, 16]. The increase in w/c reduced the value of mechanical properties and increased the workability. Several research studies have been performed to understand the effect of lime on the physical and mechanical properties of cement mortar (Table 1). Compressive and bonding strengths are the most critical property of cement mortar that describes its quality and performance for construction works. In addition, most of the other features such as flexural strength was improved in parallel with the increase in the compressive strength. In terms of compressive strength, the addition of hydrated lime to cement based mortars shows that lime-rich mortars are able to withstand a higher degree of deformation before failure. The observations made, indicate that the lime additions allow for some accommodation of movement either under compressive loads or shear loading, and unlike the brittle failure of cement rich mortars, those with high lime content (where volume of lime is twice that of cement, e.g. 1:2:9 mortar) some elastic-plastic deformation is observed prior to brittle failure with increased lime content.
Summary properties of cement mortar modified with lime
| Reference | Country | Lime, L (%) | w/c | Curing time, t (Day) | Compressive strength, σc (MPa) | Flexural strength, σf (MPa) | Test(s) |
|---|---|---|---|---|---|---|---|
| [3] | Canada | 0-10 | 0.33 | 1,3,7 and 28 | 29-64 | - | Compressive strength |
| [5] | Turkey | 0 and 30 | 0.5 | 2, 7 and 28 | 16-60 | 4-11 | Compressive and flexural strengths |
| [6] | China | 0 and 30 | 0.5 | 3 and 28 | 17-60 | - | Compressive strength |
| [11] | Ethiopia | 0-35 | 0.5 | 2 and 28 | 6.7-62 | - | Compressive strength |
| [12] | Italy | 0-20 | 0.6 | 3, 7 and 28 | 3-33 | 2-12 | Compressive and flexural strengths |
| [14] | China | 0 and 30 | 0.43 | 3, 7 and 28 | 46-65 | - | Compressive strength |
| [15] | Turkey | 0-15 | 0.5 | 2, 7 and 28 | 9-55 | - | Compressive strength |
| [56] | China | 0-45 | 0.3-0.5 | 7 and 28 | 18-65 | 4-12 | Compressive and flexural strengths |
| [57] | Croatia | 0-15 | 0.5 | 3,7 and 28 | 15-40 | - | Compressive strength |
| [58] | China | 0-30 | 0.74 | 7 and 28 | 5-32 | - | Compressive strength |
| [59] | Norway | 0-35 | 0.5 | 1 and 28 | 14-47.5 | 3.4-7.9 | Compressive and flexural strengths |
| [60] | China | 0-30 | 0.5 | 3, 7 and 28 | 18-54 | 4-11 | Compressive and flexural strengths |
| Current study | Iraq | 0-20 | 0.5 | 1,3,7 and 28 | 13.6-45 | 3.4-9.2 | Compressive and flexural strengths |
| Remarks | 8 countries | Up to 45% of lime was used | Varied between 0.3 to 0.74 | Tested up to 28 days of curing | Varied between 3 to 65 MPa | Varied between 2 to 12 MPa | Compressive and flexural strengths are mainly used |
Although a reduction in compressive strength may be viewed as a negative result of hydrated lime addition to a mortar, the resulting performance does provide some accommodation from minor movement of the masonry, thus reducing the associated cracking, as typically seen with high strength (cement rich) mortars which although strong are more ”brittle” [17, 18, 19, 20, 21, 22, 23, 24].
In this study, the effect of lime on the workability, setting times and mechanical strength of cement mortar were performed based on experimental and collected data from the literature. The influence of water to cement ratio, curing time and lime content on the compressive, flexural strengths of cement mortar were quantified using a nonlinear model.
1.1 Objectives
The primary objective of this study is to investigate and quantify the effect of lime on the properties of plastic and hardened properties of cement mortar using experimental and collected data from the literature. The specific objectives are as follows:
Statistical variations of the compressive and flexural strengths, water to cement ratio and lime content of cement mortar.
Investigate the effect of lime on the consistency, setting times, flowability and strength properties of cement mortar.
Develop a non-linear relationship to predict the compressive and flexural strengths of cement mortar as a function of w/c, lime content and curing time using the experimental data and data collected from the literature.
Develop the relationship between compressive and flexural strengths of the cement mortar modified with lime up to 28 days of curing.
To evaluate the relationship between the tensile bonding strength of cement mortar with lime content at seven days of curing.
2 Materials and methods
2.1 Materials
The type of cement used in this study was Gasin Portland Cement from the Gasin Cement Company (Iraq, Kurdistan-Region, Sulaymaniyah City, and 35 ◦ 33′26′′N45◦ 26′08′′E).
Lime is typically used in the form of quicklime (CaO) or hydrated lime (Ca (OH)2). Quicklime (CaO) is manufactured by chemical processes that transform calcium carbonate (limestone – CaCO3) into calcium oxide (CaO). When quicklime reacts with water, it turns into hydrated lime.
Tap water was used in this study
The sand used in the study was CEN standard sand which is well graded rounded particles having a silica content of 98 % as specified in EN 196-1 standard requirements [8, 25].
2.2 Methodology
The plastic and hardened properties of cement mortar modified with lime were tested according to ASTM and BS standard. At least three samples were tested for each condition.
X-ray diffraction (XRD) analyses were performed to determine the chemical composition of cement and lime at 25◦C. The powder ((2 g) was placed in an acrylic sample holder (3 mm) depth. The samples were analyzed by using parallel beam optics with CuKα radiation at 40 kV and 30 mA. The samples were scanned for reflections (2() from 0◦ to 90◦ in steps of 0.02◦ and a 2 sec count time per step. A similar procedure was conducted by [26]. The chemical composition of the cement and lime are illustrated in Table 2 and Table 3.
The chemical composition of the Gasin Portland Cement
| Chemical composition | Chemical formula | Chemical content (%) |
|---|---|---|
| Lime | CaO | 63.9 |
| Silica | SiO2 | 20.1 |
| Alumina | Al2O3 | 4.08 |
| Ferrite | Fe2O3 | 5.10 |
| Magnesia | MgO | 1.48 |
| Sulfur trioxide | SO3 | 2.20 |
| Loss on Ignition | LOI | 3.41 |
The chemical composition of the lime
| Chemical formula | Chemical content (%) |
|---|---|
| CaO | 54.53 |
| SiO2 | 0.90 |
| Al2O3 | 0.05 |
| Fe2O3 | 0.15 |
| MgO | 0.18 |
| SO3 | 0.04 |
| LOI | 43.68 |
Standard consistency test (BS EN 196-3:2016)
This test aims to determine the minimum quantity of mixing water to initiate a chemical reaction between water and cement. Cement is one of the materials which the right amount of water leads to attaining required cement strength. The standard consistency was carried out according to the EN 196-3 standard using the Vicat apparatus. The cement paste was prepared by putting 500 g of cement into the bowl of the mixer. The amount of water was added to the cement. Firstly, the mixing was left for 10 seconds for absorption. Then the mixing apparatus was put at a low speed for 90 seconds then stooped the mixture for 30 seconds to bring the cement that located beyond the mixing zone. After that, the mixer restarted at a low rate for 90 seconds [13]. Without excessive compaction or vibration, the paste was quickly put into the mold which is placed on a glass plate and placed on the plate of the Vicat apparatus. The cement consistency which will allow the Vicat plunger to penetrate to 6 ± 2 mm point from the bottom of Vicat mold is known as standard consistency. The same procedure was repeated when the lime was added to the cement (Fig. 1).

Experimental program presentation of cement mortar modified lime (a) mixing, (b) setting time, (c) cube samples for strength tests (d) flexural test and (e) shape of failure
Setting time test (BS EN 196-3:2016)
The setting times were determined by observing the penetration of a needle into a standard consistency cement paste until it reaches a specified value. It is necessary to evaluate the setting times of the hydraulic binders to regulate the time available for the in situ application of mortars. Setting times were measured using the Vicat [27, 28]. Generally, Initial setting is the time elapsed between the moment water is added to the cement to the time at which paste starts losing its plasticity. The final setting time of cement is the time elapsed between the moment the water was added to the cement to the time at which paste has wholly lost its plasticity and attained sufficient firmness to resist certain definite pressure (Fig. 1).
Cement mortar preparation (BS EN 196-1:2016)
After mixing the materials, the mortar filled cubic molds with a dimension of (4 x 4 x 16) cm. Themortarput into the mold in two layers and by applying to the mold 60 shocks each time using the shock device. After that, the mold was leveled and covered with a plastic bag and stored in the room temperature. After 24 h from the of the mixing procedure, the specimens removed from the mold and stored in water at 23◦C ± 2◦C and 95% of humidity until the time of the test. The samples were tested at 1, 3, 7 and 28 days for the compressive strength. Bending test machine is used to divide the specimen into two halves, and each part was subjected to the compressive strength using the compressive testing machine. The layout of the tested sample for flexural and compressive strengths are shown in Fig. 2.

The layout of cement mortar sample for (a) Flexural test (b) Compression test
Flowability (ASTM C1437)
The flowability of cement mortar was determined by using the flow table method as described in ASTM C-1437. After mixing the cement mortar the mixing material was placed in the mold in two layers. Each layer was compacted 25 blows using the rod during the 15 sec. Additional lime content decreased the flowability of cement mortar.
Tensile Bonding strength (CIGMAT CT-3, modified ASTM C321)
Sandwiched samples were prepared to study the bonding strength according to CIGMAT CT-3 standard [29, 30, 31]. Different samples were prepared by using concrete brick. The bonding material was cement mortar and cement mortar modified with lime content up to 20%. The concrete brick was marked to ensure that the crossed concrete brick is placed in middle and at right the angle to each other. The second brick was placed on the mortar and the oriented correctly. The specimens were allowed to cure at room condition 25 ± 2 ◦C and 95% of humidity till the time of the test. Samples were tested by subjecting to tensile loading (Fig. 3). Stationary jaws held one brick while the other block was pushed by moving jaws creating a bond force on the bonding.

Cement mortar modified with lime under tensile bonding load
2.3 Data collection
In this study, more than 500 data were collected from the different research studies as summarized in Table 1 to characterize and evaluate the effect of lime content on the plastic properties such as consistency, flowability and setting times and hardened properties such as compressive, tensile bonding and flexural strengths of cement mortar.
2.4 Modeling
Vipulanandan correlation model
Nonlinear relationships between the compressive strength, flowability, setting times and consistency with lime were performed using the Vipulanandan correlation model [32, 33, 34, 35, 36, 37, 38, 39, 40, 41, 42, 43, 44, 45, 46, 47, 48, 49, 50, 51, 52, 53, 54]. The model was proposed as follows:
where:
Y = Cement mortar property (dependent variable, i.e. consistency, flowability and setting time, compressive strength)
Yo, A and B = model parameters (Table 6)
Statistical parameters of the properties of cement mortar modified with lime
| Statistical parameters | w/c or w/b | Compressive Strength, σc (MPa) | Flexural strength, σf (MPa) | |
|---|---|---|---|---|
| Cement mortar | No. of Data | 199 | 318 | 43 |
| Range | 0.3-0.74 | 3-65 | 2-12 | |
| Mean (μ.) | 0.47 | 30 | 7.2 | |
| Std. Deviation (σ) | 0.11 | 12 | 2.58 | |
| COV (%) | 23.8 | 40 | 35 | |
| Cement mortar modified with lime | No. of Data | 66 | 68 | 25 |
| Range | 0.3-0.52 | 6.7-65 | 4-11 | |
| Mean (μ) | 0.44 | 32.9 | 7.1 | |
| Std. Deviation (σ) | 0.07 | 16.2 | 1.78 | |
| COV (%) | 17.63 | 49.1 | 25.3 |
| Failure Type | Description | CIGMAT CT 3 Test |
|---|---|---|
| Type 1 | Substrate Failure |  |
| Type 2 | Mortar Failure |  |
| Type 3 | Bonding Failure |  |
| Type 4 | Bonding and Substrate Failure |  |
| Type 5 | Bonding and Mortar Failure |  |
Model parameters of plastic and hardened properties of cement mortar modified lime
| Vipulanandan correlation model (Eq.1) | ||||||||
|---|---|---|---|---|---|---|---|---|
| depended Variable (Y- axis) | In depended Variable (X- axis) | Yo | A | B | RMSE | R2 | No. of Data | Fig. No. |
| Consistency, C (%) | Lime, L (%) | 24.4 | -3.51 | -0.545 | 0.07 % | 0.98 | 38 | 8(a) |
| Initial setting time, t1(min) | 165 | -0.33 | -0.005 | 2.44 min. | 0.97 | 43 | 8(b) | |
| Final setting time, t2(min) | 209 | -0.70 | 0.000 | 1.23 min. | 0.98 | 38 | 8(c) | |
| Flow, F (%) | 108 | -0.96 | -0.05 | 0.24 % | 0.99 | 6 | 9 | |
| Compressive strength (σc) for 1 day of curing | 17.06 | -5.95 | 0 | 0.17 MPa | 0.99 | 17 | 10(a) | |
| Compressive strength (σc) for 3 days of curing | 28.18 | -3.23 | 0.35 MPa | 0.97 | 15 | 10(b) | ||
| strength Compressive (σc) for 7 days of curing | 36.91 | -2.43 | 0.72 MPa | 0.92 | 12 | 10(c) | ||
| Compressive strength (σc) for 28 days of curing | 49.24 | -1.43 | 0.56 MPa | 0.98 | 15 | 10(d) | ||
| Flexural strength(σf) | Compressive strength (σc) | 0.97 | 5.84 | 0.49 MPa | 0.93 | 24 | 13 | |
| Bond strength(σb) | Lime, L(%) | 1.2 | -8.95 | -1.05 | 0.01 MPa | 0.99 | 6 | 14 |
X = cement mortar property (independent variables, i.e. lime content).
Nonlinear model (NLM)
The compressive strength (σc) and flexural strength (σf) of cement mortar modified with lime (L) was influenced by the curing time (t) and water-to-cement ratio (w/c %) [35, 36, 37, 38]. The effects L, t and w/c % of the cement mortar were separated as follows:
Compressive strength or flexural strength of cement mortar (L=0%)
Compressive strength or flexural strength of cement mortar modified with lime (L ≥ 0%):
Based on experimental data and data collected from various research studied in the literature the model parameters (a, b, c, d, e, f, and g) were obtained from multiple regression analysis using the least square method (Table 7).
Non-linear model (NLM) parameters for the compressive and flexural strengths of cement mortar modified with lime
| w/c and t effect | Effect of lime | |||||||||||
|---|---|---|---|---|---|---|---|---|---|---|---|---|
| Model parameters | a | b | c | d | e | f | g | RMSE (MPa) | R2 | No. of data | Eq. No. | Fig. No |
| σc | 8.76 | -1.22 | 0.25 | -0.27 | -0.025 | 0.15 | 1.02 | 2.68 | 0.88 | 476 | 3 | 11 |
| σf | 3.47 | -0.53 | 0.20 | -0.04 | -0.250 | 0.23 | 0.86 | 0.88 | 0.87 | 69 | 4 | 12 |
3 Results and analyses
3.1 Statistical analysis
3.1.1 Water to cement ratio, (w/c)
Based on the total of 199 of water to cement (w/c) data for the cement mortar collected from the literature (Table 1), the w/c for the cement mortar varied between 0.3 to 0.74% with a mean of 0.47%, the standard deviation of 0.11% and the coefficient of variation (COV) of 23.8 % (Table 4). More than 70 % of the total of w/c of the cement mortar was ranged between 0.4 and 0.6% (Fig. 4(a)). Based on the total of 66 water to binder ratio (w/b) data for the cement mortar modified with lime collected from the literature (Table 1), the w/c varied from 0.3 to 0.52% with a mean of 0.44%, the standard deviation of 0.07% and the coefficient of variation (COV) of 17.63 % (Table 4). Almost 85 % of the total of w/c data was ranged between 0.44 and 0.52% (Fig. 4(b)).

Histogram of the water to cement ratio (w/c) for (a) cement mortar and (b) cement mortar modified with lime used in the literature
3.1.2 Lime content, (L (%))
Based on the total 71 lime percent used to modify the cement mortar in the literature, the data varied from 3 % to 45%(by dry weight of cement) with the standard deviation of 11.5 % and the coefficient of variation (COV) of 58%. Almost 70 % of the total of lime content was ranged between 3 % and 20 % (Fig. 5).

Histogram of percent of lime used in the literature
3.2 Mechanical properties
Compressive strength
Cement mortar: A total of 318 compressive strengths (σc) data for the cement mortar collected from the literature (Table 1) the compressive strength (σc) of the cement mortar up to 28 days of curing ranged from 3 MPa to 65 MPa with a mean of 30 MPa, the standard deviation of 12 MPa and the coefficient of variation (COV) of 40 % (Table 4). Different distribution tests for the compressive strength of cement mortar was performed. Based on the Anderson–Darling statistic (AD) and P value (hypothesis testing), Weibull frequency distribution for the compressive strength of cement mortar was observed as shown in Fig. 6(a).
 Figure 6
Statistical distribution of the compressive strength for (a) cement mortar and (b) cement mortar modified with lime up to 28 days of curing
Cement mortar modified with Lime: A total of 68 compressive strengths (σc) data for cement mortar modified with lime were collected from the literature (Table 1), the σc ranged from 6.7 MPa to 65 MPa with a mean of 32.9 MPa, the standard deviation of 16.2 MPa and the coefficient of variation (COV) of 49.1 % (Table 4). Based on the Anderson–Darling statistic (AD) and P value (hypothesis testing), the probability distribution was Weibull distribution as shown in Fig. 6(b).
3.3 Flexural strength
Cement mortar: Based on a total of 43 flexural strengths (σf ) data for cement mortar up to 28 days of curing were collected from the literature (Table 1), the flexural strength σf varied from 2 MPa to 12 MPa with a mean of 7.2 MPa, the standard deviation of 2.58 MPa and the COV of 35 % as summarized in Table 4. In this study, the statistical details and the histograms were performed for each flexural strength data set to identify the distribution. Different distribution tests for the σf of cement mortar were performed. Based on the Anderson–Darling statistic (AD) and P value (hypothesis testing), Gamma frequency distribution for the flexural strength of cement mortar was selected (Fig. 7(a)).
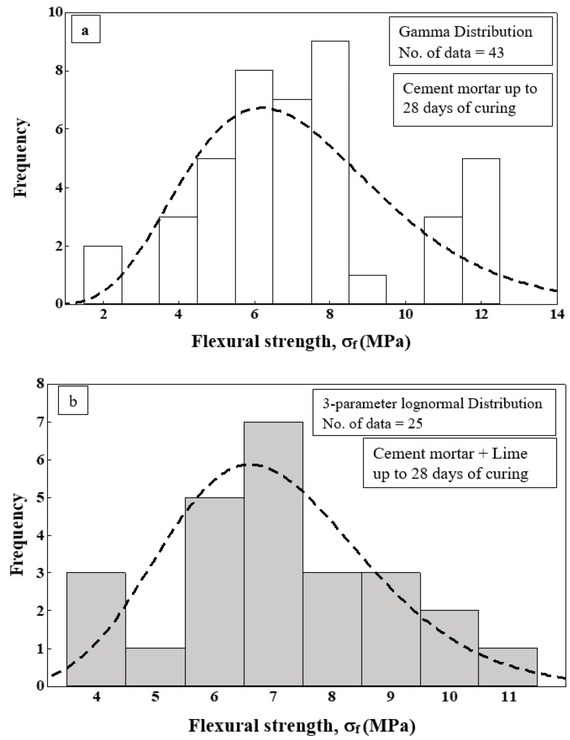 Figure 7
Statistical distribution of the flexural strength for (a) cement mortar and (b) cement mortar modified with lime up to 28 days of curing
Cement mortar modified with Lime: A total of 25 flexural strengths (σf ) data for cement mortar modified with lime were collected from the literature (Table 1), the flexural strength varied from 4 MPa to 11 MPa with a mean of 7.1 MPa while the standard deviation was 1.78 MPa and the coefficient of variation (COV) of 25.3 % as summarized in Table 4. Based on the Anderson–Darling statistic (AD) and P value (hypothesis testing), 3-parameter lognormal Distribution for the flexural strength of cement mortar modified with lime was selected (Fig. 7(b)).
3.4 Property correlation
Consistency
The consistency of cement decreased as the lime increased. Adding of lime content decreased consistency of cement. The consistency of cement with lime was predicted using Vipulanandan correlation model (Eq. 1). The model parameters, R2 and RMSE are summarized in Table 6. Adding 20 % of lime decreased the consistency of cement by 6% as shown in Fig. 8(a).

Relationship between percentage of lime and (a) Consistency (b) Initial setting time and (c) Final setting time of cement paste
Setting times
Additional of lime accelerate the initial setting time and final setting time of cement. The variation of initial and final setting times of cement modified with lime was predicted using Vipulanandan correlation model (Eq. 1). The model parameters, the coefficient of determination (R2) and root mean square error (RMSE) are summarized in Table 6. Additional of 20 % of lime decreased the initial and final setting times by 27 % and 16% respectively as shown in Fig. 8(b and c). The reduction could be because of that the lime acts as a nucleation matrix of C-S-H, and accelerates the hydration of cement. Due to the crystal core effect of lime, the hydration of Tricalcium silicates C3S accelerated at an early age [39].
Flowability
The flow table test was conducted to evaluate the effect of lime on the fluidity of cement mortar. The fluidity of cement decreased as the lime content increased. The variation of flow of cement mortar with lime was predicted using Vipulanandan correlation model (Eq. 1). The model parameters Yo, A, B, R2, and RMSE were 108, −0.96, −0.05, 0.99 and 0.24 % respectively (Table 6). Additional of 20 % of lime decreased the fluidity of cement mortar by 4 % (Fig. 9). A reduction in the flow of cement mortar could be because of the lime disperses the cement particles more efficiently. The ability of lime is thus probably caused by lower reactivity than cement and less gel formation [40, 41].

Relationship between lime content and of flowability of cement mortar
Compressive strength
The lime decreased the compressive strength (σc) of cement mortar up to 28 days of curing. With the increase in the lime content, the σc of cement mortar is nonlinearly decreased (Fig. 10). The variation of σc versus d L was represented using Vipulanandan correlation model (Eq. 1). The model parameters, R2, and RMSE are summarized in Table 6 Additional of 20 % of lime decreased the compressive strength of cement mortar by 20 % at 1 day of curing.
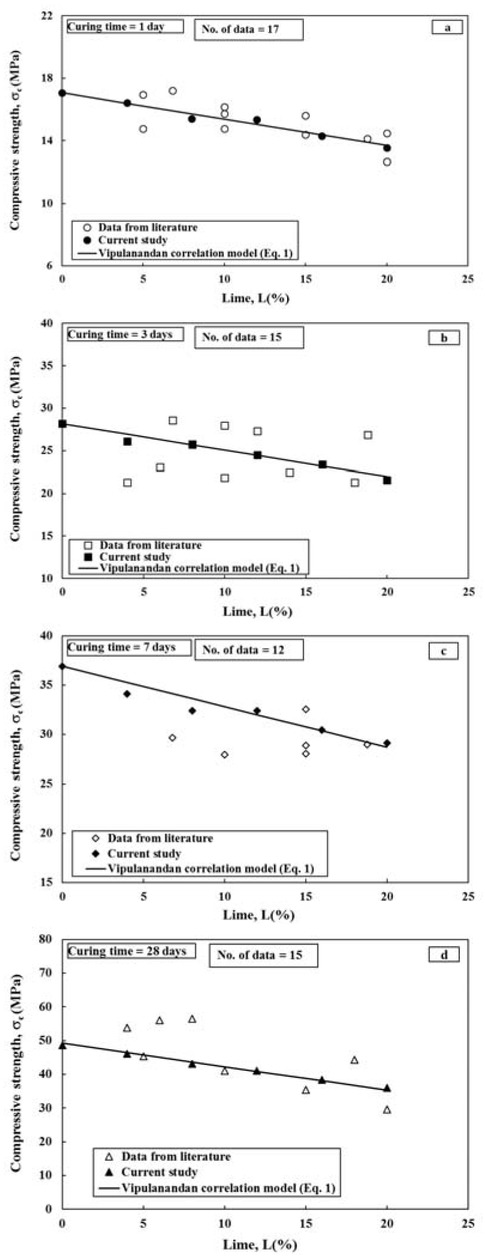
Relationship between Lime content and compressive strength of cement mortar at different curing times (a) 1day (b) 3 days (c) 7 days and, (d) 28 days of curing
Additional of 16 % of lime decreased the σc of cement mortar by 20% at 3 days of curing. Additional of 12 % of lime decreased the σc of cement mortar by 19% at 28 days of curing (Fig. 10). Addition of lime decreased the compressive strength of cement mortar because of the fineness of the lime, the lime with large particle has a lower fineness than a small particle which cannot fill the void (filling effect) as a result the strength reduced. The reason lies in the reduction of hydraulically active clinker fraction of cement upon the lime replacement [15]. A multiple linear regression analysis was used to investigate the effect of lime on the compressive strength of cement mortar, the compressive strength (σc) was correlated to the independent variables such as w/c, curing time and lime using a non-linear relationship (Eq. 2(b)) as shown in Fig. 11. The model parameters were obtained from multiple regression analyses using the least square method (Table 7). Based on the nonlinear model parameter (d= −0.27) in Eq. 3 the lime has the highest effect in decreasing the compressive strength of cement mortar compared to water to cement ratio and curing time.

Comparison between measured and predicted of compressive strength for cement mortar modified with lime
Flexural strength
Nonlinear Regression Analysis was used to study the effect of lime on the bending strength (modulus of rupture) of cement mortar, the flexural strength (σf ) was correlated to the independent variables such as w/c, curing time and lime content using a non-linear relationship (Eq. 2(c)) as shown in Fig. 12. The equation parameters were obtained from multiple regression analyses using the least square method (Table 7). Based on the non-linear model parameter (d = −0.04) in Eq. 4 the lime has also the highest effect in decreasing the flexural strength of cement mortar compared to water to cement ratio and curing time.

Comparison between measured and predicted of flexural strength for cement mortar modified with lime
The Relationship between compressive strength (σc) and flexural strength (σf) of cement mortar modified with lime
Based on the total of 24 experimental cement mortar data modified with lime content. The variation of σf and σc was represented using the Vipulanandan correlation model (Eq. 1). The model parameters Yo, A, the coefficient of determination (R2) and root mean square error (RMSE) were 0.969, 5.84, 0.93 and 0.49 MPa respectively (Table 6). The flexural strength of cement mortar increased from 4 to 9 MPa when the compressive strength increased from 15 to 45 MPa for cement mortar (Fig. 13).

Relationship between compressive and flexural strength of cement mortar modified with lime
Tensile bonding strength
The addition of lime decreased the bond strength (σb) of cement mortar at 7 days of curing. The variation of σb and L was represented using the Vipulanandan correlation model (Eq. 1). The model parameters Yo, A, B, the coefficient of determination (R2) and root mean square error (RMSE) were 1.2, −8.95, −1.05, 0.99 and 0.01 MPa respectively (Table 6). The bond strength of cement mortar without lime content was 1.2 MPa at 7 days of curing. Addition of 20 % of lime content decreased the bond strength by 131 % (Fig. 14). Different type and shape of failure were proposed by CIGMAT CT-3 as summarized in Table 5. The type of failure between the mortar and concrete bricks were type 2 failure based on CIGMAT CT-3 standard [29, 31] as shown in Fig. 15.

Relationship between percentage of Lime and tensile bonding strength of cement mortar at 7 days of curing
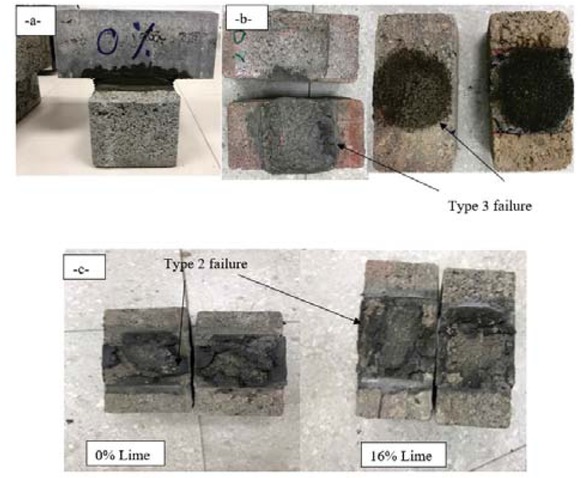
Typical tensile bonding failure for cement mortar modified with lime
4 Conclusions
The focus of this study was to investigate and quantify the effect of lime on the setting times, consistency, flowability and strengths properties of cement mortar. Based on experimental and collected data the following conclusions are advanced:
Additional of lime to cement mortar decreased the consistency, initial and final setting times of cement mortar by 5%, 27%, and 16% respectively.
Additional of 20% of lime as a replacement of cement in cement mortar reduced the flowability by 4%.
Based on the experimental data additional of 20 % of lime decreased the compressive strength of cement mortar at 1, 3, 7 and 28 days of curing. Based on NLM the lime content had the highest effect on reducing the compressive strength of cement mortar compared with w/c and curing time.
Additional of 20 % of lime reduced the bond strength of cement mortar by 138% at 7 days of curing.
The Compressive strength (CS) of the cement mortar modified with different percentage of lime was predicted well as a function of w/c, curing time, lime content. From the NLM parameter effect of curing time on the CS of cement mortar was much higher than the effect of w/c and lime content.
The CS and workability of cement mortar modified with different percentrage of lime (up to 20%) wa less than unmodified cement mortar by 8% and 25% respectivly.
Acknowledgment
The Civil Engineering Department, University of Sulaimani and Gazin Cement Co. supported this study.
References
[1] El Youbi, M. S., & Ahmed, E. (2017). Development and study of physical, chemical and mechanical properties of a new formulation of cement of a varying percentage of natural pozzolan. J. Chem. Technol. Met, 52(5), 873-884.Search in Google Scholar
[2] Abed, Z. M. (2018). The Effect of Using Lightweight Aggregate on Some Properties of Cement Mortar. Iraqi Journal of Civil Engineering, 12(1), 1-9.10.37650/ijce.2018.142403Search in Google Scholar
[3] Nehdi, M., Mindess, S., & Aïtcin, P. C. (1996). Optimization of high strength limestone filler cement mortars. Cement and Concrete Research, 26(6), 883-893.10.1016/0008-8846(96)00071-3Search in Google Scholar
[4] Bonavetti, V., Donza, H., Rahhal, V., & Irassar, E. (2000). Influence of initial curing on the properties of concrete containing limestone blended cement. Cement and Concrete Research, 30(5), 703-708.10.1016/S0008-8846(00)00217-9Search in Google Scholar
[5] Türkel, S., & Altuntaş, Y. (2009). The effect of limestone powder, fly ash and silica fume on the properties of self-compacting repair mortars. Sadhana, 34(2), 331-343.10.1007/s12046-009-0011-3Search in Google Scholar
[6] Hang, M. Y., Gao, M., & Lan, Y. J. (2013). Study on the Influence of Limestone Dust on Performance of Cement Mortar. In Applied Mechanics and Materials (Vol. 368, pp. 992-996). Trans Tech Publications.10.4028/www.scientific.net/AMM.368-370.992Search in Google Scholar
[7] Muttar, A. A., & Salman, M. M. (2011). Mechanical Properties of Acrylic Mortar. Journal of Engineering and Sustainable Development, 15(3), 152-162.Search in Google Scholar
[8] Demir, İ., Güzelkücük, S., & Sevim, Ö. (2018). Effects of sulfate on cement mortar with hybrid pozzolan substitution. Engineering Science and Technology, an International Journal, 21(3), 275283.10.1016/j.jestch.2018.04.009Search in Google Scholar
[9] Matschei, T., Lothenbach, B., & Glasser, F. P. (2007). The role of calcium carbonate in cement hydration. Cement and Concrete Research, 37(4), 551-558.10.1016/j.cemconres.2006.10.013Search in Google Scholar
[10] Lothenbach, B., Le Saout, G., Gallucci, E., & Scrivener, K. (2008). Influence of limestone on the hydration of Portland cements. Cement and Concrete Research, 38(6), 848-860.10.1016/j.cemconres.2008.01.002Search in Google Scholar
[11] Gudissa, W., & Dinku, A. (2010). The use of limestone powder as an alternative cement replacementmaterial: An experimental study. Zede Journal, 27, 33-43.Search in Google Scholar
[12] Corinaldesi, V., Mazzoli, A., & Moriconi, G. (2011). Mechanical and physical properties of cement mortars containing plastic waste particles. Journal ofMaterials and Design, 32, 1646-1650.10.1016/j.matdes.2010.10.013Search in Google Scholar
[13] Thongsanitgarn, P., Wongkeo, W., Sinthupinyo, S., & Chaipanich, A. (2012). Effect of limestone powders on compressive strength and setting times of Portland-limestone cement pastes. In Advanced Materials Research (Vol. 343, pp. 322-326). Trans Tech Publications.10.4028/www.scientific.net/AMR.343-344.322Search in Google Scholar
[14] Yang, H. S., Fang, K. H., & Tu, S. J. (2011). The influence of limestone powder on fluidity, strength and hydration of cement mortar. In Advanced Materials Research (Vol. 168, pp. 512-517). Trans Tech Publications.10.4028/www.scientific.net/AMR.168-170.512Search in Google Scholar
[15] Sezer, G. İ. (2012). Compressive strength and sulfate resistance of limestone and/or silica fume mortars. Construction and Building Materials, 26(1), 613-618.10.1016/j.conbuildmat.2011.06.064Search in Google Scholar
[16] Autier, C., Azema, N., Taulemesse, J. M., & Clerc, L. (2013). Mesostructure evolution of cement pastes with addition of superplasticizers highlighted by dispersion indices. Powder technology, 249, 282-289.10.1016/j.powtec.2013.08.036Search in Google Scholar
[17] Nehdi, M., Duquette, J., & El Damatty, A. (2003). Performance of rice husk ash produced using a new technology as a mineral admixture in concrete. Cement and concrete research, 33(8), 1203-1210.10.1016/S0008-8846(03)00038-3Search in Google Scholar
[18] Erdoǧdu, Ş. (2005). Effect of retempering with superplasticizer admixtures on slump loss and compressive strength of concrete subjected to prolonged mixing. Cement and Concrete Research, 35(5), 907-912.10.1016/j.cemconres.2004.08.020Search in Google Scholar
[19] Plank, J.,&Hirsch, C. (2007). Impact of zeta potential of early cement hydration phases on superplasticizer adsorption. Cement and concrete research, 37(4), 537-542.10.1016/j.cemconres.2007.01.007Search in Google Scholar
[20] Zingg, A., Winnefeld, F., Holzer, L., Pakusch, J., Becker, S., & Gauckler, L. (2008). Adsorption of polyelectrolytes and its influence on the rheology, zeta potential, and microstructure of various cement and hydrate phases. Journal of Colloid and Interface Science, 323(2), 301-312.10.1016/j.jcis.2008.04.052Search in Google Scholar
[21] Ferrari, L., Kaufmann, J., Winnefeld, F., & Plank, J. (2011). Multi-method approach to study influence of superplasticizers on cement suspensions. Cement and Concrete Research, 41(10), 1058-1066.10.1016/j.cemconres.2011.06.010Search in Google Scholar
[22] Matias, D., De Brito, J., Rosa, A., & Pedro, D. (2013). Mechanical properties of concrete produced with recycled coarse aggregates–Influence of the use of superplasticizers. Construction and building materials, 44, 101-109.10.1016/j.conbuildmat.2013.03.011Search in Google Scholar
[23] Liu, X., Wang, Z., Zheng, Y., Cui, S., Lan, M., Li, H., & Liang, X. (2014). Preparation, characterization and performances of powdered polycarboxylate superplasticizer with bulk polymerization. Materials, 7(9), 6169-6183.10.3390/ma7096169Search in Google Scholar
[24] Erdem, R. T., Ozturk, A. U., & Gücüyen, E. (2016). Estimarea rezistentei la compresune a mortarelor de cement/estimation of compressive strength of cement mortars. Revista Romana de Materiale, 46(3), 313.Search in Google Scholar
[25] Ismail, M. R., Ali, M. A. M., El-Miligy, A. A., & Afifi, M. S. (1999). Acid resistance of polyester-impregnated modified cement mortar. Journal of applied polymer science, 73(5), 685-693.10.1002/(SICI)1097-4628(19990801)73:5<685::AID-APP9>3.0.CO;2-7Search in Google Scholar
[26] Vipulanandan, C., & Mohammed, A. (2015). XRD and TGA, swelling and compacted properties of polymer treated sulfate contaminated CL soil. Journal of Testing and Evaluation, 44(6), 2270-2284.10.1520/JTE20140280Search in Google Scholar
[27] W Qadir, K Ghafor and A. Mohammed (2019). Characterizing and Modeling the Mechanical Properties of the Cement Mortar Modified with Fly Ash for Various Water-to-Cement Ratios and Curing Times Advances in Civil Engineering, Vol.2019, Article ID 7013908, 11 pages.10.1155/2019/7013908Search in Google Scholar
[28] Mohammed, A., Raof, H., & Salih, A. (2018). Vipulanandan Constitutive Models to Predict the Rheological Properties and Stress–Strain Behavior of Cement Grouts Modified with Metakaolin. Journal of Testing and Evaluation, 48(5).10.1520/JTE20180271Search in Google Scholar
[29] Liu, J., & Vipulanandan, C. (2005). Tensile bonding strength of epoxy coatings to concrete substrate. Cement and concrete Research, 35(7), 1412-1419.10.1016/j.cemconres.2004.06.035Search in Google Scholar
[30] Moturi, S. V. (2010). Evaluating the Performance of Cementitious and Epoxy Coatings for Concrete Under Acidic Environment (Master dissertation, University of Houston).Search in Google Scholar
[31] Pakeetharan, S. (2012). Characterization of Sensing Repair Materials (Master dissertation, University of Houston).Search in Google Scholar
[32] Mohammed, A. S. (2017). Effect of temperature on the rheological properties with shear stress limit of iron oxide nanoparticle modified bentonite drilling muds. Egyptian journal of petroleum, 26(3), 791-802.10.1016/j.ejpe.2016.10.018Search in Google Scholar
[33] Mohammed, A., & Mahmood, W. (2018). Statistical Variations and New Correlation Models to Predict the Mechanical Behavior and Ultimate Shear Strength of Gypsum Rock. Open Engineering, 8(1), 213-226.10.1515/eng-2018-0026Search in Google Scholar
[34] Mohammed, A., & Mahmood, W. (2018). Vipulanandan failure models to predict the tensile strength, compressive modulus, fracture toughness and ultimate shear strength of calcium rocks. International Journal of Geotechnical Engineering, 1-11.10.1080/19386362.2018.1468663Search in Google Scholar
[35] Mohammed, A. S. (2018). Vipulanandan model for the rheological propertieswith ultimate shear stress of oil well cement modified with nanoclay. Egyptian journal of petroleum, 27(3), 335-347.10.1016/j.ejpe.2017.05.007Search in Google Scholar
[36] Vipulanandan, C., & Mohammed, A. S. (2014). Hyperbolic rheological model with shear stress limit for acrylamide polymer modified bentonite drilling muds. Journal of Petroleum Science and Engineering, 122, 38-47.10.1016/j.petrol.2014.08.004Search in Google Scholar
[37] Vipulanandan, C.,Mohammed, A.,& Samuel, R.G. (2017). Smart bentonite drilling muds modified with iron oxide nanoparticles and characterized based on the electrical resistivity and rheological properties with varying magnetic field strengths and temperatures. In Offshore Technology Conference. Offshore Technology Conference.10.4043/27626-MSSearch in Google Scholar
[38] Vipulanandan, C., Mohammed, A., & Ganpatye, A. S. (2018). Smart Cement Performance Enhancement with NanoAl 2 O 3 for Real Time Monitoring Applications Using Vipulanandan Models. In Offshore Technology Conference. Offshore Technology Conference.10.4043/28880-MSSearch in Google Scholar
[39] Mohammed, Ahmed S., and Cumaraswamy Vipulanandan. "Compressive and tensile behavior of polymer treated sulfate contaminated CL soil." Geotechnical and Geological Engineering 32, no. 1 (2014): 71-83.10.1007/s10706-013-9692-9Search in Google Scholar
[40] Mohammed, Ahmed, and Cumaraswamy Vipulanandan. "Testing and Modeling the Short-Term Behavior of Lime and Fly Ash Treated Sulfate Contaminated CL Soil." Geotechnical and Geological Engineering 33, no. 4 (2015): 1099-1114.10.1007/s10706-015-9890-8Search in Google Scholar
[41] Mohammed, A. S. (2018). Vipulanandan models to predict the electrical resistivity, rheological properties and compressive stress-strain behavior of oil well cement modified with silica nanoparticles. Egyptian journal of petroleum, 27(4), 1265-1273.10.1016/j.ejpe.2018.07.001Search in Google Scholar
[42] Vipulanandan, C., and A. Mohammed. "Smart cement modified with iron oxide nanoparticles to enhance the piezoresistive behavior and compressive strength for oil well applications." Smart Materials and Structures 24, no. 12 (2015 b): 125020.10.1088/0964-1726/24/12/125020Search in Google Scholar
[43] Vipulanandan, C., and A. Mohammed. "Smart cement rheological and piezoresistive behavior for oil well applications." Journal of Petroleum Science and Engineering 135 (2015 c): 50-58.10.1016/j.petrol.2015.08.015Search in Google Scholar
[44] Vipulanandan, C., Krishnamoorti, R., Mohammed, A., Boncan, V., Narvaez, G., Head, B., & Pappas, J. M. (2015). Iron nanoparticle modified smart cement for real time monitoring of ultra Deepwater oil well cementing applications. In Offshore Technology Conference. Offshore Technology Conference.10.4043/25842-MSSearch in Google Scholar
[45] Vipulanandan, C.,& Mohammed, A. (2015). Effect of nanoclay on the electrical resistivity and rheological properties of smart and sensing bentonite drilling muds. Journal of Petroleum Science and Engineering, 130, 86-95.10.1016/j.petrol.2015.03.020Search in Google Scholar
[46] Vipulanandan, C., & Mohammed, A. (2017). Rheological properties of piezoresistive smart cement slurry modified with iron-oxide nanoparticles for oil-well applications. Journal of Testing and Evaluation, 45(6), 2050-2060.10.1520/JTE20150443Search in Google Scholar
[47] Vipulanandan, C. & Mohammed, A. (2018). Smart cement compressive piezoresistive, stress-strain, and strength behavior with nanosilica modification. Journal of Testing and Evaluation, 47(2).10.1520/JTE20170105Search in Google Scholar
[48] Vipulanandan, C., Mohammed, A., & Samuel, R. G. (2018). Fluid loss control in smart bentonite drilling mud modified with nanoclay and quantified with Vipulanandan fluid loss model. In Offshore Technology Conference. Offshore Technology Conference.10.4043/28947-MSSearch in Google Scholar
[49] Mohammed, A., & Vipulanandan, C. (2019). Magnetic Field Strength and Temperature Effects on the Behavior of Oil Well Cement Slurry Modified with Iron Oxide Nanoparticles and Quantified with Vipulanandan Models. Journal of Testing and Evaluation, 48(6).10.1520/JTE20180107Search in Google Scholar
[50] Mohammed, A., & Mahmood, W. (2019). New Vipulanandan pq Model for Particle Size Distribution and Groutability Limits for Sandy Soils. Journal of Testing and Evaluation, 48(5).10.1520/JTE20180606Search in Google Scholar
[51] Vipulanandan, C., & Mohammed, A. (2018). New Vipulanandan failure model and property correlations for sandstone, shale and limestone rocks. IFCEE, 2018, 365-376.10.1061/9780784481585.036Search in Google Scholar
[52] Vipulanandan, C., & Mohammed, A. (2017). Rheological properties of piezoresistive smart cement slurry modified with iron-oxide nanoparticles for oil-well applications. Journal of Testing and Evaluation, 45(6), 2050-2060.10.1520/JTE20150443Search in Google Scholar
[53] Mohammed, A. S. (2018). Electrical resistivity and rheological properties of sensing bentonite drilling muds modified with lightweight polymer. Egyptian Journal of Petroleum, 27(1), 55-63.10.1016/j.ejpe.2017.01.002Search in Google Scholar
[54] Mohammed, A. S. (2018). Property correlations and statistical variations in the geotechnical properties of (CH) clay soils. Geotechnical and Geological Engineering, 36(1), 267-281.10.1007/s10706-017-0325-6Search in Google Scholar
[55] Bonavetti, V., Donza, H., Menendez, G., Cabrera, O.,& Irassar, E. F. (2003). Limestone filler cement in low w/c concrete: A rational use of energy. Cement and Concrete Research, 33(6), 865-871.10.1016/S0008-8846(02)01087-6Search in Google Scholar
[56] Zhang, J., & Li, Z. (2012). Impact of the Limestone Powder on the Properties of Cement Paste and Mortar. In Applied Mechanics and Materials (Vol. 174, pp. 236-240). Trans Tech Publications.10.4028/www.scientific.net/AMM.174-177.236Search in Google Scholar
[57] Zelić, J., Rušić, D., Veža, D., & Krstulović, R. (2000). The role of silica fume in the kinetics and mechanisms during the early stage of cement hydration. Cement and Concrete Research, 30(10), 1655-1662.10.1016/S0008-8846(00)00374-4Search in Google Scholar
[58] Zhang, X. Z., Han, C. S., & Yin, X. (2011). Influence of Limestone Powder on Performance of the Pre-Mixed Cement Mortar. In Advanced Materials Research (Vol. 306, pp. 1096-1100). Trans Tech Publications10.4028/www.scientific.net/AMR.306-307.1096Search in Google Scholar
[59] De Weerdt, K., Haha, M. B., Le Saout, G., Kjellsen, K. O., Justnes, H., & Lothenbach, B. (2011). Hydration mechanisms of ternary Portland cements containing limestone powder and fly ash. Cement and Concrete Research, 41(3), 279-291.10.1016/j.cemconres.2010.11.014Search in Google Scholar
[60] Xu, G. Q., You, Z. G., Gao, L., & Han, D. L. (2013). The Influence of Combined Admixture of Super-Fine Limestone Powder and Low-Quality Fly Ash on the Performance of Cement Mortar. In Advanced Materials Research (Vol. 652, pp. 1181-1184). Trans Tech Publications.10.4028/www.scientific.net/AMR.652-654.1181Search in Google Scholar
© 2019 Warzer Qadir et al., published by De Gruyter
This work is licensed under the Creative Commons Attribution 4.0 International License.
Articles in the same Issue
- Regular Article
- Exploring conditions and usefulness of UAVs in the BRAIN Massive Inspections Protocol
- A hybrid approach for solving multi-mode resource-constrained project scheduling problem in construction
- Identification of geodetic risk factors occurring at the construction project preparation stage
- Multicriteria comparative analysis of pillars strengthening of the historic building
- Methods of habitat reports’ evaluation
- Effect of material and technological factors on the properties of cement-lime mortars and mortars with plasticizing admixture
- Management of Innovation Ecosystems Based on Six Sigma Business Scorecard
- On a Stochastic Regularization Technique for Ill-Conditioned Linear Systems
- Dynamic safety system for collaboration of operators and industrial robots
- Assessment of Decentralized Electricity Production from Hybrid Renewable Energy Sources for Sustainable Energy Development in Nigeria
- Seasonal evaluation of surface water quality at the Tamanduá stream watershed (Aparecida de Goiânia, Goiás, Brazil) using the Water Quality Index
- EFQM model implementation in a Portuguese Higher Education Institution
- Assessment of direct and indirect effects of building developments on the environment
- Accelerated Aging of WPCs Based on Polypropylene and Plywood Production Residues
- Analysis of the Cost of a Building’s Life Cycle in a Probabilistic Approach
- Implementation of Web Services for Data Integration to Improve Performance in The Processing Loan Approval
- Rehabilitation of buildings as an alternative to sustainability in Brazilian constructions
- Synthesis Conditions for LPV Controller with Input Covariance Constraints
- Procurement management in construction: study of Czech municipalities
- Contractor’s bid pricing strategy: a model with correlation among competitors’ prices
- Control of construction projects using the Earned Value Method - case study
- Model supporting decisions on renovation and modernization of public utility buildings
- Cements with calcareous fly ash as component of low clinker eco-self compacting concrete
- Failure Analysis of Super Hard End Mill HSS-Co
- Simulation model for resource-constrained construction project
- Getting efficient choices in buildings by using Genetic Algorithms: Assessment & validation
- Analysis of renewable energy use in single-family housing
- Modeling of the harmonization method for executing a multi-unit construction project
- Effect of foam glass granules fillers modification of lime-sand products on their microstructure
- Volume Optimization of Solid Waste Landfill Using Voronoi Diagram Geometry
- Analysis of occupational accidents in the construction industry with regards to selected time parameters
- Bill of quantities and quantity survey of construction works of renovated buildings - case study
- Cooperation of the PTFE sealing ring with the steel ball of the valve subjected to durability test
- Analytical model assessing the effect of increased traffic flow intensities on the road administration, maintenance and lifetime
- Quartz bentonite sandmix in sand-lime products
- The Issue of a Transport Mode Choice from the Perspective of Enterprise Logistics
- Analysis of workplace injuries in Slovakian state forestry enterprises
- Research into Customer Preferences of Potential Buyers of Simple Wood-based Houses for the Purpose of Using the Target Costing
- Proposal of the Inventory Management Automatic Identification System in the Manufacturing Enterprise Applying the Multi-criteria Analysis Methods
- Hyperboloid offset surface in the architecture and construction industry
- Analysis of the preparatory phase of a construction investment in the area covered by revitalization
- The selection of sealing technologies of the subsoil and hydrotechnical structures and quality assurance
- Impact of high temperature drying process on beech wood containing tension wood
- Prediction of Strength of Remixed Concrete by Application of Orthogonal Decomposition, Neural Analysis and Regression Analysis
- Modelling a production process using a Sankey diagram and Computerized Relative Allocation of Facilities Technique (CRAFT)
- The feasibility of using a low-cost depth camera for 3D scanning in mass customization
- Urban Water Infrastructure Asset Management Plan: Case Study
- Evaluation the effect of lime on the plastic and hardened properties of cement mortar and quantified using Vipulanandan model
- Uplift and Settlement Prediction Model of Marine Clay Soil e Integrated with Polyurethane Foam
- IoT Applications in Wind Energy Conversion Systems
- A new method for graph stream summarization based on both the structure and concepts
- “Zhores” — Petaflops supercomputer for data-driven modeling, machine learning and artificial intelligence installed in Skolkovo Institute of Science and Technology
- Economic Disposal Quantity of Leftovers kept in storage: a Monte Carlo simulation method
- Computer technology of the thermal stress state and fatigue life analysis of turbine engine exhaust support frames
- Statistical model used to assessment the sulphate resistance of mortars with fly ashes
- Application of organization goal-oriented requirement engineering (OGORE) methods in erp-based company business processes
- Influence of Sand Size on Mechanical Properties of Fiber Reinforced Polymer Concrete
- Architecture For Automation System Metrics Collection, Visualization and Data Engineering – HAMK Sheet Metal Center Building Automation Case Study
- Optimization of shape memory alloy braces for concentrically braced steel braced frames
- Topical Issue Modern Manufacturing Technologies
- Feasibility Study of Microneedle Fabrication from a thin Nitinol Wire Using a CW Single-Mode Fiber Laser
- Topical Issue: Progress in area of the flow machines and devices
- Analysis of the influence of a stator type modification on the performance of a pump with a hole impeller
- Investigations of drilled and multi-piped impellers cavitation performance
- The novel solution of ball valve with replaceable orifice. Numerical and field tests
- The flow deteriorations in course of the partial load operation of the middle specific speed Francis turbine
- Numerical analysis of temperature distribution in a brush seal with thermo-regulating bimetal elements
- A new solution of the semi-metallic gasket increasing tightness level
- Design and analysis of the flange-bolted joint with respect to required tightness and strength
- Special Issue: Actual trends in logistics and industrial engineering
- Intelligent programming of robotic flange production by means of CAM programming
- Static testing evaluation of pipe conveyor belt for different tensioning forces
- Design of clamping structure for material flow monitor of pipe conveyors
- Risk Minimisation in Integrated Supply Chains
- Use of simulation model for measurement of MilkRun system performance
- A simulation model for the need for intra-plant transport operation planning by AGV
- Operative production planning utilising quantitative forecasting and Monte Carlo simulations
- Monitoring bulk material pressure on bottom of storage using DEM
- Calibration of Transducers and of a Coil Compression Spring Constant on the Testing Equipment Simulating the Process of a Pallet Positioning in a Rack Cell
- Design of evaluation tool used to improve the production process
- Planning of Optimal Capacity for the Middle-Sized Storage Using a Mathematical Model
- Experimental assessment of the static stiffness of machine parts and structures by changing the magnitude of the hysteresis as a function of loading
- The evaluation of the production of the shaped part using the workshop programming method on the two-spindle multi-axis CTX alpha 500 lathe
- Numerical Modeling of p-v-T Rheological Equation Coefficients for Polypropylene with Variable Chalk Content
- Current options in the life cycle assessment of additive manufacturing products
- Ideal mathematical model of shock compression and shock expansion
- Use of simulation by modelling of conveyor belt contact forces