Getting efficient choices in buildings by using Genetic Algorithms: Assessment & validation
-
Ricardo Simões Santos
 ,
João, Matias
,
João, Matias

Abstract
The energy consumption in buildings, can be reduced through a rational choice of the household appliances to be acquired. This choice can be based, on a specific criteria, settled according to the consumer needs. However, such choice, still needs to be optimized, since in general, an efficient equipment has a high investment, although a low energy consumption. Genetic Algorithms (GAs) are used therefore, as an optimization technique, to get efficient and several solutions, based on those pre-selected from the market, and according to a set of criteria. However, there is a need to assess its robustness as well as its consistence in terms of convergence results. The quality of its solutions is also assessed, by comparing GAs results with those, obtained from Simplex method. The problem formulation, and its influence on GAs results, is also considered on this work, where it’s chosen the best one, among four proposed. In this paper it is presented a methodology that allows to promote energy efficiency in buildings, by achieving savings in terms of initial investment, energy consumption and CO2 emissions for the consumer. It is shown that GAs, can provide several and optimal solutions, through formulation and parameters suitable.
1 Introduction
Energy plays an essential key rule in a society, with energetic necessities, highly correlated with issues, like the
grow of population, economic development, and technology innovation [1].
Although the recent advances in technology progress, there was an increase on energy demand in the last years, which can compromise the several agreements made, in order to reduce the Greenhouse Gas Emissions to the atmosphere, where the electrical energy production is responsible for a significant part of these emissions [2].
In this sense, the reduction of energy consumption, is a priority in order to achieve sustainability [3], with buildings accounting for about 30-45 percent of the energy consumed in most countries [4].
Regarding the residential sector, the share of electrical energy consumption, is about 13,9% of the world’s consumed final energy in 2012 [5]. In other countries, like Portugal, this value, could reach 18% [5], representing thus a relevant area and therefore an opportunity, to improve energy efficiency.
There were made some energy efficiency improvements in the last years, regarding electrical household appliances. One of such measures, was the European Directive 2010/30/EU, and more recently, the Regulation, (EU) 2017/1369 of 4 July 2017, of the European Parliament and of the Council, where it was established the mandatory labeling, by classifying these appliances regarding their consumption, promoting therefore the energy services cost reduction, and their equivalent CO2 emissions [6, 7].
The labelling system, allows to inform the consumer about relevant issues, specifically regarding each appliance (e.g. energy consumption, noise, capacity in litters (fridge), clothe capacity (washing machine), among others), promoting therefore an adequate use of each appliance, suitable to the consumer needs [8].
However, and despite the energy efficiency improvements, regarding electrical household appliances (and buildings in general), the main issue nowadays, is to know which energy retrofit technology/measure, can be applied for a project, in terms of effective and reliable issues, especially in the long term (e.g. [8]).
In this sense, and given the several options, available on the market, it’s hard to analyze what’s the best solution
to choose, regarding the issues referred before, in order to satisfy the individual needs of each consumer [9, 10].
The problem gets worse, when each appliance has its own and distinct characteristics, which varies by brand and model to buy, making the cost-benefit ratio very different, and sometimes difficult to analyze given the different equipment life cycle, energy consumption, among other issues [8].
Considering the different number of options/dimension, available from the market, the number of possible combinations will increase substantially, as we include more dimensions to be considered (e.g. lighting, clothes dryer machines, electric ovens, etc.), as well as with the addition of options/dimension, available on the market, given the possible existence, of several tradeoffs between them.
Therefore, and by taking into account a decision maker (consumer) who wishes to acquire different types of household appliances, one will have to deal with a problem of combinatorial nature, which can be tackled by using optimization techniques.
The use of traditional optimization techniques (particularly those based on gradient methods) presents some inconveniences or disadvantages. One of them is related with the strong possibility of these algorithms, can get stuck into a local minima/maxima, having therefore, some limitations on exploitation of the entire feasible region.
The use of Genetic Algorithms (GAs), allows to obtain different and feasible solutions, to attend the consumer needs.
However, as like other metaheuristic, GAs presents the inconvenience of having too many control parameters, making it quite sensitive to their initial values, therefore the need to tuning them, as well as test its robustness, to improve the quality of its results.
Therefore, this paper presents a method to provide efficient solutions from the market, directly to the consumer (decision-agent), that allows to reduce Energy and CO2 consumption, through its correspondent savings achieved during its usage phase. The solutions will consider the consumer needs, according to a set of criteria previously stablished and regarding each dimension/appliance considered, as well as the limited budget to perform the initial investment.
The method will be applied on this work by using a case study where the quality of its solutions is tested, by comparing such results with those obtained from another optimization method (Simplex). The robustness of the method referred above, will also be assessed, as well as its convergence, demonstrating therefore its validation on providing several and efficient solutions to the consumer. The influence of the objective function considered, will also be assessed. At the end it will be chosen the best objective function, from a set, that was pre-defined, based on model behavior.
2 Literature review
In the last years, there was a set of initiatives made by several entities, including governments, associations and manufactures, to sensitize the population to the problem of energy efficiency in the residential sector [2]. This was made by establishing some measures and practices. However, most of this common practices, employs methods like simulation (e.g. [11, 12]), based on analysis of type what if, which (in general), consists on a set of techniques that allows to investigate only a limited number of an alternative options.
Other studies, found on literature, follows an approach, which is mainly economical, where, and for the same initial investment, it allows to achieve the highest energy savings through a set of actions taken (e.g. [13]). Considering this principle, there are some approaches, regarding energy management, like the ones based on control techniques, or even those, based in schedule methodologies for instance.
Although, most of these approaches, do not account other relevant factors (e.g. environmental, financial costs, legal, and social, among others) to find the best compromise suitable to the final occupant needs and requirements [14, 15, 16, 17].
Other approaches, are based on multicriteria decision making (MCDM) techniques, where it’s chosen the best alternative in each set of viable options. However, such criteria, are usually conflicting on nature, giving therefore a solution that it is impossible to be optimal against all criteria, and at same time, a feasible solution that satisfies the requirements of the building’s final user/occupant.
Nowadays, some works have suggested MCDM models to support professionals to solve problems, associated with the retrofitting of buildings, by taking into consideration factors, such as the degradation of building elements, energy efficiency, and internal environment comfort (e.g. [18]). Other similar approaches can be found on literature, based on ranking of alternative solutions (e.g. [19]).
Some works are even concerned into provide the decision-maker with a rating of retrofit plans of the considered building, according to an extended list of criteria like energy efficiency, environmental impact, economicalrationality, comfort and duration under life cycle among others (e.g. [19]).
In the same context, there are also other MCDM models found on literature, that combines optimization with multicriteria techniques in order to obtain feasible solutions, by exploring a large number of alternative measures/solutions, which were pre-selected, according to a set of criteria, suitable to the consumer needs (e.g. [13, 20]).Some of these approaches, explore several issues (e.g. benefit-cost analysis, initial investment, CO2 savings, energy savings, among others) of retrofitting measures (e.g. [14, 21]).There also approaches that combines such measures with technologies (e.g. [13, 22]). However, such approaches don’t consider the different criteria regarding each household appliance, available on the market, regarding each dwelling and its occupants.
This issue becomes even more relevant,when it comes to electrical household appliances, since it’s considered a critical issue for the consumer, the evaluation of a set of alternative appliances, based on a set of criteria (e.g. energy consumption, environmental impact, investment cost, comfort, among others) to preform efficient decisions [16].
The pre-selection of efficient electrical household appliances from the market, according to a set of criteria previously defined, and integrated with optimization techniques, can also contribute to reduce the time in achieving such solutions, mainly due to the pre-reduction of the space decision. This becomes particularly relevant, since the consumer faces many alternative solutions available on market with different attributes, and therefore, facing several tradeoffs between them.
However, the use of traditional optimization techniques, usually begins with a single potential solution of the problem, which is iteratively manipulated until finding a final solution, normally unique [23], thus reducing the available feasible options to the DM (consumer), which is undesirable.
Additionally, some algorithms (like the ones based on gradient methods), have the inconvenient to find (frequently) a local minima or maxima, having therefore, some limitations on exploitation of the entire feasible region [24].
To cope with the difficulties presented above, they have been applied methods, based on metaheuristics, to provide a set of feasible solutions, such as greedy strategies (e.g. [25]), Particle Swarm Optimization (PSO) (e.g. [26, 27]), Simulated Annealing (SA) (e.g. [22]) and Genetic Algorithm (GA) (e.g. [28, 29]), among others.
These methods are characterized by stochastic nature, global search ability, and a large amount of implicit parallelism [30, 31]).
The use of evolutionary algorithms (GAs), like Genetic Algorithms (GAs), allows to obtain different and feasible solutions [31, 32, 33] i.e., different sets of efficient appliances to attend the consumer needs.
However, this metaheuristic methods, presents some disadvantages, mainly related to its control parameters and the sensitivity to its values, which demands a proper tuning of them [34].
Besides the needs of tuning, robustness and quality assessment, referred before, there is the existence of some influence of the objective function, as it shown on some studies (e.g. [35, 36]) which uses several objective functions to test the model and its behavior.
3 Materials
3.1 Problem statement and proposed model
The problem presented here, will consider a decision-agent (consumer), who wants to buy a set of electrical household appliances (energy services) available on the market, regarding each type of appliance/energy service, as follows:
Air conditioning
Washing Machine
Dishwasher
Oven
Clothe dryer machine
Lighting
Refrigerator
The consumer has a limited budget to acquire the household appliances need it, and after a market research, it achieved a set of available solutions (Figure 1).

Consumer’s decision space: Options and dimensions considered
Given the trade-off, and the diversity of features regarding each solution, the consumer will be confronted with a problem of combinatorial nature, where the number of combinations is dependent on the number of available options regarding each dimension.
Then, and for each type of appliance, it will be corresponded to a dimension of the problem, as it shown on Figure 1.
The number of possible combinations, can be reduced, according to a set of criteria previously established, to suit to the consumer needs. This number of combinations, can be even reduced, by assuming that the consumer cannot perform any choice or individual solution (xij), given his limited budget.
Therefore, the number of combinations shown on Figure 1, can be reduced and formulated, after the appliances, being pre-selected from the market, according to a set of criteria, leading to the space decision, presented on Figure 2. The criteria is established and suitable, according to the case study considered; i.e. the correspondent values, are defined according to number of occupants and building dimensions (regarding air conditioner).

Consumer’s decision space: Problem formulation
Each individual solution (xij), corresponds to an option i, belonging to a problem dimension j, correspondent for each type of appliance, that will be purchased by the consumer.
One way to promote energy efficiency through household’s appliances is to maximize their utility, by selecting the adequate household appliances to suite the consumer needs. This can be done, by considering some aspects, such as number of household occupants, the user needs, etc.
The case study, used here, has considered a consumer as part of a household with tree other occupants (e.g. family).
The influence of consumer usage profile, was also considered, by concerning the number of hours that each appliance will perform daily, extrapolating then for a monthly and yearly basis (Table 1).
Assumptions taken, regarding the consumer usage profile
| Emission factor [gCO2/kWh] | 675 | Discount Factor [%] | 7 | |
|---|---|---|---|---|
| Life cycle (usage phase) considered [years]: | 10 | Annual Factor | 7,02 | |
| Electrical Energy tariff [€/kWh] | 0,162 | |||
| Energy Service | Usage Profile | (h) | ||
| Daily | Weekly | Monthly | Annual | |
| Air Conditioner | 2 | 14 | 60 | 720 |
| Washing Machine | 1 | 7 | 30 | 360 |
| Dryer Machine | 1 | 7 | 30 | 360 |
| Refrigerator | 11 | 77 | 330 | 3960 |
| Electric Oven | 1 | 7 | 30 | 360 |
| Dish Washing Machine | 1 | 7 | 30 | 360 |
| Lighting | 3 | 21 | 90 | 1080 |
Proposed model
The impact of such parameters, relies on consumption, regarding each appliance. Therefore, and considering each individual efficient solution, i, belonging to energy service j, it was calculated the correspondent savings, regarding its consumption as well as its initial investment. This savings, results through the comparison of the values of efficient solutions (consumption and investment) to the standard (i.e. less efficient) ones, regarding each dimension j, and discounted according to the life cycle period (usage phase), by using a discount factor, both considered on Table 1.
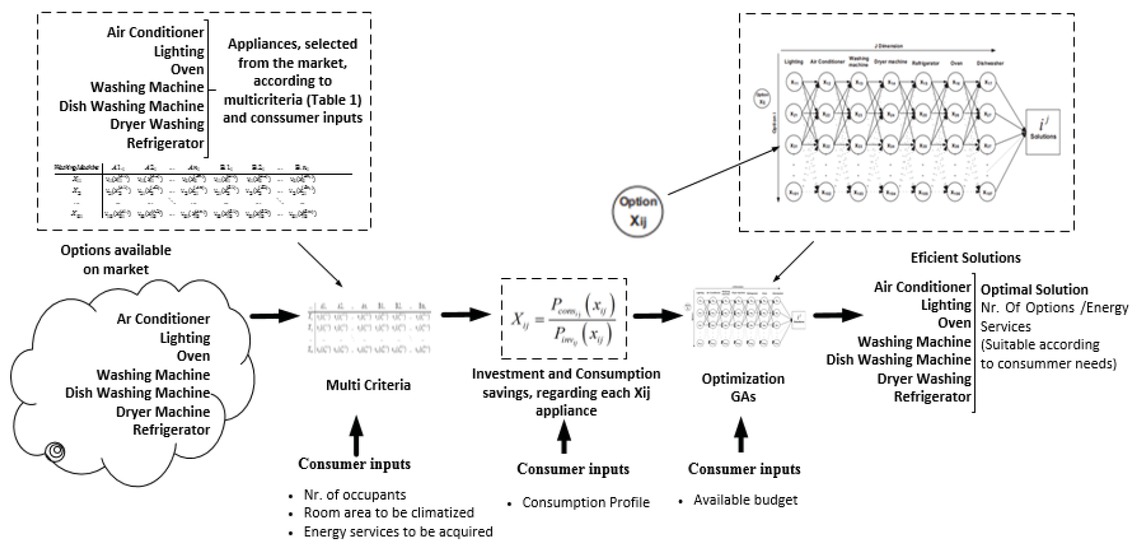
Solutions were pre-selected, according to a set of criteria to reduce the decision space, accounting only the suitable solutions to the consumer needs, increasing at the same time GAs efficiency (by achieving optimal solutions with less time). Such criteria, are presented next. Given what was referred before, the proposed approach, can be represented, according to the diagram presented on Figure 4.

Encoding problem using genetic algorithms
3.2 Adopted criteria considering the case study
Air conditioning
The Air Conditioner electric consumption share, represents about 2% of the total electric energy, regarding the residential buildings in Portugal [7].
In this work, we have considered the following types of air conditioner:
Wall (mono split)
Wall (multi split)
Monoblock
Portable
In this work it was considered just the living room as the zone to be heated/ cooled by the air conditioner. In order to define the needs for heating / cooling, and therefore the air conditioner capacity, it was considered the following issues, adopted on thermal loads calculations [37, 38, 39]:
Internal gains (Nr. of occupants, electric appliances, etc.)
Air change (forced or natural)
Solar radiation (windows, etc.)
Heat losses through the envelope (conduction through the external walls)
As a result of these calculations, the minimum capacity obtained was 10189 Btu/h, and the devices were preselected respecting the minimum value obtained, both for heating, as well for cooling needs.
Washing Machine
The washing machine is nowadays one of the most used appliances in households, representing thus about 5% of the total building electric energy consumption [6].
The highest cloth capacities of some machines, normally expressed in kilograms (kg) [6], requires sometimes higher costs of consumed water.
The cloth capacity allows to adjust the capacity of the washing machine according to the consumer needs, to avoid situations like having washing cycles with the machine far from a full load, which leads to a situation of waste of water and electric energy losses.
Therefore, it is important to consider the number of household’s occupants, to determine the washing machine Load Capacity. This is shown in Table 2.
Thus, and for the present case study, the choices were made by taking into consideration, seven kilograms of load capacity.
Dishwasher
The dish-washer machine represents about 3% of the overall consumption of a residential sector [6]. The choice of the type of appliance can be done by adjusting the appliance capacity to satisfy the occupant’s needs. In this case, the capacity to be considered, was defined by choosing the value through Table 3.
Dish washing machine load capacity [6]
| No.Occupants | Load Capacity [cutlery] |
|---|---|
| 1 | <10 |
| 2-3 | 10-12 |
| 4or more | =12 |
Thus, and for the case study only dish washing machines with a 12 cutlery of load capacity were considered.
Ovens
Electric ovens, represents about 1% of the overall consumption of a residential fraction [7].
However, if we take into consideration the consumption and use of many households (e.g. a city, region, country, etc.) the aggregate consumption, can assume significant values.
The criteria for choosing ovens were the useful volume, or the volume available to cook the food, adjustable to the number of occupants, although this can vary from model to model, as it shown on Table 4.
The choices were made by taking into consideration, the average size.
Clothes dryer machines
The consumption of these machines represents about 2% of total consumption of electricity in a household [7].
For these machines the previous selection was made by considering two types of clothes dryer machines:
Clothes dryer machines by exhaust
Clothes dryer machines by condensation
Another criteria, that has been considered, was the load capacity, by choosing a value from Table 1, according to the number of occupants.
Therefore, the previous choices were made by taking into consideration, seven kilograms of load capacity.
Lighting
Representing about 12% of total electric energy consumption in the residential sector [7], lighting is one of the most relevant appliances to reduce energy consumption, therefore the several technologies, available on market. The technologies and the used criteria for the present case are shown on Table 5.
Light technologies and criteria [6]
| Features/ criteria | Incandescent | Fluorescent | ||
|---|---|---|---|---|
| Lamps | Lamps | |||
| Classic | Halogen | Tubular | CFL | |
| Power (W) | 15-2000 | 20-2000 | 15-58 | 9-23 |
| Light Efficiency (lumen/W) | 8-15 | 15-25 | 58-93 | 55-65 |
| Life Cycle (h) | 1000 | 2000 | 12000 - 18000 | 6000 - 15000 |
Thus, and for the number of occupants, considered in this case, the options were made by taking into consideration, the quantity of investments needed by technology to be equal to other, for the same considered period (10 years).
Refrigerator
The refrigerators are appliances with the highest penetration rate in the residential sector in Portugal, contributing with about 22% of domestic energy consumption [7].
There are on the market several types of refrigerators according to its capacity (Table 6).
Types of refrigerators [6]
| Type | No. | N. | Average |
|---|---|---|---|
| Simple | Stars ** | Occupants 1-2 | Capacity [l] 180/200 |
| Combined | ** | 2-6 | 225/320 |
| “American” type | ** | =6 | 550 |
Based on Table 6, and considering the number of occupants in this case, the options were made by considering, the Combined type.
3.3 Problem formulation
Decision variables
Based on the diagram of Figure 2, we can define the decision variables of the problem:
Where xij represents the option i regarding the dimension j of the problem.
Formulation hypothesis
Let VR be the value associated with the objective function expressed as follows:
VR(x) is a cost function that may be written in the form of:
with
The parameter aij(xij), is a function regarding option i and dimension j. It’s defined in accordance with the formulation, considered in this work.
The parameters Pcons.ij (xij) and Pinv.ij(xij) are the savings regarding consumption and investment, respectively, which are relative to each solution xij.
Both parameters were obtained, by preforming LCCA calculations in order to compare each solution values, with those from the respective standard (i.e. less efficient) ones.
One of the objectives of this work, was to assess the influence of formulation (by modifying the fitness function) in getting good solutions to the problem presented before. The constraints, used on each formulation, are the same, and they were presented before.
Therefore, it was considered four different types of formulation, which are presented on the following sections.
1st Formulation
In this case, and for the aij(xij), it was considered the sum of existing savings, regarding consumption as well as the investment, i.e.:
Thus, based on expressions (3) and (5), we obtain:
Therefore, it is obtained an objective function, whose terms reflect the sum of savings, regarding the investment and consumption, with the choice of a given solution xij.
2nd Formulation
This formulation aims to establish a relationship between the values of savings, regarding the consumption made during the appliance’s life cycle, as well as the savings, regarding the investment, considered for each appliance, by using the same parameters as in the 1st Formulation, i.e.:
Therefore, through the expressions (3) and (7), we obtain:
However, and when trying to reach the best solution by using this formulation, some of the dimensions, have revealed more influence over the others, which has resulted in a problem to obtain the global solution. As it has been pointed by [40, 41, 42, 43, 44], this situation can happen, since, and when finding the best solution, the search occur only in the dimensions with greater influence on the objective function, resulting thus into bad exploitation of the space decision.
3rd Formulation
In order to try to avoid the previous situation referred before, it was tested a 3rd formulation, by considering a factor γ (xij )applied to aij, expressed on (7), i.e.:
Then, and through the expressions (3) and (9), we obtain the follow expression for objective function (VR):
Being γij(xij), the factorfactor applied to each dimension, given by:
This factor evalutes the influence of a given option i belonging to a given dimension j in terms of the total investment made, related to the global solution obtained.
4th Formulation
The 4th Formulation, wants to assess GAs behavior - and therefore the solutions obtained - by the consumption during each standard option life cycle
Thus, and based on referred before, the aij(xij), can be defined as:
Based on expressions (3) and (14), we obtain:
or:
Being αij, the factor applied to each dimension, obtained here by making:
Like the 3rd Formulation, it is also applied a factor so that the GAs, can perform a search as uniform as possible considering all the problem dimensions.
3.4 Application
Introduction to case study
In order to present an example of a solution, obtained from the method, it was considered a case of a family formed by 4 elements (building occupants), with an element (consumer) pretending to acquire a set of appliances (referred before), although having a limited budget to do.
GAMS & GAS implementation
For the application we have considered the case study presented before and used a VBA MS Excel Spreadsheet software for the implementation of GAs, and GAMS software for the Simplex implementation, in order to validate the obtained results within the GAs use.
According to the formulation presented before, each problem solution/individual, will be coded in GA’s, according to the framework presented on Figure 4, by using binary coding, where each “active bit”, represents one optimal choice, regarding each individual solution.
For GA’s implementation, it was considered the following parameters:
Initial population: 100 individuals
Selection method: Roulette
Crossover method: single point
Crossover rate: 0.45
Mutation: Normal Random
Mutation rate: 0.01
Convergence: 0.001
Maximum number of generations: not defined
4 Results & Discussion
4.1 1st Part – GAs behavior with formulation
The following simulations, regarding each formulation, was performed by taking a set of assumptions:
Average No. Runs/budget scenario: 30
The remain ones are presented on Section 3.3.
The following results, presented on this section, regards the average solution of the objective function (Vr) and it concerns each value of the available budget.
Regarding the investment made by the consumer, it was considered a budget scenario that varies from 1800 up to 3000 euros.
1st Formulation
The results, obtained with the 1st Formulation, are shown on Figures 5-6, respectively to the investment and the value of the objective function.

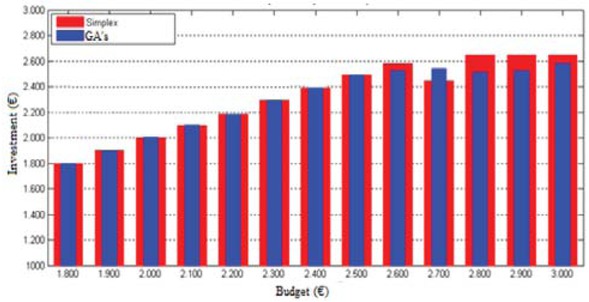
Average values (30 runs) of total investment to be supported, at each value of the budget considered (1st Formulation)

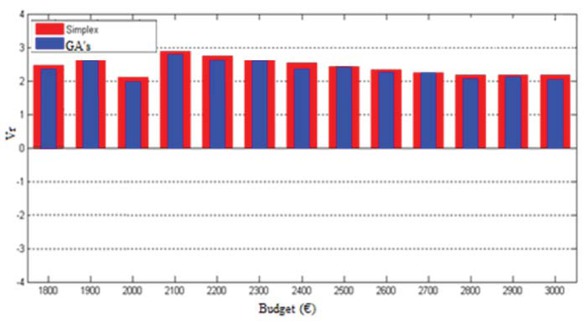
Average values (30 runs) of the objective function (Vr) for each scenario / budget (1st Formulation)
Based on Figures 5 and 6, it is noticed that GAs can provide more and different solutions (when compared with Simplex results) by exploring more effectively the feasible region, compared to Simplex, and for the different values of budget considered.
The difference between GAs and Simplex (average) solutions, was assessed, by considering the worst and the best budget scenarios:
Worst budget scenario
Best budget scenario
Although Simplex, has provided better Vr values (Figure 6), the difference between GAs and Simplex (on average), can reach 2.0% in the worst scenario and 0,44% in the best scenario.
On average, GAs have presenting an average number of generations/run of 56 and an average CPU time of 8,7 s.
In order to illustrate the performance of GA’s with the formulation considered, on Figure 7 it is illustrated the evolution of fitness value for a budget of 1900 euros, corresponding to the best individual on each generation.

Evolution of fitness, corresponding to the best individual of each generation, for a budget constraint of 1900 euros (1st Formulation)
2nd Formulation
The results, obtained with the 2nd Formulation, are shown on Figures 8 and 9, respectively to the investment and the value of the objective function.

Average values (30 runs) of total investment to be supported, at each value of the budget considered (2nd Formulation)

Average values (30 runs) of the objective function (Vr) for each scenario / budget (2nd Formulation)
By observing Figures 8 and 9, and comparing the 2nd Formulation with the 1st one, there is more exploitation of the feasible region by GAs or even by Simplex, which reveals some influence by the formulation chosen, as it already referred in some published works [39, 40, 41].
The difference between GAs and Simplex (average) solutions, was also assessed, by considering the worst and the best budget scenarios:
Worst budget scenario
Best budget scenario
Although Simplex, has provided better Vr values (Figure 9), the difference between GAs and Simplex (on average), can reach 0,53% in the worst scenario and 3,21% in the best scenario.
On average, the 2nd Formulation have allowed GAs to converge with less time than the 1st one, by presenting an average number of generations/run of 48 and an average CPU time of 6,6 s.
In order to illustrate the performance of GA’s with the formulation considered, on Figure 10 it is illustrated the evolution of fitness value for a budget of 1900 euros, corresponding to the best individual on each generation.

Evolution of fitness, corresponding to the best individual of each generation, for a budget constraint of 1900 euros (2nd Formulation)
Compared to the 1st Formulation, and by observing Fig.9, it is noticed that GAs is on average faster (i.e., with less generations) when achieving a steady fitness value.
3rd Formulation
The results, obtained with the 1st Formulation, are shown on Figures 11 and 12, respectively to the investment and the value of the objective function.

Average values (30 runs) of total investment to be supported, at each value of the budget considered (3rd Formulation)
Average values (30 runs) of the objective function (Vr) for each scenario / budget (3rd Formulation)
The difference between GAs and Simplex (average) solutions, was assessed, by considering the worst and the best budget scenarios:
Worst budget scenario
Best budget scenario
Although Simplex, has provided better Vr values (Figure 12), the difference between GAs and Simplex, can reach on average, 7,69% in the worst scenario and 0,43% in the best scenario.
On average, the 2nd Formulation have allowed GAs to converge with less time than the 1st Formulation, although slower than 2nd one, by presenting an average number of generations/run of 43 and an average CPU time of 6,9 s.
In order to illustrate the performance of GA’s with the formulation considered, on Figure 13 it is illustrated the evolution of fitness value for a budget of 1900 euros, corresponding to the best individual of each generation.

Evolution of fitness, corresponding to the best individual of each generation, for a budget constraint of 1900 euros (3rd Formulation)
With the present formulation, GAs has revealed a little faster than the previous formulations presented before, by reaching the steady fitness value earlier with an average of 43 generations.
4th Formulation
The results, obtained with the 4th Formulation, are shown on Figures 14 and 15, respectively to the investment and the value of the objective function.
Average values (30 runs) of total investment to be supported, at each value of the budget considered (4th Formulation)

Average values (30 runs) of the objective function (Vr) for each scenario / budget (4th Formulation)
The difference between GAs and Simplex (average) solutions, was assessed, by considering the worst and the best budget scenarios:
Worst budget scenario
Best budget scenario
Although Simplex, has provided better Vr values (Figure 14), the difference between GAs and Simplex, can reach (on average) 29,03% in the worst scenario and 0,0% in the best scenario,where GAs results are (on average) better in this budget scenario.
In order to illustrate the performance of GAs with the formulation considered, on Figure 16 it is illustrated the evolution of fitness value for a budget of 1900 euros, corresponding thus to the best individual on each generation.

Evolution of fitness, corresponding to the best individual of each generation, for a budget of 1900 euros (4th Formulation)
It is noticed an average of 67 generations/run to reach the steady value of the objective function, which is more than the previous formulations.
On average, the 4th Formulation have allowed GAs to converge with an average CPU time of 7,1 s.
Formulation chosen
Considering the presentation and discussion of the four formulations presented before, it was obtained a set of results which are summarized on Table 7, as follows:
Summary results obtained from the four Formulations considered
| Form. | Worst Vr(%) | Best Vr(%) | Time(s) | Gen./run |
|---|---|---|---|---|
| 1 | 2,00 | 0,44 | 8,7 | 56 |
| 2 | 3,21 | 0,53 | 6,6 | 48 |
| 3 | 1,97 | 0,43 | 6,9 | 43 |
| 4 | 29 | 0,00 | 7,1 | 67 |
Therefore, and based on the results presented on Table 7, it was decided to choose the 2nd Formulation, in order to proceed with the robustness test, as well as its validation, with an example of its application through the case study presented before. A statistical analysis, was also performed to both Formulations presented here. In the next subsection, it shall be presented the statistical analysis, preformed for the 3rd Formulation.
4.2 2nd Part – Statistical & Robustness analysis
Statistical Analysis
Due to the stochastic nature of the method, it was performed a statistical analysis to assess its consistency, as it suggested in some of related works with metaheuristics (e.g. [45, 46]).
The statistical analysis, was performed with 30 runs/budget constraint scenario on solving the same problem by GAs, whose results were obtained and presented on Table 8.
Statistical analysis, considering 30 runs/budget constraint scenario of GAs (vs Simplex)
| Objective function (Vr) | ||||||||||||||
|---|---|---|---|---|---|---|---|---|---|---|---|---|---|---|
| Constraint Budget Scenario (x1000) [€] | 1.8 | 1.9 | 2.0 | 2.1 | 2.2 | 2.3 | 2.4 | 2.5 | 2.6 | 2.7 | 2.8 | 2.9 | 3.0 | |
| Simplex | - | −3.64 | 3.13 | 2.10 | 2.35 | 2.12 | 2.16 | 2.14 | 2.12 | 2.10 | 2.25 | 2.17 | 2.11 | 2.17 |
| GAs | Min. | 1.77 | 1,82 | 1.91 | 2.19 | 2.01 | 2.02 | 2.02 | 2.05 | 1.93 | 2.19 | 2.05 | 1.91 | 2.02 |
| Average | 1.78 | 1,90 | 1.92 | 2.20 | 2.02 | 2.02 | 2.03 | 2.06 | 1.94 | 2.20 | 2.05 | 1.90 | 2.03 | |
| Max. | 1.78 | 1,93 | 1.93 | 2.22 | 2.02 | 2.03 | 2.05 | 2.06 | 1.95 | 2.20 | 2.07 | 1.97 | 2.06 | |
| Std. dev. (x10−1) | 0.11 | 0,12 | 0.01 | 0.17 | 0.18 | 0.12 | 0.12 | 0.17 | 0.19 | 0.12 | 0.14 | 0.17 | 0.10 | |
Through the values presented on Table 8, we observe that the low values of the standard deviation of the objective function (Vr) achieved by GAs, validates its robustness for solving the problem, presented in this case study.
The highly similar optimal results with worst negligible standard deviation (0.001), validates the robustness of GAs for solving the problem of the considered case study (for a budget constraint scenario of 2000 euros). Although, and according to Table 7, the biggest range of the objective function (Vr) obtained by GAs for 30 independent runs, is between 1.82 to 1.93 (budget constraint scenario of 1900 €), which also shows that GAs converge to almost the same optimal.
Robustness Analysis
As it was referred before, GA’s are affected by its control parameters (crossover and mutation rates, as well as population size) therefore the need to tune both, as it shown on several studies (e.g. [42]).
The crossover rate value, was fixed into 0.70 and the last two parameters, were obtained by preforming a sensitivity analysis, with 15 runs/budget constraint scenario. The mutation rate was varied, from 0 up to 10%. The population size was varied, from 50 up to 700.
The correspondent results are presented on Table 9, where the maximum iteration values (number of generations) was remained unfixed.
Sensitivity analysis (mutation rate and population size), considering 30 runs/budget constraint scenario of GAs (compared with Simplex)
| Mutation rate (%) | 0 | 1 | 2 | 3 | 4 | 5 | 6 | 7 | 8 | 9 | 10 | ||||
|---|---|---|---|---|---|---|---|---|---|---|---|---|---|---|---|
| Simplex | 3,07 | 3,07 | 3,07 | 3,07 | 3,07 | 3,07 | 3,07 | 3,07 | 3,07 | 3,07 | 3,07 | ||||
| GAS | Minimum | 1,74 | 2,21 | 2,44 | 2,92 | 3,05 | 3,06 | 3,06 | 3,05 | 3,04 | 3,01 | 2,83 | |||
| Average | 1,74 | 2,21 | 2,44 | 2,93 | 3,05 | 3,06 | 3,06 | 3,05 | 3,04 | 3,01 | 2,83 | ||||
| Maximum | 1,75 | 2,21 | 2,44 | 2,93 | 3,06 | 3,06 | 3,07 | 3,05 | 3,04 | 3,02 | 2,83 | ||||
| Standard | 0,88 | 0,69 | 1,18 | 0,88 | 0,98 | 0,78 | 0,87 | 0,95 | 0,98 | 1,47 | 0,87 | ||||
| dev. | |||||||||||||||
| (x10−3) | |||||||||||||||
| Population size (individuals) | 50 | 100 | 150 | 200 | 250 | 300 | 350 | 400 | 450 | 500 | 550 | 600 | 650 | 700 | |
|---|---|---|---|---|---|---|---|---|---|---|---|---|---|---|---|
| Simplex | 3,07 | 3,07 | 3,07 | 3,07 | 3,07 | 3,07 | 3,07 | 3,07 | 3,07 | 3,07 | 3,07 | 3,07 | 3,07 | 3,07 | |
| GAS | Minimum | 2,64 | 2,74 | 2,92 | 3,06 | 3,05 | 3,04 | 3,06 | 3,05 | 3,04 | 3,03 | 2,98 | 2,94 | 2,79 | 2,19 |
| Average | 2,65 | 2,74 | 2,93 | 3,06 | 3,05 | 3,04 | 3,06 | 3,05 | 3,04 | 3,04 | 2,98 | 2,94 | 2,79 | 2,19 | |
| Maximum | 2,65 | 2,75 | 2,93 | 3,07 | 3,05 | 3,04 | 3,07 | 3,05 | 3,04 | 3,04 | 2,99 | 2,95 | 2,80 | 2,19 | |
| Standard | 0,88 | 0,69 | 1,18 | 0,98 | 0,98 | 0,78 | 1,27 | 0,95 | 1,18 | 1,47 | 0,87 | 0,78 | 1,12 | 1,14 | |
| dev. | |||||||||||||||
| (x10−3) | |||||||||||||||
By analyzing the average values of Vr, for a given budget constraint scenario, the sensitivity analysis was carried out to find the best control parameter. The results have shown, that for an interval of 4-7% of mutation rate, the average value of Vr, are on its maximum value, although the interval between 200 and 400 individuals, has revealed to be the most suitable one, given the adopted formulation.
3rd Part – A model solution
On Table 10, it’s presented an example of a feasible solution obtained by the GAs, considering a budget of 2600 Euros, and using the 3rd Formulation.
Example of an efficient solution obtained from this approach
| Dimension | Stand. Solution | Effic. Sol. | Invest. | Consum. | CO2 | Life | Brand | Model |
|---|---|---|---|---|---|---|---|---|
| Total Invest. (€) | Total | Saving | Saving | Savings | cycle | |||
| Invest. (€) | (€) | (€) | (kg) | |||||
| Lighting | 15,89 | 10,55 | 5,34 | 58,44 | 28,5 | 8000h | A | A1 |
| Air Conditioning | 368,0 | 299,0 | 69,0 | 1315,6 | 1315,57 | 10 yrs | B | B2 |
| Refrigerator | 250,0 | 529,0 | −279,0 | 704,11 | 8,5 | 10 yrs | C | C2 |
| Dishwasher Machine | 310,0 | 349,0 | −39,0 | 3,2 | 6,2 | 10 yrs | D | D4 |
| Washing Machine | 262,0 | 294,0 | −32,0 | 6,85 | 94,8 | 10 yrs | E | E1 |
| Oven | 170,0 | 199,0 | −29,0 | 1,3 | 2,6 | 10 yrs | F | F2 |
| Clothes dryer | 349,0 | 419,0 | −70,00 | 11,32 | 1,8 | 10 yrs | C | C6 |
| Total: | 1724,9 | 2099,6 | −374,7 | 2100,8 | 1458,0 | - | - | - |
It is also presented the CO2 savings, regarding the choice of this solution, compared with the less efficient (standard) one (approx. values).
CO2 savings were calculated by using a carbon footprint indicator (emission factor), obtained from [44].
According to Table 10, if the consumer, opts for the efficient solution, he can save up to € 215.6 (€ 1,447.1€ −1231.5), further contributing to a reduction of about 1452,9 kg of CO2 for a time horizon of 10 years, according to life cycle considered in this work.
5 Conclusions
In this work, it was presented an approach, to support the decision-agent (consumer) with an efficient or a set of efficient solutions, that attends its specific needs, promoting therefore, savings on energy consumption, initial investment and CO2 emissions.
The decision agent (consumer), has the possibility to use the method to select an optimal set of appliances from the market, and according to its needs.
The criteria used, is regarding each type of energy service (electrical appliance) to be considered by the consumer on its decision. The optimization was then performed by using Genetic Algorithms (GAs) to provide several alternative efficient solutions.
Besides the advantage of GAs, in getting several optimal solutions to the consumer, there is a need to assess the quality of such solutions, as well as its behavior in terms of convergence and robustness, due its control parameters.
The influence of the adopted formulation was also studied, by proposing four different approaches. The average results, were very different, as well as GAs behavior, which shows the importance of the formulation to achieve better results, with the 3rd to be chosen.
In general, GAs have provided quality solutions, given the small difference, between GAs solutions and the ones achieved with Simplex method, even for each budget constraint scenario.
The statistical analyzes of its convergence behavior, has shown that GAs have demonstrated some consistency on the final achieved results, given the negligible standard deviation reached, as well as on convergence characteristics, demonstrating therefore high convergence on early iterations.
The high robustness of GAs was also demonstrated, even for mutation rate, or even for the population size, by previously tuning its parameters (mutation rate and population size).
At the end, the approach has provided an example of an efficient solution, given the case study presented here.
Although the best results, was achieved with Simplex, GAs allows diversity and quality within obtained solutions
The model can also be extended into other problem dimensions or energy services.
References
[1] Matias, J.C.O., Devezas, T.C., Socio-Economic Development and Primary Energy Sources Substitution towards Decarbonization, Low Carbon Economy, 2011, 2, 49-53.10.4236/lce.2011.22008Search in Google Scholar
[2] IPCC, Climate Change 2014: Mitigation of Climate Change Summary for Policymakers and Technical Summary, Intergovernmental Panel on Climate Change (IPCC), 2012, ISBN 978-92-9169-142-5Search in Google Scholar
[3] IEA, Energy Efficiency 2017 – Market Reports Series, 2017, OECD/IEA.Search in Google Scholar
[4] Gul, M., Patidar. S., Understanding the energy consumption and occupancy of a multi-purpose academic building, In Energy and Buildings, 2015, 87, Pages 155-16510.1016/j.enbuild.2014.11.027Search in Google Scholar
[5] Santos, C., P., Reabilitação de edifícios para promoção do conforto e da eficiência energética, Net-Zero Energy Buildings Conference (1st) LNEG, (Lisbon, Portugal), 2012 (in Portuguese).Search in Google Scholar
[6] DGEG, Eficiência Energética em Edifícios – Programa E4. 2002, Lisbon: Direção Geral de Energia e Geologia (in Portuguese).Search in Google Scholar
[7] ADENE, Manual da Etiqueta Energética, 2017, Lisbon: ADENE, ISBN: 978-972-8646-36-3 (in Portuguese)Search in Google Scholar
[8] Wong, I., L., Krüger, E., Comparing energy efficiency labelling systems in the EU and Brazil: Implications, challenges, barriers and opportunities, In Energy Policy, 2017,109, 310-323, ISSN 0301-421510.1016/j.enpol.2017.07.005Search in Google Scholar
[9] Hoxha, E., Jusselme, T., On the necessity of improving the environmental impacts of furniture and appliances in net-zero energy buildings, In Science of The Total Environment, 2017, 596–597, 405-416, ISSN 0048-969710.1016/j.scitotenv.2017.03.107Search in Google Scholar PubMed
[10] Fell, M.J., Energy services: A conceptual review. Energy Research & Social Science, 2017, 27, 129–140, ISSN 2214-629610.1016/j.erss.2017.02.010Search in Google Scholar
[11] Lee, Y. M., et al., Modeling and simulation of building energy performance for portfolios of public buildings, in Proc. Winter Simulat. 2011, Phoenix (USA), 915–927.10.1109/WSC.2011.6147817Search in Google Scholar
[12] Chuah, J. W., Raghunathan, A., Jha, N. K., ROBESim: A retrofitoriented building energy simulator based on EnergyPlus, Energy Build., 2013, 66, 88–103.10.1016/j.enbuild.2013.07.020Search in Google Scholar
[13] Jafari, A., Valentin, V., An optimization framework for building energy retrofits decision-making, Building and Environment, 2017, 115, 118-129,ISSN 0360-1323, https://doi.org/10.1016/j.buildenv.2017.01.020.(http://www.sciencedirect.com/science/article/pii/S0360132317300331)10.1016/j.buildenv.2017.01.020Search in Google Scholar
[14] Asadi, E., Silva, M. G., Antunes, C. H., Dias, L., Multi-objective optimization for building retrofit strategies: A model and an application, Energy Build., 2012, 44, 81–8710.1016/j.enbuild.2011.10.016Search in Google Scholar
[15] Asadi, E., Silva, M. G., Antunes, C. H., Dias, L., Multi-objective optimization for building retrofit strategies: A model and an application, Energy and Buildings, 2012, 44, 81-87, ISSN 0378-778810.1016/j.enbuild.2011.10.016Search in Google Scholar
[16] Kolokotsa, D., Diakaki, C., Grigoroudis, E., Stavrakakis, G., Kalaitzakis, K., Decision support methodologies on the energy efficiency and energy management in buildings, Adv. Build. Energy Res., 2009,1, 121–14610.3763/aber.2009.0305Search in Google Scholar
[17] Malatji, E., M., Zhang, J., Xia, X., A multiple objective optimization model for building energy efficiency investment decision, Energy and Buildings, 2013,61,81-87, ISSN 0378-7788.10.1016/j.enbuild.2013.01.042Search in Google Scholar
[18] Caccavelli, D., Gugerli, H., Tobus, A European diagnosis and decision-making tool for office building upgrading, Energy Build., 2002, 34, 113–119.10.1016/S0378-7788(01)00100-1Search in Google Scholar
[19] Roulet, C. A., Flourentzou, F., Labben, H.H.M. Santamouris, I. Koronaki, E. Dascalaki, V. Richalet, ORME: A multicriteria rating methodology for buildings, Build. Environ., 2002, 37, 579–58610.1016/S0360-1323(02)00005-7Search in Google Scholar
[20] Pombo, O., Allacker, K., Rivela, B., Neila, J., Sustainability assessment of energy saving measures: a multi-criteria approach for residential buildings retrofitting the case study of the Spanish housing stock, Energy Build. 2016, 116, 384 and 394.10.1016/j.enbuild.2016.01.019Search in Google Scholar
[21] Matias, J.C.O.; Santos, R.; Abreu, A. A Decision Support Approach to Provide Sustainable Solutions to the Consumer, by Using Electrical Appliances. Sustainability 2019, 11(4), 1143, DOI:10.3390/su1104114310.3390/su11041143Search in Google Scholar
[22] Tan, B., Yavuz, Y., Otay, E. N., Çamlıbel, E., Optimal selection of energy efficiency measures for energy sustainability of existing buildings, Computers & Operations Research, 2016, 66, 258-271, ISSN 0305-0548, https://doi.org/10.1016/j.cor.2015.01.01310.1016/j.cor.2015.01.013Search in Google Scholar
[23] Antunes, C.H., Maria, J.A., Clímaco, J., Multiobjective Linear and Integer Programming, 2016, Springer, ISBN 978-3-319-28744-7.10.1007/978-3-319-28746-1Search in Google Scholar
[24] Antunes, C.H., Takahashi, R., Gaspar-Cunha, A., Manual de Computação Evolutiva e Meta Heurística, 2007, Coimbra: Coimbra University Press, ISBN: 9789892601502 (in Portuguese)Search in Google Scholar
[25] Ogwumike C, Short M, Abugchem F., Heuristic Optimization of Consumer Electricity Costs Using a Generic Cost Model. Energies 2016, 1, 6.10.3390/en9010006Search in Google Scholar
[26] Ting, T.O., Rao, M.V., Loo, K.C. A novel approach for unit commitment problem via an effective hybrid particle swarm optimization. IEEE Trans. Power Syst., 2006, 21, 411–418.10.1109/TPWRS.2005.860907Search in Google Scholar
[27] Matias, J.C.O.; Santos, R.; Abreu, A, Reis, F., Evolutionary algorithms on reducing energy consumption in buildings: An approach to provide smart and efficiency choices, considering the rebound effect., Computers & Industrial Engineering, 2018, vol. 126, 729–755, DOI:10.1016/j.cie.2018.09.050.10.1016/j.cie.2018.09.050Search in Google Scholar
[28] Agrawal, P.; Rao, S., Energy-aware scheduling of distributed systems. IEEE Trans. Autom. Sci. Eng., 2014,11, 1163–1175.10.1109/TASE.2014.2308955Search in Google Scholar
[29] Ko, M.J.; Kim, Y.S.; Chung, M.H.; Jeon, H.C, Multi-objective design for a hybrid energy system using genetic algorithm. Energies, 2015, 8, 2924–2949.10.3390/en8042924Search in Google Scholar
[30] Santos, R., Matias, J.C.O., Abreu, A., Energy Efficiency in Buildings by Using Evolutionary Algorithms: An Approach to Provide Efficiency Choices to the Consumer, Considering the Rebound Effect, IFIP Advances in Information and Communication Technology, 2018, 521, 120–129, ISBN: 978-3-319-78574-5, DOI:10.1007/978-3-319-78574-5_1210.1007/978-3-319-78574-5_12Search in Google Scholar
[31] Randall, M., Rawlins, T., Lewis, A., Kipouros, T., Performance Comparison of Evolutionary Algorithms for Airfoil Design, In Procedia Computer Science, 2015, 51, 2267-2276, ISSN 1877-0509, https://doi.org/10.1016/j.procs.2015.05.38410.1016/j.procs.2015.05.384Search in Google Scholar
[32] Goldberg, E.D., Genetic Algorithms in Search Optimization and Machine Learning, 1989, Maryland: Addison Wesley.Search in Google Scholar
[33] Cortés, P., Muñuzuri, J., Berrocal-de-O, M., Domínguez, I., Genetic algorithms to optimize the operating costs of electricity and heating networks in buildings considering distributed energy generation and storage, Computers & Operations Research, 2018, 96, 157-172, ISSN 0305-0548, https://doi.org/10.1016/j.cor.2018.01.02010.1016/j.cor.2018.01.020Search in Google Scholar
[34] Aghay Kaboli, S. Hr., Selvaraj, J., Rahim, N.A., Rain-fall optimization algorithm: A population-based algorithm for solving constrained optimization problems, Journal of Computational Science, 2017, 19, 31-42, ISSN 1877-7503, https://doi.org/10.1016/j.jocs.2016.12.01010.1016/j.jocs.2016.12.010Search in Google Scholar
[35] Bertolini, A.C., Schiozer, D.J., Influence of the objective function in the history matching process, Journal of Petroleum Science and Engineering, 2011, 78, 32-41, ISSN 0920-4105, https://doi.org/10.1016/j.petrol.2011.04.012.(http://www.sciencedirect.com/science/article/pii/S0920410511000921)10.1016/j.petrol.2011.04.012Search in Google Scholar
[36] Tillier, E., Da Veiga, S., Derfoul, R., Appropriate formulation of the objective function for the history matching of seismic attributes, Computers & Geosciences, 2013,5164-73,ISSN0098-3004, https://doi.org/10.1016/j.cageo.2012.07.031.(http://www.sciencedirect.com/science/article/pii/S0098300412002762)10.1016/j.cageo.2012.07.031Search in Google Scholar
[37] Roriz, L., Climatização - Concepção, instalação e condução de sistemas (2nd ed.), 2007, Amadora: Orion (in Portuguese)Search in Google Scholar
[38] ASHRAE, ASHRAE handbook: Fundamentals. Atlanta, GA: American Society of Heating, Refrigeration and Air-Conditioning Engineers, 2009, Atlanta: ASHRAESearch in Google Scholar
[39] Lavric,V., Iancu, P. & Plesu, V., Fresh Waters Savings through Genetic Algorithm Optimization, In Conference on Process Integration Modelling and Optimization for Energy Saving and Pollution Reduction (7th) PRE’s 2006, 04,24 132-137. Bucharest.Search in Google Scholar
[40] Harik, G., Lobo, F. & Goldberg, E. D. The Compact Genetic Algorithm. IEEE Transactions on Evolutionary Computation, 1999, 3, 287-297.10.1109/ICEC.1998.700083Search in Google Scholar
[41] Ramos, D. S. & Susteras, G. L. (2006). Utilização de algoritmos genéticos para previsão de contratação da energia pelas distribuidoras. IEEE Latin America Transactions, 2006 4, 3-14 (in Portuguese).Search in Google Scholar
[42] Aghay Kaboli , S. Hr., Selvaraj, J., Rahim, N.A., Long-term electric energy consumption forecasting via artificial cooperative search algorithm, Energy, 2016, 1, 857-871, ISSN 0360-5442, https://doi.org/10.1016/j.energy.2016.09.01510.1016/j.energy.2016.09.015Search in Google Scholar
[43] Santos. R, Reis, F.S, An approach to provide smart and energy efficient decisions using evolutionary algorithms, 4ª Escola Luso Brasileira de Computação Evolutiva (ELBCE) Departamento de Matemática, Universidade de Coimbra, (Coimbra, Portugal), 2013, July 11-14 (in Portuguese)Search in Google Scholar
[44] Santos, R., Matias, J.C.O., Abreu, "An approach to provide efficient choices to a household consumer," 2019 International Young Engineers Forum (YEF-ECE), Costa da Caparica, Portugal, 2019, pp. 46–51. doi: 10.1109/YEF-ECE.2019.874082410.1109/YEF-ECE.2019.8740824Search in Google Scholar
[45] Santos, R., Matias, J.C.O., Abreu, A., Energy Efficiency in buildings by using evolutionary algorithms: An approach to provide efficiency choices to the consumer, considering the rebound effect, IFIP Advances in Information and Communication Technology, 2013, 521, 120–129, ISBN: 978-3-319-78574-5, DOI:10.1007/978-3-319-78574-510.1007/978-3-319-78574-5Search in Google Scholar
[46] Santos, R., Matias, J.C.O., Abreu, A., A New Approach to Provide Sustainable Solutions for Residential Sector, IFIP Advances in Information and Communication Technology, 2019, 553, 329– 342, ISBN: 978-3-030-17771-3, DOI:10.1007/978-3-030-17771-3_2910.1007/978-3-030-17771-3_29Search in Google Scholar
© 2019 R. Santos et al., published by De Gruyter
This work is licensed under the Creative Commons Attribution 4.0 International License.
Articles in the same Issue
- Regular Article
- Exploring conditions and usefulness of UAVs in the BRAIN Massive Inspections Protocol
- A hybrid approach for solving multi-mode resource-constrained project scheduling problem in construction
- Identification of geodetic risk factors occurring at the construction project preparation stage
- Multicriteria comparative analysis of pillars strengthening of the historic building
- Methods of habitat reports’ evaluation
- Effect of material and technological factors on the properties of cement-lime mortars and mortars with plasticizing admixture
- Management of Innovation Ecosystems Based on Six Sigma Business Scorecard
- On a Stochastic Regularization Technique for Ill-Conditioned Linear Systems
- Dynamic safety system for collaboration of operators and industrial robots
- Assessment of Decentralized Electricity Production from Hybrid Renewable Energy Sources for Sustainable Energy Development in Nigeria
- Seasonal evaluation of surface water quality at the Tamanduá stream watershed (Aparecida de Goiânia, Goiás, Brazil) using the Water Quality Index
- EFQM model implementation in a Portuguese Higher Education Institution
- Assessment of direct and indirect effects of building developments on the environment
- Accelerated Aging of WPCs Based on Polypropylene and Plywood Production Residues
- Analysis of the Cost of a Building’s Life Cycle in a Probabilistic Approach
- Implementation of Web Services for Data Integration to Improve Performance in The Processing Loan Approval
- Rehabilitation of buildings as an alternative to sustainability in Brazilian constructions
- Synthesis Conditions for LPV Controller with Input Covariance Constraints
- Procurement management in construction: study of Czech municipalities
- Contractor’s bid pricing strategy: a model with correlation among competitors’ prices
- Control of construction projects using the Earned Value Method - case study
- Model supporting decisions on renovation and modernization of public utility buildings
- Cements with calcareous fly ash as component of low clinker eco-self compacting concrete
- Failure Analysis of Super Hard End Mill HSS-Co
- Simulation model for resource-constrained construction project
- Getting efficient choices in buildings by using Genetic Algorithms: Assessment & validation
- Analysis of renewable energy use in single-family housing
- Modeling of the harmonization method for executing a multi-unit construction project
- Effect of foam glass granules fillers modification of lime-sand products on their microstructure
- Volume Optimization of Solid Waste Landfill Using Voronoi Diagram Geometry
- Analysis of occupational accidents in the construction industry with regards to selected time parameters
- Bill of quantities and quantity survey of construction works of renovated buildings - case study
- Cooperation of the PTFE sealing ring with the steel ball of the valve subjected to durability test
- Analytical model assessing the effect of increased traffic flow intensities on the road administration, maintenance and lifetime
- Quartz bentonite sandmix in sand-lime products
- The Issue of a Transport Mode Choice from the Perspective of Enterprise Logistics
- Analysis of workplace injuries in Slovakian state forestry enterprises
- Research into Customer Preferences of Potential Buyers of Simple Wood-based Houses for the Purpose of Using the Target Costing
- Proposal of the Inventory Management Automatic Identification System in the Manufacturing Enterprise Applying the Multi-criteria Analysis Methods
- Hyperboloid offset surface in the architecture and construction industry
- Analysis of the preparatory phase of a construction investment in the area covered by revitalization
- The selection of sealing technologies of the subsoil and hydrotechnical structures and quality assurance
- Impact of high temperature drying process on beech wood containing tension wood
- Prediction of Strength of Remixed Concrete by Application of Orthogonal Decomposition, Neural Analysis and Regression Analysis
- Modelling a production process using a Sankey diagram and Computerized Relative Allocation of Facilities Technique (CRAFT)
- The feasibility of using a low-cost depth camera for 3D scanning in mass customization
- Urban Water Infrastructure Asset Management Plan: Case Study
- Evaluation the effect of lime on the plastic and hardened properties of cement mortar and quantified using Vipulanandan model
- Uplift and Settlement Prediction Model of Marine Clay Soil e Integrated with Polyurethane Foam
- IoT Applications in Wind Energy Conversion Systems
- A new method for graph stream summarization based on both the structure and concepts
- “Zhores” — Petaflops supercomputer for data-driven modeling, machine learning and artificial intelligence installed in Skolkovo Institute of Science and Technology
- Economic Disposal Quantity of Leftovers kept in storage: a Monte Carlo simulation method
- Computer technology of the thermal stress state and fatigue life analysis of turbine engine exhaust support frames
- Statistical model used to assessment the sulphate resistance of mortars with fly ashes
- Application of organization goal-oriented requirement engineering (OGORE) methods in erp-based company business processes
- Influence of Sand Size on Mechanical Properties of Fiber Reinforced Polymer Concrete
- Architecture For Automation System Metrics Collection, Visualization and Data Engineering – HAMK Sheet Metal Center Building Automation Case Study
- Optimization of shape memory alloy braces for concentrically braced steel braced frames
- Topical Issue Modern Manufacturing Technologies
- Feasibility Study of Microneedle Fabrication from a thin Nitinol Wire Using a CW Single-Mode Fiber Laser
- Topical Issue: Progress in area of the flow machines and devices
- Analysis of the influence of a stator type modification on the performance of a pump with a hole impeller
- Investigations of drilled and multi-piped impellers cavitation performance
- The novel solution of ball valve with replaceable orifice. Numerical and field tests
- The flow deteriorations in course of the partial load operation of the middle specific speed Francis turbine
- Numerical analysis of temperature distribution in a brush seal with thermo-regulating bimetal elements
- A new solution of the semi-metallic gasket increasing tightness level
- Design and analysis of the flange-bolted joint with respect to required tightness and strength
- Special Issue: Actual trends in logistics and industrial engineering
- Intelligent programming of robotic flange production by means of CAM programming
- Static testing evaluation of pipe conveyor belt for different tensioning forces
- Design of clamping structure for material flow monitor of pipe conveyors
- Risk Minimisation in Integrated Supply Chains
- Use of simulation model for measurement of MilkRun system performance
- A simulation model for the need for intra-plant transport operation planning by AGV
- Operative production planning utilising quantitative forecasting and Monte Carlo simulations
- Monitoring bulk material pressure on bottom of storage using DEM
- Calibration of Transducers and of a Coil Compression Spring Constant on the Testing Equipment Simulating the Process of a Pallet Positioning in a Rack Cell
- Design of evaluation tool used to improve the production process
- Planning of Optimal Capacity for the Middle-Sized Storage Using a Mathematical Model
- Experimental assessment of the static stiffness of machine parts and structures by changing the magnitude of the hysteresis as a function of loading
- The evaluation of the production of the shaped part using the workshop programming method on the two-spindle multi-axis CTX alpha 500 lathe
- Numerical Modeling of p-v-T Rheological Equation Coefficients for Polypropylene with Variable Chalk Content
- Current options in the life cycle assessment of additive manufacturing products
- Ideal mathematical model of shock compression and shock expansion
- Use of simulation by modelling of conveyor belt contact forces