Modelling a production process using a Sankey diagram and Computerized Relative Allocation of Facilities Technique (CRAFT)
-


Abstract
This paper constitutes a partial output of carried out research and is focused on modelling the production process of car seat manufacturing. Given that manufacturing companies are currently struggling with a shortage of qualified workforce, it is the job of every business to keep their current employees. Companies make efforts to operate the most efficient production processes at very low cost and with labour saving. In order to produce at low cost, the work environment must be designed efficiently. There are many ways to do this. In this paper focused on optimizing production processes, Computerized Relative Allocation of Facilities Technique (CRAFT) and a Sankey diagram will be used.
1 Introduction
Logistics as a scientific discipline began to manifest itself at the beginning of this century. In the 1960s, Peter Drucker came up with the idea that logistics helped increase business efficiency. Since then, more emphasis has been placed on logistics than in the past. At present, logistics is key to helping to improve market positions and gain competitive advantage [1]. Most companies strive to find a competitive advantage in the globalization environment to help them get closer to customers and maintain a good market position. For this reason, logistics has become an important part of modern management of companies; it is logistics departments that organize the flow of material in the production process, coordinate transport and transportation processes, provide customer service and help ensure the smooth operation of the sophisticated system of the company with the lowest operating costs of departments [2, 3, 4]. Logistics uses innumerable methods of mathematical modelling and other exact methods for modelling the workplace in order to reduce production times. This reduction has the effect of decreasing both the company’s costs and the efforts of individual employees [5, 6, 7]. This field can support Samuelson´s variational principle. It means that maniplation´s costs should decrease to minimalize value [8].
2 The production process of car seats
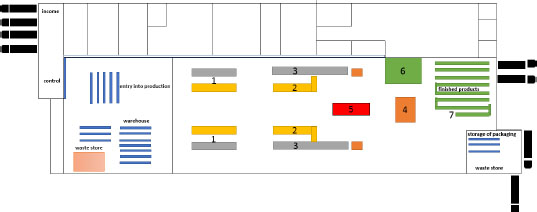
This paper is focused on technological, handling and control operations at a selected workplace, where passenger car seats are produced. The production process takes place through a high material flow that is associated with the movement of raw materials, components and semi-finished products [9]. The material flow is formed on the basis of the technological procedure of seat production. High emphasis is placed on quality production, as the car seat represents one of the elements of passive safety. Front and rear seats are assembled completely in the company. They consist of a steel support frame that is reinforced by a wire reinforcement and a seat frame, which is located on the front guide rail. Electronic and pneumatic systems are placed inside the prepared frame according to the order. The seats have thirteen possibilities of electronic control. Then they are filled with a foam pad. Everything is hidden in the design cover. The spatial arrangement of the company plays a big part in the efficiency of production [10]. In cooperation with the manufacturing company, it will be verified that the workplace is arranged optimally and cannot be better organized in terms of cost and time savings. All production processes are closely linked to each other and follow the customer’s production processes. For this reason, the emphasis is placed on speed and reliability of delivery [11]. Product assembly takes place in several production departments, as shown in Figure 1.
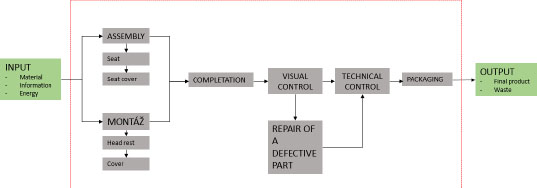
The production process
Source: The authors
As mentioned above, material flow management is based on the technological procedure of the manufacturing process as defined by an internal directive. Materials inventory and the supply chain play an important role in the production. The company is based on just-in-time production [12, 13, 14, 15, 16]. The material is transported to the assembly hall by an autonomous device in the order of seat assembly and distributed to the designated workplace of the production line. The individual flows of material are shown in Figure 2.
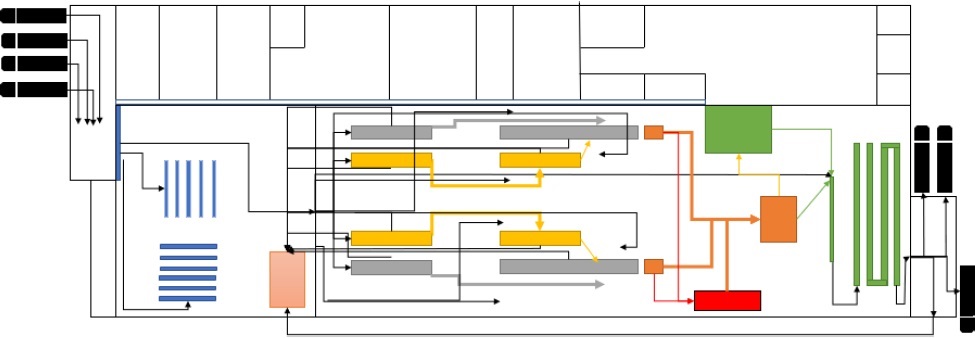
The flows of material in the production of seats
Source: The authors
A mathematical modelling method CRAFT (Computerized Relative Allocation of Facilities Technique) and a Sankey diagram will be used to analyse the workplace layout [17].
Sankey diagrams serve to illustrate the flow of material between workplaces. The use of this method is possible for both smaller and automated or semi-automated production processes. The basis for its use is the ground plan of the building and the construction of a checkerboard [18, 19]. The results are represented by a diagram where the flow rate is indicated by the width of the arrow and the distance between the workplaces by the length of the arrow. For better clarity, different colours are used to represent the individual types of material transported [20, 21].
Computerized Relative Allocation of Facilities Technique (CRAFT) method is suitable for use in assembly line plants or mass production plants where multiple component products are assembled. This method is used to determine the most suitable position of two elements in the overall layout and serves to organize the space of a workplace. CRAFT can be applied if it is guaranteed that the workplace determined the order of the product in terms of the technological procedure [22, 23]. Before this method is implemented, any workplace layout (suitable for using already existing processes) is selected and the changing of workplaces is carried out in a few steps until the handling costs are the lowest. It is taken into account during the calculations that the workplaces may have a fixed position or may be adjacent to other workplaces [24, 25]. CRAFT is a mathematical method that will be applied to determine the optimal distribution of elements in the production process [26]. The solution will be done by means of a mathematical model using the following elements [27]:
n– number of activities within the workplace, department, workshop
vij – number of load units between the activities
uij – handling costs (distances between the activities)
lij – distance between the activities
The final solution that will result in cost and volume optimization will be used to create the model. The formula for calculating the cost of movement will be given by the relationship:
Changing the layout of departments will change the distance between the workplaces, and the cost of the layout will be expressed by the relationship:
3 Research
Firstly, a matrix table is created consisting of details about the material transported during the production program within one day in pieces. These values are obtained from the economic department. The individual movements from the warehouse to the production processes are all presented in Table 1 without their division to the production lines.
The flows of material in pieces
 |
Source: The authors
To build the Sankey diagram, e-sankey demo version program was used. The input data for the compilationof the diagram are based on the table above. In the diagram, the blue colour represents the material flows, the red colour represents the flows of semi-finished and finished products. The products designed for repairing defective components are green and run from process three to process five. The reverse flows of material and scrap are shown in orange [28]. The fully-constructed Sankey diagram is shown in Figure 3.
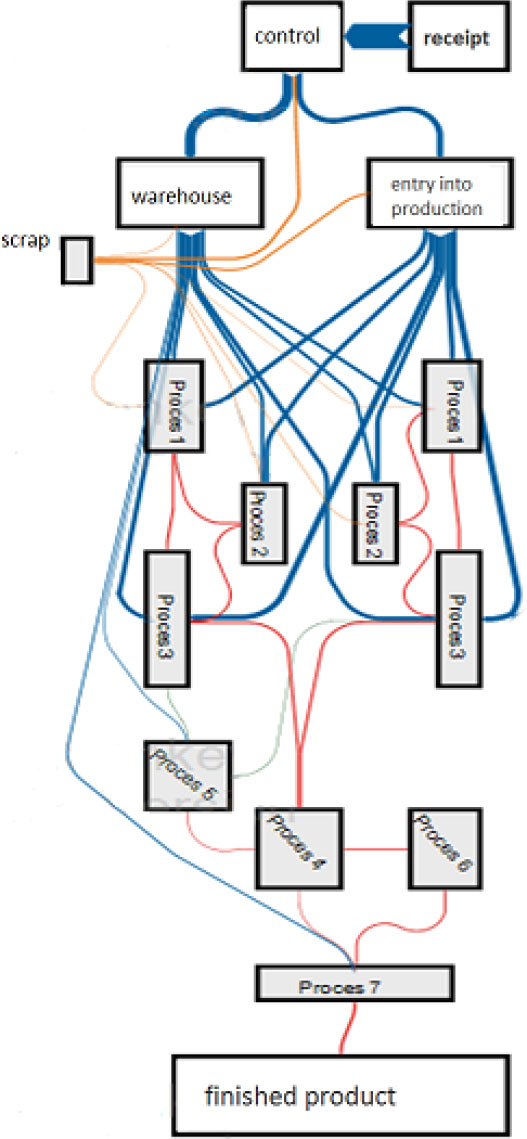
Sankey diagram
Source: The authors
The Sankey diagram revealed frequent crossings of routes, which indicates an inappropriately arranged workplace. The flows of material intersect the reverse flows of mixed and recycled waste. The CRAFT method will be used to design a new workplace layout. The costs are determined using standard costs and price deviations. Standard costs used in cost accounting are determined before the start of production and represent the norms for unit costs. The costs between the individual processes are shown in Table 2 and are expressed in Czech crowns. The data are set to three-shift operation over one working day and two assembly lines. The purpose of applying the CRAFT method is to find a workplace layout with minimum handling costs [28, 29]. At the same time, the implementation of the new layout design must not be costly for the company. The handling costs of material and semi-finished products do not have a specified unit handling cost because of the use of several material transfer methods during the production process. In order to apply CRAFT, it was first necessary to determine the flows of material between the workplaces for the original layout. In addition, it was necessary to specify the cost of material handling per day for the original layout. The costs of the flows of material before optimization in CZK are shown in Table 2.
Material handling costs in CZK
 |
Source: The authors
Distances between the individual objects are shown in Table 3. The distances are in meters. The largest distance is between the warehouse and process 7, where the packing line is located. Here the products must be properly packed prior to their loading into a vehicle and it is necessary to move the packaging from the warehouse. Also, a long way must be overcome by the employees in order to transport material when delivering components to repair a defective part, which is happening in process 5. However, in this case, the routes are not regular and the company is not able to create a warehouse near the repair line.
Distances between the objects in meters
 |
Source: The authors
4 Research findings
The production processes were evaluated during the analysis. In order to reduce handling costs, investment in a belt conveyor was proposed, whichwould limit the steps of the operators in process 2 and process 3 when they need to go get semi-finished products. There is currently a two-meter gap that the operators have to overcome. The belt conveyor would become a part of the assembly line’s technological equipment and would convey the prepared seats continuously to the location where the seat assembly machine is located. Its design is shown in Figure 4.
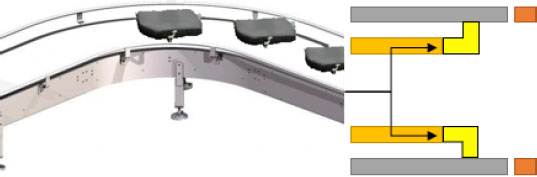
Design of a conveyor belt
Source: The authors
The removal of the material would take place without unnecessary steps and the operator would only assemble the seats. Another proposal for material flow optimization is to move the workplace where defective parts of the product are repaired to the middle of the production hall so that both production lines have the same distance from discarded defective products. This would result in reducing the overall costs of the process. At the same time, the distance between this workplace and the warehouse will be reduced. Moving process 5 closer to the production lines will decrease the average distance between the processes by 19.11 m. The resulting distance would be 25.74 m. In this case, the costs would decrease by CZK 181.16 per day. This amount may appear to be negligible for the company, but in case of annual recalculation, the total cost would be CZK 76 128 if process 5 was located closer to the production lines. If this change is made, it is necessary to recalculate the costs that are incurred during the handling of the products from the warehouse. Here, the resulting average distance will be reduced to 74.9 meters and the costs will be reduced by CZK 50.31; the total annual costs for moving material from the warehouse to process 5 will be CZK 52 965.12. If we add to these amounts the cost of moving the workplace (CZK 3 250), the total costs are CZK 132 343.12. Before the change, the total costs were CZK 201 311.76. It is evident that even in the case of investing in the relocation of the manufacturing site for process 5, it would make a significant benefit for the company in the first year of its implementation.
In order to eliminate unnecessary handling costs during the transfer of products from the packaging line to the place where the finished products are put aside ready for loading, it would be appropriate for the company to join these two phases of the production process. Since a complete product is already produced and packaged, the handling is very costly. If these two phases were linked, the company would save CZK 522.68 per day. The new arrangement of finished products and packing lines could contribute to speeding up loading where loading would take place simultaneously into two cars.
Table 4 shows the cost change for the new layout of production including the establishment of a conveyor belt. The total costs after optimization are CZK 706 988.4. The workplace was adjusted based on these changes. Figure 5 below shows the resulting layout of the workplace after applying the CRAFT method.
The costs of material flows after optimization
| Receipt – control | 247 705.66 | Warehouse – scrap | 258.9 | 2 – scrap | 126.36 |
| Warehouse – control | 351 927.62 | Entry into production – 1 | 7 412.69 | 3 – 4 | 292.73 |
| Control – entry | 63 912.78 | Entry into production – 2 | 5 925.71 | 3 – 5 | 244 |
| Control – scrap | 677.85 | Entry into production – 3 | 10 573.97 | 3 – scrap | 341.87 |
| Warehouse – 1 | 3 141.13 | Entry into production -scrap | 466.46 | 4 – 6 | 2 235.8 |
| Warehouse – 2 | 2 693.13 | 1 - 2 | 355.27 | 4 – 7 | 1 116.9 |
| Warehouse – 3 | 6 027.76 | 1 - 3 | 378.14 | 5 – 4 | 318.9 |
| Warehouse – 5 | 169.76 | 1 - scrap | 258.68 | 6 – 7 | 223.78 |
| Warehouse – 7 | 192.44 | 2 - 3 | 30.1 | 7-finished products | 0 |
Source: The authors
The new arrangement of the production processes
Source: The authors
5 Conclusion
The research in this paper focuses on the analysis of a logistics chain that takes place in the production process of car seat manufacturing. A Sankey diagram was used to analyse the flows and the current layout. The diagram was made by means of a checkerboard showing the magnitudes of material flows. The diagram showed that the material flows often intersect the reverse flows of mixed and recyclable waste.
Subsequently, the CRAFT method, which contributed to the search for an optimized layout of production processes in the company, was used to create the new workplace layout. CRAFT was used on the basis of the costs of handling flows and distances between the individual production processes. As emerged from the analysis, the production process and material flow in the company were very optimized and low-cost. Nevertheless, after application of this method, several new changes in the arrangement were proposed, which, despite a considerable investment, would bring some cost savings.
Although all activities in the logistical processes influence one another and the outcome of the proposed changes cannot be estimated in advance, the current logistical process is of very high quality. It represents an optimal state for the company and brings high productivity of work with excellent economic results. However, through the appropriate application methods, the research has succeeded in finding several possible adjustments that can be applied to reduce costs and optimize the flows of material. These optimizations would reduce costs and improve the production process as well as all manufacturing activities performed by the company employees.
References
[1] GROS, I. (2016). Velká kniha logistiky Praha: Vysoká škola chemicko-technologická v Praze. ISBN: 978-80-7080-952-5.Search in Google Scholar
[2] ČUJAN, Z. a MÁLEK, Z. (2008). Výrobní a obchodní logistika Zlín: Univerzita Tomáše Bati ve Zlíně. ISBN 978-80-7318-730-9.Search in Google Scholar
[3] HITKA, M., LORINCOVÁ, S., PAJTINKOVÁ BARTÁKOVÁ, G., LIŽ-BETINOVÁ, L., ŠTARCHOŇ, P., LI, CH., ZABOROVA, E., MARKOVA, T., SCHMIDTOVÁ, J., MURA, L. (2018). "Strategic Tool of human resource management for operation of SMEs in the wood-processing industry" BioResources, vol. 13, no. 2, pp. 2759-2774. DOI: 10.15376/biores.13.2.2759-277410.15376/biores.13.2.2759-2774Search in Google Scholar
[4] LIŽBETINOVÁ, L., LORINCOVÁ, S., CAHA, Z. (2016). "The application of the organizational culture assessment instrument (OCAI) to logistics enterprises", Nase more, vol. 63, no. 3, pp. 170-176. DOI: 10.17818/NM/2016/SI1710.17818/NM/2016/SI17Search in Google Scholar
[5] JUROVÁ, M. a kolektiv. (2016). Výrobní a logistické procesy v podnikání. Praha : Grada Publishing. ISBN 978-80-247-5717-9.Search in Google Scholar
[6] GIERTL, G.; POTKANY, M.; GEJDOS, M. . (2015). Evaluation of Outsourcing Eflciency Through Costs For Its Use. Conference: 4th World Conference on Business, Economics and Management (WCBEM) Location: Ephesus, TURKEY, Procedia Economics and Finance, Volume: 26 Pages: 1080-108510.1016/S2212-5671(15)00933-8Search in Google Scholar
[7] STACHOVA, K.; PAPULA, J.; STACHO, Z.; et al. (2019 External Partnerships in Employee Education and Development as the Key to Facing Industry 4.0 Challenges SUSTAINABILITY Volume: 11 Issue: 2 Article Number: 34510.3390/su11020345Search in Google Scholar
[8] WU, Y., HE, J.-H., (2018) "A remark on Samuelson’s variational principle in economics", Applied Mathematics Letters, 84 (2018) 143-147.10.1016/j.aml.2018.05.008Search in Google Scholar
[9] KMECOVA, I. (2018). Analysis of the Eflciency of the Educational Processes of the Subjects Business Management, Human Resource Management, and Mathematics, and their Comparison, Conference: 12th International Technology, Education and Development Conference (INTED), Valencia, SPAIN, Pages: 1781-178810.21125/inted.2018.0310Search in Google Scholar
[10] LANGEVILN, A. a RIOPEL, D.. (2005). Logistics systems - Design and Optimizaiton New York : Springer. ISBN 0-387-24971-0.10.1007/b106452Search in Google Scholar
[11] ORAVA, F. (2010). Vývoj a navrhování logistických systémů Olo-mouc : Moravská vysoká škola Olomouc. ISBN 978-80-87240-39-7.Search in Google Scholar
[12] ŠMÍDA, F. (2007). Zavádění a rozvoj procesního řízení ve firmě. Praha : Grada Publishing. ISBN 978-80-247-169-4Search in Google Scholar
[13] Kucharcikova, A., Miciak, M. (2018). The Application of Human Capital Eflciency Management towards the Increase of Performance and Competitiveness in an Enterprise Operating in the Field of Distribution Logistics. NASE MORE Volume: 65 Issue: 4 Pages: 276-28310.17818/NM/2018/4SI.21Search in Google Scholar
[14] WEGNER, U. a WEGNER, K. (2017). Einführung in das Logistik-Management: Prozesse - Strukturen - Anwendungen Wiesbaden : Springer Verlag. 978-3-658-13674-1.10.1007/978-3-658-13675-8Search in Google Scholar
[15] NĚMEC, F., HITKA, M., LORINCOVÁ, S., TURÍNSKÁ, L. (2015). “The storage area market in the particular territory”, Nase more, vol. 62, pp. 131-138. DOI 10.17818/NM/2015/SI310.17818/NM/2015/SI3Search in Google Scholar
[16] KLARIC, K., GREGER, K., KLARIC, M., ANDRIC, T., HITKA, M., KROPIVSEK, J., (2016). “An exploratory assessment of FSC chain of custody certification benefits in Croatian wood industry “, Drvna Industrija, vol. 67, no. 3, pp 241-248 DOI:10.5552/drind.2016.154010.5552/drind.2016.1540Search in Google Scholar
[17] ŘEPA, V. (2007). Podnikové procesy, procesní řízení a modelování Praha : Grada Publishing, 2007. ISBN 978-80-247-2252-8.Search in Google Scholar
[18] HIREGOUDAR, Ch. a REDDY, B. Raghavendra. (2007). Facility Planning & Layout Design Shaniwar Peth : Technical Publications Pune, 2007. ISBN 81-8431-291-1.Search in Google Scholar
[19] GARCIA-GARCIA, G., Stone, J. & Rahimifard, S. (2019). "Opportunities for waste valorisation in the food industry – A case study with four UK food manufacturers", Journal of Cleaner Production, vol. 211, pp. 1339-1356.10.1016/j.jclepro.2018.11.269Search in Google Scholar
[20] GONZALEZ HERNANDEZ, A., LUPTON, R.C., WILLIAMS, C. & Cullen, J.M. (2018). "Control data, Sankey diagrams, and exergy: Assessing the resource eflciency of industrial plants", Applied Energy, vol. 218, pp. 232-245.10.1016/j.apenergy.2018.02.181Search in Google Scholar
[21] GONZALEZ HERNANDEZ, A., PAOLI, L. & CULLEN, J.M. (2018). "How resource-eflcient is the global steel industry?", Resources, Conservation and Recycling, vol. 133, pp. 132-145.10.1016/j.resconrec.2018.02.008Search in Google Scholar
[22] ALTINKILINC, M. (2004), "Simulation-based layout planning of a production plant", Proceedings - Winter Simulation Conference, pp. 107910.1109/WSC.2004.1371432Search in Google Scholar
[23] ATIEH, A.M., KAYLANI, H., ALMUHTADY, A. & Al-Tamimi, O. (2016). "A value stream mapping and simulation hybrid approach: application to glass industry", International Journal of Advanced Manufacturing Technology, vol. 84, no. 5-8, pp. 1573-1586.10.1007/s00170-015-7805-8Search in Google Scholar
[24] CHOVANCOVÁ, M., STOPKA, O., KLAPITA, V. (2017). “Modeling the distribution network applying the principles of linear programming”. 21st International Scientific on Conference Transport Means 2017, Juodkrante; Lithuania; 20-22 September 2017, Code 135093, 2017, pp. 73-77. ISSN 1822-296X.Search in Google Scholar
[25] BARTUSKA, L., STOPKA, O., CHOVANCOVA, M., LIZBETIN, J.(2016). “Proposal of Optimizing the Transportation Flows of Consignments in the Distribution Center”. Transport Means - 20th International Scientific Conference on Transport Means (Juodkrante, LITHUANIA), pp. 107-111, 2016. ISSN 1822-296X.Search in Google Scholar
[26] CAMBRON, K.E. & EVANS, G.W. (1991). "Layout design using the analytic hierarchy process", Computers and Industrial Engineering, vol. 20, no. 2, pp. 211-229.10.1016/0360-8352(91)90026-3Search in Google Scholar
[27] HARI PRASAD, N., RAJYALAKSHMI, G. & SREENIVASULU REDDY, A. (2014). "A typical manufacturing plant layout design using CRAFT algorithm", Procedia Engineering, pp. 1808.10.1016/j.proeng.2014.12.334Search in Google Scholar
[28] NÝVLT, V. (2016). “Life cycle costing in BIM management”. CESB 2016 - Central Europe Towards Sustainable Building 2016: Innovations for Sustainable Future. pp. 1438-1444Search in Google Scholar
[29] ZARATE, D.C., BODIC, P.L., DWYER, T., GANGE, G. & STUCKEY, P. (2018), "Optimal Sankey Diagrams Via Integer Programming", IEEE Pacific Visualization Symposium, pp. 135.10.1109/PacificVis.2018.00025Search in Google Scholar
© 2019 K. Rudolf and H. Martina, published by De Gruyter
This work is licensed under the Creative Commons Attribution 4.0 International License.
Articles in the same Issue
- Regular Article
- Exploring conditions and usefulness of UAVs in the BRAIN Massive Inspections Protocol
- A hybrid approach for solving multi-mode resource-constrained project scheduling problem in construction
- Identification of geodetic risk factors occurring at the construction project preparation stage
- Multicriteria comparative analysis of pillars strengthening of the historic building
- Methods of habitat reports’ evaluation
- Effect of material and technological factors on the properties of cement-lime mortars and mortars with plasticizing admixture
- Management of Innovation Ecosystems Based on Six Sigma Business Scorecard
- On a Stochastic Regularization Technique for Ill-Conditioned Linear Systems
- Dynamic safety system for collaboration of operators and industrial robots
- Assessment of Decentralized Electricity Production from Hybrid Renewable Energy Sources for Sustainable Energy Development in Nigeria
- Seasonal evaluation of surface water quality at the Tamanduá stream watershed (Aparecida de Goiânia, Goiás, Brazil) using the Water Quality Index
- EFQM model implementation in a Portuguese Higher Education Institution
- Assessment of direct and indirect effects of building developments on the environment
- Accelerated Aging of WPCs Based on Polypropylene and Plywood Production Residues
- Analysis of the Cost of a Building’s Life Cycle in a Probabilistic Approach
- Implementation of Web Services for Data Integration to Improve Performance in The Processing Loan Approval
- Rehabilitation of buildings as an alternative to sustainability in Brazilian constructions
- Synthesis Conditions for LPV Controller with Input Covariance Constraints
- Procurement management in construction: study of Czech municipalities
- Contractor’s bid pricing strategy: a model with correlation among competitors’ prices
- Control of construction projects using the Earned Value Method - case study
- Model supporting decisions on renovation and modernization of public utility buildings
- Cements with calcareous fly ash as component of low clinker eco-self compacting concrete
- Failure Analysis of Super Hard End Mill HSS-Co
- Simulation model for resource-constrained construction project
- Getting efficient choices in buildings by using Genetic Algorithms: Assessment & validation
- Analysis of renewable energy use in single-family housing
- Modeling of the harmonization method for executing a multi-unit construction project
- Effect of foam glass granules fillers modification of lime-sand products on their microstructure
- Volume Optimization of Solid Waste Landfill Using Voronoi Diagram Geometry
- Analysis of occupational accidents in the construction industry with regards to selected time parameters
- Bill of quantities and quantity survey of construction works of renovated buildings - case study
- Cooperation of the PTFE sealing ring with the steel ball of the valve subjected to durability test
- Analytical model assessing the effect of increased traffic flow intensities on the road administration, maintenance and lifetime
- Quartz bentonite sandmix in sand-lime products
- The Issue of a Transport Mode Choice from the Perspective of Enterprise Logistics
- Analysis of workplace injuries in Slovakian state forestry enterprises
- Research into Customer Preferences of Potential Buyers of Simple Wood-based Houses for the Purpose of Using the Target Costing
- Proposal of the Inventory Management Automatic Identification System in the Manufacturing Enterprise Applying the Multi-criteria Analysis Methods
- Hyperboloid offset surface in the architecture and construction industry
- Analysis of the preparatory phase of a construction investment in the area covered by revitalization
- The selection of sealing technologies of the subsoil and hydrotechnical structures and quality assurance
- Impact of high temperature drying process on beech wood containing tension wood
- Prediction of Strength of Remixed Concrete by Application of Orthogonal Decomposition, Neural Analysis and Regression Analysis
- Modelling a production process using a Sankey diagram and Computerized Relative Allocation of Facilities Technique (CRAFT)
- The feasibility of using a low-cost depth camera for 3D scanning in mass customization
- Urban Water Infrastructure Asset Management Plan: Case Study
- Evaluation the effect of lime on the plastic and hardened properties of cement mortar and quantified using Vipulanandan model
- Uplift and Settlement Prediction Model of Marine Clay Soil e Integrated with Polyurethane Foam
- IoT Applications in Wind Energy Conversion Systems
- A new method for graph stream summarization based on both the structure and concepts
- “Zhores” — Petaflops supercomputer for data-driven modeling, machine learning and artificial intelligence installed in Skolkovo Institute of Science and Technology
- Economic Disposal Quantity of Leftovers kept in storage: a Monte Carlo simulation method
- Computer technology of the thermal stress state and fatigue life analysis of turbine engine exhaust support frames
- Statistical model used to assessment the sulphate resistance of mortars with fly ashes
- Application of organization goal-oriented requirement engineering (OGORE) methods in erp-based company business processes
- Influence of Sand Size on Mechanical Properties of Fiber Reinforced Polymer Concrete
- Architecture For Automation System Metrics Collection, Visualization and Data Engineering – HAMK Sheet Metal Center Building Automation Case Study
- Optimization of shape memory alloy braces for concentrically braced steel braced frames
- Topical Issue Modern Manufacturing Technologies
- Feasibility Study of Microneedle Fabrication from a thin Nitinol Wire Using a CW Single-Mode Fiber Laser
- Topical Issue: Progress in area of the flow machines and devices
- Analysis of the influence of a stator type modification on the performance of a pump with a hole impeller
- Investigations of drilled and multi-piped impellers cavitation performance
- The novel solution of ball valve with replaceable orifice. Numerical and field tests
- The flow deteriorations in course of the partial load operation of the middle specific speed Francis turbine
- Numerical analysis of temperature distribution in a brush seal with thermo-regulating bimetal elements
- A new solution of the semi-metallic gasket increasing tightness level
- Design and analysis of the flange-bolted joint with respect to required tightness and strength
- Special Issue: Actual trends in logistics and industrial engineering
- Intelligent programming of robotic flange production by means of CAM programming
- Static testing evaluation of pipe conveyor belt for different tensioning forces
- Design of clamping structure for material flow monitor of pipe conveyors
- Risk Minimisation in Integrated Supply Chains
- Use of simulation model for measurement of MilkRun system performance
- A simulation model for the need for intra-plant transport operation planning by AGV
- Operative production planning utilising quantitative forecasting and Monte Carlo simulations
- Monitoring bulk material pressure on bottom of storage using DEM
- Calibration of Transducers and of a Coil Compression Spring Constant on the Testing Equipment Simulating the Process of a Pallet Positioning in a Rack Cell
- Design of evaluation tool used to improve the production process
- Planning of Optimal Capacity for the Middle-Sized Storage Using a Mathematical Model
- Experimental assessment of the static stiffness of machine parts and structures by changing the magnitude of the hysteresis as a function of loading
- The evaluation of the production of the shaped part using the workshop programming method on the two-spindle multi-axis CTX alpha 500 lathe
- Numerical Modeling of p-v-T Rheological Equation Coefficients for Polypropylene with Variable Chalk Content
- Current options in the life cycle assessment of additive manufacturing products
- Ideal mathematical model of shock compression and shock expansion
- Use of simulation by modelling of conveyor belt contact forces