Monitoring bulk material pressure on bottom of storage using DEM
-
David Žurovec
 ,
Jakub Hlosta
,
Jakub Hlosta

Abstract
This article focuses on the experimental verification of a mathematical derivation of Janssen’s theory, which describes the distribution of pressures within the bulk material and pressure distribution on the walls of storage facilities. The experimental verification is performed in two ways. The first is the real measurement of the load transfer in a bulk material cylinder and the second is similar to the detection of the load transfer through simulations using the DEM method. The aim is to compare the results of the theoretical calculation according to Janssen’s theory with the real measurement and a simulation of exactly the same model situation. At the beginning of any design or optimisation of existing transport or storage facilities, the most important is the analysis of the bulk material in the form of measurements of mechanical-physical properties. The analysis methods used are also described here. The pressure at the bottom of a storage container between the methods used showed negligible differences. From this finding, it can be concluded that the DEM method is a very suitable means for verifying the design of transport and storage facilities. The simulations provide important information and insights that can also be used to optimise existing transport or storage facilities.
1 Introduction
In the past, designers had to rely solely on empirical calculations and their own experience in designing storage facilities. Currently, there are modern methods of construction, which verify the correct use of design, computer simulation and stress analysis. In this way, critical design errors that can cause irreversible deformations or the total collapse of the storage facilities in real operation are eliminated. On the other hand, it is possible to avoid the oversized construction of storage facilities using computer simulations. This research is focused on the method of determination of pressure inside storage facilities by means of mathematical derivation, DEM simulation and experimental verification. To determine the pressure in the bulk material cylinder and the pressure on the structure of storage facilities, it is not appropriate to use Pascal’s law, which assumes a uniform spread of the pressure in all directions. Pascal’s theory does not include any information about the structure of storage facilities and the stored material is only characterised by the density (bulk density for bulk materials) in the calculation of the pressure. It follows that the theory is applicable only for liquids and bulk materials with the angle of internal friction ϕe approaching 0∘. In the past, Pascal’s theory was also used for calculating the pressure in storage facilities for bulk materials with the angle of internal friction ϕe = (0∘,90∘), resulting in the substantial oversizing of the proposed structures [1].
Pascal’s theory can be expressed mathematically as follows:
where: σ1 – vertical pressure within the bulk material [Pa]
σ2 – horizontal pressure within the bulk material [Pa]
ρs – bulk density of the stored material [kg·m−3]
g – gravitational acceleration [m·s−2]
h – bulk material cylinder height [m]
A more accurate computation theory for determining pressures in bulk materials and pressures acting on the structure of storage facilities is Rankine’s theory [1], which also contains a number of simplification conditions, e.g. the bulk material is incoherent, homogeneous, isotropic, perfectly drained, and neglects wall friction. Vertical pressure within the bulk material is defined similarly to Pascal’s theory [1] as follows:
The horizontal pressure within the bulk material is specified by the fluidity coefficient k, which reflects the important
material property – the angle of internal friction ϕe.
where
S – cross-sectional area of the storage facility at the site of the studied section [m2]
o – circumference of the inner shell of the storage facility at the site of the studied section [m]
μ – coefficient of friction between the stored material and the inner surface of the storage space [-]
R – hydraulic radius [m]
k – fluidity coefficient [-]
φe – angle of internal friction [∘]
The horizontal pressure is given by the relation:
The standardised theory to calculate the pressure in storage facilities is Janssen’s theory [1, 2, 3, 4, 5, 6]. The computing standard according to this theory has been incorporated into the following standard:
ČSN (Czech National Standard) 73 5570 Design of structures for storages, which is not currently effective and has been superseded by the standard ČSN EN 1991-4 ed. 2 Eurocode 1: Load on structures [7].
The standardised calculation according to Janssen’s theory [1, 2, 3, 4, 5, 6, 7] includes information about the structure of the storage facility and also very important information about the stored material, which are mechanical and physical properties. The basic calculation of the horizontal pressure on the structure of the storage facility is given by the relation Eq. (7) [1].
𝛾 – volumetric weight [N·m−3]
ϕw – angle of external friction between the stored material and the inner surface of the storage space [∘]
K – lateral pressure ratio [-]
h – height of the material from the highest point of the storage facility to the examined cross-section [m]
The vertical pressure on the structure of the storage facility is given by the relation:
Shear stress acting in the vertical direction on the inner peripheral surface of the structure of the storage facility is given by:
Figure 1 shows a container characterizing a storage device showing the pressures of bulk material acting on the walls and bottom of the storage device.
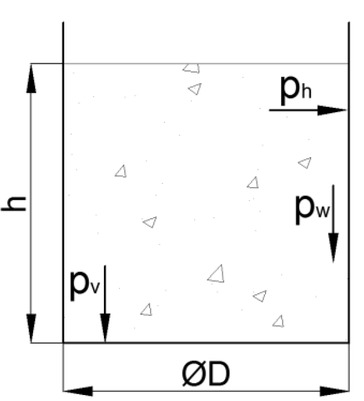
Pressures of the internal storage walls.
2 Materials and methods
2.1 Model
The calculation of the pressures acting on the inner surfaces of the storage is performed according to the mathematical model of Janssen’s theory described above. Mathematical derivation is applied to the model storage, which is shown in Figure 2. The storage has a diameter D = 0.1 m and height h = 0.44 m. The internal surface of the storage is made from PVC material having surface roughness Ra = 12.5 μm.

Diagram of the model storage
2.2 Material
The stored material is represented by glass beads of the diameter d = 3 mm, which are poured into the storage container to fill it up completely. For the mathematical determination of the pressures on the structure of the storage container, it is necessary to know some basic mechanical and physical properties occurring in the samples of Janssen’s theory. These are the bulk density, the wall friction angle between the stored material and the internal surface of the storage area, and the angle of internal friction. Figure 3 shows a sample of glass beads used in the experiment.

Image of the stored material
2.3 Bulk density ρs
The bulk density was measured using a simplified volume method. The bulk density is based on the known volume V = 0.0005m3 of loosely poured glass beads and a known net weight of the given volume mVk = 0.798 kg. The measurement is repeated at least 10 times. The calculation of the bulk density is performed according to Eq. (12).
The calculated result of the bulk density is ρs = 1596 kg·m3.
2.4 Wall friction angle ϕw
The measurement of the wall friction angle was performed on a rectilinear Jenike shear machine. The wall friction angle determines the degree of the loss of work during the displacement of the bulk material across the solid contact material. The contact material in this case is especially hardened PVC material which constitutes the storage interior [8]. These values indicate the overcoming of the minimum degree of energy for material displacement across the used hardened PVC. The angle of wall friction between the glass beads of diameter d = 3 mm and the internal surface of the storage space, which is made of PVC material, the surface roughness Ra = 12.5 μm was measured on the linear Jenike shear machine. The wall friction angle is ϕw = 13.1∘.
2.5 Angle of internal friction φe
The angle of internal friction was measured on a Schulze ring shear tester. The principle of measurement of the angle of internal friction is the measurement of the time dependence of shear force which is necessary for the deformation of the bulk body in the shear chamber through a shear zone under normal load, for a given density of the bulk material. The density for a given measurement is achieved through consolidation (compaction) with a defined force load. The shear force is applied by rotating the device cell, and the torque is transmitted by two tie rods, which are fixed on the lid of the shear lid during the rotation measurement test, Schulze. The angle of internal friction determines the degree of internal work loss. During the displacement of the material, it affects the composition of the sample in terms of the representation of the individual fractions, particle shape, and their linkages [9, 10]. The angle of internal friction of glass beads of diameter d = 3 mm is φe = 26∘.
| h [mm] | ph[Pa] | pv[Pa] |
|---|---|---|
| 0 | 0 | 0 |
| 40 | 347 | 560 |
| 80 | 624 | 1006 |
| 120 | 844 | 1361 |
| 160 | 1019 | 1644 |
| 200 | 1158 | 1868 |
| 240 | 1269 | 2047 |
| 280 | 1357 | 2189 |
| 320 | 1428 | 2303 |
| 360 | 1484 | 2394 |
| 400 | 1528 | 2465 |
| 440 | 1564 | 2523 |
2.6 Pressure in the storage
Inside the storage shown in Figure 4, the vertical pressure acts on the bottom of the storage container pv and the horizontal pressure acts on the inner peripheral surface of the storage container ph, which are the subject of the findings.

Image of pressures acting inside the storage
Table 1 shows the values of the pressures acting inside the storage for different depths of the material h.
Figure 5 shows the relation of the pressures acting on the inside walls of the storage. The figure shows the progress of the horizontal pressure p h and the vertical pressure pv. For comparison with the experimental part, we

The theoretical relations of the pressure inside the storage
will further be only interested in the maximum values of the horizontal and vertical pressure, calculated at the bottom of the storage container.
Horizontal pressure at the height h = 0.44 m: ph = 1564 Pa
Vertical pressure at the height h = 0.44 m: pv = 2523 Pa
2.7 Experiment
The experimental part focuses on measuring the actual pressure of the stored material, in this case glass beads of the diameter d = 3 mm acting on the internal structure of the storage container. The diagram of the measurement stand is shown in Figure 6 a) and the real measurement stand is shown in Figure 6 b). The experimental measurement is focused only on the measurement of the vertical pressure pv acting on the bottom of the storage container.
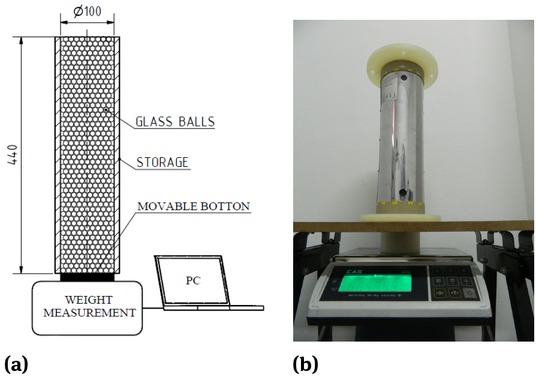
Diagram of the measurement stand: a) scheme of measurement stand, b) real measurement stand
The measurement stand is composed of four basic parts: the storage container, movable bottom, measuring weight, computer.
The storage container is firmly attached to the base. A movable bottom is placed on the bottom edge of the storage container so that a minimum clearance is ensured between the inner edge of the storage container and the outer edge of the movable bottom. The clearance is set to prevent the stored glass beads of the diameter d = 3 mm from falling through. The movable bottom is placed on the weighing scales connected to the computer, which processes the measured values of the weight of the glass beads placed in the storage container and exerting pressure on the movable bottom. The diameter of the movable bottom is D = 0.1 m.
2.8 Measurement procedure
Glass beads of the diameter d = 3 mm were poured up to the upper edge of the prepared storage container with the volume Vexp = 0.00345 m3. The net weight of the poured amount of beads in the storage is mVkexp = 5.518 kg. After stabilizing the measured weight, the values were recorded on the PC. The whole procedure was repeated 10 times under the same conditions.
The bulk density calculated from the known net weight of the poured glass beads mVkexp and the known storage volume Vexp is as follows:
The calculated result of the bulk density is ρexp = 1599 kg·m3.
A comparison of the bulk density ρ= 1596 kg·m−3s from Eq. (12) and ρexp = 1599 kg·m−3 from Eq. (13) shows a minimum difference in the calculated values. This inaccuracy arose when measuring the quantities needed for the calculation itself.
The resulting values of the measured weights m of the glass beads exerting pressure on the movable bottom of the storage container are given in Table 2.
Weight of the glass beads exerting pressure on the movable bottom
| Number of | Weight m[kg] | Average weight md[kg] |
|---|---|---|
| measurement 1 | 0.1935 | 0.1925 |
| 2 | 0.199 | |
| 3 | 0.195 | |
| 4 | 0.1935 | |
| 5 | 0.185 | |
| 6 | 0.195 | |
| 7 | 0.189 | |
| 8 | 0.197 | |
| 9 | 0.191 | |
| 10 | 0.187 |
The calculation of the maximum vertical pressure pvexp acts on the movable bottom of the diameter D = 0.1 m according to Eq. (14). The maximum measured mass m2 = 0.199 kg from Table 2 was used to calculate the maximum vertical pressure pvexp.
The calculated result of the vertical pressure is pvexp = 2485 Pa.
2.9 Verification using DEM simulation method
The second verification of the mathematical derivation of Janssen’s theory is performed using the DEM (Discrete Element Modelling) simulation method [12, 13, 14, 15, 16, 17, 18, 19], which is based on calculating the mutual interactions of particles poured into the storage. Parameters such as, pressure, force, speed, torque, etc. can be obtained from DEM simulations. These parameters obtained from DEM simulations can advantageously be used and applied to other computational models of transport and storage applications such as, for example, a conveyor belt [20, 21]. There exists research on the issue of storage processes as published, for example, in the literature [14, 15]. There, the authors focused on the DEM modeling of the behavior of bulk materials when filling or emptying storage facilities. In these publications, dynamic changes in pressures within storage facilities were determined by DEM simulations, depending on the different operating conditions of the storage processes. Their DEM simulations use different combinations of contact models. In this case, the Hertz-Mindlin contact model was used to calculate the DEM simulation [22]. The actual simulation is carried out by means of the computer program EDEM Academic. Two basic elements are entered in the program. The first is a 3D model of the storage, which has exactly the same dimensions and physical characteristics as the real storage container used for the experimental measurements. A 3D storage model is shown in Figure 7a). The second dominant components entered in the

a) 3D model of the storage, b) model of the glass particle
simulation are the mechanical and physical properties of the glass beads of the diameter d = 3 mm. A model of a glass particle generated in the EDEM Academic program is shown in Figure 7b).
The material properties and interaction parameters were determined on the basis of measurements or taken from the literature [14, 23]. Table 3 presents the general material characteristics of the individual contact materials used in the experiment. Table 4 shows the parameters of interaction between the glass beads and the other contact materials. Throughout the experiment, the glass beads are in a static position. The interaction binding affecting the measurement results is only the coefficient of static friction between the glass beads and the PVC internal wall of the storage.
Input parameters for measuring forces in the EDEM Academic
| Contact material | |||
|---|---|---|---|
| PVC | Glass | Steel | |
| Poisson’s Ratio μ1 [-] | 0.39 | 0.23 | 0.3 |
| Shear Modulus G [Pa] | 9·108 | 3·1010 | 8.4·1010 |
| Density ρ [kg·m−3] | 1780 | 2082 | 7850 |
Input parameters detected by laboratory measurement for EDEM Academic
| Interaction with: | Glass beads | ||
|---|---|---|---|
| PVC | Glass | Steel | |
| Coefficient of restitution | 0.93 | 0.5 | 0.5 |
| Coefficient of static friction | 0.32 | 0.58 | 0.3 |
| Coefficient of rolling friction | 0.004 | 0.01 | 0.01 |
The generated particles in the storage model with a closed bottom fill the storage container to the upper edge. Full storage contains 152 699 glass beads of the diameter d = 3 mm. The total force acting on the bottom of the storage container is derived from the weight of the glass beads placed in the inner storage space. This average value of the total force was subtracted from the performed DEM simulations from a total of ten repetitions.The average value of the total force acting on the bottom of the storage is F DEM = 19.2 N. The steady dependence of the total force acting on the storage container bottom is shown in Figure 8. The picture shows that filling the storage container took approximately 10 s.

Dependence of the total force acting on the storage container bottom
Calculation of maximum vertical pressure pvDEM acting on the storage container bottom of the diameter D = 0.1 m.
The calculated result of the vertical pressure is pvDEM = 2444 Pa.
Table 5 compares the vertical pressure values obtained using three methods: Janssen’s theory calculation, real experiment and DEM simulation. The comparison values show a high similarity, which confirms the fact that the DEM simulation method can be considered to be a reliable tool in the design of not only storage facilities. It should be noted that the accuracy of the DEM simulation and the plausibility of the results depend mainly on the accuracy of the input parameters entering the simulation environment, such as the material and physical properties of the model, the mechanical-physical properties of the bulk material and the interaction parameters.
Comparison of vertical pressure acting on the storage container bottom
| pv | pvexp | pvDEM | |
|---|---|---|---|
| Vertical pressure [Pa] | 2523 | 2485 | 2444 |
3 Conclusion
In this work, a DEM simulation and experiment were used to verify the mathematical derivation of Janssen’s theory In the first step, waveforms of pressures acting on the inside walls of a storage container were calculated using Janssen’s derivation. The vertical pressure acting on the bottom of the storage container according to the calculation is pv = 2523 Pa and the horizontal pressure exerted on the inside wall of the storage at the lowest point, which is at the depth h = 0.44 m, is ph = 1564 Pa. This was followed by a practical experiment on a real storage container, monitoring only the vertical component of the pressure pvexp acting on the bottom of the storage. The value of the maximum pressure is pvexp = 2485 Pa. The second verification of Janssen’s theory was performed by means of a computer simulation using the DEM method in the EDEM Academic program. The resulting vertical pressure acting on the bottom of the storage corresponds to pvDEM = 2444 Pa. The results of the individual methods showed minimum differences. The resulting differences may be due to inaccuracies in the performance of the experiments or in the determination of the input parameters for the DEM method. It can be stated that the DEM method is a very useful tool for the verification of the design of transport or storage facilities. By verifying the design with DEM, it is possible to detect hidden defects or non-functional parts of the technology before an expensive prototype is manufactured.
Acknowledgement
This paper was conducted within the framework of the projects LO1404: Sustainable development of ENET Centre, Innovative and additive manufacturing technology - new technological solutions for 3D printing of metals and composite materials, reg. no. CZ.02.1.01/0.0/0.0/17_049/0008407 financed by Structural Funds of the European Union SP2019/115: Research in the optimised design of transport and storage processes using test equipment and simulation techniques and the Faculty of Mechanical Engineering.
References
[1] Zegzulka J., Mechanics of bulk materials, Version 1, 2004, Ostrava: VSB - Technical university of OstravaSearch in Google Scholar
[2] Sperl M., Experiments on corn pressure in silo cells-translation and comment of Janssen´s paper from 1895, Granular Matter, 2006, 8 (2), 59-65.10.1007/s10035-005-0224-zSearch in Google Scholar
[3] Chand R., Khaskheli M.A., Quadir A., Sandali Y., Shi Q., Influence of spontaneous percolation on apparent mass at the bottom of a Janssen granular column, Physica A: Statistical Mechanics and its Aplication, 2014, 393, 96-100.10.1016/j.physa.2013.09.022Search in Google Scholar
[4] Vanel L., Clément E., Pressure screening and fluctuations at the bottom of a granular column, The European Physical Journal B, 1999, 11 (3), 525-533.10.1007/s100510050965Search in Google Scholar
[5] Wojcik M., Tejchman J., Kuczynska N., FE analyses on effect of bulk solid stiffness on buckling of metal cylindrical silos, The 8th International Conference for Conveying and Handling of Particulate Solids Tel-Aviv, (Israel), 2015, May.Search in Google Scholar
[6] Kazantsev A.A., Klishin S.V., Revuzhenko A.F., On the pressure of loose material on the bottom and walls of a drum, Applied Mechanics and Materials, 2014, 682, 375-379.10.4028/www.scientific.net/AMM.682.375Search in Google Scholar
[7] ČSN EN 1991-4 ed. 2 (730035) Eurocode 1: Load structures. Prague: Czech Office for Standards, Metrology and Testing, 2013, 97 pp. Czech Technical Standard.Search in Google Scholar
[8] Pillai J.R., Bradley M.S.A., Berry R.J., Comparison between the angles of wall friction measured on an on-line wallfriction tester and the Jenike wall friction tester, Powder Technology, 2007, 174, 64-70.10.1016/j.powtec.2006.10.024Search in Google Scholar
[9] Schulze D., Round robin test on ring shear testers, Advanced Powder Technology, 2011, 22 (2), 197-202.10.1016/j.apt.2010.10.015Search in Google Scholar
[10] Schulze D., Flow Properties of Powders and Bulk SolidsSearch in Google Scholar
[11] Available from: http://www.dietmar-schulze.de/grdle1.pdfSearch in Google Scholar
[12] Kobyłka R., Horabik J., Molenda M., Development of a rarefaction wave at discharge initiation in a storagesilo-DEM simulations, Particuology, 2018, 36, 37-49.10.1016/j.partic.2017.03.006Search in Google Scholar
[13] Kobyłka R., Molenda M., Horabik J., Loads on grain silo insert discs, cones, and cylinders: Experiment and DEM analysis, Powder Technology, 2019, 343, 521-532.10.1016/j.powtec.2018.11.032Search in Google Scholar
[14] González-Montellano C., Gallego E., Ramírez-Gómez Á., Ayuga. F., Three dimensional discrete element models for simulating the filling and emptying of silos: Analysis of numerical results, Computers and Chemical Engineering, 2012, 40, 22-32.10.1016/j.compchemeng.2012.02.007Search in Google Scholar
[15] Ji S., Wang S., Peng Z., Influence of external pressure on granular flow in a cylindrical silo based on discrete element method, Powder Technology, 2019, 356, 702-714.10.1016/j.powtec.2019.08.083Search in Google Scholar
[16] Gallego E., Fuentes J.M., Wiącek J., Villar J.R., Ayuga F., DEM analysis of the flow and friction of spherical particles in steel silos with corrugated walls, Powder Technology, 2019, 355, 425-437.10.1016/j.powtec.2019.07.072Search in Google Scholar
[17] Kobyłka R., Molenda M., DEM simulations of loads on obstruction attached to the wall of a model grain silo and of flow disturbance around the obstruction, Powder Technology, 2014, 256, 210-216.10.1016/j.powtec.2014.02.030Search in Google Scholar
[18] Kobylka R., Molenda M., DEM simulations of loads on obstruction attached to the wall of a model grain silo and of flow disturbance around the obstruction, Powder Technology, 2014, 256, 210-216.10.1016/j.powtec.2014.02.030Search in Google Scholar
[19] Zhu H.P., Zhou Z.Y., Yang R.Y., Yu A.B., Discrete particle simulation of particulate systems: A review of major applications and findings, Chemical Engineering Science, 2008, 63 (23), 5728-5770.10.1016/j.ces.2008.08.006Search in Google Scholar
[20] Fedorko G., Ivanco V., Molnar V., Simulation of interaction of a pipe conveyor belt with moulding rolls, Procedia Engineering, 2012, 48, 129-134.10.1016/j.proeng.2012.09.495Search in Google Scholar
[21] Molnar V., Fedorko G., Husakova N., Kral J., Ferdynus M., Energy calculation model of an outgoing conveyor with application of a transfer chute with the damping plate, Mechanical Science, 2016, 7 (2), 167-177.10.5194/ms-7-167-2016Search in Google Scholar
[22] Renzo A.D., Maio F.P.D., Comparison of contact-force models for the simulation of collisions in DEM-based granular &ow codes, Chemical Engineering Science, 2004, 59 (3), 525-541.10.1016/j.ces.2003.09.037Search in Google Scholar
[23] Rozbroj J., Simulation (DEM) of the movement of particulate matter in a screw conveyor in an application to the construction of a vertical screw (PhD thesis), 2013, Ostrava, VSB-Technical university of Ostrava.Search in Google Scholar
© 2019 D. Žurovec et al., published by De Gruyter, published by De Gruyter
This work is licensed under the Creative Commons Attribution 4.0 International License.
Articles in the same Issue
- Regular Article
- Exploring conditions and usefulness of UAVs in the BRAIN Massive Inspections Protocol
- A hybrid approach for solving multi-mode resource-constrained project scheduling problem in construction
- Identification of geodetic risk factors occurring at the construction project preparation stage
- Multicriteria comparative analysis of pillars strengthening of the historic building
- Methods of habitat reports’ evaluation
- Effect of material and technological factors on the properties of cement-lime mortars and mortars with plasticizing admixture
- Management of Innovation Ecosystems Based on Six Sigma Business Scorecard
- On a Stochastic Regularization Technique for Ill-Conditioned Linear Systems
- Dynamic safety system for collaboration of operators and industrial robots
- Assessment of Decentralized Electricity Production from Hybrid Renewable Energy Sources for Sustainable Energy Development in Nigeria
- Seasonal evaluation of surface water quality at the Tamanduá stream watershed (Aparecida de Goiânia, Goiás, Brazil) using the Water Quality Index
- EFQM model implementation in a Portuguese Higher Education Institution
- Assessment of direct and indirect effects of building developments on the environment
- Accelerated Aging of WPCs Based on Polypropylene and Plywood Production Residues
- Analysis of the Cost of a Building’s Life Cycle in a Probabilistic Approach
- Implementation of Web Services for Data Integration to Improve Performance in The Processing Loan Approval
- Rehabilitation of buildings as an alternative to sustainability in Brazilian constructions
- Synthesis Conditions for LPV Controller with Input Covariance Constraints
- Procurement management in construction: study of Czech municipalities
- Contractor’s bid pricing strategy: a model with correlation among competitors’ prices
- Control of construction projects using the Earned Value Method - case study
- Model supporting decisions on renovation and modernization of public utility buildings
- Cements with calcareous fly ash as component of low clinker eco-self compacting concrete
- Failure Analysis of Super Hard End Mill HSS-Co
- Simulation model for resource-constrained construction project
- Getting efficient choices in buildings by using Genetic Algorithms: Assessment & validation
- Analysis of renewable energy use in single-family housing
- Modeling of the harmonization method for executing a multi-unit construction project
- Effect of foam glass granules fillers modification of lime-sand products on their microstructure
- Volume Optimization of Solid Waste Landfill Using Voronoi Diagram Geometry
- Analysis of occupational accidents in the construction industry with regards to selected time parameters
- Bill of quantities and quantity survey of construction works of renovated buildings - case study
- Cooperation of the PTFE sealing ring with the steel ball of the valve subjected to durability test
- Analytical model assessing the effect of increased traffic flow intensities on the road administration, maintenance and lifetime
- Quartz bentonite sandmix in sand-lime products
- The Issue of a Transport Mode Choice from the Perspective of Enterprise Logistics
- Analysis of workplace injuries in Slovakian state forestry enterprises
- Research into Customer Preferences of Potential Buyers of Simple Wood-based Houses for the Purpose of Using the Target Costing
- Proposal of the Inventory Management Automatic Identification System in the Manufacturing Enterprise Applying the Multi-criteria Analysis Methods
- Hyperboloid offset surface in the architecture and construction industry
- Analysis of the preparatory phase of a construction investment in the area covered by revitalization
- The selection of sealing technologies of the subsoil and hydrotechnical structures and quality assurance
- Impact of high temperature drying process on beech wood containing tension wood
- Prediction of Strength of Remixed Concrete by Application of Orthogonal Decomposition, Neural Analysis and Regression Analysis
- Modelling a production process using a Sankey diagram and Computerized Relative Allocation of Facilities Technique (CRAFT)
- The feasibility of using a low-cost depth camera for 3D scanning in mass customization
- Urban Water Infrastructure Asset Management Plan: Case Study
- Evaluation the effect of lime on the plastic and hardened properties of cement mortar and quantified using Vipulanandan model
- Uplift and Settlement Prediction Model of Marine Clay Soil e Integrated with Polyurethane Foam
- IoT Applications in Wind Energy Conversion Systems
- A new method for graph stream summarization based on both the structure and concepts
- “Zhores” — Petaflops supercomputer for data-driven modeling, machine learning and artificial intelligence installed in Skolkovo Institute of Science and Technology
- Economic Disposal Quantity of Leftovers kept in storage: a Monte Carlo simulation method
- Computer technology of the thermal stress state and fatigue life analysis of turbine engine exhaust support frames
- Statistical model used to assessment the sulphate resistance of mortars with fly ashes
- Application of organization goal-oriented requirement engineering (OGORE) methods in erp-based company business processes
- Influence of Sand Size on Mechanical Properties of Fiber Reinforced Polymer Concrete
- Architecture For Automation System Metrics Collection, Visualization and Data Engineering – HAMK Sheet Metal Center Building Automation Case Study
- Optimization of shape memory alloy braces for concentrically braced steel braced frames
- Topical Issue Modern Manufacturing Technologies
- Feasibility Study of Microneedle Fabrication from a thin Nitinol Wire Using a CW Single-Mode Fiber Laser
- Topical Issue: Progress in area of the flow machines and devices
- Analysis of the influence of a stator type modification on the performance of a pump with a hole impeller
- Investigations of drilled and multi-piped impellers cavitation performance
- The novel solution of ball valve with replaceable orifice. Numerical and field tests
- The flow deteriorations in course of the partial load operation of the middle specific speed Francis turbine
- Numerical analysis of temperature distribution in a brush seal with thermo-regulating bimetal elements
- A new solution of the semi-metallic gasket increasing tightness level
- Design and analysis of the flange-bolted joint with respect to required tightness and strength
- Special Issue: Actual trends in logistics and industrial engineering
- Intelligent programming of robotic flange production by means of CAM programming
- Static testing evaluation of pipe conveyor belt for different tensioning forces
- Design of clamping structure for material flow monitor of pipe conveyors
- Risk Minimisation in Integrated Supply Chains
- Use of simulation model for measurement of MilkRun system performance
- A simulation model for the need for intra-plant transport operation planning by AGV
- Operative production planning utilising quantitative forecasting and Monte Carlo simulations
- Monitoring bulk material pressure on bottom of storage using DEM
- Calibration of Transducers and of a Coil Compression Spring Constant on the Testing Equipment Simulating the Process of a Pallet Positioning in a Rack Cell
- Design of evaluation tool used to improve the production process
- Planning of Optimal Capacity for the Middle-Sized Storage Using a Mathematical Model
- Experimental assessment of the static stiffness of machine parts and structures by changing the magnitude of the hysteresis as a function of loading
- The evaluation of the production of the shaped part using the workshop programming method on the two-spindle multi-axis CTX alpha 500 lathe
- Numerical Modeling of p-v-T Rheological Equation Coefficients for Polypropylene with Variable Chalk Content
- Current options in the life cycle assessment of additive manufacturing products
- Ideal mathematical model of shock compression and shock expansion
- Use of simulation by modelling of conveyor belt contact forces