The flow deteriorations in course of the partial load operation of the middle specific speed Francis turbine
-
Przemyslaw Szulc
 and
Artur Machalski
and
Artur Machalski

Abstract
The article presents the results of experimental and numerical tests of a water turbine. As the object of the research the middle size Francis turbine, characterized by a middle value of specific speed, was taken into consideration. The primary aim of the realized project was to explain the occurrence of a high vibration level in a partial load operation. It was realized by the application of the superposition of experimental methods and a numerical simulation. The numerical results were verified on the basis of comparison with experimental results obtained for the real turbine. The numerical models were built with great accuracy to the reality and the flow was recognized, which allows to explain the reasons for random occurrence of high vibration in a draft tube and indicate a possibility of improvement of the analyzed object. The results of the numerical research such as distributions of velocity, pressure and vapor volume fraction in the passages were taken into consideration. The flow inside the Francis turbine and an outflow chamber were conscientiously analyzed. Pressure and velocity distribution as well as water surface structure were presented in the paper. Furthermore, the results numerical investigations helped to describe a cavitation rope vortex creation in the draft tube and the development of the air vortexes in the outlet chamber. Finally, the superposition of those phenomena was responsible for the deterioration of the turbine operation.
1 Introduction
Water power engineering is a widely spread source of electrical energy. The potential of storage and fast introduction into the grid are main advantages. It is commonly known that the demand for electricity alternates in course of the day, therefore, water turbines should be regulated, which sometimes leads to operational obstacles. These problems depend on the type of a water engine and one of the common machines is the Francis turbine. These types of turbines are very sensitive to the partial load operation which strongly limits the regulation range.
A partial load operation regime is characterized by a very strong swirl in the draft tube [1]. It leads to strong flow instabilities and, as a result, an enormous stagnate zone could be observed. Moreover, when the swirling is strong the phenomena of the cavitation rope vortex could be noticed. These deteriorated operation of the draft tube leads to efficiency reduction and a strong pressure pulsation [2, 3]. In most situations the impact of the draft tube on the power generation diminishes, which is responsible for even 35–40% of energy recovery [4].
Due to a strong influence of the occurring rope vortex structure on the turbine performance the process of creation, development and controlling of this phenomenon was the object of a lot of research. It allows to improve reliability of the machine and reduce a vibration level. In recent years, the CFD methods have allowed to obtain a lot of interesting information on the partial load operation of the Francis turbine. Sick et al. [5] realized simulations of a cavitation vortex in a reverse turbine by means of the RMS (Reynolds stress) model. The realized simulations were characterized by convergence corresponding with the reality. The unsteady modeling with the application of the Reynolds Averaged Navier–Stokes model was presented in publication [6]. The standards k–ϵ viscous model was applied and the divergence equaled 13%. The same turbulence model, with a logarithmic wall function, was used for the simulation of the flow phenomena in the draft tube by Zhang et al. [7]. The characteristics and control of the draft tube flow were investigated. Vu et al. [20] conducted the research of the losses in the draft tube in the whole range of the turbine operation. The simulations were made as steady and unsteady, with k–ϵ viscous model. The authors claim that a utilized turbulence model provides smaller convergence with the results of the experiment when the regulation of the turbine decreases. In presented papers the obtained divergences are quite high. The main reason is the utilized numerical approach. In most cases two–equation turbulence models were applied which is not proper due to the isotropy assumption not dedicated for strong swirling flows [8]. The simulations of a strongly whirling vortex were made by Yaras and Grosvenor [9]. The authors applied many different turbulence models. This is interesting, that the k–ω SST model provides the worst prediction. Similar simulations in a conical diffuser were made by Dhiman et al. [10]. The tested turbulence model such as: a two–equation standard, RNG, realizable k–ϵ, SST k–ω and the Reynolds stress model are not proper for the analyzed object. The improper results of simulations, were the swirling character of the flow was not fully reflected by the RANS models, were presented in [11]. Hence, the unsteady statistical turbulence models were applied in publications [11, 12] and [13], mostly as the hybrid of RANS and LES. Control of the cavitation rope vortex was presented in articles [14, 15, 16, 17, 18].
The numerical simulation of the draft tube and outlet chamber was presented in [19]. The authors analyzed the flow structure in the draft tube and its impact on the flow phenomena in the outlet chamber. The two–phase simulations were realized.
The literature review shows that the cavitation rope vortex is the main reason for the occurrence of vibration in the draft tube. However, there is no information about the influence of the turbine outlet structure on the collapse of the analyzed multiphase object. Due to this fact, the authors decided to perform accurate measurements. The main purpose of the presented paper is to analyze the flow structures of the Francis water turbine in a nominal and partial load operation in main passages of the machine and, especially, in the outlet chamber.
2 Object of the research
The water turbine in question was installed in a hydroelectric power plant situated close to the dam, working mainly in the run on river regime, but also with the possibility of storage operation. The water power station was equipped with six water turbines supplied with water by means of derivation channels. Due to the primary construction of the machine hall, three different sizes and types of water turbines were applied. All turbines were equipped with electro hydraulic regulation of the guide vane and are coupled with synchronous generators with brushless excitation. Five of them are vertical axis, one entry Francis turbine, and the last one is a horizontal axis double Francis–Dubs water engine, operating in one draft tube.
To investigate the flow structure in main passages of the Francis water turbine a standard construction was taken into consideration. The object of the study was shown in Figure 1. The unit of the vertical axis was equipped with an impeller and an adjustable guide vane. Main geometrical and operational parameters of the analyzed object were presented in Table 1. The object of the research was described with a value of dynamic specific speed nsN = n·N0.5/H1.25 = 296.

The object of analysis
Operating and geometrical parameters of the analyzed water turbine
| No. | Name | Symbol | Value | |
|---|---|---|---|---|
| Nominal parameters | ||||
| 1 | Flow | Q (m3/s) | 6.75 | |
| 2 | Total head | H (m) | 38 | |
| 3 | Rotational speed | n (rpm) | 500 | |
| 4 | Power consumption | P (kW) | 2307 | |
| Maximum | ||||
| parameters | ||||
| 1 | Flow | Q (m3/s) | 7.34 | |
| 2 | Total head | H (m) | 38 | |
| 3 | Rotational speed | n (rpm) | 500 | |
| 4 | Power consumption | P (kW) | 2460 | |
| Others parameters | ||||
| 1 | External diameter of the impeller | d2(mm) | 1050 | |
| 2 | Width of adjustable guide vane | b0(mm) | 364 | |
| 3 | Number of impeller blades | zimp | 15 | |
| 4 | Number of guide vanes | zgv | 20 | |
| 5 | Runway rotational speed | nr (rpm) | 950 | |
| 6 | Specific speed | nsN | 296 | |
3 Experimental test
The experimental research was divided into two parts:
energy research,
visualization tests.
To compare the accuracy of the numerical model of the analyzed turbine accurate measurements were performed. Operating parameters of the turbine set as a whole were analyzed. The fallow variables were measured: head-bay and after-bay, pressure at the inlet to the turbine volute casing and at the outlet of the turbine, shaft speed rotations as well as electric power generated by the turbine set, the angle of the adjustable guide vanes. Tests were conducted to obtain the hydraulic properties of the turbine. During the experimental research the following parameters were measured:
Rate of flow – Q – ultrasonic flow meter in accuracy class 0.5.
Intake and outlet pressure – pi, po – electronic pressure gauges in accuracy class 0.6.
Power consumption – P – power monitoring unit in accuracy class 0.5.
Level of the upper and tail water – hydrometric patch with graduation 0.01 m.
Rotational speed – n – tachometer in the accuracy class 0.5.
To evaluate the phenomena occurring in the outlet chamber of the turbine and which are not measurable, a visualization of the water surface was performed by the registration of the free surface image. The visualization in the chamber was made by means of a high speed video camera.
The results of the experimental tests and their analyses were extensively discussed by comparison with the results of numerical simulations.
4 The numerical model
In order to investigate the flow phenomena of the analyzed turbine the application of the computational flow dynamic was necessary. The main purpose of this stage was to obtain the pressure and velocity fields of the liquid flow. The numerical simulations of the flow in the hydraulic part of the turbine were realized using the commercial ANSYS Fluent CFD software. The tests were conducted as steady RANS and unsteady URANS for the determined boundary conditions. The medium was water of density ρh2o = 998.2 kg/m3 as well as absolute viscosity μh2o = 0.001003 Pas. The standard models of turbulence k– ω SST, k–e Realizable and DES were used for calculations. The numerical model does not reflect the roughness of the flow parts. Convergence criterion was 0.0001. The unstructured mesh was created by means of the ICEM CFD. Tetra elements were made in the the flow body and the prisms layers were applied near the walls (first layers were 0.025 mm). The density of the mesh increased near the blade. The total number of nodes was assumed in accordance with the test of the mesh independence and it was maximum 50 mln.
As the interface between stationary and rotating domains the stage average velocity was applied. The computational meshes were presented in Figure 3.
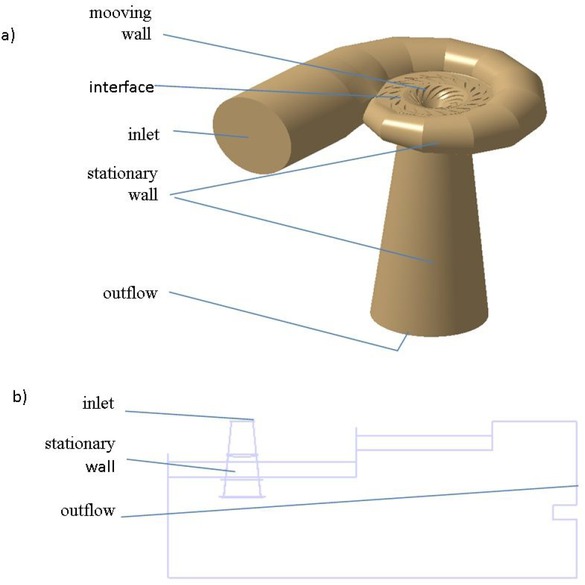
Computational model: a) turbine, b) outlet chamber
The conducted simulations were divided into two parts. In the first one, the flow in the water turbine was identified. The numerical model consisted of four fluid domains: volute casing, guide vane, impeller a draft tube – Figure 2. The boundary conditions were defined as the mass flow rate at the inlet and opening pressure at the outlet of the model. To model the flow in the outlet chamber (second step) the following approach was adopted. Due to its operation the velocity profile feeding it is particularly important. Considering the size of the model the outlet chamber was simulated separately feeding it with the velocity profile obtained by numerical simulations of the turbine. The assigned profile dependent on the opening of the guide vane as well as the after-bay. The simulations were performed as steady and unsteady.
Measurements validation was made based on comparison between the turbine set actual power and power obtained as a result of numerical simulations. Results were presented in Table 2.
The validation of the numerical model
| Experimental test | Numerical simulations | |||||
|---|---|---|---|---|---|---|
| αn | Qexp | Hexp | Pexp | QCFD | HCFD | PCFD |
| % | m3/s | m | MW | m3/s | m | MW |
| 91 | 7.4 | 33.6 | 2.1 | 7.45 | 33.3 | 2.18 |
| 61.4 | 5.7 | 35.0 | 1.61 | 5.69 | 34.7 | 1.72 |
where: CFD index means parameters obtained by numerical simulations and exp from the experiment tests.
Based on the conducted tests, the following can be noticed:
discrepancy in power developed by the turbine set in real conditions and while modeling is slight. Considering the efficiency of the generator, volumetric and mechanical efficiencies as well as friction coefficient of the rotating disks globally on the level 95%, the actual turbine power is for the first point Pt = 2.21 MW and Pt = 1.69MW respectively, and the deviation with respect to CFD is merely 1.36% and 1.51%;
discrepancies in the head values are the result of the boundary conditions adopted in the model and they do not exceed 1%;
the presented numerical model shows a good convergence of the actual turbine operation and can be used to identify the flow in the tested machine.
The validation of the outlet chamber was realized by the comparison of the vortex structures generated in the water surface which were similar. The appropriate results were presented below.
5 Analyses of the results and discussion – flow identification in the water turbine
To identify the phenomena accompanying the liquid flow in the turbine operating in the partial load regime the simulation for opening the guide vane αn = 61.4% was conducted. In courese of the experimental tests strong ‘hits’ accompanying the operation of the water engine were noticed at this point of the operation. A detailed flow analysis in the spiral feeding element indicates the uniform distribution of liquid particles in all its parts. Lack of clear stagnation zones can be noticed, all streamlines are directed towards the guide vane. Stay vanes create a decreased pressure zone on their active side, which is the result of flow near the hydrodynamic profile. This area decreases while its distance from the spiral inlet increases, which can say about a change of the angle of attack or the value of liquid velocity flowing around the element. The visualization in the arrangement stay vane – guide vane – impeller was presented in Figure 4. While analyzing the operation of the guide vane should be noticed that it fluently changes liquid flow direction, the medium does not separate from the sides of vanes. A hydrodynamic wake appears after the vanes of both guide vanes. Pressure distribution is appropriate. The analyzed arrangement operates correctly. The flow in the area of the impeller was shown in Figure 4. A regularity in water particles flow is noticeable. There is a lack of flow disorder. An extensive analysis of relative velocity vectors confirms the above statement. They are arranged in accordance with the direction defined by impeller blades geometry both in a meridional cross–section and a conformal projection. Considering the isolines of the static pressure in the blade passage its clear change can be seen. The conducted transient simulations did not show any differences in the distribution of the flow parameters compare to the steady ones.

Computational mesh: a) turbine, b) outlet chamber
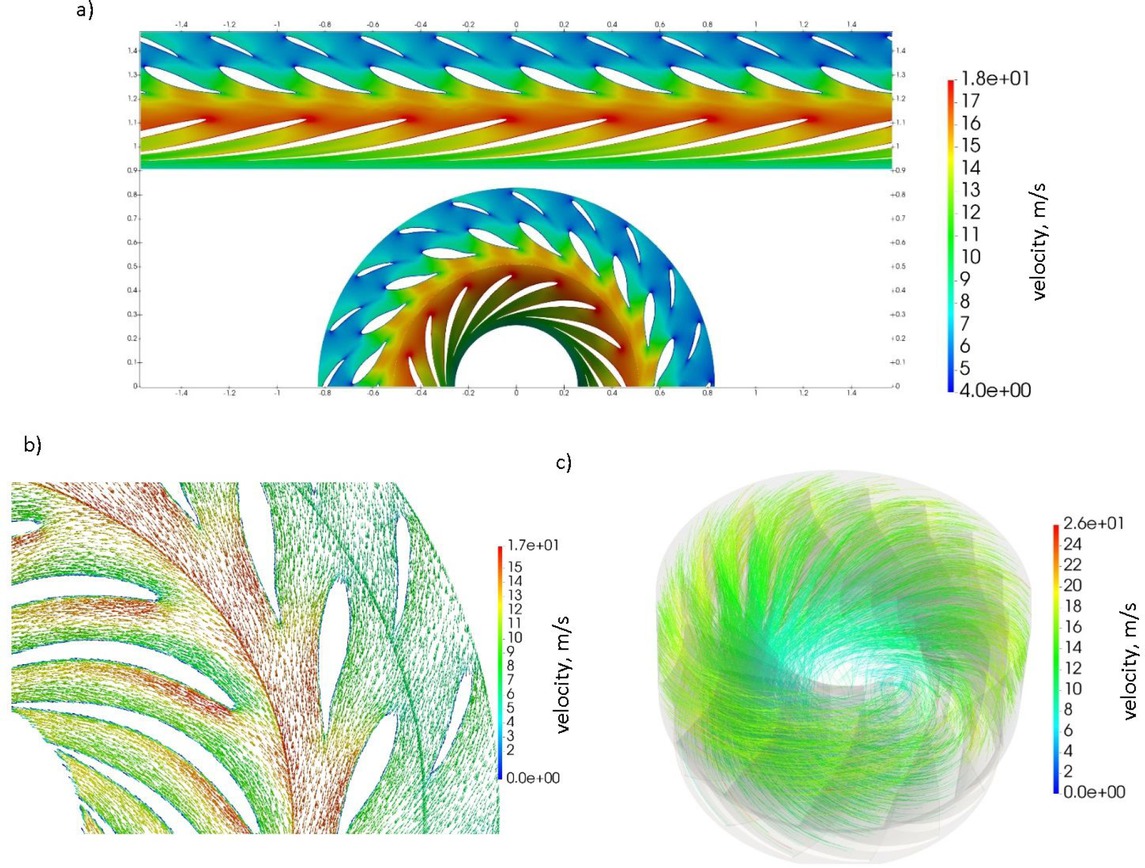
The flow structure in analyzed turbine : a) the distribution of velocity, b) velocity vectors, c) streamlines
The outlet element in the reaction turbine is a draft tube, whose performance in given turbine regulation conditions was analyzed as the last one. The results of numerical simulations were presented in Figure 5. While examining the obtained results it should be noticed that the liquid leaves the impeller with a big value of peripheral component of absolute velocity. Moment of momentum which occurs at the outlet is caused by the partial load operation. Such strongly swirled stream of liquid feeds the draft tube causing many stagnation zones and reverse flows. The liquid close to the sides of a pipe is characterized by the highest velocity, which is caused by the action of the centrifugal force and tightening of the liquid elements to its walls. In the inner part of a diffuser there is a vast area of a decreased velocity which does not take part in the flow. In the inner part of the pipe one can notice the zone of a strong back flow covering the range of about 1/2 –1/3 pipe volume. Such an extensive dead zone leads to necking down of the draft tube active cross–section, therefore, it cannot work correctly, therefore, the recovery of the kinetic energy raised from the impeller is deteriorated.

The distribution of the velocity (a) and pressure (b) in draft tube
Significant information concerning the flow structure in the draft tube provides the analysis of the static pressure distribution Figure 5b. The obtained test results indicate the inappropriate operation of the diffuser. Its construction was not adjusted to retrieve at least a peripheral component of velocity. There are a lot of areas of a large pressure gradient. Their characteristic feature is a close location. Once the areas are connected with a line, a ‘sinusoidal’ course is obtained.
The occurrence of the phenomenon of the flow with swirl in the draft tube is a subject to permanent moment of momentum principle. As a result, peripheral components of the velocity at each point of the cross–section perpendicular to its axis is inversely proportional to the radius, therefore, pressure will also depend on it. If, on the specific radius value the absolute pressure equals the saturation pressure in a given temperature, a boundary water ring also called a cavitation core or a cavitation rope vortex will appear. The further part of the work involved extensive numerical simulations of the flow in the draft tube, directed at the determination of the structure of the existing cavitation core and its range of action. The results were presented in Figure 6. The simulations were performed as unsteady. After analyzing the results of numerical simulations one can notice a vast swirl of a spiral structure, which is initiated on the flat part of the hub,whose axis coincides with the axis of the draft tube.

The cavitation rope vortex in analyzed turbine
The swirl is the area of the lowest static pressure in the whole turbine. In favorable conditions, when the after-bay is low, pressure inside falls to the saturation value and the rope vortex covers 1/2 – 1/3 length of the draft tube. The occurring swirl disappears in the area of a strong recirculation inside the draft tube outlet.
6 The analyses of the results and discussion – the flow identification in outlet chamber
The outlet chamber is the last flow element of a hydroelectric power plant. Its proper performance depends on geometric parameters as well as velocity profile and pressure at its feed. Geometric dimensions ought to be selected in a way that makes it impossible to suck the air into the draft tube which can be a reason for vibration occurrence. The purpose of this part of numerical simulations was the determination of the influence of the velocity profile feeding the draft tube on the operation of the arrangement draft tube – outlet chamber, as well as the control of the constructional correctness.
The analyzed turbine cooperates with an open chamber whose dimensions were inventoried during the experimental tests. These activities enabled accurate reflection of the chamber geometry as well as the numerical model construction. The work was divided into two stages. For each of the two extreme ordinates of the tail watera single–phase modeling was conducted, cutting out the free surface of liquid at the value of the determined ordinate. Based on the results obtained from the analysis it was decided to realize a two–phase simulation air–water, which was the second part of the test.
The numerical model included the draft tube together with the outlet chamber. In all cases the diffuser was fed with the velocity profile obtained during the turbine numerical simulations. The results of numerical simulations of a single–phase flow in the outlet chamber were presented in Figure 7.

The distribution of the velocity vectors in the outlet chamber
While analyzing the distribution of static and total pressure a great number of zones of high parameter volatility can be noticed. The lowest pressure occurs inside the draft tube, the highest at the free surface of liquid, and close to the bottom at the rear part of the chamber, as well as in the outlet section. Considering the distribution of velocity vectors in the draft tube and outlet chamber cross–sections strong and many swirl zones can be noticed. Flow with moment of momentum in the draft tube results in creation of a lower velocity area in the middle part of the diffuser, thus, a vast area of stagnation is made. Its range grows when the distance from the draft tube inlet increases. The outflow from the draft tube,which is perpendicular to the chamber axis, causes swirl zones on both its sides (cross–section, Figure 7b). Due to the asymmetric location of the draft tube the swirl on the right side is greater and situated in the lower part of the chamber. On the left, the swirl is in the upper part of the chamber. Near the free surface of the liquid area flow direction changes, which can say about the occurrence of the wave motion.
While analyzing the results presented in Figure 7a one can notice large velocity gradients close to the draft tube outlet. Presence of the rear wall of the chamber forces the flow upwards with high velocity, and causes reverse flow. Due to the flow with moment of momentum the liquid is transported mainly close to the bottom, returning up wards in the final part of the chamber. The increased velocity in the upper part of the chamber, close to the water surface indicates that the wave motion and swirls can occur there.
To determine the structure of the free surface of liquid in the outlet chamber numerical simulations using the two–phase model air–water were performed. Calculations were made as unsteady and the time step was t = 0.05 s.
The results of numerical simulations can be found in Figure 8. Considering the obtained test results one should notice the wave motion caused by the liquid flow in the chamber. The flow near the outer coat of the draft tube leads to the decrease of water surface behind this element, and in correlation with the higher velocity zone it conduces to swirl creation, which takes a characteristic of air vortex. The swirl is quite vast. It can cause disorders in the draft tube operation, therefore, influence the performance of the water turbine. Its depth in the cross section reaches the immersion depth of the diffuser. In favorable conditions the swirl can get inside the draft tube and cause, next to the cavitation vortex, an additional source of the unstable operation of the turbine set.

The water surface structure in the outlet chamber
Comparison of visualization results of the actual structure of the water surface in the outlet chamber was presented in Figure 8. The image of the flow is in both cases similar. It proves the correctness of the performed simulations.
7 Conclusions
Results of the experimental, unsteady and steady numerical simulations of the Francis water turbine were presented in this paper. In accordance with the conducted analyses and obtained results of the investigation the following conclusions could be drawn:
A spiral feeding channel, guide vane as well as impeller operate correctly independent of the regulation depth. Streamlines distribute evenly, there is a lack of recirculation and dead zones.
A flow image in the arrangement impeller–draft tube during turbine operation in the beyond optimal point is highly deteriorated. The liquid leaves the impeller with high moment of momentum and such a velocity profile feeds the draft tube. As a consequence, a zone of low pressure occurs in the central part of the pipe immediately after the impeller, and the whole core of the draft tube is the area of back flow creating the dead zone.
In the above described regulation condition after the impeller, in the central part of the draft tube there is the lowest pressure area in the whole analyzed geometry. The shape of this area proves the existence of the cavitation rope vortex breaking off the flat part of the impeller hub.
A flow analysis in the outlet chamber of the turbine operating in the beyond optimal condition indicates the occurrence of swirl zones. The liquid flowing out of the draft tube under strong moment of momentum disturbs the flow in the outlet chamber. Structures with high velocity and pressure gradients can be observed in the area of free liquid surface, which in real conditions can lead to the wave motion close to the draft tube casing.
A two–phase flow modeling in the arrangement draft tube–outlet chamber proved the conducted visualization tests where surface swirl zones are noticeable, which is the reason for sucking air into the draft tube. A slight immersion of the draft tube outlet conduces to it.
The suction of the air into the draft tube conduces the collapsing of the rope vortex and this mutual correlation is the main reason of the unregularly vibration of analyzed object.
Acknowledgement
Calculations have been made using resources provided by Wroclaw Centre for Networking and Supercomputing (http://wcss.pl), grant No. 444/2017.
References
[1] Dorfler P., Sick M., Coutu A., Flow–Induced Pulsation and Vibration in Hydroelectric Machinery. Engineer’s Guidebook for Planning, Design and Troubleshooting, 2013, Springer.10.1007/978-1-4471-4252-2Search in Google Scholar
[2] Bronstiein L.A. , Gierman A.I., Goldin W.E., Konovalov I.I., Robuk I.I., Umikov I.N, Cogin I.A., Sriro I.I., Hydro turbines hand book, 1971, Mashinostroenie.Search in Google Scholar
[3] Michalowski S., Plutecki J., Energetyka Wodna, 1975, Warsaw.Search in Google Scholar
[4] Gubin M.F., Draft tubes of water power stations, 1970, Energia.Search in Google Scholar
[5] Sick, M., Dorfler, P., Michler, W., Salllaberger, M., and Lohmberg, A., , Investigation of the draft tube vortex in a pump–turbine, 22nd IAHR Symposiumon Hydraulic Machinery and Systems, 2004, Stockholm, Sweden, June 22–July 2.Search in Google Scholar
[6] Ciocan, G. D., Iliescu, M. S., Vu, T. C., Nennemann, B., Avellan, F., Experimental study and numerical simulation of the flindt draft tube rotating vortex, ASME J. Fluids Eng., 2007, 129(2), pp. 146–158.10.1115/1.2409332Search in Google Scholar
[7] Zhang, R. K., Mao, F., Wu, J. Z., Chen, S. Y., Wu, Y. L., Liu, S. H., Characteristics and control of the draft–tube flow in part–load Francis turbine, ASME J. Fluids Eng., 2009, 131(2), pp. 021101.10.1115/1.3002318Search in Google Scholar
[8] Sick, M., Michler, W., Weiss, T., Keck, H., Recent developments in the dynamic analysis of water turbines, Proc. Inst. Mech. Eng. Part A, J. Power Energy, 2009, 223(4), pp. 415–427.10.1243/09576509JPE578Search in Google Scholar
[9] Yaras, M. I., Grosvernor, A. D., Evaluation of One– and Two– Equation Low–Re Turbulence Models. Part I—Axisymmetric Separating and Swirling Flow, Int. J. Numer. Methods Fluids, 2003, 42(12),pp. 1293–1319.10.1002/fld.585Search in Google Scholar
[10] Dhiman, S., Foroutan, H., Yavuzkurt, S., Simulation of flow through conical diffusers with and without inlet swirl using CFD, ASMEJSME– KSME Joint Fluids Engineering Conference, 2011, Hamamatsu, Japan, July24–29, ASME Paper No. AJK2011–03005.10.1115/AJK2011-03005Search in Google Scholar
[11] Ruprecht, A., Helmrich, T., Aschenbrenner, T.,Scherer, T., , Simulation of vortex rope in a turbine draft tube, 21st IAHR Symposium on Hydraulic Machinery and Systems, Lausanne, 2002, Switzerland, September 9–12.Search in Google Scholar
[12] Paik, J., Sotiropoulos, F., Sale, M., Numerical simulation of swirling flow in complex hydroturbine draft tube using unsteady statistical turbulence models, J. Hydraulic Eng., 2005, 131(6), pp. 441–456.10.1061/(ASCE)0733-9429(2005)131:6(441)Search in Google Scholar
[13] Foroutan H., Yavuzkurt S., Flow in the simplified draft tube of a Francis turbine operating at partial load—part 1: simulation of the vortex rope, Journal of Applied Mechanics, 2014, Vol. 81 pp. 61010–1–810.1115/1.4026817Search in Google Scholar
[14] Bhan, S., Codrington, J. B., Mielke, H., Reduction of Francis turbine draft tube surges, 5th International Symposium on Hydro Power Fluid Machinery, Chicago, 1988, IL, November 27–December 2.Search in Google Scholar
[15] Qian, Z. D., Li, W., Huai, W. X., Wu, Y. L., The effect of the runner cone design on pressure oscillation characteristics in a Francis hydraulic turbine, Proc. IMechE A J. Power Energy, 2012, 226(1), pp. 137–150.10.1177/0957650911422865Search in Google Scholar
[16] Zhang, R. K., Mao, F., Wu, J. Z., Chen, S. Y., Wu, Y. L., Liu, S. H., Characteristics and control of the draft–tube flow in part–load Francis turbine, ASME J. Fluids Eng., 2006, 131(2), p. 021101.10.1115/1.3002318Search in Google Scholar
[17] Susan–Resiga, R., Muntean, S., Hasmatsuchi, V., Anton, I., Avellan, F., Analysis and prevention of vortex breakdown in the simplified discharge cone of a Francis turbine, ASME J. Fluids Eng., 2010, 132(5), p. 051102.10.1115/1.4001486Search in Google Scholar
[18] Foroutan H., Yavuzkurt S., Flow in the simplified draft tube of a Francis turbine operating at partial load—part 2: control of the vortex rope, Journal of Applied Mechanics, 2014, Vol. 81, pp.061011–1–7.10.1115/1.4026818Search in Google Scholar
[19] Szulc P., Plutecki J., Obstacles of flow systems adaptation of an alimentation water dump for the structure of a small water power plant, Hidronergia 2012,International Congress and Trade Fair on Small Hydropower, Wroclaw, 23–26 May 2012.Search in Google Scholar
[20] Vu T. C., Devals C., Zhang, Y., Nennemann B., Guibault F., 2011, Steady and unsteady flow computation in an elbow draft tube with experimental validation, Int. J. Fluid Mach. Syst., 4(1), pp. 85–96.10.5293/IJFMS.2011.4.1.085Search in Google Scholar
© 2019 P. Szulc and A. Machalski, published by De Gruyter
This work is licensed under the Creative Commons Attribution 4.0 International License.
Articles in the same Issue
- Regular Article
- Exploring conditions and usefulness of UAVs in the BRAIN Massive Inspections Protocol
- A hybrid approach for solving multi-mode resource-constrained project scheduling problem in construction
- Identification of geodetic risk factors occurring at the construction project preparation stage
- Multicriteria comparative analysis of pillars strengthening of the historic building
- Methods of habitat reports’ evaluation
- Effect of material and technological factors on the properties of cement-lime mortars and mortars with plasticizing admixture
- Management of Innovation Ecosystems Based on Six Sigma Business Scorecard
- On a Stochastic Regularization Technique for Ill-Conditioned Linear Systems
- Dynamic safety system for collaboration of operators and industrial robots
- Assessment of Decentralized Electricity Production from Hybrid Renewable Energy Sources for Sustainable Energy Development in Nigeria
- Seasonal evaluation of surface water quality at the Tamanduá stream watershed (Aparecida de Goiânia, Goiás, Brazil) using the Water Quality Index
- EFQM model implementation in a Portuguese Higher Education Institution
- Assessment of direct and indirect effects of building developments on the environment
- Accelerated Aging of WPCs Based on Polypropylene and Plywood Production Residues
- Analysis of the Cost of a Building’s Life Cycle in a Probabilistic Approach
- Implementation of Web Services for Data Integration to Improve Performance in The Processing Loan Approval
- Rehabilitation of buildings as an alternative to sustainability in Brazilian constructions
- Synthesis Conditions for LPV Controller with Input Covariance Constraints
- Procurement management in construction: study of Czech municipalities
- Contractor’s bid pricing strategy: a model with correlation among competitors’ prices
- Control of construction projects using the Earned Value Method - case study
- Model supporting decisions on renovation and modernization of public utility buildings
- Cements with calcareous fly ash as component of low clinker eco-self compacting concrete
- Failure Analysis of Super Hard End Mill HSS-Co
- Simulation model for resource-constrained construction project
- Getting efficient choices in buildings by using Genetic Algorithms: Assessment & validation
- Analysis of renewable energy use in single-family housing
- Modeling of the harmonization method for executing a multi-unit construction project
- Effect of foam glass granules fillers modification of lime-sand products on their microstructure
- Volume Optimization of Solid Waste Landfill Using Voronoi Diagram Geometry
- Analysis of occupational accidents in the construction industry with regards to selected time parameters
- Bill of quantities and quantity survey of construction works of renovated buildings - case study
- Cooperation of the PTFE sealing ring with the steel ball of the valve subjected to durability test
- Analytical model assessing the effect of increased traffic flow intensities on the road administration, maintenance and lifetime
- Quartz bentonite sandmix in sand-lime products
- The Issue of a Transport Mode Choice from the Perspective of Enterprise Logistics
- Analysis of workplace injuries in Slovakian state forestry enterprises
- Research into Customer Preferences of Potential Buyers of Simple Wood-based Houses for the Purpose of Using the Target Costing
- Proposal of the Inventory Management Automatic Identification System in the Manufacturing Enterprise Applying the Multi-criteria Analysis Methods
- Hyperboloid offset surface in the architecture and construction industry
- Analysis of the preparatory phase of a construction investment in the area covered by revitalization
- The selection of sealing technologies of the subsoil and hydrotechnical structures and quality assurance
- Impact of high temperature drying process on beech wood containing tension wood
- Prediction of Strength of Remixed Concrete by Application of Orthogonal Decomposition, Neural Analysis and Regression Analysis
- Modelling a production process using a Sankey diagram and Computerized Relative Allocation of Facilities Technique (CRAFT)
- The feasibility of using a low-cost depth camera for 3D scanning in mass customization
- Urban Water Infrastructure Asset Management Plan: Case Study
- Evaluation the effect of lime on the plastic and hardened properties of cement mortar and quantified using Vipulanandan model
- Uplift and Settlement Prediction Model of Marine Clay Soil e Integrated with Polyurethane Foam
- IoT Applications in Wind Energy Conversion Systems
- A new method for graph stream summarization based on both the structure and concepts
- “Zhores” — Petaflops supercomputer for data-driven modeling, machine learning and artificial intelligence installed in Skolkovo Institute of Science and Technology
- Economic Disposal Quantity of Leftovers kept in storage: a Monte Carlo simulation method
- Computer technology of the thermal stress state and fatigue life analysis of turbine engine exhaust support frames
- Statistical model used to assessment the sulphate resistance of mortars with fly ashes
- Application of organization goal-oriented requirement engineering (OGORE) methods in erp-based company business processes
- Influence of Sand Size on Mechanical Properties of Fiber Reinforced Polymer Concrete
- Architecture For Automation System Metrics Collection, Visualization and Data Engineering – HAMK Sheet Metal Center Building Automation Case Study
- Optimization of shape memory alloy braces for concentrically braced steel braced frames
- Topical Issue Modern Manufacturing Technologies
- Feasibility Study of Microneedle Fabrication from a thin Nitinol Wire Using a CW Single-Mode Fiber Laser
- Topical Issue: Progress in area of the flow machines and devices
- Analysis of the influence of a stator type modification on the performance of a pump with a hole impeller
- Investigations of drilled and multi-piped impellers cavitation performance
- The novel solution of ball valve with replaceable orifice. Numerical and field tests
- The flow deteriorations in course of the partial load operation of the middle specific speed Francis turbine
- Numerical analysis of temperature distribution in a brush seal with thermo-regulating bimetal elements
- A new solution of the semi-metallic gasket increasing tightness level
- Design and analysis of the flange-bolted joint with respect to required tightness and strength
- Special Issue: Actual trends in logistics and industrial engineering
- Intelligent programming of robotic flange production by means of CAM programming
- Static testing evaluation of pipe conveyor belt for different tensioning forces
- Design of clamping structure for material flow monitor of pipe conveyors
- Risk Minimisation in Integrated Supply Chains
- Use of simulation model for measurement of MilkRun system performance
- A simulation model for the need for intra-plant transport operation planning by AGV
- Operative production planning utilising quantitative forecasting and Monte Carlo simulations
- Monitoring bulk material pressure on bottom of storage using DEM
- Calibration of Transducers and of a Coil Compression Spring Constant on the Testing Equipment Simulating the Process of a Pallet Positioning in a Rack Cell
- Design of evaluation tool used to improve the production process
- Planning of Optimal Capacity for the Middle-Sized Storage Using a Mathematical Model
- Experimental assessment of the static stiffness of machine parts and structures by changing the magnitude of the hysteresis as a function of loading
- The evaluation of the production of the shaped part using the workshop programming method on the two-spindle multi-axis CTX alpha 500 lathe
- Numerical Modeling of p-v-T Rheological Equation Coefficients for Polypropylene with Variable Chalk Content
- Current options in the life cycle assessment of additive manufacturing products
- Ideal mathematical model of shock compression and shock expansion
- Use of simulation by modelling of conveyor belt contact forces