Optimization of the conditions for the preparation of povidone iodine using the response surface methodology
-
Ngoc Quy Nguyen

 and
Nhi Yen Thi Tran
and
Nhi Yen Thi Tran

Abstract
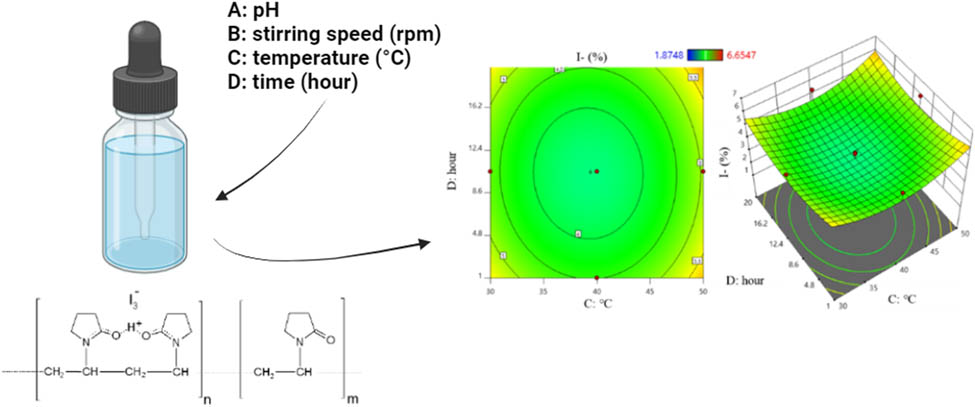
Povidone iodine has been a widely used standard disinfectant in the medical field. The preparation process has not received sufficient attention because of the influencing factors and their correlations under the same conditions. The response surface methodology matrix was used for variables affecting yield, I2, and I content from the central composite design of pH (1–7), stirring speed (400–1,200 rpm), temperature (30–50°C), and time (1–20 h). The evaluation of the IR spectrum after preparation showed similarity in molecular arrangement positions. The compatibility of the predicted data with the model was indicated by an R 2 coefficient > 0.95 (Y1) and a CV% of 30 runs reaching 1.15%. The temperature–time factor pair showed a significant positive correlation to Y1, while I2 content was positively influenced by pH and temperature. Additionally, the square of stirring speed and the square of temperature also increased the I content. From the verification data, all four factors were shown to have a significant impact on the povidone-iodine preparation process with an error α less than 5%.
Graphical abstract
1 Introduction
Iodine has been used as a disinfectant for the prevention and treatment of various infections. However, the widespread use of iodine as an antimicrobial agent was limited by several undesirable side effects, such as irritation, sensitization, and low water solubility [1]. In the early 1950s, the “taming of iodine,” that is, the complexation with inert polymers, resulted in a new compound called iodophor [2]. Povidone-iodine (PVP-I), a chemical complex of poly (vinyl-2-pyrrolidone) with elemental iodine, was the most commonly used iodophor. PVP-I had an exceptionally broad spectrum of antimicrobial activity and was widely applied in disinfection and sterilization [3]. A few methods similar to those used for the preparation of PVP-I were carried out by copolymerizing 2-(2-acryloylamino-ethyldisulfanyl)-nicotinic acid with N-vinylpyrrolidone to obtain PVP-thiolate, which was then complexed with iodine [4,5].
Typically, when optimizing parameters for experimental research, scientists use the classical method of one variable at a time. However, this method did not clearly show the interactions and influences between the parameters, and the total number of experiments required increased significantly as the number of factors increased, leading to more time and higher costs. To overcome this drawback, Box and colleagues developed a mathematical optimization method through a pre-designed model. The optimization of analytical processes was carried out using multivariate statistical techniques. The response surface methodology (RSM) was applied in the optimization of experimental parameters and showed high efficiency [6]. In scientific research, the RSM method was widely applied in the extraction of natural compounds such as optimizing the microwave-assisted hydrodistillation process to extract citral from lemongrass [7], high-ester pectin from passion fruit peel [8], optimizing the gelatin extraction process from grass carp skin [9], the production process of dried soursop with high vitamin C content [10], and optimizing other chemical processes such as the adsorption capacity of Cu2+, Ni2+, and Pb2+ by activated carbon made from banana peels [11], and heat-pumb drying mango [12], and synthesis of chiral benzoin using Candida cylindracea lipase in supercritical carbon dioxide [13].
However, studies applying RSM to optimize the preparation conditions of disinfectants have been diverse, specifically in the preparation of PVP-I to achieve good yield. This research aimed to eliminate noise parameters and identify optimal conditions for the preparation of PVP-I. For these reasons, the objectives were carried out based on determining the influence levels of factors such as temperature, pH, stirring speed, and stirring time on the yield of the PVP-I preparation process. Additionally, the correlation between the input factors was analyzed to better understand the impact of each factor.
2 Materials and methods
2.1 Preparation process and optimization of PVP-I
Ten grams of polyvinylpyrrolidone K30 (PVP K30, a purity of 95%, was purchased from VMCGROUP Corporation, Vietnam) and 100 ml of distilled water (adjusted with dilute 30% HNO3 or 10% KOH solution to the pH in Table 1) were added to a beaker and stirred at speed (B). While stirring, 1.526 g of potassium iodide was added and stirred until dissolved, followed by the addition of 0.393 g of potassium iodate (a purity of 99% was supplied by Xilong, China). The mixture was gradually heated to temperature (C) and continuously stirred for time (D), after which the reaction stabilized. The solvent was evaporated to dry the material. The preparation process was conducted in an environment with minimal light exposure [14].
Encoded matrix of the factors surveyed for optimization
| Code | Independent factors | Low (−1) | Middle (0) | High (+1) |
|---|---|---|---|---|
| A | pH | 1 | 4 | 7 |
| B | Stirring speed (rpm) | 400 | 800 | 1,200 |
| C | Temperature (°C) | 30 | 40 | 50 |
| D | Time (h) | 1 | 10.5 | 20 |
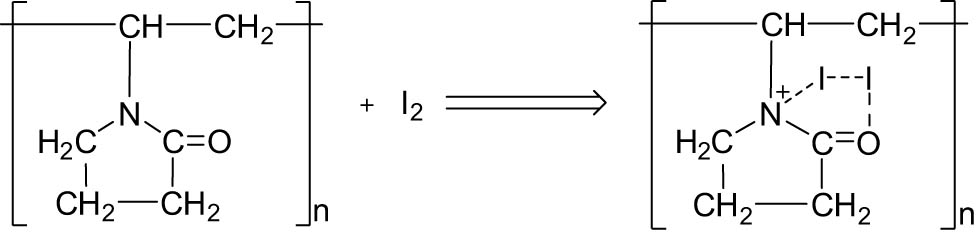
Accordingly, I2 was formed from the reaction of KI and KIO3:
PVP reacted with I2 to form the complex PVP-I:
The presence of PVP-I in the product after preparation was qualitatively assessed using an IRTracer-100 FTIR spectrophotometer (each spectrum, from 4,000 to 400 cm−1, was scanned at the resolution of 4 cm−1) shown in Figure 1. The presence of the peaks at 1639.56 cm⁻¹ (representing the C═O bond of lactam in the pyrrolidone ring), 1494.90–1462.11–1423.53 cm⁻¹ (corresponding to C–N and C–H vibrations of the pyrrolidone ring), 1290.43 cm⁻¹ (C–O vibrations of pyrrolidone), and 414.71 cm⁻¹ (I···N or I3⁻ vibrations, indicating the iodine-polymer bond) indicated the characteristic features of PVP-I. From the selected factors influencing the PVP-I preparation process, an experimental design was carried out, and the preparation conditions were optimized using the RSM. After determining the parameters from the optimization model and deriving the experimental equation, the compatibility of the equation was then tested and evaluated.
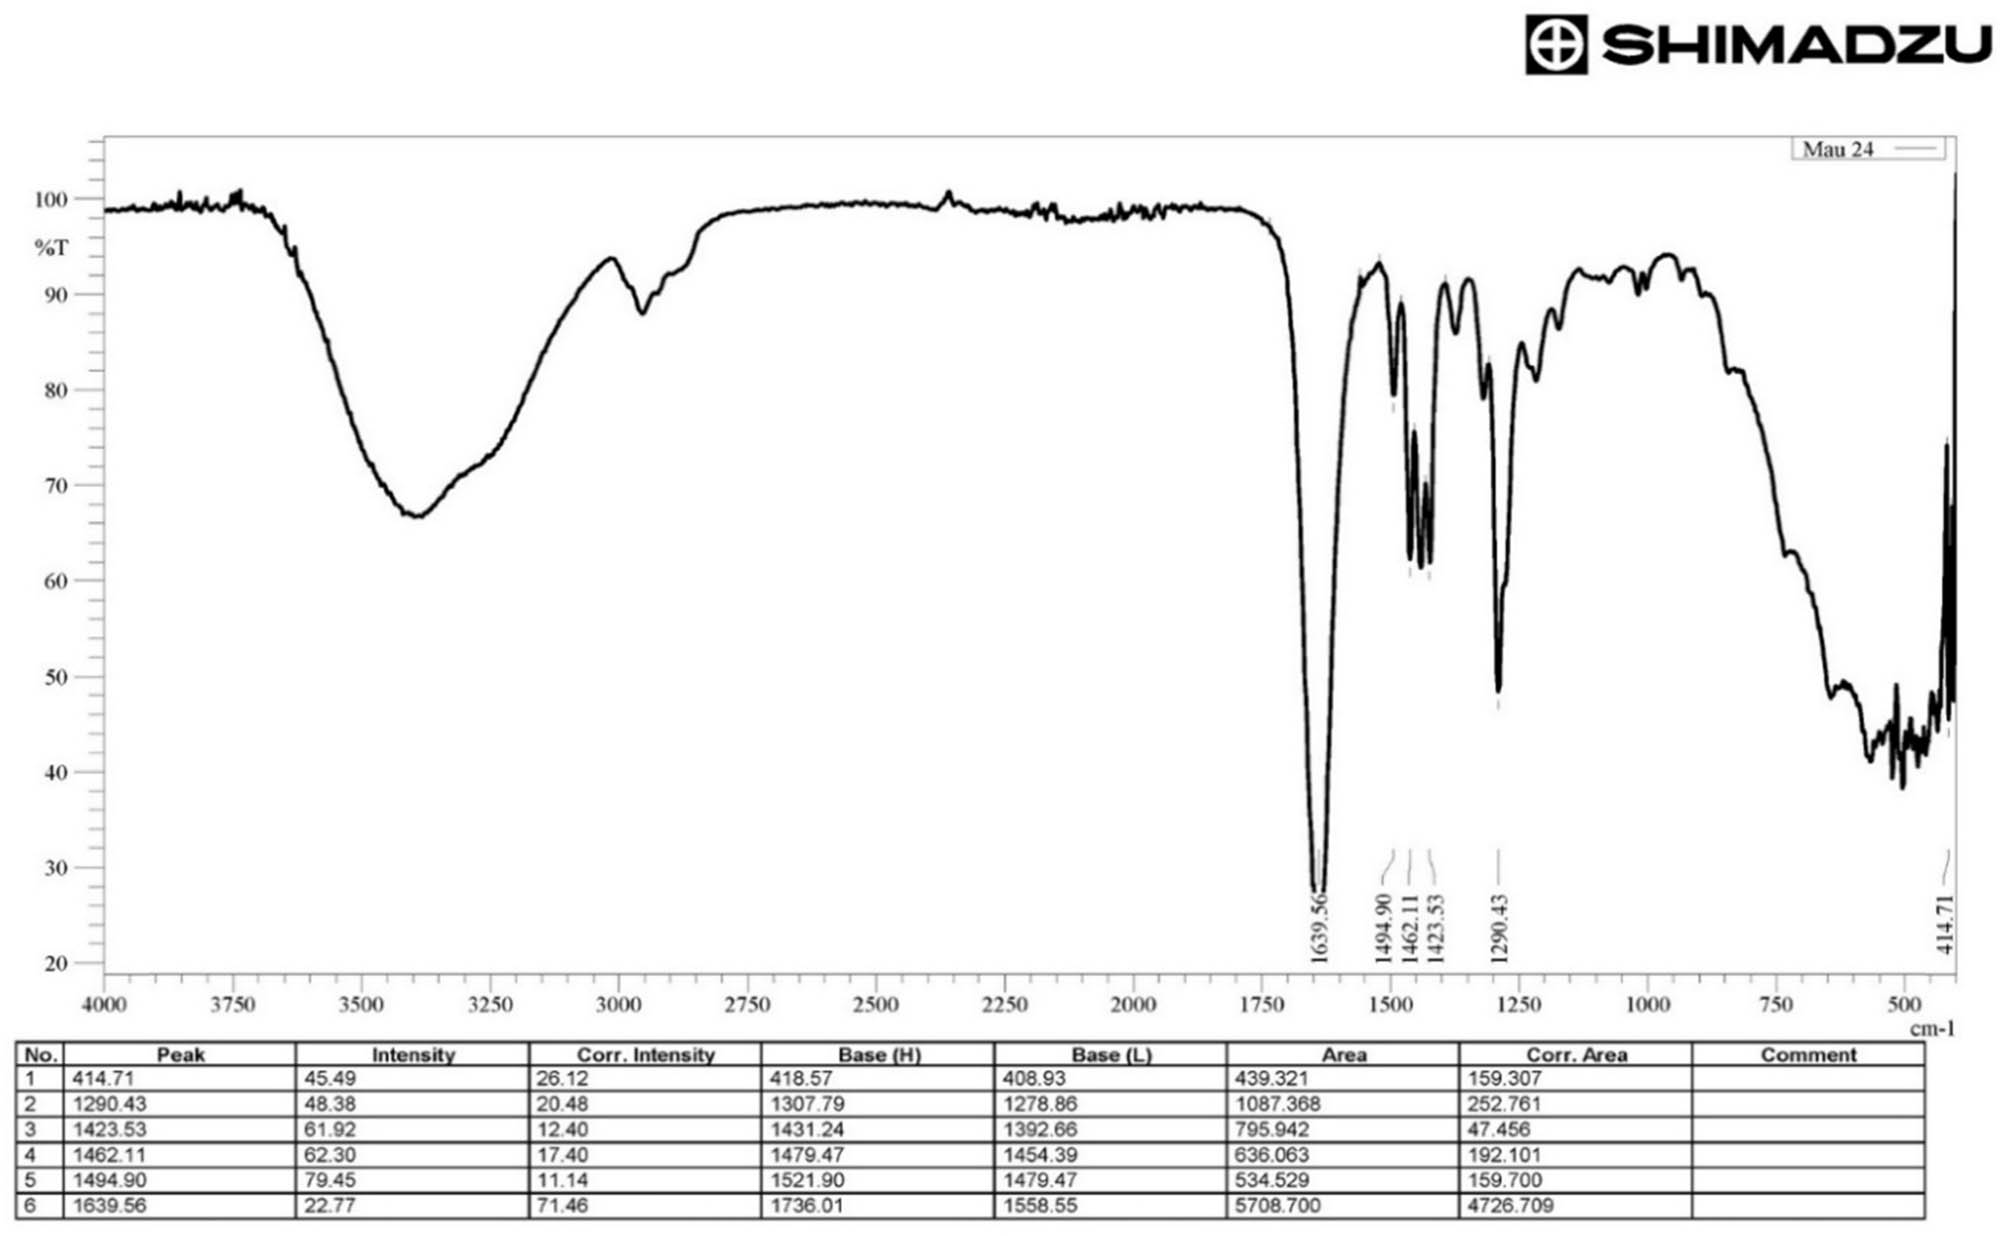
IR spectrum of PVP-I in run 24.
2.2 Box–Behnken and Doehlert (BBD) design
The BBD model was arranged in a polyhedral block close to a spherical shape. The number of experiments to be conducted was N = 2k (k – 1) + n, where N was the actual number of experiments, k was the number of factors studied, and n was the number of center-point experiments conducted in replicates. The three-level factorial design had limited application in RSM when the number of variables exceeded 2 due to the large number of experiments required. The number of experiments performed was calculated using the expression N = 3k, where N is the number of experiments conducted, and k is the number of variables. A complete three-level factorial design with more than two variables required more experimental runs than was typically feasible, so designs with fewer experimental points, such as the Box–Behnken, central composite design (CCD), and Doehlert designs, were more commonly applied. However, for two variables, the effectiveness of the three-level factorial design was comparable to the other designs [6]. A practical and economical alternative to other second-order experimental matrices was developed by Doehlert [6]. This design described a circular domain for two variables, a spherical domain for three variables, and a hyper-spherical domain for more than three variables, emphasizing the homogeneity of the variables studied within the experimental domain. The number of experiments required was calculated using the formula N = k2 + k + n, where k is the number of variables and n is the number of replicates at the center. Each variable was studied at multiple levels, with the distances between levels representing uniform distribution, and the experimental matrix could be shifted to other experimental regions using adjacent points [6].
Sackler et al. identified factors such as pH, temperature, and time in the PVP-I preparation process [14], while Li et al. noted temperature, time, and stirring speed in the preparation of similar formulations [15]. Recognizing these as the four primary factors influencing the PVP-I preparation process, the research team selected four independent factors for their study: pH (A), stirring speed (B), reaction temperature (C), and time (D). The response parameters included yield (Y1), I2 content (Y2), and I content (Y3). Each factor was varied at three levels: −1, 0, and +1, as detailed in Table 1. Accordingly, the experimental domain was set as follows: pH was varied from 1 to 7, reaction temperature from 30 to 50°C, stirring speed from 400 to 1,200 rpm, and reaction time from 1 to 20 h. The number of experiments conducted was calculated as N = k 2 + 2k + 6 (N = 30 with k = 4). Here, N represents the total number of experiments, k is the number of factors investigated, and 2k represents the additional experiments at star points. The distance from the center to the star points was α = 1. Thus, 30 experiments were conducted in this study, with 24 experiments at the vertices of the cube, 6 center-point replicates for error assessment, and 8 additional experiments at star points located α units away from the center (Table 2).
Experimental design for the four factors
| Run | A | B | C | D |
|---|---|---|---|---|
| 1 | 4 | 800 | 30 | 10.5 |
| 2 | 1 | 800 | 40 | 10.5 |
| 3 | 7 | 1,200 | 50 | 1 |
| 4 | 7 | 400 | 30 | 1 |
| 5 | 4 | 1,200 | 40 | 10.5 |
| 6 | 1 | 1,200 | 50 | 1 |
| 7 | 7 | 1,200 | 30 | 1 |
| 8 | 1 | 1,200 | 30 | 20 |
| 9 | 7 | 400 | 30 | 20 |
| 10 | 4 | 800 | 40 | 10.5 |
| 11 | 4 | 800 | 40 | 20 |
| 12 | 1 | 400 | 50 | 1 |
| 13 | 4 | 400 | 40 | 10.5 |
| 14 | 4 | 800 | 40 | 10.5 |
| 15 | 4 | 800 | 40 | 10.5 |
| 16 | 1 | 400 | 30 | 20 |
| 17 | 1 | 1,200 | 30 | 1 |
| 18 | 4 | 800 | 40 | 1 |
| 19 | 7 | 1,200 | 30 | 20 |
| 20 | 4 | 800 | 40 | 10.5 |
| 21 | 1 | 400 | 30 | 1 |
| 22 | 4 | 800 | 50 | 10.5 |
| 23 | 4 | 800 | 40 | 10.5 |
| 24 | 4 | 800 | 40 | 10.5 |
| 25 | 1 | 1,200 | 50 | 20 |
| 26 | 7 | 1,200 | 50 | 20 |
| 27 | 1 | 400 | 50 | 20 |
| 28 | 7 | 400 | 50 | 20 |
| 29 | 7 | 400 | 50 | 1 |
| 30 | 7 | 800 | 40 | 10.5 |
The multiple regression equation demonstrated the dependence and interaction of the factors affecting the objective function, with the estimated results showing the highest yield of the preparation corresponding to the optimal parameters.
2.3 Quantitative analysis of mass loss due to drying
A porcelain beaker with a wide mouth was used as the sample container; the beaker was dried for 30 min at 105°C, then placed in a desiccator containing activated silica gel to cool, and weighed to determine the mass of the beaker. An accurate amount of 0.500 g of the sample, with a tolerance of ±10%, was immediately weighed into the beaker. The sample was spread out in a layer not exceeding 5 mm in thickness. If the sample was large, it was ground quickly to a size of less than 2 mm before weighing. Drying was carried out at 105°C for 3 h, with an allowable temperature deviation of ±2°C from the specified temperature. After drying, the sample was cooled to room temperature in the desiccator and then weighed [16].
2.4 Quantitative analysis of yield
The yield of the reaction was calculated by comparing the actual amount of product obtained with the theoretical amount predicted. The yield was expressed using the following formula:
where Y1 is the yield of the reaction (%); m tt is the actual mass of the prepared product (g); m lt is the theoretical mass of the product calculated from the equation (g), and was calculated based on the number of moles of the KIO3 reaction, which has been inferred from (1) and (2); and X is the moisture content of the product (%).
2.5 Determination of I2 and I contents
2.5.1 Sample preparation
About 1.000 g of the product was transferred into a conical flask containing 150 ml of water and stirred for 1 h. Then, 0.1 ml of dilute acetic acid solution was added and quickly titrated with 0.1 N sodium thiosulfate solution. The endpoint was determined using the volumetric titration method. Titration was continued until the solution turned a pale yellow, at which point starch solution was used as an indicator, causing the solution to turn blue-purple due to iodine adsorption by starch. Titration was continued until the solution was decolorized or turned a faintly opaque white due to starch, at which point the volume used was recorded [16]. (convention: 1 ml of 0.1 N sodium thiosulfate solution is equivalent to 12.69 mg of iodine). The I2 content was calculated using the following formula:
where
2.5.2 Preparation of the sample for I-content quantification
For the sample preparation, 0.500 g of the product was dissolved in 100 ml of water. Sodium metabisulfite was added until the iodine color disappeared. Exactly 25.0 ml of 0.1 N silver nitrate solution, 10 ml of nitric acid, and 5 ml of 10% ferric ammonium sulfate solution were added. The solution was then titrated with 0.1 N ammonium thiocyanate solution until a stable pink-orange color appeared [16]. The blank sample was prepared similarly to the test sample: 5 ml of the product was replaced with 5 ml of a PVP solution dissolved in water. (convention: 1 ml of 0.1 N silver nitrate solution is equivalent to 12.69 mg of total iodine). The percentage of iodide was determined using equations (6)–(8):
where
2.6 Analysis of data
The impact of important independent variables on each dependent variable was analyzed using analysis of variance (ANOVA). All experiments were performed in triplicate to ensure the ANOVA was conducted. Parameters were evaluated, including the p-value, adjusted R 2, and adequate precision. Based on this, the software provided the regression equations for the dependent variables. The optimal experiment was selected as the one with the highest desirability index provided by the Design Expert software.
3 Results and discussion
3.1 I. Model and model adequacy
The experimental results of 30 experiments and those predicted by Design Expert 11 are presented in Tables 3–5. Accordingly, the highest yield (Y1) achieved was 99.23% (run 15), and the lowest was 87.37% (run 17). The highest I2 content achieved was 11.01% (run 10), and the lowest was 6.69% (run 3). The highest I content was 6.65% (run 26), and the lowest was 1.87% (run 10).
Experimental and predicted values of 30 runs for Y1
| Run | A | B (rpm) | C (°C) | D (h) | Yield (%) | ||
|---|---|---|---|---|---|---|---|
| Actual | Predicted | Residual | |||||
| 1 | 4 | 800 | 30 | 10.5 | 98.30 | 99.16 | −0.8639 |
| 2 | 1 | 800 | 40 | 10.5 | 93.89 | 94.91 | −1.02 |
| 3 | 7 | 1,200 | 50 | 1 | 90.13 | 89.08 | 1.05 |
| 4 | 7 | 400 | 30 | 1 | 95.91 | 95.63 | 0.2831 |
| 5 | 4 | 1,200 | 40 | 10.5 | 90.12 | 91.62 | −1.50 |
| 6 | 1 | 1,200 | 50 | 1 | 90.04 | 90.55 | −0.5079 |
| 7 | 7 | 1,200 | 30 | 1 | 91.02 | 91.30 | −0.2829 |
| 8 | 1 | 1,200 | 30 | 20 | 89.97 | 88.81 | 1.16 |
| 9 | 7 | 400 | 30 | 20 | 98.22 | 97.30 | 0.9155 |
| 10 | 4 | 800 | 40 | 10.5 | 99.14 | 98.00 | 1.14 |
| 11 | 4 | 800 | 40 | 20 | 98.76 | 98.88 | −0.1250 |
| 12 | 1 | 400 | 50 | 1 | 90.89 | 90.30 | 0.5881 |
| 13 | 4 | 400 | 40 | 10.5 | 93.01 | 92.68 | 0.3306 |
| 14 | 4 | 800 | 40 | 10.5 | 97.88 | 98.00 | −0.1178 |
| 15 | 4 | 800 | 40 | 10.5 | 99.23 | 98.00 | 1.23 |
| 16 | 1 | 400 | 30 | 20 | 87.94 | 89.11 | −1.17 |
| 17 | 1 | 1,200 | 30 | 1 | 87.37 | 86.65 | 0.7192 |
| 18 | 4 | 800 | 40 | 1 | 95.40 | 96.45 | −1.05 |
| 19 | 7 | 1,200 | 30 | 20 | 94.24 | 94.94 | −0.7030 |
| 20 | 4 | 800 | 40 | 10.5 | 98.35 | 98.00 | 0.3522 |
| 21 | 1 | 400 | 30 | 1 | 88.85 | 88.91 | −0.0573 |
| 22 | 4 | 800 | 50 | 10.5 | 98.96 | 99.27 | −0.3072 |
| 23 | 4 | 800 | 40 | 10.5 | 98.93 | 98.00 | 0.9322 |
| 24 | 4 | 800 | 40 | 10.5 | 97.97 | 98.00 | −0.0278 |
| 25 | 1 | 1,200 | 50 | 20 | 93.35 | 93.75 | −0.3980 |
| 26 | 7 | 1,200 | 50 | 20 | 94.22 | 93.76 | 0.4649 |
| 27 | 1 | 400 | 50 | 20 | 92.23 | 91.54 | 0.6905 |
| 28 | 7 | 400 | 50 | 20 | 92.78 | 93.61 | −0.8341 |
| 29 | 7 | 400 | 50 | 1 | 90.15 | 90.90 | −0.7490 |
| 30 | 7 | 800 | 40 | 10.5 | 98.13 | 98.28 | −0.1472 |
Bold values represent the minimum and maximum values of the objective functions Yield, I2, and I.
Experimental and predicted values of 30 runs for I2 content
| Run | A | B (rpm) | C (°C) | D (h) | I2 content (%) | ||
|---|---|---|---|---|---|---|---|
| Actual | Predicted | Residual | |||||
| 1 | 4 | 800 | 30 | 10.5 | 9.44 | 9.68 | −0.2481 |
| 2 | 1 | 800 | 40 | 10.5 | 9.31 | 9.46 | −0.1493 |
| 3 | 7 | 1,200 | 50 | 1 | 6.69 | 6.60 | 0.0844 |
| 4 | 7 | 400 | 30 | 1 | 8.85 | 8.50 | 0.3507 |
| 5 | 4 | 1,200 | 40 | 10.5 | 9.58 | 9.33 | 0.2532 |
| 6 | 1 | 1,200 | 50 | 1 | 7.67 | 8.04 | −0.3741 |
| 7 | 7 | 1,200 | 30 | 1 | 7.87 | 8.11 | −0.2419 |
| 8 | 1 | 1,200 | 30 | 20 | 8.34 | 8.16 | 0.1774 |
| 9 | 7 | 400 | 30 | 20 | 8.37 | 7.99 | 0.3879 |
| 10 | 4 | 800 | 40 | 10.5 | 11.01 | 10.11 | 0.9013 |
| 11 | 4 | 800 | 40 | 20 | 9.81 | 9.69 | 0.1207 |
| 12 | 1 | 400 | 50 | 1 | 8.84 | 8.40 | 0.4335 |
| 13 | 4 | 400 | 40 | 10.5 | 9.34 | 9.65 | −0.3117 |
| 14 | 4 | 800 | 40 | 10.5 | 10.00 | 10.11 | −0.1073 |
| 15 | 4 | 800 | 40 | 10.5 | 10.55 | 10.11 | 0.4359 |
| 16 | 1 | 400 | 30 | 20 | 7.13 | 7.21 | −0.0835 |
| 17 | 1 | 1,200 | 30 | 1 | 8.69 | 8.21 | 0.4801 |
| 18 | 4 | 800 | 40 | 1 | 9.67 | 9.85 | −0.1793 |
| 19 | 7 | 1,200 | 30 | 20 | 7.27 | 7.70 | −0.4327 |
| 20 | 4 | 800 | 40 | 10.5 | 9.54 | 10.11 | −0.5730 |
| 21 | 1 | 400 | 30 | 1 | 6.96 | 7.35 | −0.3898 |
| 22 | 4 | 800 | 50 | 10.5 | 9.77 | 9.58 | 0.1896 |
| 23 | 4 | 800 | 40 | 10.5 | 9.92 | 10.11 | −0.1950 |
| 24 | 4 | 800 | 40 | 10.5 | 9.82 | 10.11 | −0.2863 |
| 25 | 1 | 1,200 | 50 | 20 | 7.89 | 8.24 | −0.3499 |
| 26 | 7 | 1,200 | 50 | 20 | 6.84 | 6.43 | 0.4036 |
| 27 | 1 | 400 | 50 | 20 | 8.76 | 8.51 | 0.2557 |
| 28 | 7 | 400 | 50 | 20 | 7.45 | 7.93 | −0.4792 |
| 29 | 7 | 400 | 50 | 1 | 8.03 | 8.20 | −0.1636 |
| 30 | 7 | 800 | 40 | 10.5 | 9.22 | 9.12 | 0.0908 |
Bold values represent the minimum and maximum values of the objective functions Yield, I2, and I.
Experimental and predicted values of 30 runs for I content
| Run | A | B (rpm) | C (°C) | D (h) | I content (%) | ||
|---|---|---|---|---|---|---|---|
| Actual | Predicted | Residual | |||||
| 1 | 4 | 800 | 30 | 10.5 | 5.15 | 4.69 | 0.4693 |
| 2 | 1 | 800 | 40 | 10.5 | 4.30 | 3.41 | 0.8910 |
| 3 | 7 | 1,200 | 50 | 1 | 6.55 | 6.74 | −0.1960 |
| 4 | 7 | 400 | 30 | 1 | 5.80 | 5.72 | 0.0745 |
| 5 | 4 | 1,200 | 40 | 10.5 | 5.32 | 4.69 | 0.6347 |
| 6 | 1 | 1,200 | 50 | 1 | 6.32 | 6.19 | 0.1330 |
| 7 | 7 | 1,200 | 30 | 1 | 6.32 | 6.21 | 0.1086 |
| 8 | 1 | 1,200 | 30 | 20 | 6.13 | 6.19 | −0.0606 |
| 9 | 7 | 400 | 30 | 20 | 4.99 | 5.36 | −0.3710 |
| 10 | 4 | 800 | 40 | 10.5 | 1.87 | 3.70 | −1.82 |
| 11 | 4 | 800 | 40 | 20 | 5.28 | 4.55 | 0.7312 |
| 12 | 1 | 400 | 50 | 1 | 6.00 | 6.16 | −0.1607 |
| 13 | 4 | 400 | 40 | 10.5 | 4.98 | 4.28 | 0.7005 |
| 14 | 4 | 800 | 40 | 10.5 | 3.34 | 3.70 | −0.3576 |
| 15 | 4 | 800 | 40 | 10.5 | 1.92 | 3.70 | −1.77 |
| 16 | 1 | 400 | 30 | 20 | 6.22 | 6.12 | 0.1002 |
| 17 | 1 | 1,200 | 30 | 1 | 5.54 | 5.87 | −0.3312 |
| 18 | 4 | 800 | 40 | 1 | 5.09 | 4.49 | 0.6039 |
| 19 | 7 | 1,200 | 30 | 20 | 6.21 | 6.15 | 0.0649 |
| 20 | 4 | 800 | 40 | 10.5 | 2.85 | 3.70 | −0.8428 |
| 21 | 1 | 400 | 30 | 1 | 6.03 | 6.09 | −0.0548 |
| 22 | 4 | 800 | 50 | 10.5 | 5.93 | 5.07 | 0.8659 |
| 23 | 4 | 800 | 40 | 10.5 | 4.05 | 3.70 | 0.3530 |
| 24 | 4 | 800 | 40 | 10.5 | 4.13 | 3.70 | 0.4381 |
| 25 | 1 | 1,200 | 50 | 20 | 6.51 | 6.68 | −0.1703 |
| 26 | 7 | 1,200 | 50 | 20 | 6.65 | 6.84 | −0.1832 |
| 27 | 1 | 400 | 50 | 20 | 6.01 | 6.36 | −0.3466 |
| 28 | 7 | 400 | 50 | 20 | 6.04 | 5.80 | 0.2354 |
| 29 | 7 | 400 | 50 | 1 | 5.82 | 6.00 | −0.1775 |
| 30 | 7 | 800 | 40 | 10.5 | 3.75 | 3.31 | 0.4442 |
Bold values represent the minimum and maximum values of the objective functions Yield, I2, and I.
3.1.1 Objective function 1: Y1
To determine the significance of each coefficient, the F- and p-values were calculated using the ANOVA data processing software. Table 6 presents the ANOVA results of the model along with the statistical values for each factor. The model had an F-value of 25.60, indicating that the RSM design model was statistically significant. With a p-value <0.0001, it was shown that there was only a 0.01% chance that the F-value could occur due to noise. A p-value <0.05 indicated that a factor had a statistically significant effect on the model's results. If a model had many factors with p-values of >0.1000, it could reduce the accuracy. When designing, factors with p-values >0.10 needed to be removed to improve the statistical significance of the model. In this model, factors A, D, AC, BC, and B 2 had p-values <0.05, indicating that changes in these factors would have a statistically significant impact on the yield (Y1) of the PVP-I. The calculated regression coefficient (R 2) was 0.9598 (Table 7), showing that 95.98% of the experimental data were consistent with the predicted data according to the model. According to Castillo (2007), an R 2 value of >0.75 indicated that the model was compatible with the experimental data. Additionally, the RSM model had adequate precision (AP) of 16.4027. The AP value was used to guide the design space; if this value was greater than 4.0, the model could be used. The coefficient of variation (CV%) was a statistical measure of the dispersion of data in a dataset relative to the mean value. The CV% value of Y1 for the PVP-I yield in 30 runs was 1.15%.
ANOVA for objective function regression model 1
| Factors | Sum of squares | Mean of squares | F value | p value |
|---|---|---|---|---|
| Model | 424.00 | 30.29 | 25.60 | <0.0001* |
| A – pH | 50.90 | 50.90 | 43.02 | <0.0001* |
| B – stirring speed | 5.04 | 5.04 | 4.26 | 0.0569 |
| C – temperature | 0.0480 | 0.0480 | 0.0406 | 0.8430 |
| D – time | 26.77 | 26.77 | 22.62 | 0.0003* |
| AB | 4.27 | 4.27 | 3.61 | 0.0767 |
| AC | 37.49 | 37.49 | 31.68 | <0.0001* |
| AD | 2.18 | 2.18 | 1.84 | 0.1945 |
| BC | 6.26 | 6.26 | 5.29 | 0.0362* |
| BD | 3.85 | 3.85 | 3.25 | 0.0913 |
| CD | 1.08 | 1.08 | 0.9097 | 0.3553 |
| A 2 | 5.09 | 5.09 | 4.31 | 0.0556 |
| B 2 | 88.58 | 88.58 | 74.87 | <0.0001* |
| C 2 | 3.84 | 3.84 | 3.25 | 0.0917 |
| D 2 | 0.2861 | 0.2861 | 0.2418 | 0.6301 |
| Residual | 17.75 | 1.18 |
*Represents factors with statistically significant p-values.
Fit statistic predictions for a model of yield and PVP-I content under extracted conditions
| STT | Objective | Std. Dev. | Mean | CV % | R 2 | Adjusted R 2 | Adequate precision |
|---|---|---|---|---|---|---|---|
| 1 | Yield (%) | 1.09 | 94.18 | 1.15 | 0.9598 | 0.9223 | 16.4027 |
| 2 | I2 (%) | 0.4954 | 8.75 | 5.66 | 0.9063 | 0.8188 | 10.5034 |
| 3 | I (%) | 0.8950 | 5.17 | 17.31 | 0.7663 | 0.5482 | 5.5746 |
3.1.2 Objective function 2: I2 content (%)
The model had an F-value of 10.36, indicating that the RSM design model was statistically significant. With a p-value < 0.0001, it was shown that there was only a 0.01% chance that the F-value could occur due to noise. A p-value <0.05 indicated that the factor had a statistically significant effect on the model's results. In this model, factors AB, AC, BC, and A 2 had p-values <0.05, meaning that changes in these factors would have a statistically significant impact on the I2 content. The calculated R 2 was 0.9063, showing that 90.63% of the experimental data was consistent with the predicted data according to the model. Additionally, the RSM model had an AP of 10.5304. The CV% value of the I2 content was 5.66% (Table 8).
ANOVA for objective function regression model 2
| Factors | Sum of squares | Mean of squares | F value | p value |
|---|---|---|---|---|
| Model | 35.59 | 2.54 | 10.36 | <0.0001* |
| A – pH | 0.4981 | 0.4981 | 2.03 | 0.1747 |
| B – stirring speed | 0.4684 | 0.4684 | 1.91 | 0.1873 |
| C – temperature | 0.0526 | 0.0526 | 0.2145 | 0.6499 |
| D – time | 0.1095 | 0.1095 | 0.4461 | 0.5143 |
| AB | 1.53 | 1.53 | 6.22 | 0.0248* |
| AC | 1.82 | 1.82 | 7.44 | 0.0156* |
| AD | 0.1360 | 0.1360 | 0.5542 | 0.4681 |
| BC | 1.47 | 1.47 | 5.99 | 0.0272* |
| BD | 0.0092 | 0.0092 | 0.0374 | 0.8492 |
| CD | 0.0603 | 0.0603 | 0.2459 | 0.6272 |
| A 2 | 1.74 | 1.74 | 7.11 | 0.0176* |
| B 2 | 0.9924 | 0.9924 | 4.04 | 0.0627 |
| C 2 | 0.6010 | 0.6010 | 2.45 | 0.1384 |
| D 2 | 0.3029 | 0.3029 | 1.23 | 0.2840 |
| Residual | 3.68 | 0.2454 |
*Represents factors with statistically significant p-values.
3.1.3 Objective function 3: I content (%)
The F-value was 3.51, indicating that the RSM design model was statistically significant. With a p-value of 0.0107, it was shown that there was only a 1.07% chance that the F-value could occur due to noise (Table 9). A p-value <0.05 indicated that the factor had a statistically significant impact on the model’s results. In this model, no factor had a statistically significant effect on the I content. The calculated R 2 was 0.7663, showing that 76.63% of the experimental data were consistent with the predicted data according to the model; the AP value reached 5.5746, and the CV% was 17.31%. Additionally, other factors were used to assess whether the model fitted well with the experimental results based on the predicted and actual value plots and residuals versus runs models. Data shown in Figure 2 also indicated that the model had a good correlation, as the points were concentrated along a straight line and the distribution of the experimental points was random.
ANOVA for objective function regression model 3
| Factors | Sum of squares | Mean of squares | F value | p value |
|---|---|---|---|---|
| Model | 39.39 | 2.81 | 3.51 | 0.0107* |
| A – pH | 0.0483 | 0.0483 | 0.0602 | 0.8094 |
| B – stirring speed | 0.7466 | 0.7466 | 0.9321 | 0.3496 |
| C – temperature | 0.6525 | 0.6525 | 0.8146 | 0.3810 |
| D – time | 0.0195 | 0.0195 | 0.0244 | 0.8780 |
| AB | 0.5104 | 0.5104 | 0.6372 | 0.4372 |
| AC | 0.0422 | 0.0422 | 0.0527 | 0.8216 |
| AD | 0.1550 | 0.1550 | 0.1935 | 0.6663 |
| BC | 0.0642 | 0.0642 | 0.0802 | 0.7810 |
| BD | 0.0826 | 0.0826 | 0.1031 | 0.7525 |
| CD | 0.0269 | 0.0269 | 0.0336 | 0.8571 |
| A 2 | 0.2896 | 0.2896 | 0.3615 | 0.5566 |
| B 2 | 1.61 | 1.61 | 2.02 | 0.1761 |
| C 2 | 3.61 | 3.61 | 4.50 | 0.0509 |
| D 2 | 1.76 | 1.76 | 2.20 | 0.1591 |
| Residual | 12.01 | 0.8009 |
*Factors with statistically significant p-values.
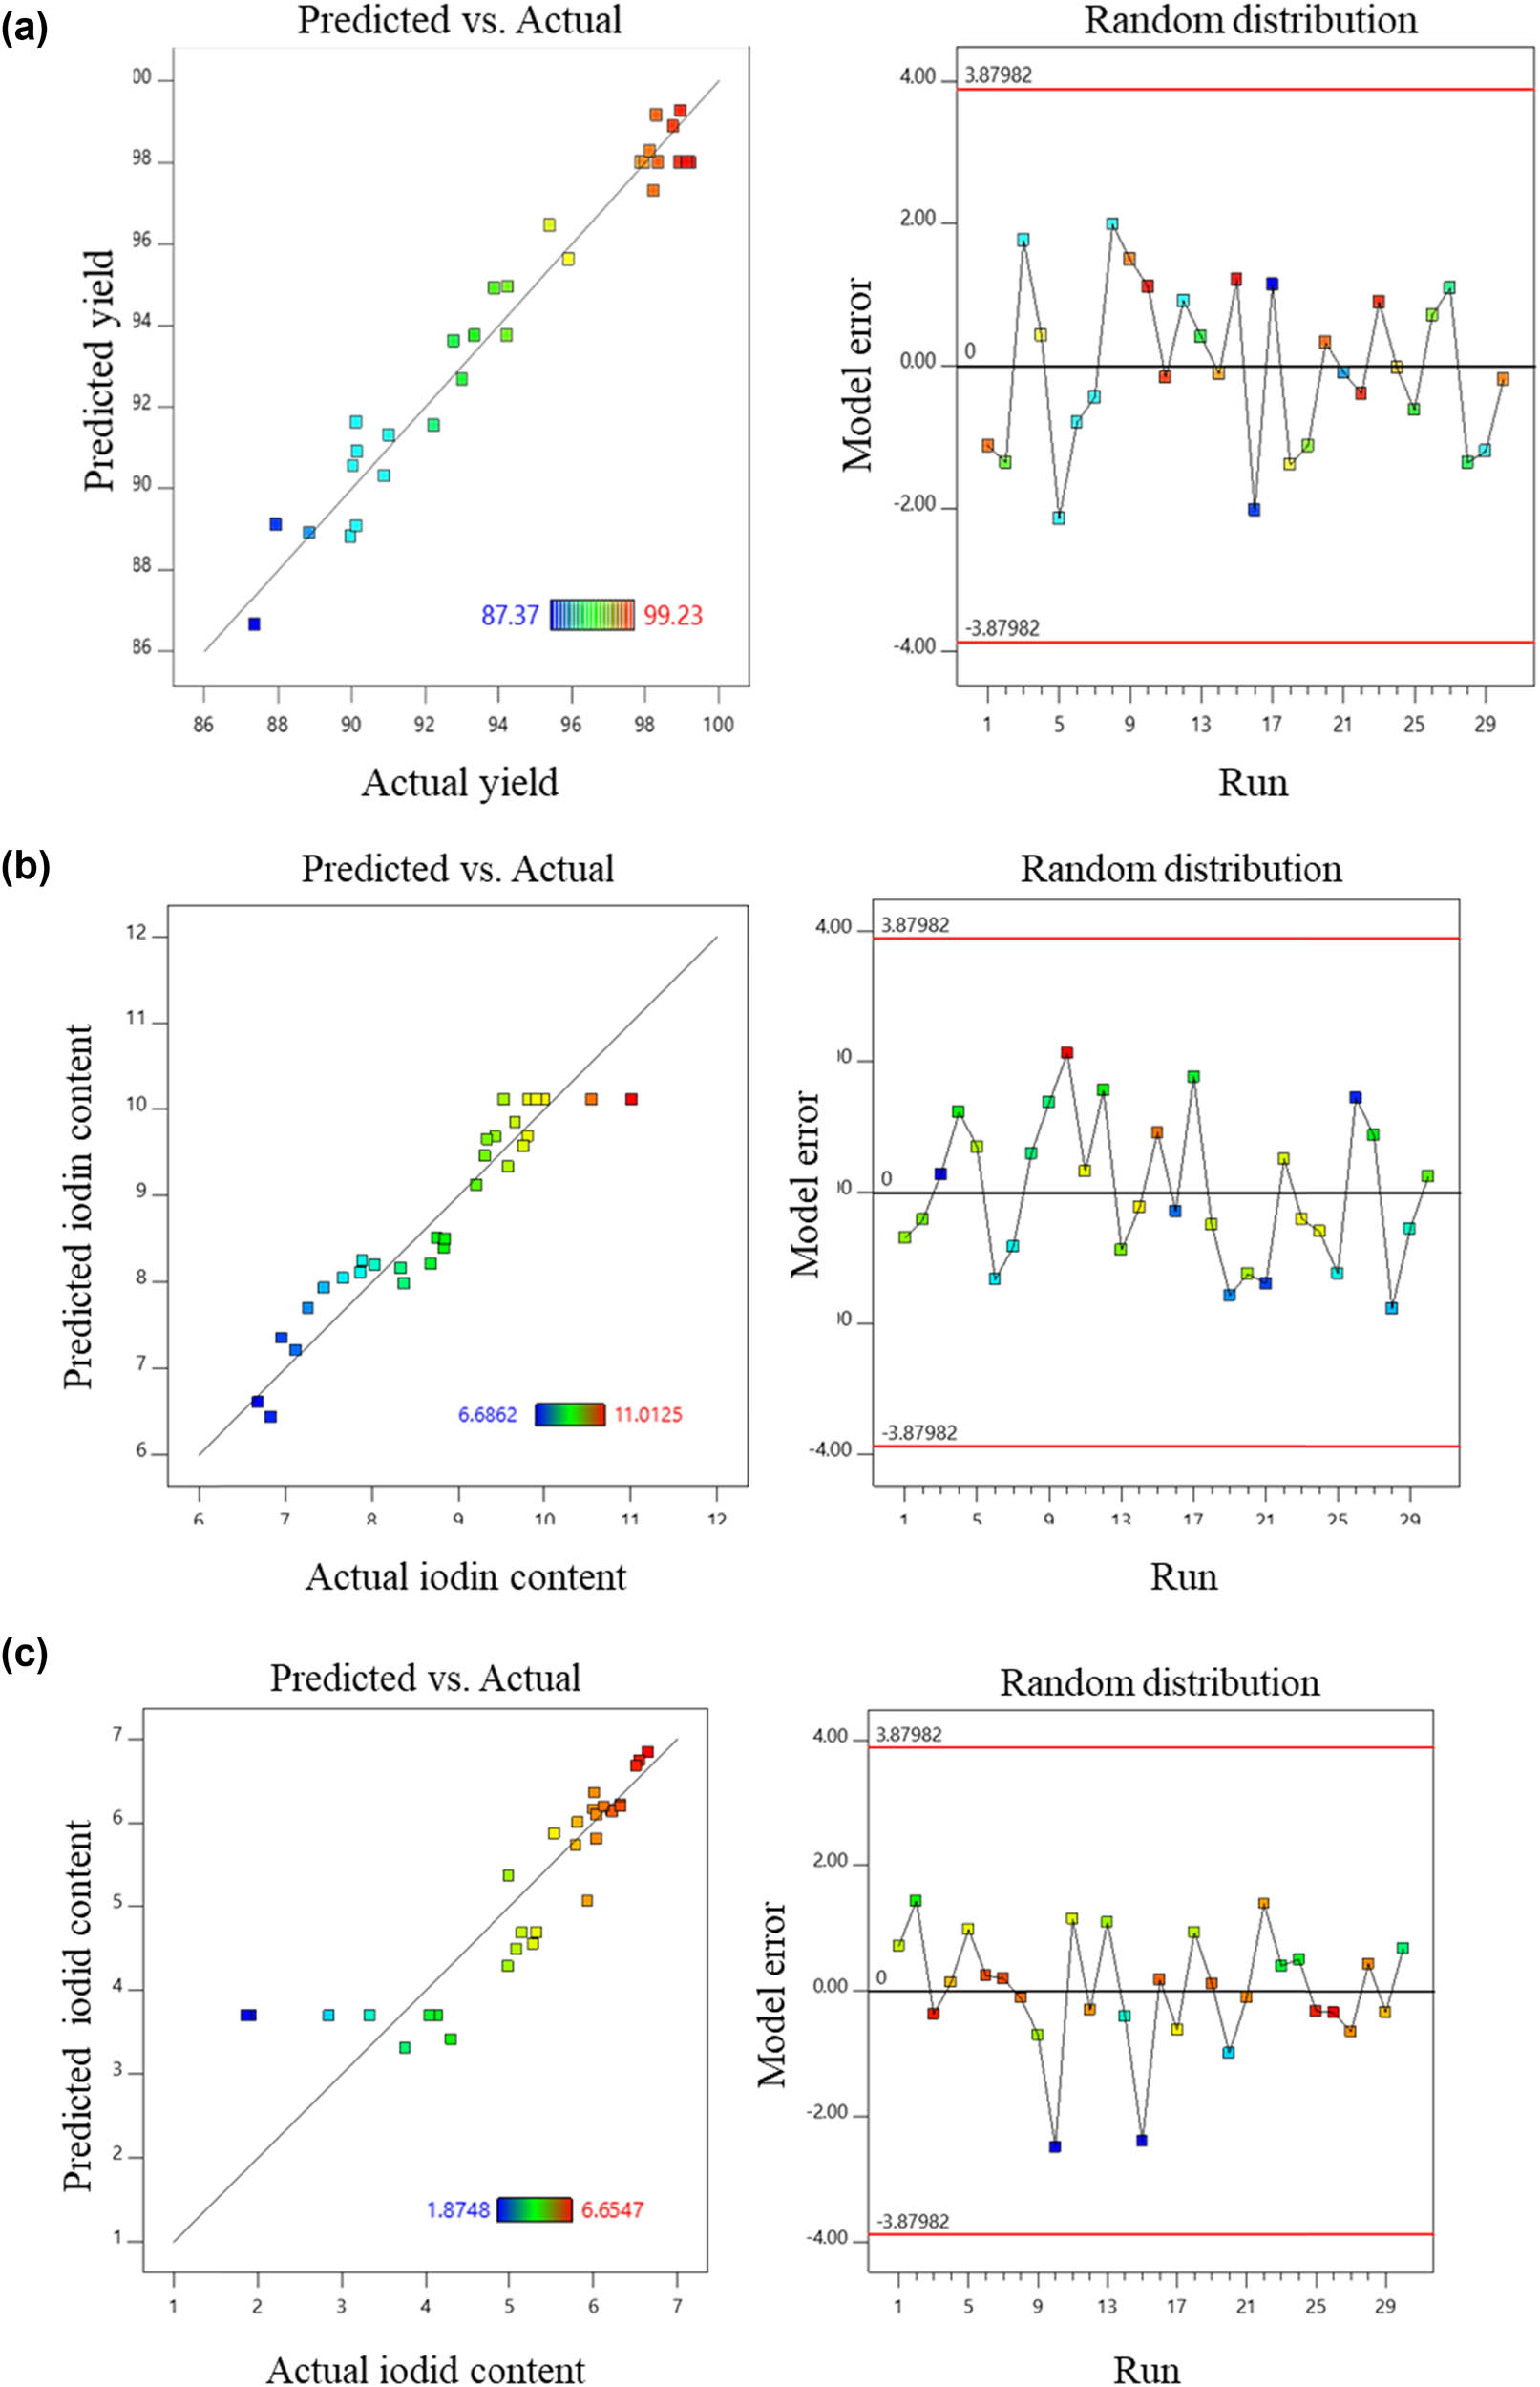
Predicted and actual plot (left). Studentized residuals versus Run number (right) of (a) yield (%), (b) I2 content (%), and (c) I content (%).
3.2 Optimization of parameters
3.2.1 Objective function 1
The relationship between Y1 and the independent variables A, B, C, and D from Design Expert 11 was expressed in the final equation in terms of actual factors as follows:
where A represents the pH, B represents the stirring speed (rpm), C represents the temperature (°C), and D represents the time (h).
When the influence level was positive, a positive correlation between the investigated factors and Y1 was observed, and vice versa. The above equation indicates the factors that positively correlated with Y1, including (A), (C), (D), the pair (AD), the pair (BC), the pair (BD), the pair (CD), and (C 2). Increasing the values of these eight factors led to an increase in Y1 obtained from the PVP-I preparation process. Conversely, increasing the values of (B), (AB), (AC), (A 2), (B 2), and (D 2) resulted in a tendency for Y1 to decrease. The effects of the factors on the PVP-I preparation process were described using six two-dimensional and three-dimensional response surface plots: the red area indicated the highest Y1, while the blue area indicated lower results (Figure 3). Figure 3a shows the interaction between the pH and stirring speed on Y1. Based on the color scale variation in the plot, it was observed that changing the values of these two factors led to changes in Y1. First, the impact of pH on Y1 was considered. At a stirring speed of 800 rpm, as pH increased from 1 to 7, Y1 tended to increase from the blue region to the red region. Specifically, using a pH greater than 4 for PVP-I preparation at a stirring speed of 800 rpm resulted in Y1 greater than 90%. However, within the same pH range, increasing or decreasing the stirring speed led to a decrease in Y1. The interaction between the pH and temperature on Y1 is illustrated in Figure 3b. At a pH of 4, increasing the temperature from 40 to 50°C resulted in a noticeable increase in Y1 from about 90–99%. The relationship of the pair (AD) affecting Y1 is shown in Figure 3c. When preparing PVP-I at pH 4, time had a positive interaction with Y1. As the time increased, Y1 also increased. At a time of 10.5 h, increasing pH from 4 to 7 also increased Y1. The interaction of (BC) is represented in Figure 3d. When the experiment was conducted at 800 rpm, increasing the temperature from 30 to 50°C showed that temperature change had a negligible effect on Y1. However, increasing or decreasing the stirring speed resulted in changes in Y1. Additionally, the effect of (BD) is illustrated in Figure 3e. At 800 rpm, increasing the reaction time from 1 to 5 h resulted in a significant increase in Y1 from about 90% to >99%. However, increasing or decreasing the stirring speed resulted in a decrease in Y1, as indicated by the color change from dark red (around 600 to 1,000 rpm) to blue-yellow (around 400 to 600 rpm and 1,000 to 1,200 rpm). Figure 3f shows the correlation between (C) and (D). As the time increased from 1 to 20 h, Y1 increased, but within the same time frame, changes in temperature had no significant effect on Y1. The pH variation from 1 to 4 positively influenced the free iodine content; however, exceeding pH 7 resulted in a decrease in this content, as reported by Percival et al. [17].
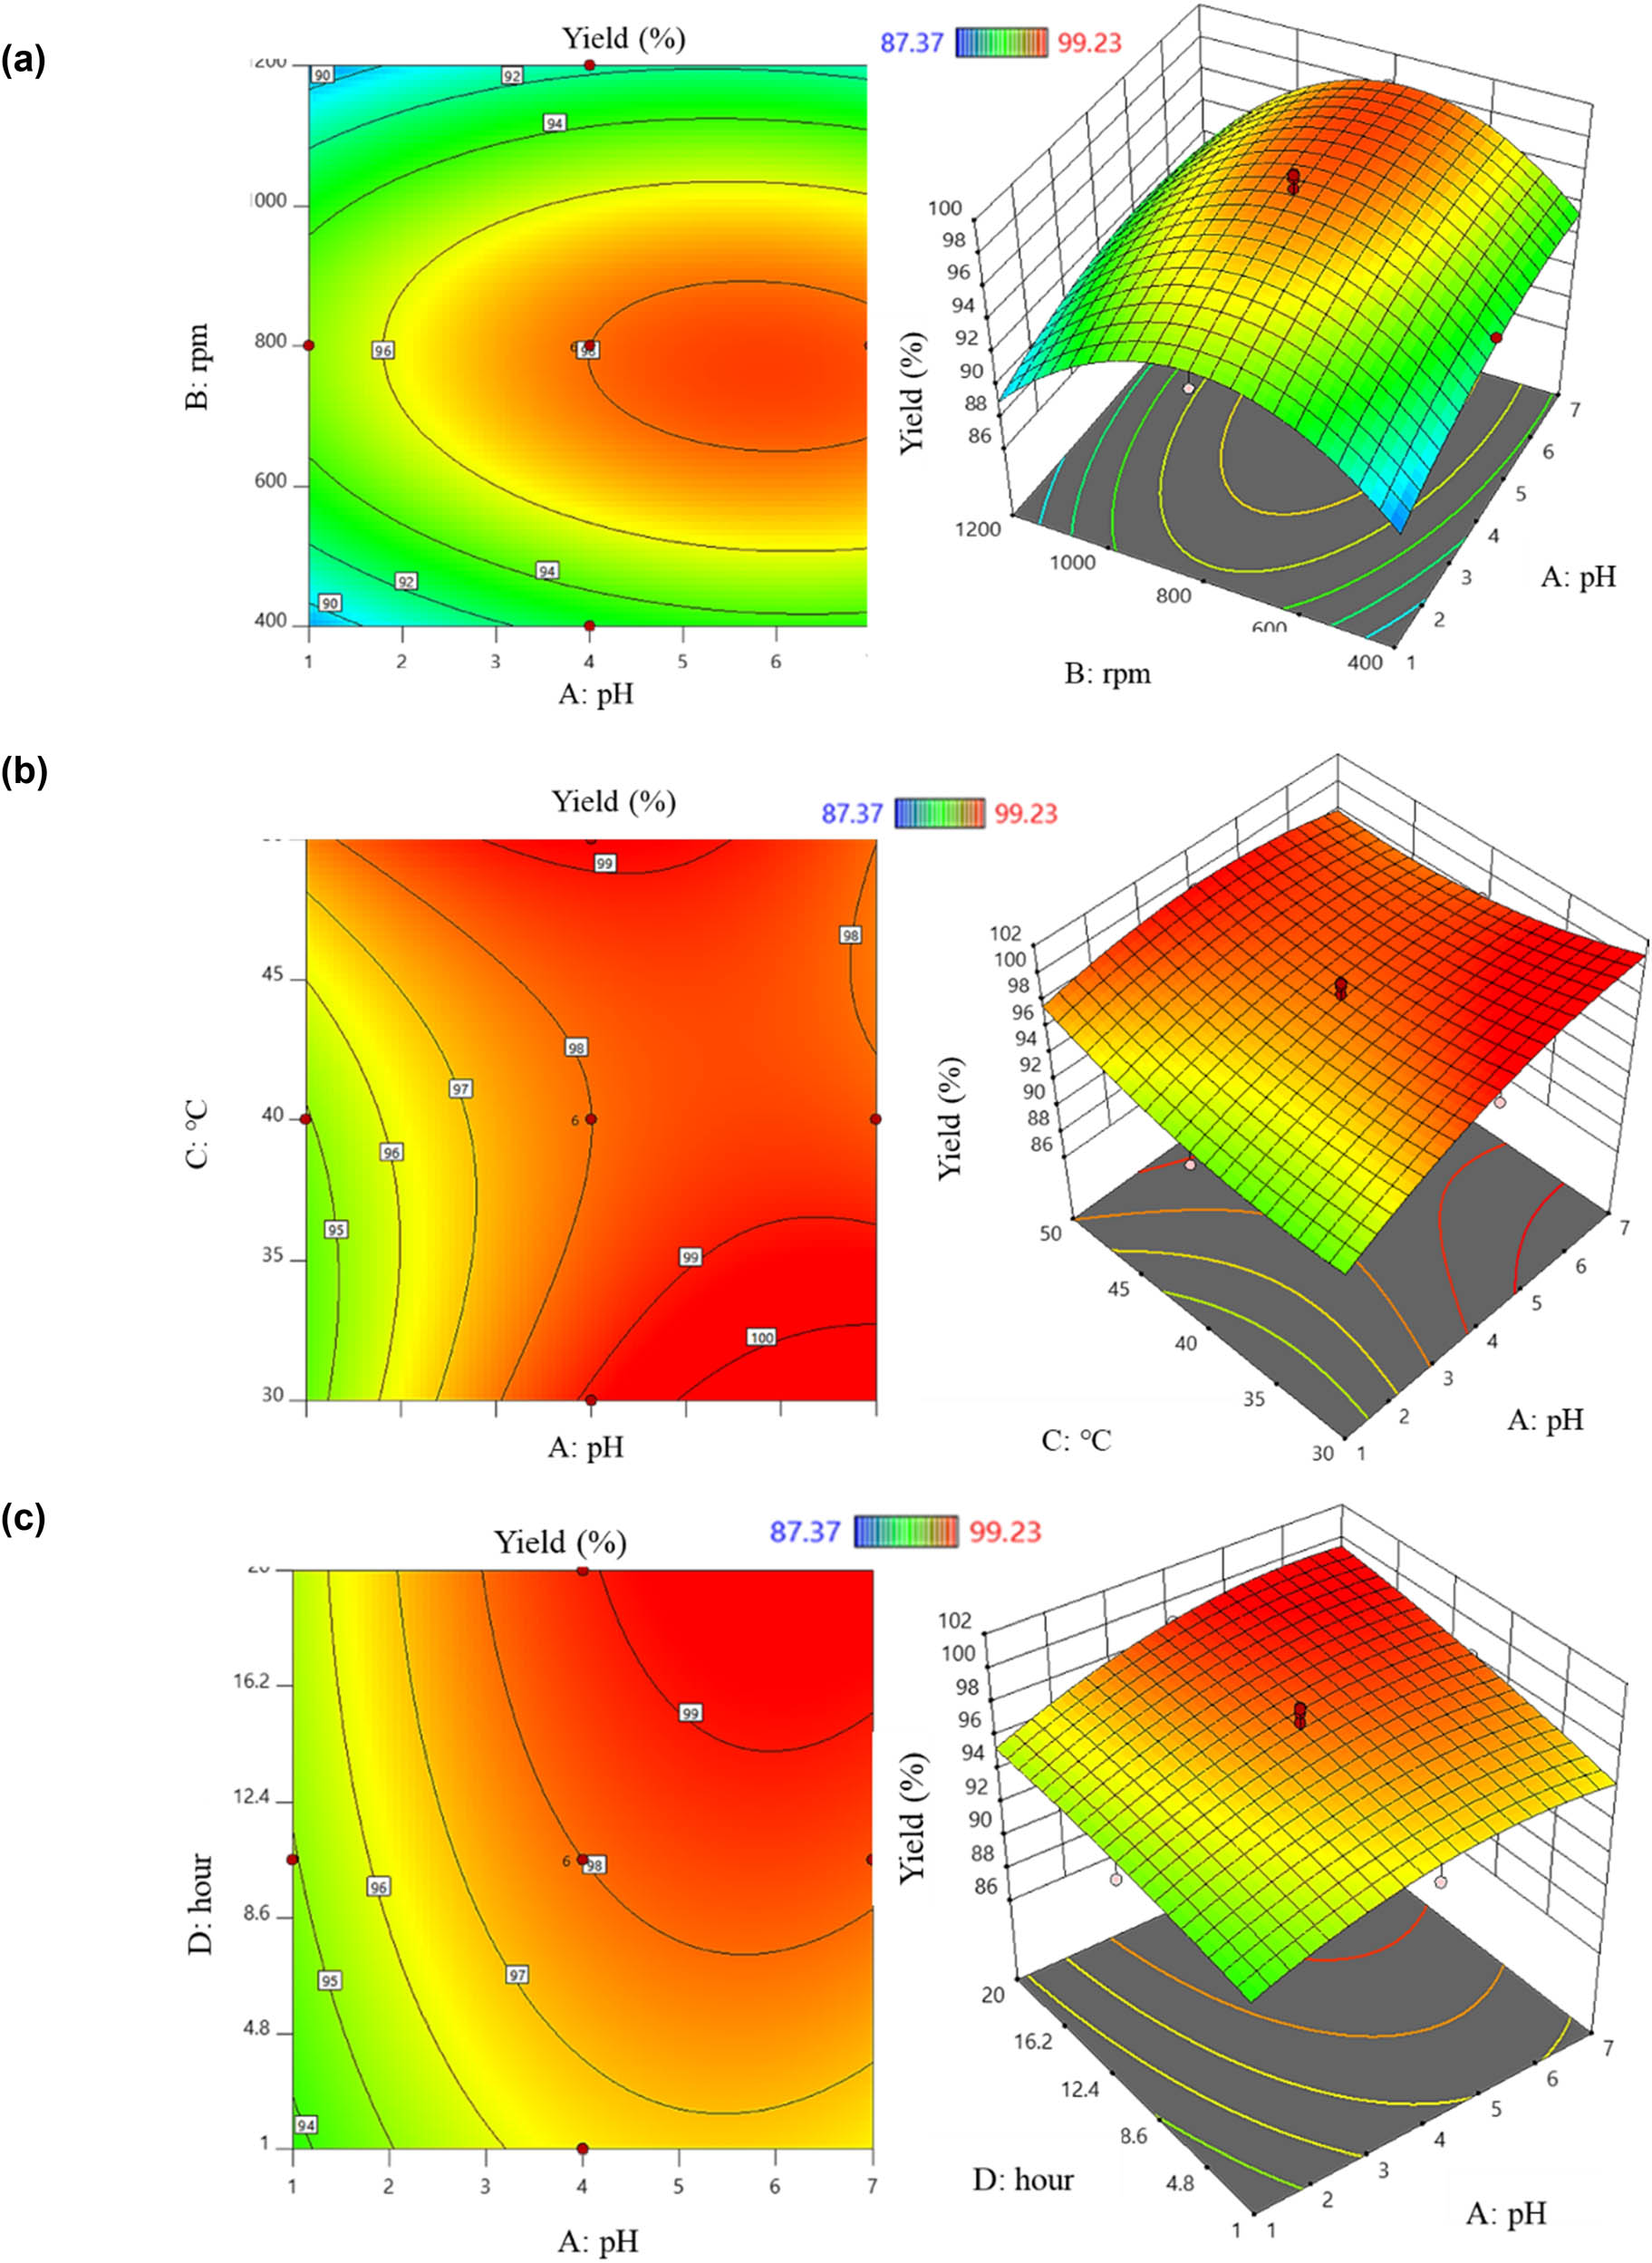
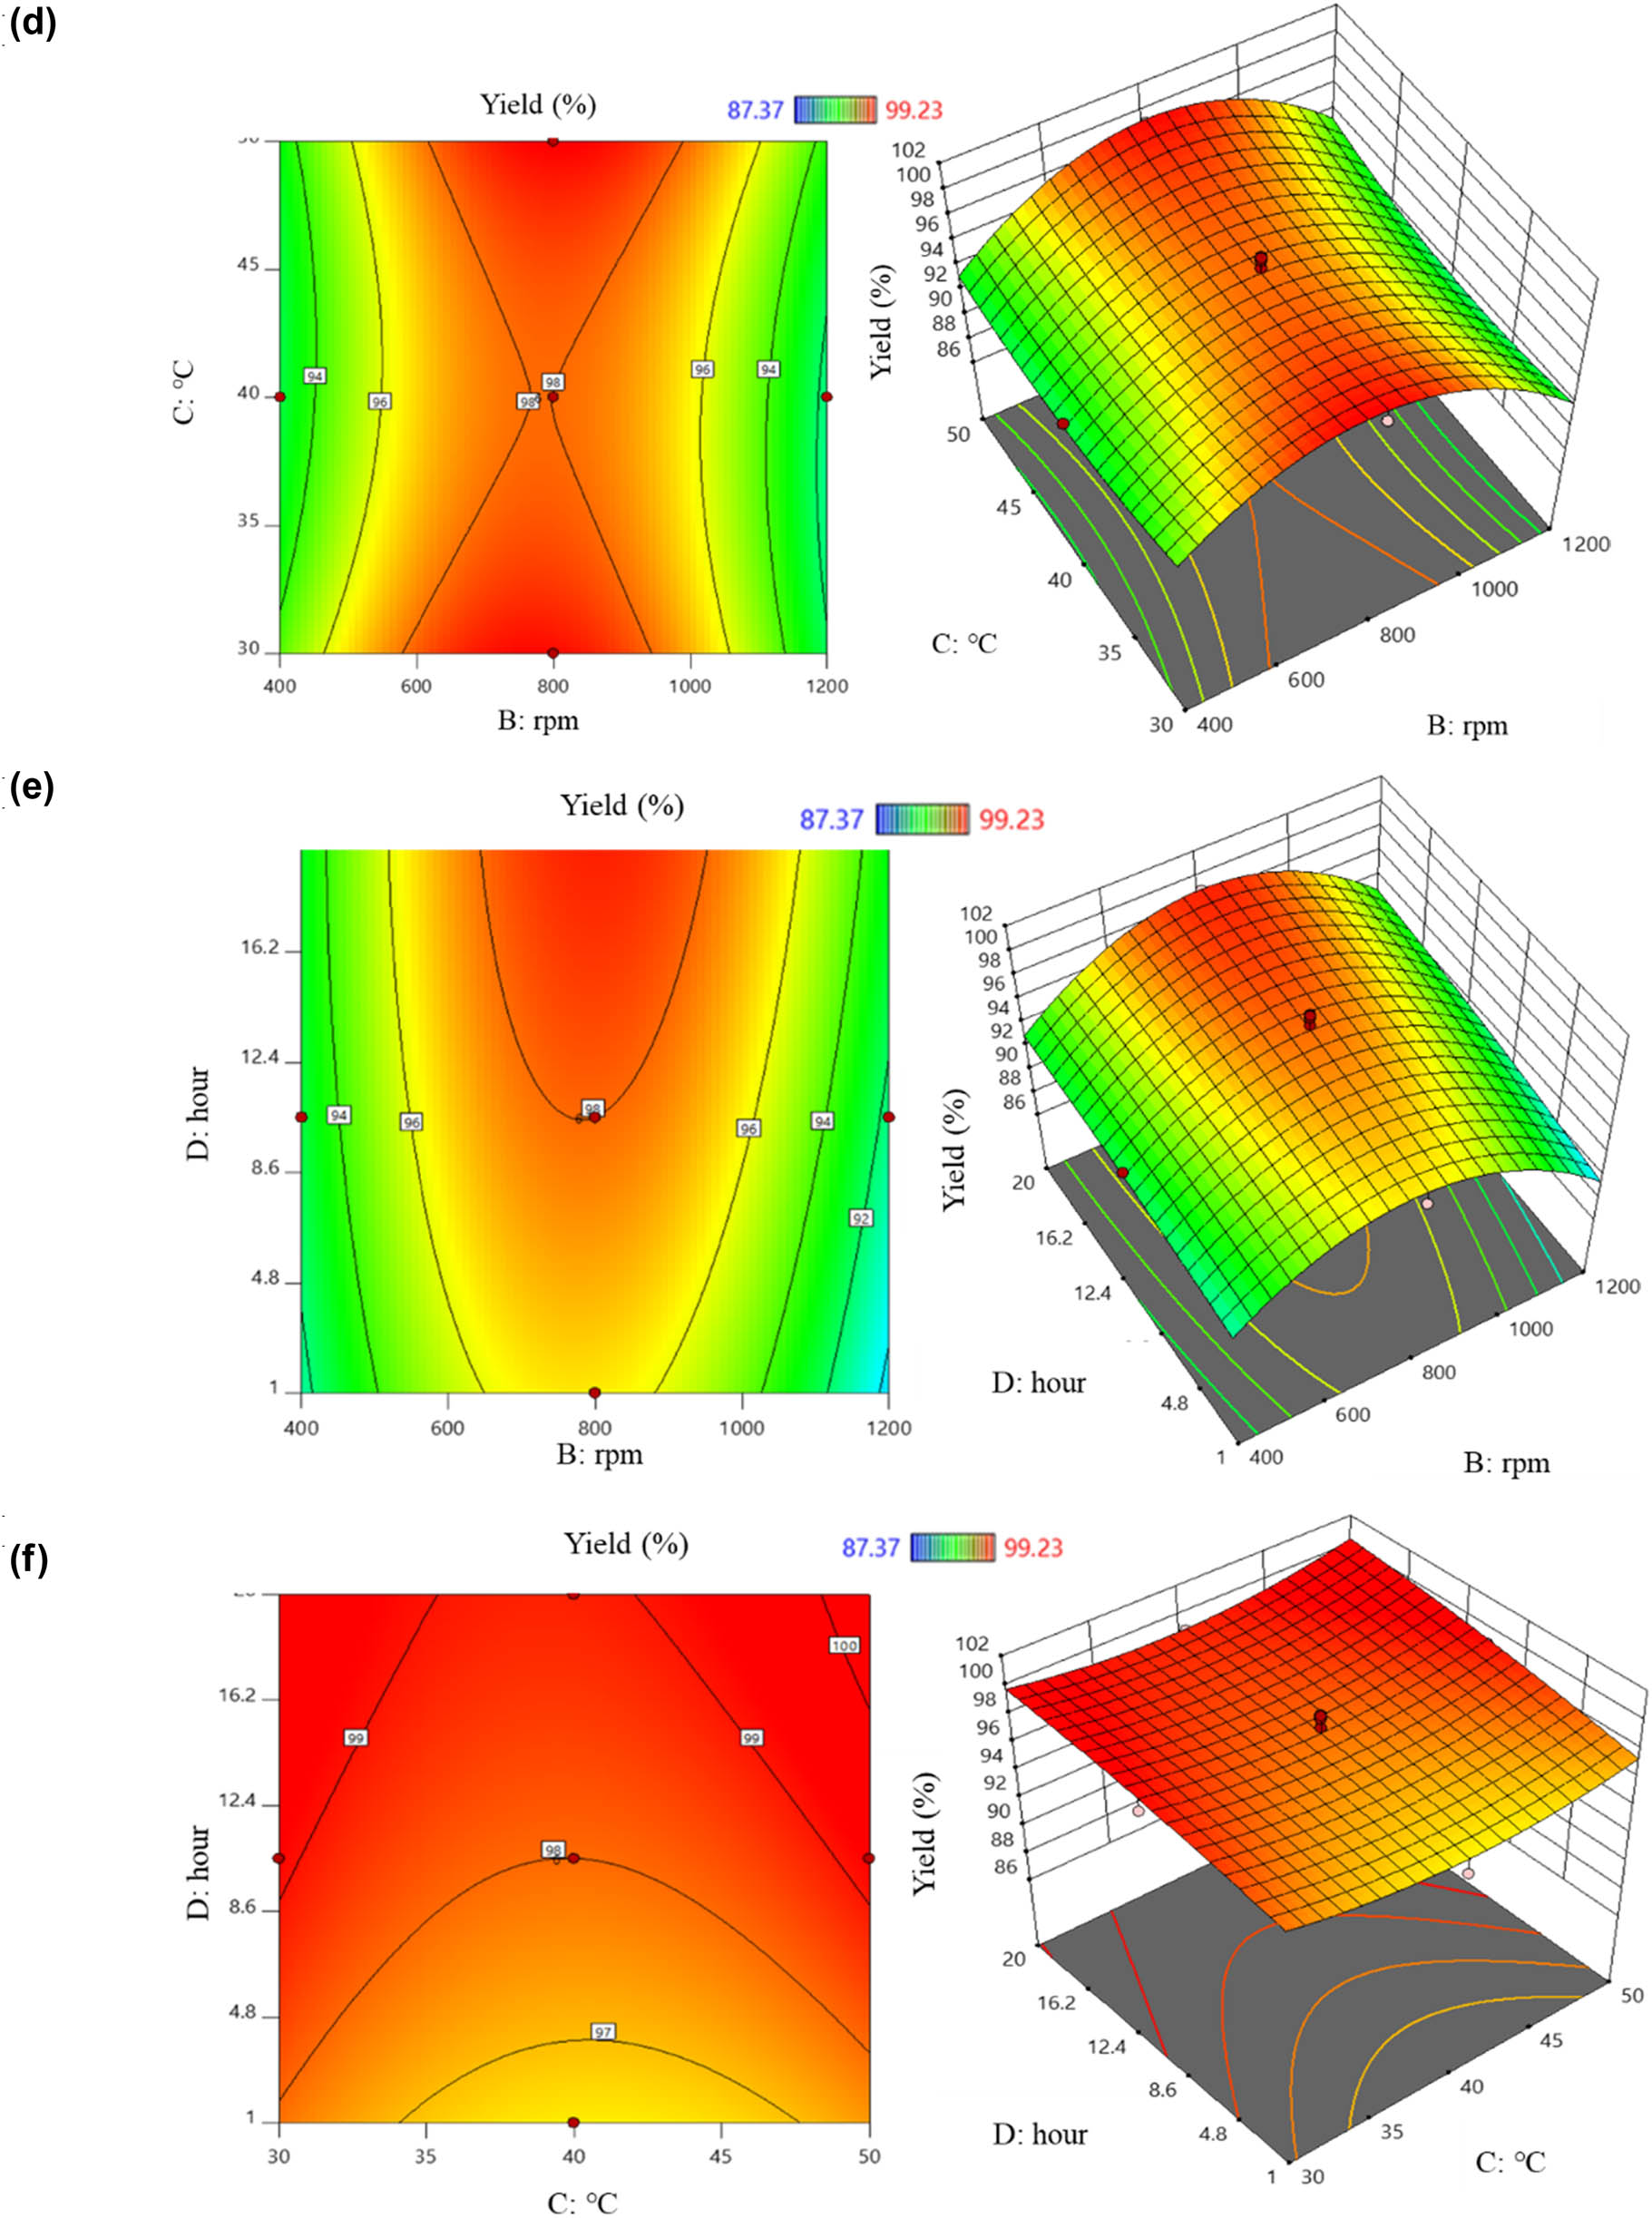
2D and 3D graphs of correlation and central points of factor pairs: (a) pH – stirring rate; (b) pH – temperature; (c) pH – time; (d) stirring rate – temperature; (e) stirring rate – time; and (f) temperature – time yield factor.
3.2.2 Objective function 2
The regression equation consistent with the experiment for I2 content was of the form
When the effect level was positive, the surveyed factors and I2 content were positively correlated, and vice versa. From equation (10), the factors that positively correlated with I2 content were (BD) and (CD). Increasing the values of these two factors led to higher I2 content obtained from the PVP-I preparation process. Conversely, increasing the values of other factors such as (A), (B), (C), (D), the pair (AB), the pair (AC), the pair (AD), the pair (BC), and the four factors (A 2), (B 2), (C 2), and (D 2) resulted in a decrease in I2 content. The effects were illustrated by six two-dimensional and three-dimensional response surface plots: the orange-yellow area indicated the highest levels, while the green area represented lower results (Figure 4). Figure 4a shows the interaction between (A) and (B). As the values of these two factors changed, the content also changed accordingly. Considering the effect of pH on I2 content, at a stirring speed of 800 rpm, increasing pH from 1 to 4 tended to increase the content. However, further increasing pH up to 7 led to a decrease. Similarly, varying the stirring speed at 800 rpm also had a reducing effect. The interaction of (AC) on the content is shown in Figure 4b. At a temperature of 40°C, the content reached its highest value, and both increasing or decreasing temperature with pH tended to reduce it in PVP-I. The effect of the pH and time is depicted in Figure 4c. With pH at 4, changing the preparation time affected the content. Increasing the reaction time from 1 h to about 12 h resulted in an increase, but beyond 16.2 h, it tended to decrease. The interaction of stirring speed and temperature is shown in Figure 4d. The plot indicated an inverse correlation; increasing temperature from 30 to 50°C increased the content while increasing stirring speed decreased it. The correlation between stirring speed and time is illustrated in Figure 4e. When both factors were either increased or decreased together, the content also decreased. Figure 4f shows the relationship between the temperature and time. As time increased from 1 to 20 h, the content also increased. Increasing temperature from 30 to 45°C raised the content, though further increases led to a gradual decrease in iodine.
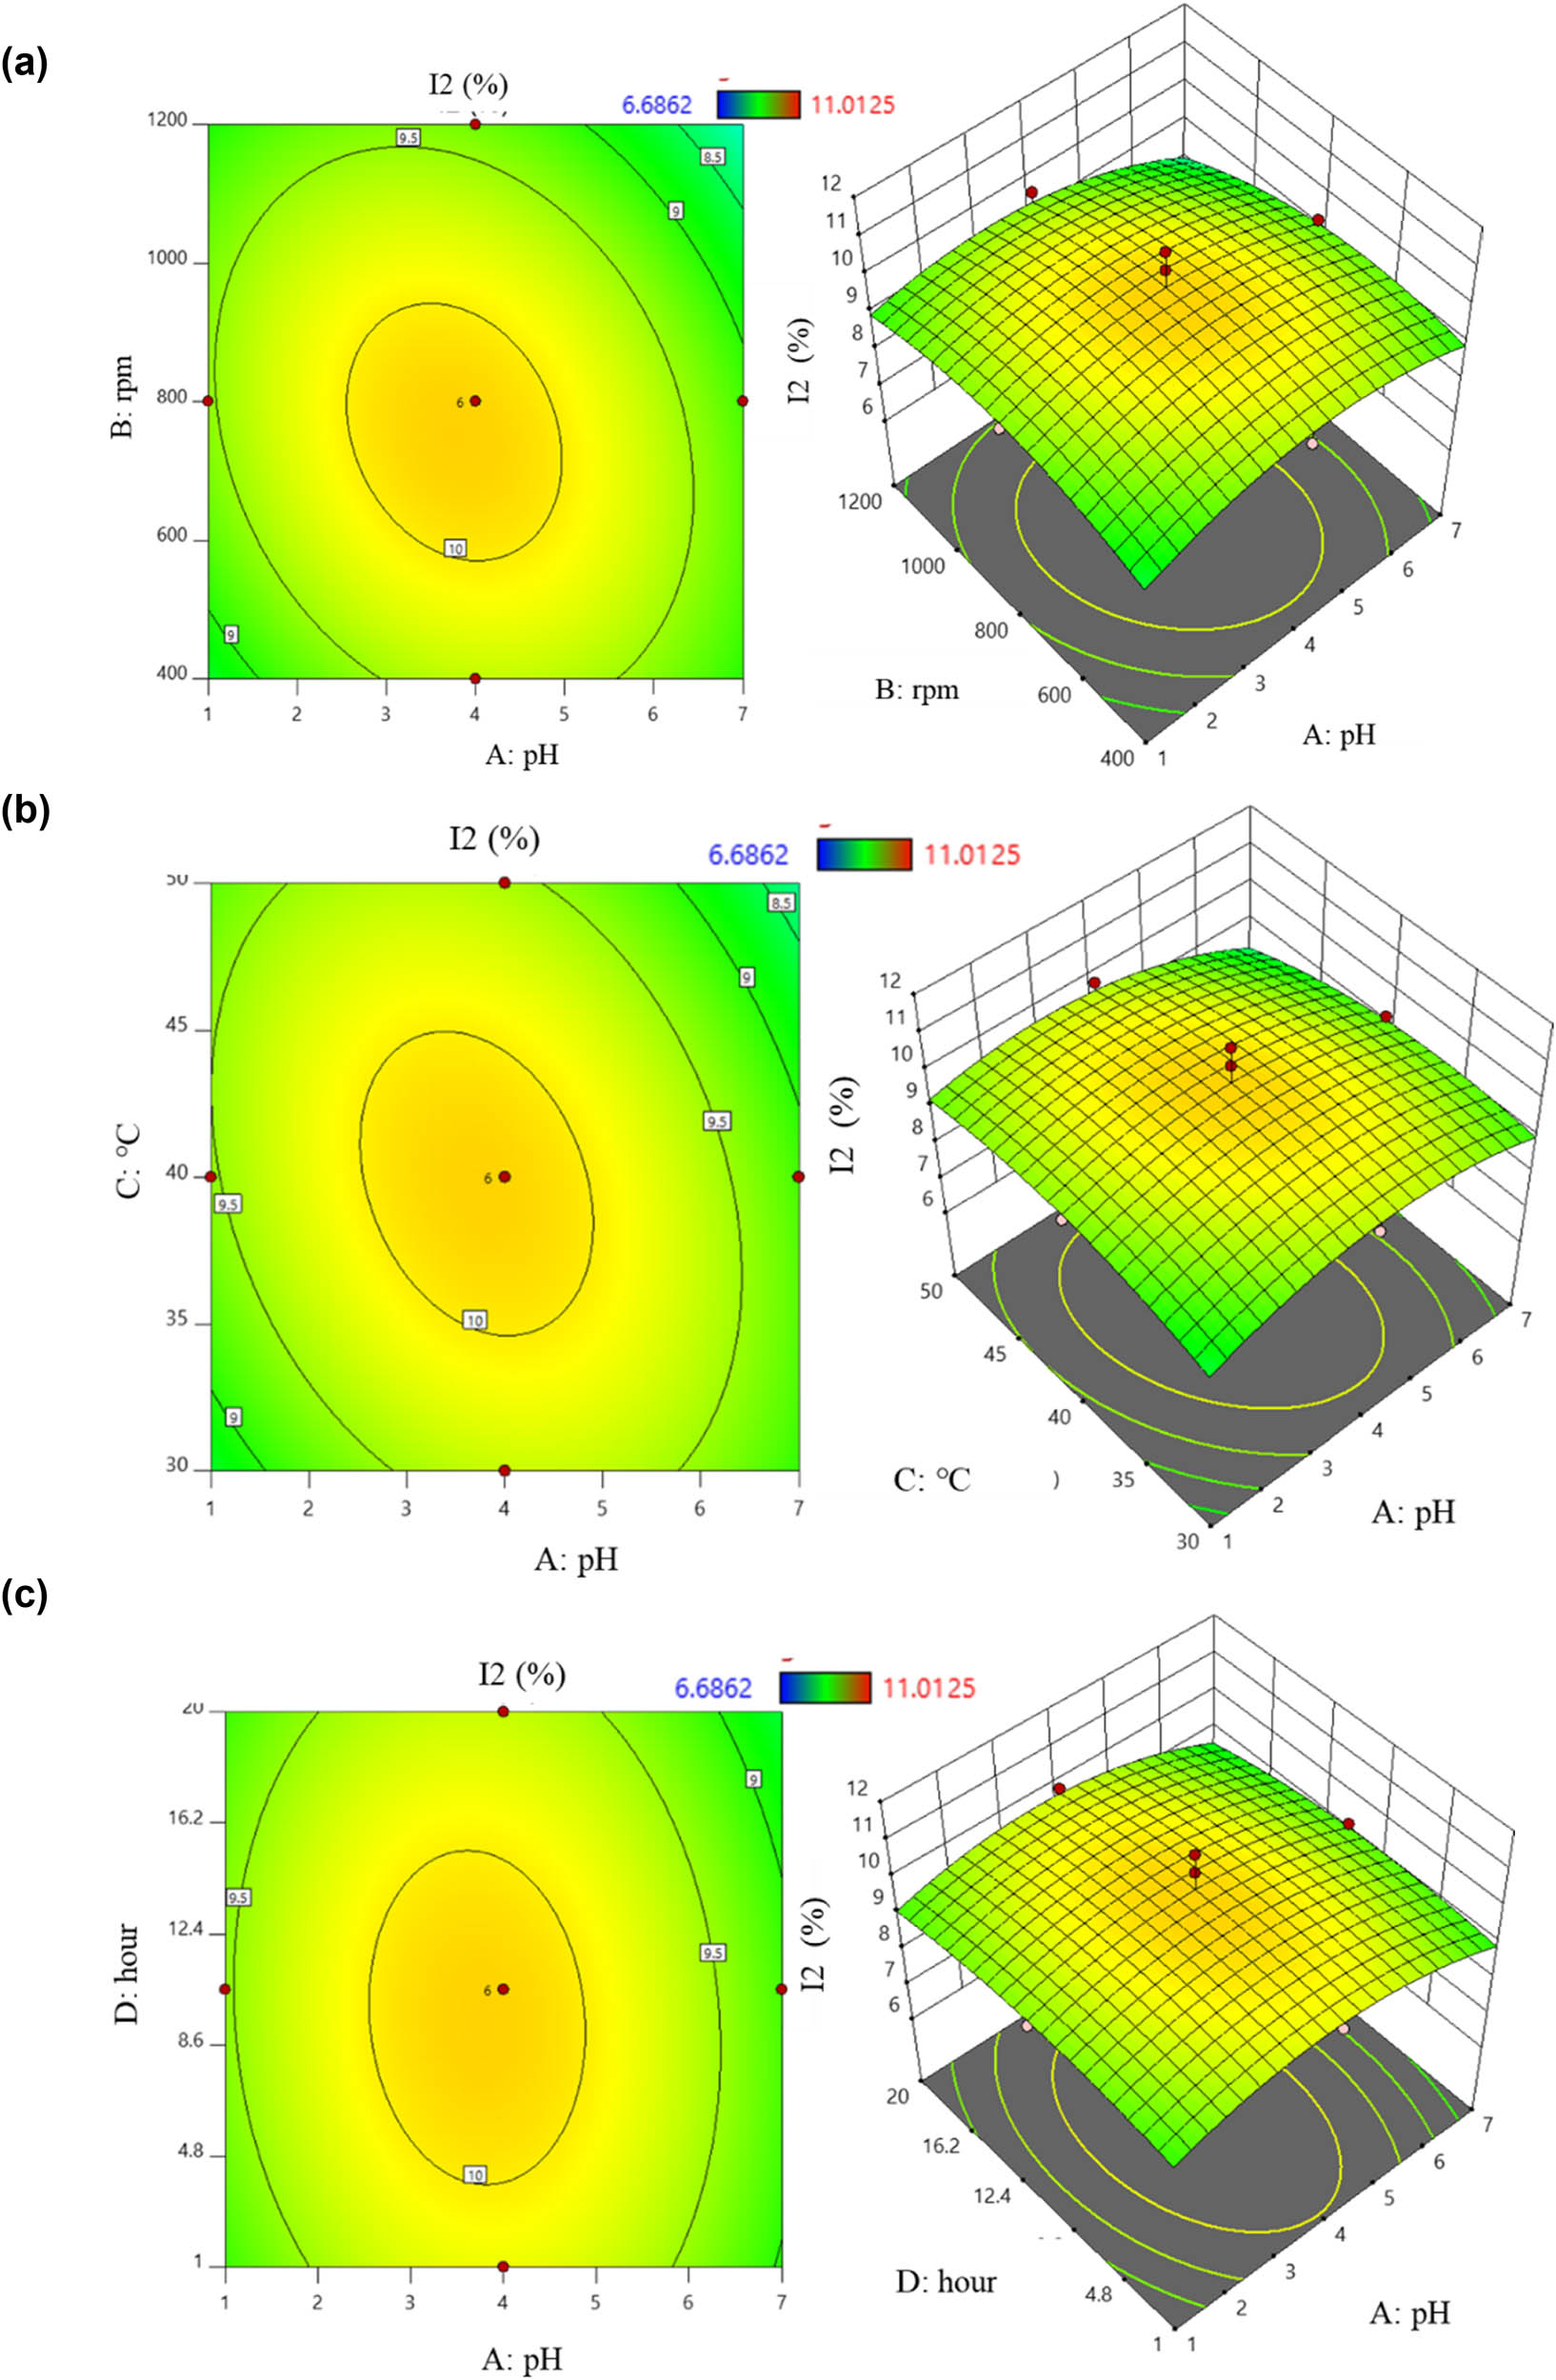
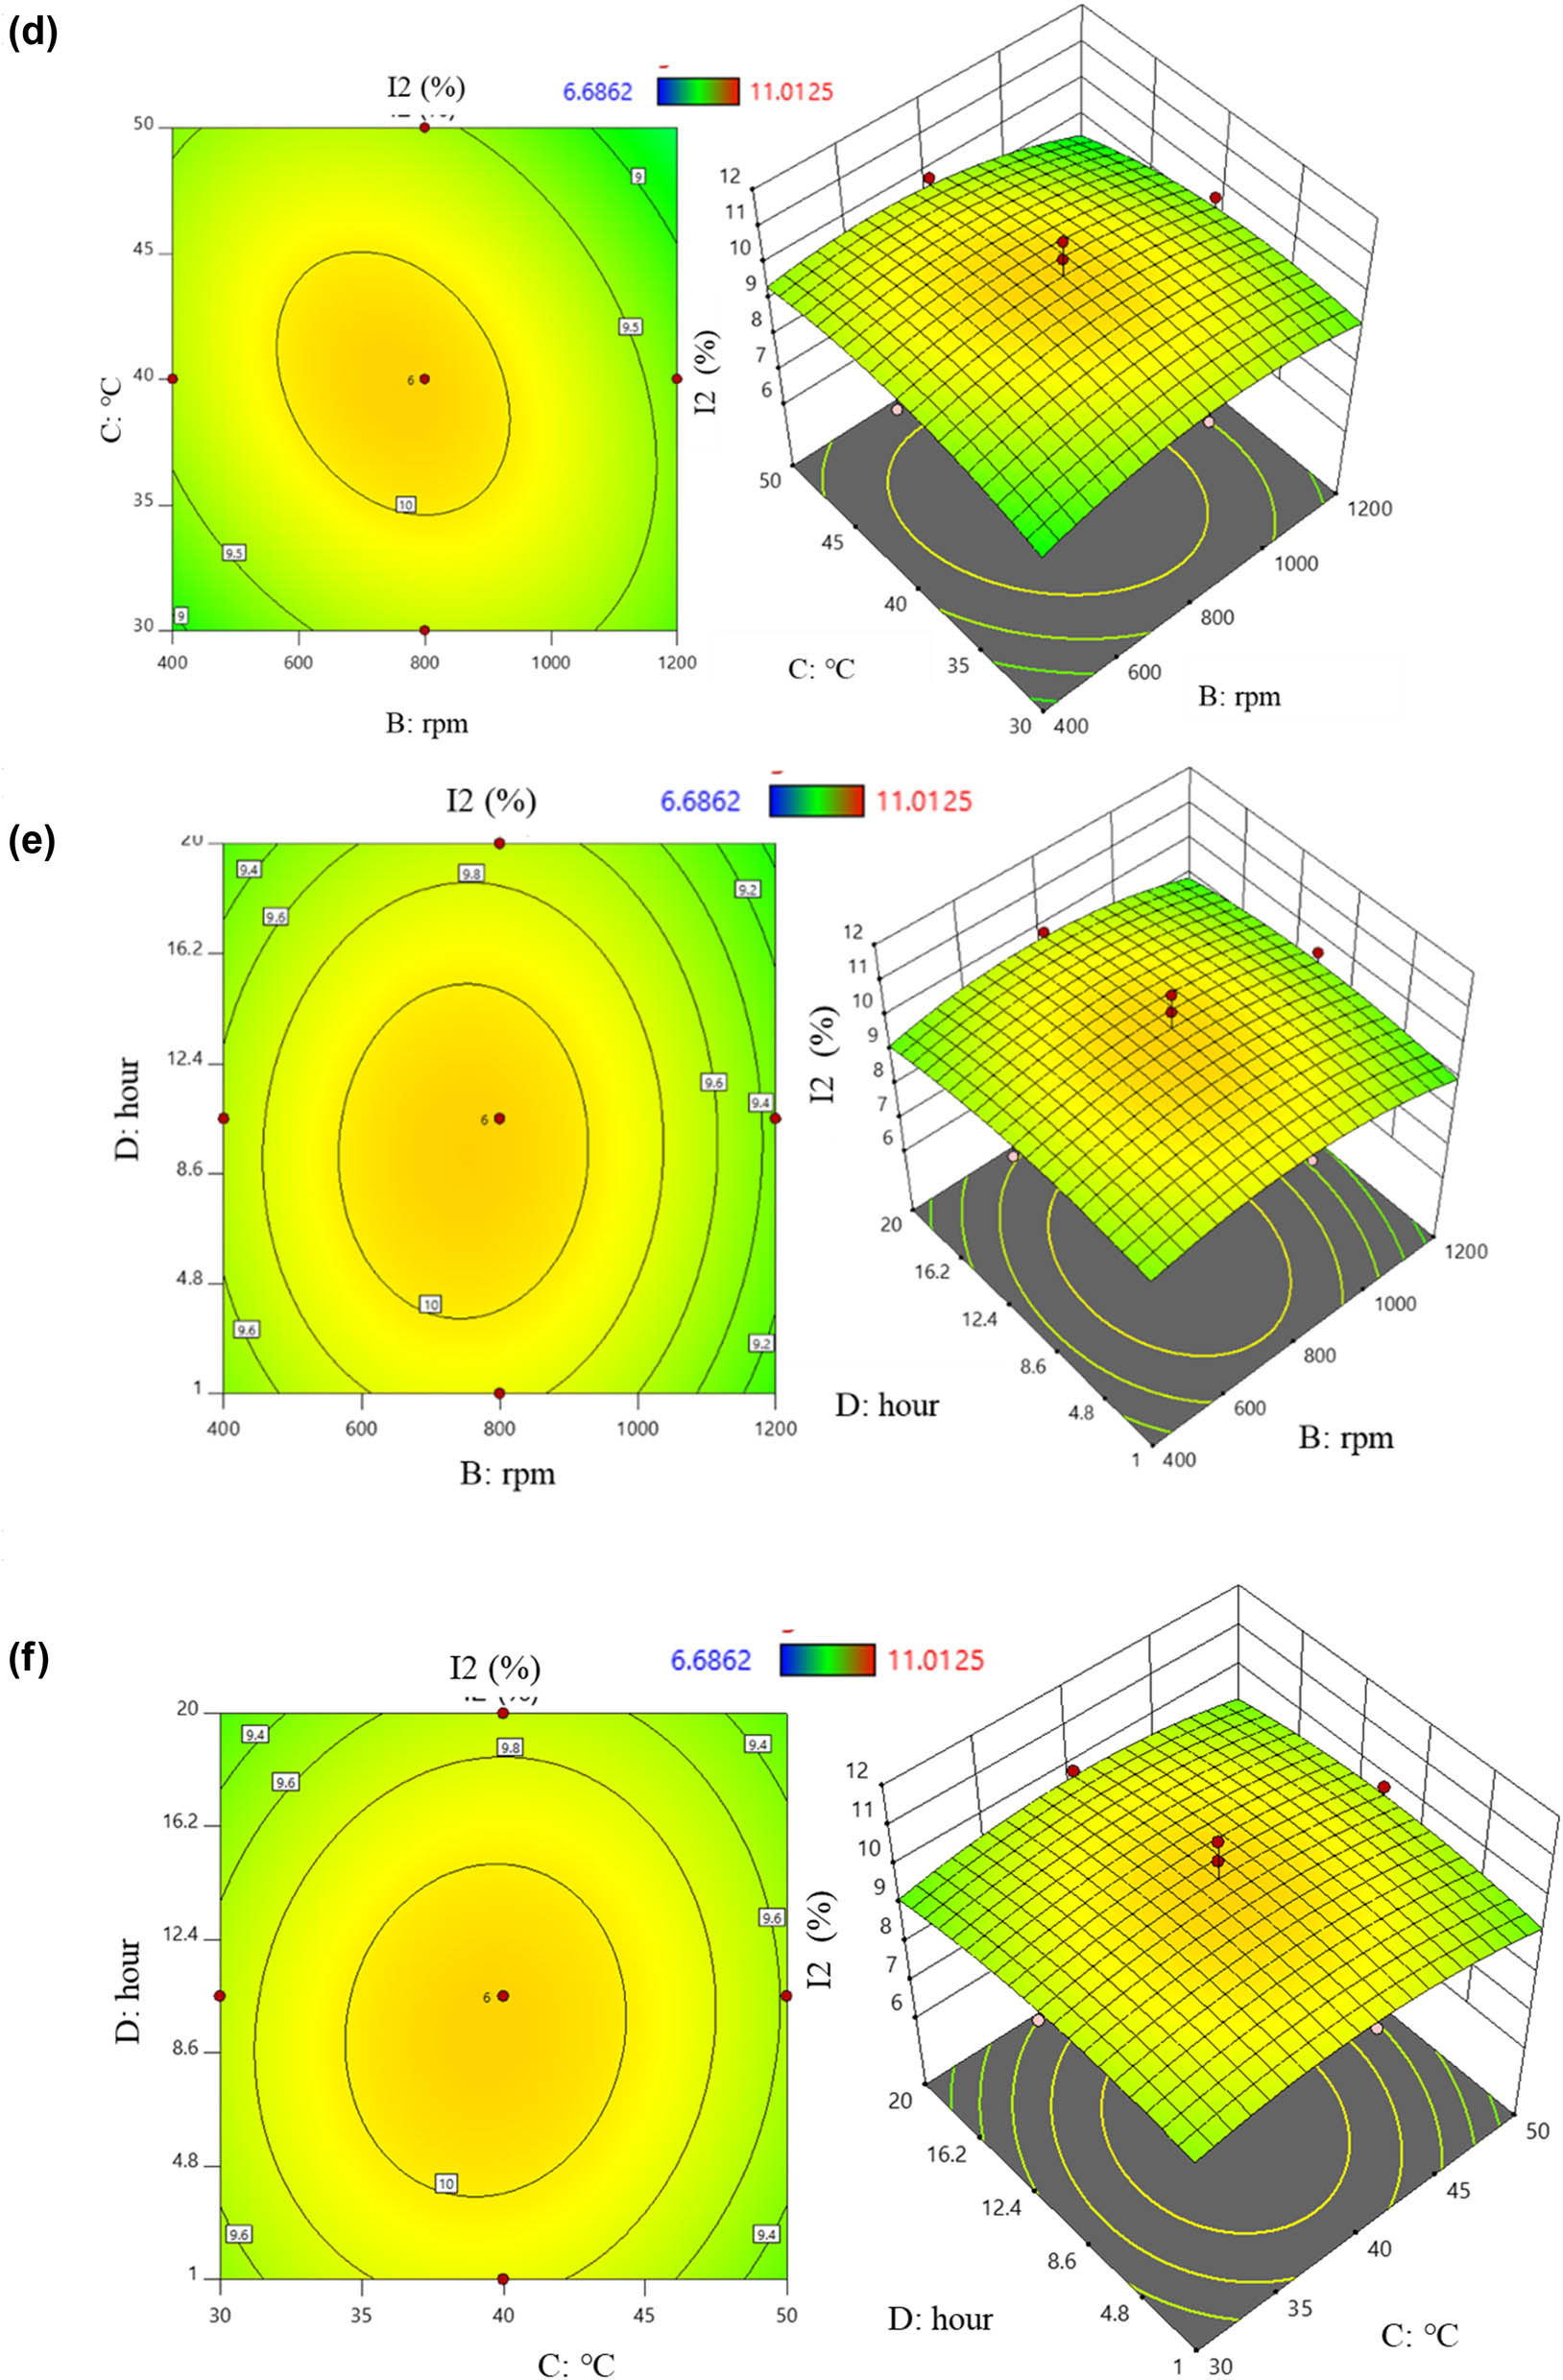
2D and 3D graphs of correlation and central points on I2 content with (a) pH – stirring rate; (b) pH – temperature; (c) pH – time; (d) stirring rate – temperature; (e) stirring rate – time; and (f) temperature – time.
3.2.3 Objective function 3
The regression equation corresponding to the experimental data for I content was as follows:
From equation (11), the factors that positively correlated with I content were (B), (C), (D), (AB), (AC), (BC), (BD), (CD), (B 2), (C 2), and (D 2). Increasing the values of these factors resulted in higher I content from the preparation process. Conversely, higher values of (A), (AD), and (A 2) led to a decrease in the I content. This is illustrated by six 2D and 3D plots: regions colored from yellow to orange indicated the highest I content, while green areas showed lower results (Figure 5). Figure 5a displays the interaction between (A) and (B) on the I content. It was observed that increasing the stirring speed led to an increase in I content, while changes in temperature had no significant effect (p > 0.05). Figure 5b demonstrates the interaction between (A) and (C) on I content. I content tended to increase as the temperature increased from 30 to 50°C, with pH having an unclear impact. The relationship of the (AD) pair on I content is shown in Figure 5c. A slight increase in I content was noted with extended reaction time, while pH changes had minimal effect. Figure 5d illustrates the interaction between the stirring speed and temperature. Increasing the stirring speed from 400 to 1,200 rpm and temperature from 30 to 50°C resulted in a noticeable increase in I content. Figure 5e depicts the effect of the stirring speed and time, with I content increasing with higher stirring speeds and longer times. Figure 5f shows the correlation between the temperature and time. An increase in time from 1 to 20 h and temperature up to 50°C resulted in higher I content.
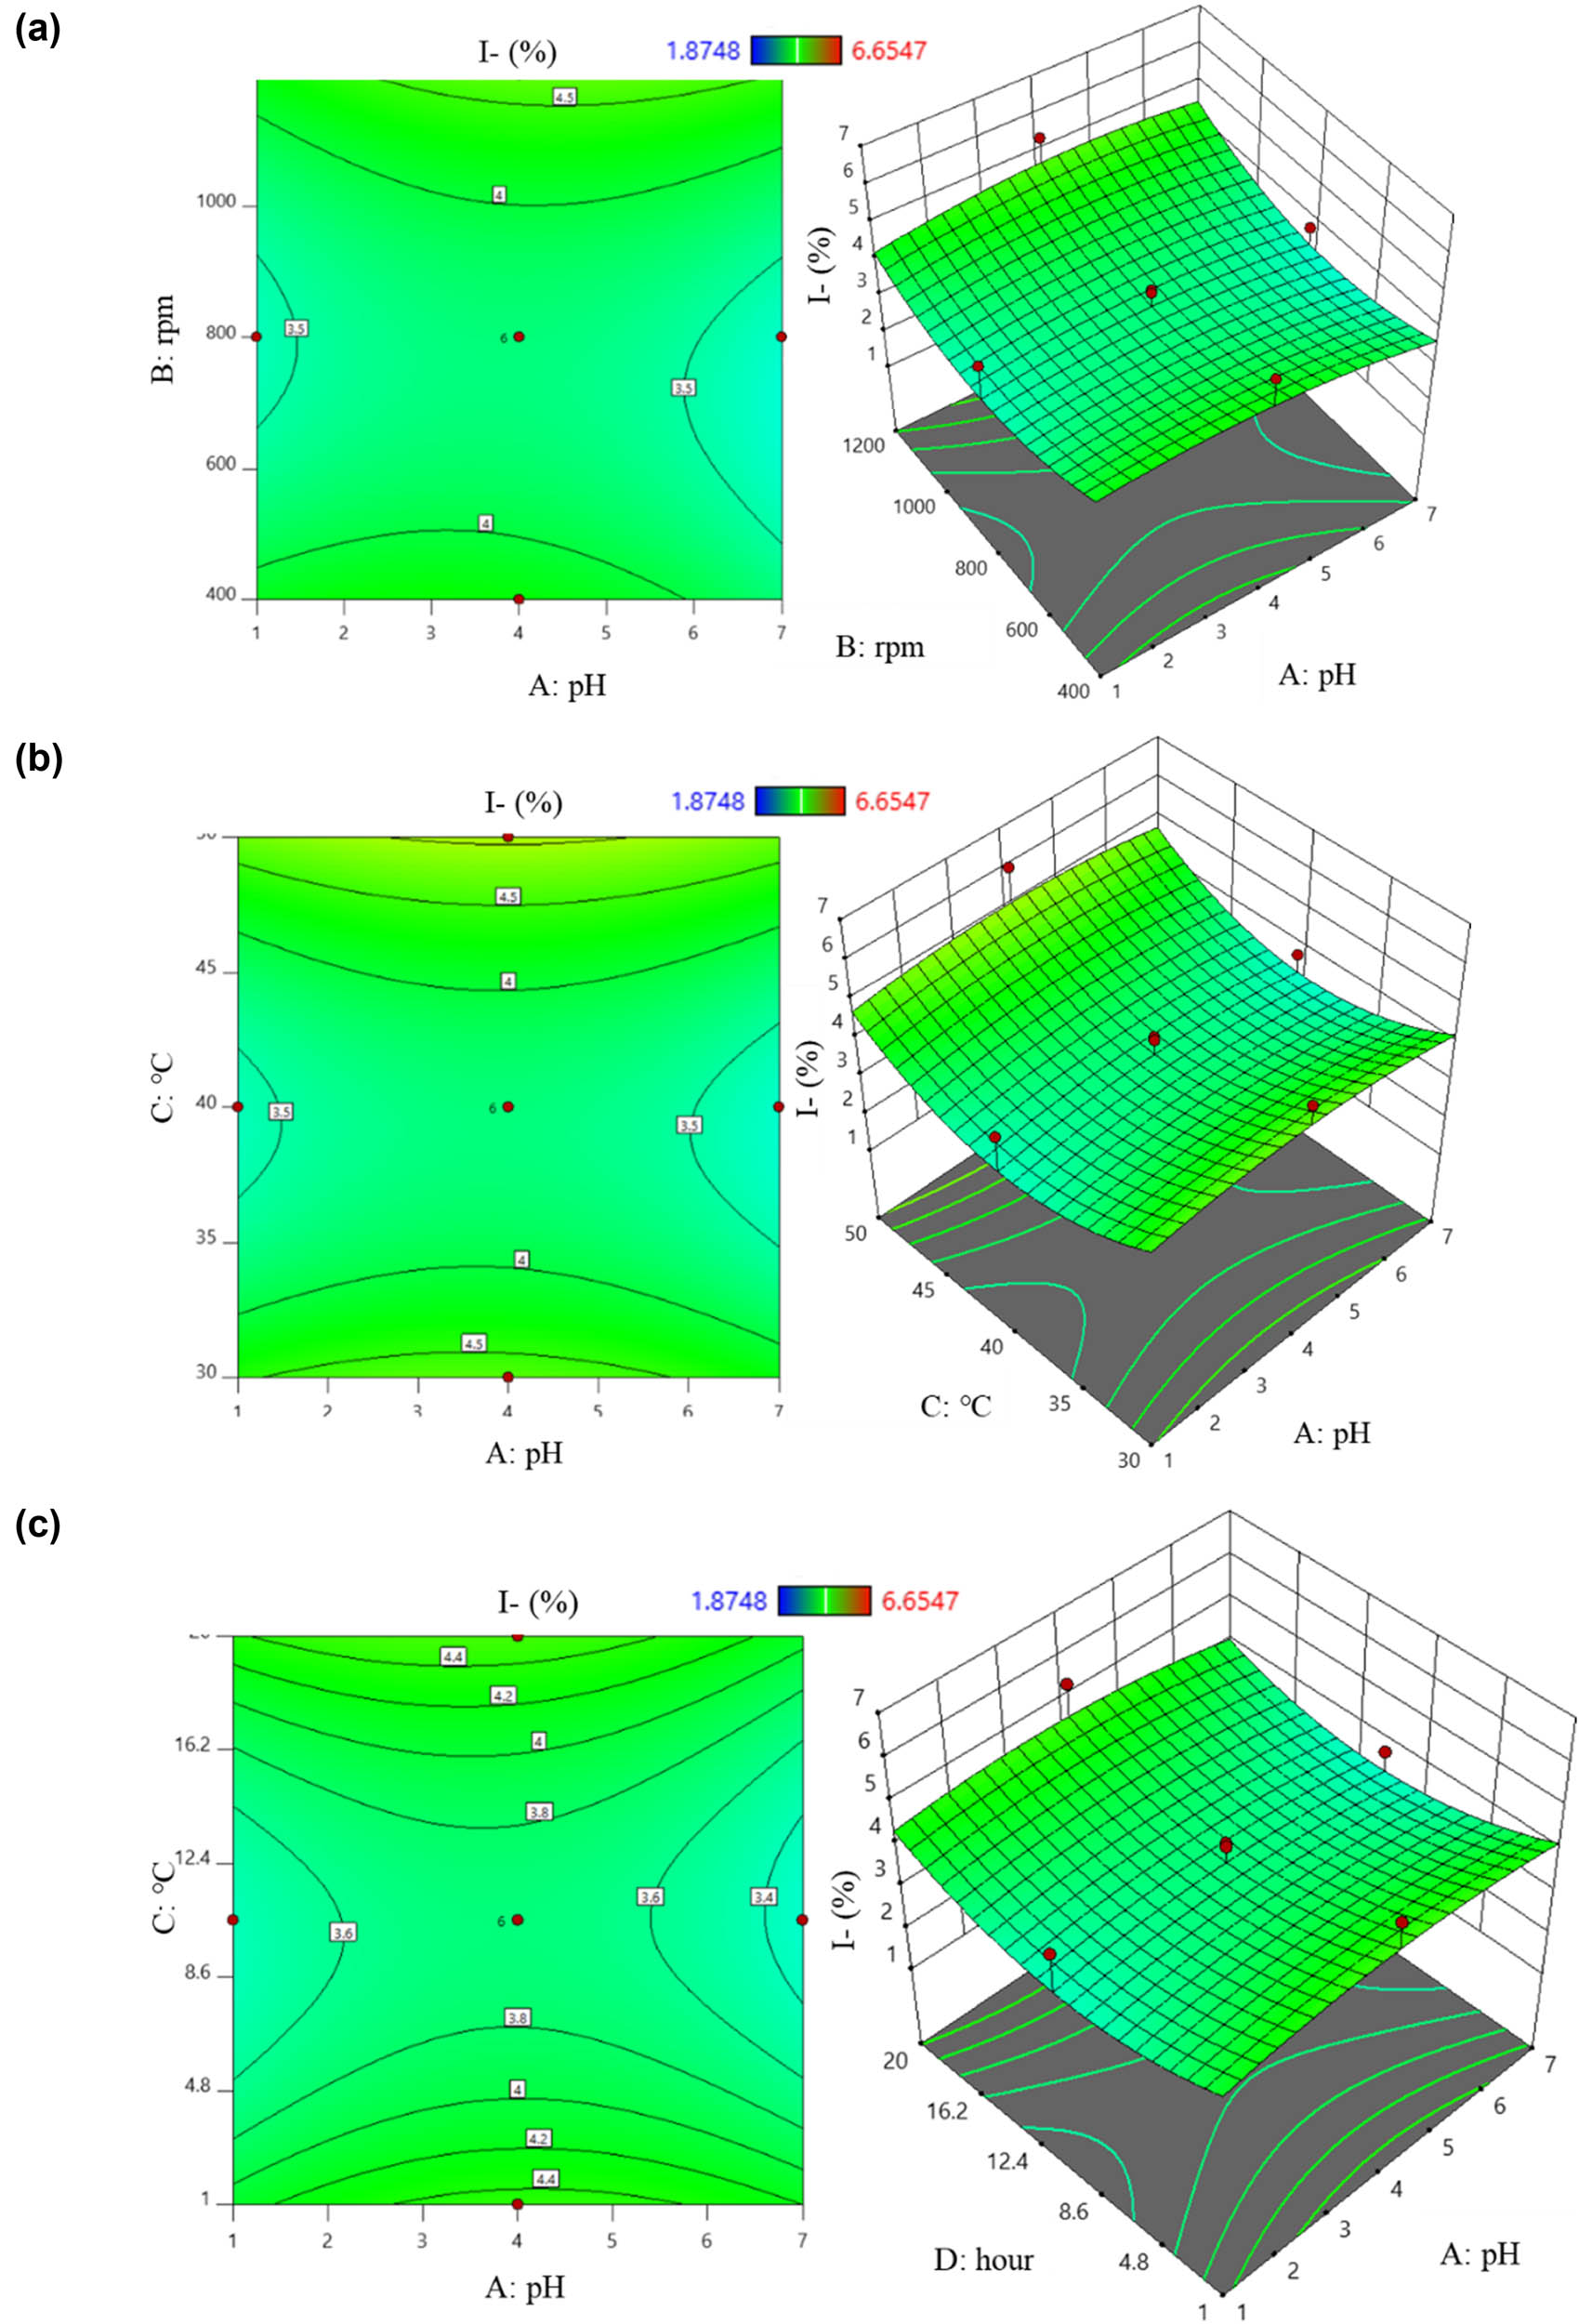
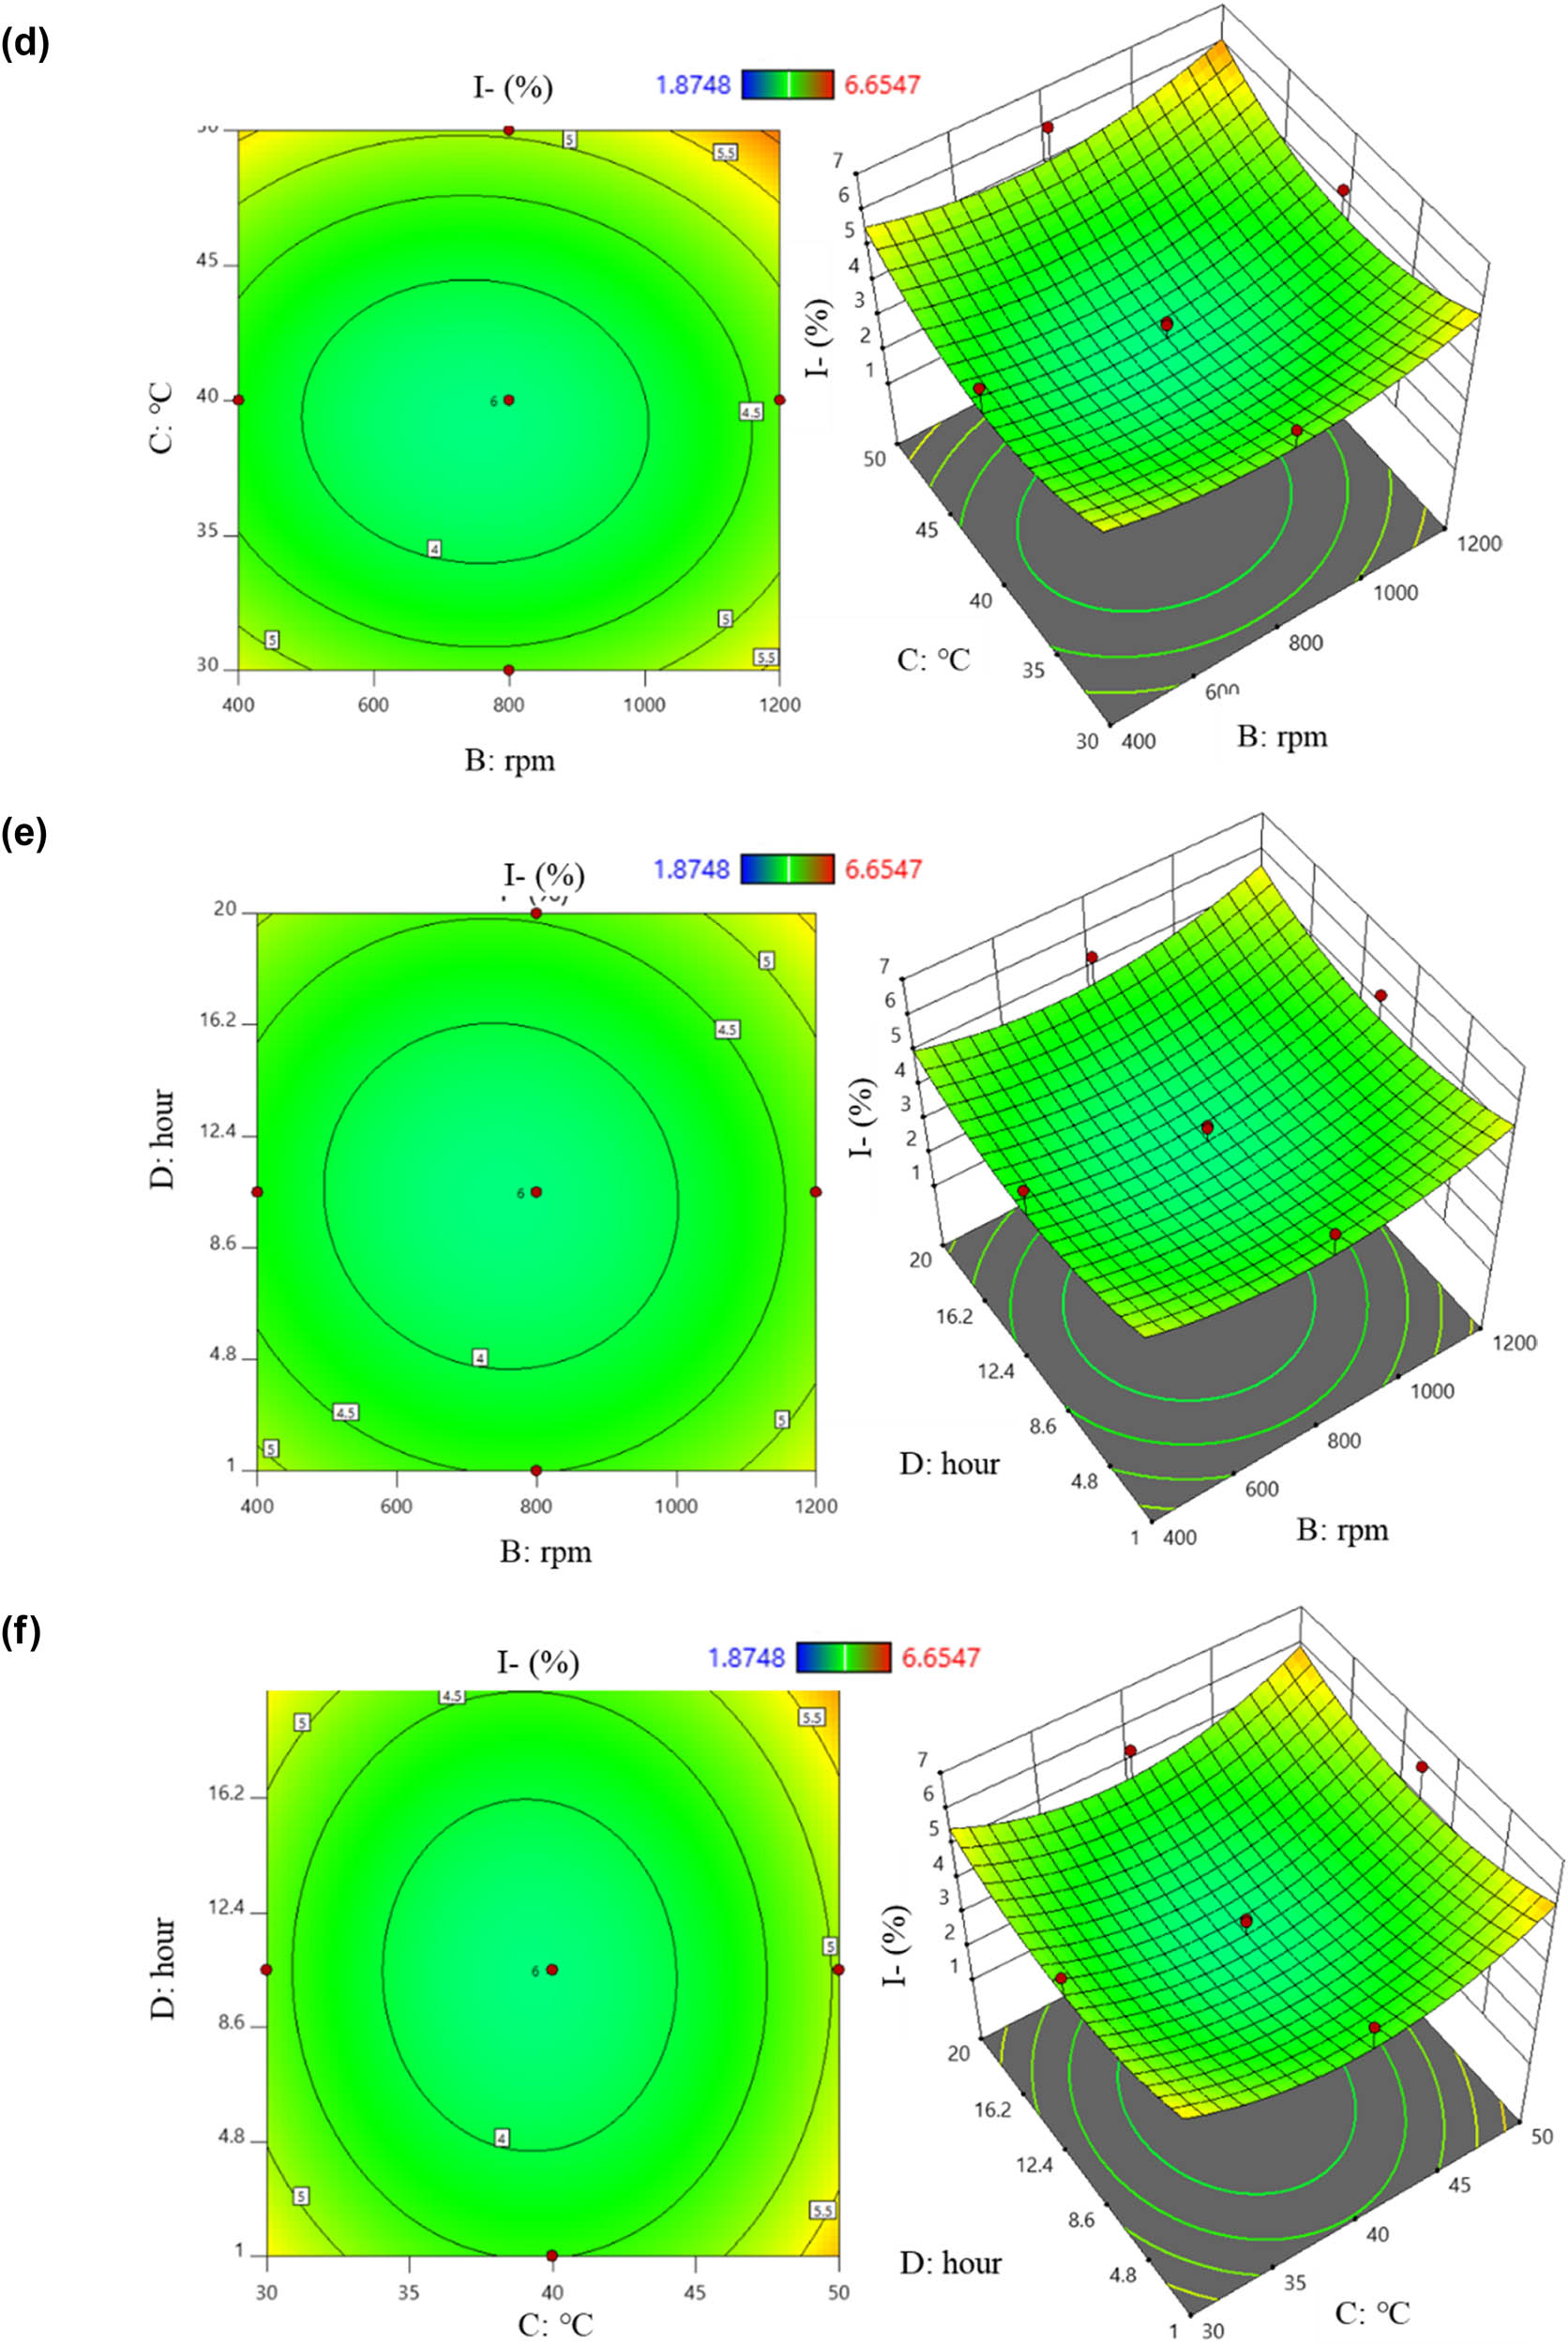
2D and 3D graphs of correlation and central points on I content with (a) pH – stirring rate; (b) pH – temperature; (c) pH – time; (d) stirring rate – temperature; (e) stirring rate – time; and (f) temperature – time.
Generally, positive interactions among the factor variables (Tables 6 and 8 and and 9) were advantageous for selecting the coefficients impacting the objective function. In similar studies, the effect of pH was less significant compared to the other two factors. The quadratic model demonstrated a fit of up to 89% of the variance in the experimental data. However, there were instances of negative correlations among factor pairs: X 1 X 2, X 1 X 3, and X 2 X 3 (where solvent concentration (X 1), temperature (X 2), and extraction time (X 3) were involved) [18]. Meanwhile, the highest Y1 achieved was 28.85% when extracting walnut kernel oil using ultrasonic-enzymatic extraction with n-hexane. Iodine content reached 151.07 g I2/100 g oil and was most influenced by extraction time, with a lower model reliability (R 2 = 0.7747) [19]. Similarly, Cheng et al. [20] demonstrated that RSM effectively optimized I2 content obtained from P. pumila seed oil using ultrasonic enzyme-assisted extraction compared to traditional methods, with a reliability level of p < 0.01.
3.3 Model validation
The predicted model with the optimized parameters is presented in Tables 10 and 11. According to this model, the predicted Y1 was 98.68%. The ability to achieve the expected results from the proposed optimal points was 0.771 or 77.1%. However, to align with practical conditions, the model was revalidated with adjusted values close to the predicted factors: pH 5, stirring speed 750 rpm, temperature 38°C, and time 11.5 h. The experiment was conducted six times, and the results were assessed for error. The actual Y1 obtained was 96.87%. This parameter was compared with the predicted model, and the results showed no significant error (1.84%). With an error under 5% and a desirability of 0.771, it was confirmed that the model conditions matched the experimental values. By applying the RSM approach and ANOVA from Design Expert 11, the study identified the optimal parameters for PVP-I preparation as pH 5, stirring speed 750 rpm, temperature 38°C, and time 11 h, 30 min, with Y1 achieved at 96.87%, I2 content at 9.681%, and I content at 3.788%. Previous research on neem oil extraction reported Y1 oils around 37.20% produced at pH approximately 4.4 and iodine content around 71.8 g g−1 [18]. A similar publication on the inhibition efficiency of PVP exceeding 100% was conducted using RSM with P < 0.0001 (multiple regression coefficient R 2 = 0.9997), and the PVP molecular weight reached 58,000 g/mol [21]. The synthesis of chiral benzoin was achieved by polymerizing sodium 11-acrylamidoundecanoyl-l-leucinate with an aqueous solution under ⁶⁰Co radiation, forming poly[micelle] molecules [22].
Checking optimal conditions on Design Expert 11
| Run | A (pH) | B (rpm) | C (°C) | D (h) | Y1 (%) | I2 content (%) | I content (%) |
|---|---|---|---|---|---|---|---|
| 1 | 5 | 750 | 38 | 11.5 | 94.42 | 9.788 | 3.586 |
| 2 | 5 | 750 | 38 | 11.5 | 98.39 | 9.296 | 4.225 |
| 3 | 5 | 750 | 38 | 11.5 | 96.82 | 10.223 | 3.308 |
| 4 | 5 | 750 | 38 | 11.5 | 99.17 | 9.551 | 4.112 |
| 5 | 5 | 750 | 38 | 11.5 | 93.95 | 9.276 | 4.507 |
| 6 | 5 | 750 | 38 | 11.5 | 98.46 | 9.953 | 2.991 |
| Average | 96.87 | 9.681 | 3.788 | ||||
Bold values indicate the most important values to note.
PVP-I modulation results using optimal conditions on Design Expert 11
| A (pH) | B (rpm) | C (°C) | D (h) | Y1 (%) | I2 content (%) | I content (%) | |
|---|---|---|---|---|---|---|---|
| Predicted | 5.071 | 754.435 | 38.174 | 11.408 | 98.685 | 9.965 | 3.623 |
| Actual | 5 | 750 | 38 | 11.5 | 96.87 | 9.681 | 3.788 |
| Error | 1.84% | 2.85% | 4.55% | ||||
Bold values indicate the most important values to note.
4 Conclusion
The PVP-I preparation process was optimized using CCD and RSM, analyzing key factors such as pH, stirring speed, temperature, and reaction time. The IR spectrum was used to confirm the structural formula of PVP-I. A statistically significant second-order model was identified, yielding optimal conditions: pH 5, 750 rpm, 38°C, and 11.5 h, achieving 96.87% Y1, 9.681% I₂, and 3.788% I⁻. Spray drying was recommended over prolonged heat exposure to prevent degradation and account for substance concentration effects.
Acknowledgments
The authors acknowledge the Nguyen Tat Thanh University, Ho Chi Minh City, Vietnam and the Industrial University of Ho Chi Minh City, Vietnam, for providing the facilities required to carry out this work.
-
Funding information: The authors state no funding involved.
-
Author contributions: N.N.Q. and T.P.D.: conceptualization; N.M.T., N.N.Q. and X.T.T.N.: data curation; N.N.Q. and N.M.T.: formal analysis; N.N.Q. and T.P.D.: investigation; N.N.Q. and T.P.D., and K.K.L.: methodology; N.N.Q. and N.M.T.: project administration; N.M.T. and K.K.L.: resources; N.M.T., X.T.T.N. and K.K.L.: software; N.Y.T.T., and K.K.L.: supervision; N.N.Q. and K.K.L.: validation; N.Y.T.T. and K.K.L.: visualization; N.N.Q. and N.Y.T.T.: writing – original draft; K.A.L.T. add N.Y.T.T.: writing – review and editing. All the authors agreed on the final version of the manuscript.
-
Conflict of interest: The authors declare that they have no known competing financial interests or personal relationships that could have appeared to influence the work reported in this article.
-
Ethical approval: The conducted research is not related to either human or animal use.
-
Data availability statement: All data generated or analyzed during this study are included in this published article (and its supplementary information files).
References
[1] Garg S, Jambu L, Vermani K. Development of novel sustained release bioadhesive vaginal tablets of povidone iodine. Drug Dev Ind Pharm. 2007;33(12):1340–9. 10.1080/03639040701385782.Search in Google Scholar PubMed
[2] Lawrence CA, Carpenter CM, Naylor-Foote AWC. Iodophors as disinfectants. J Am Pharm Assoc (Sci Ed). 1957;46(8):500–5. 10.1002/jps.3030460813.Search in Google Scholar
[3] Durani P, Leaper D. Povidone–iodine: use in hand disinfection, skin preparation and antiseptic irrigation. Int Wound J. 2008;5(3):376–87. 10.1111/j.1742-481X.2007.00405.x.Search in Google Scholar PubMed PubMed Central
[4] Jalil A, Matuszczak B, Nguyen Le NM, Mahmood A, Laffleur F, Bernkop-Schnürch A. Synthesis and characterization of thiolated PVP–iodine complexes: key to highly mucoadhesive antimicrobial gels. Mol Pharm. 2018;15(8):3527–34, https://pubs.acs.org/doi/abs/10.1021/acs.molpharmaceut.8b00503.10.1021/acs.molpharmaceut.8b00503Search in Google Scholar PubMed
[5] Shelanski HA. Mixtures of polymeric N-vinyl pyrrolidone and halogens. United States, Patent No. US2739922A; 1952 Mar 27. https://patents.google.com/patent/US2739922A/en.Search in Google Scholar
[6] Bezerra MA, Santelli RE, Oliveira EP, Villar LS, Escaleira LA. Response surface methodology (RSM) as a tool for optimization in analytical chemistry. Talanta. 2008;76(5):965–77. 10.1016/j.talanta.2008.05.019 Search in Google Scholar PubMed
[7] Ranitha M, Nour AH, Ziad AS, Azhari HN, ThanaRaj S. Optimization of microwave-assisted hydrodistillation of lemongrass (Cymbopogon citratus) using response surface methodology. Int J Res Eng Technol. 2014;3(4):5–14.10.15623/ijret.2014.0304002Search in Google Scholar
[8] Silva IM, Gonzaga LV, Amante ER, Teófilo RF, Ferreira MM, Amboni RD. Optimization of extraction of high-ester pectin from passion fruit peel (Passiflora edulis flavicarpa) with citric acid by using response surface methodology. Bioresour Technol. 2008;99(13):5561–6. 10.1016/j.biortech.2007.10.058.Search in Google Scholar PubMed
[9] Kasankala LM, Xue Y, Weilong Y, Hong SD, He Q. Optimization of gelatin extraction from grass carp (Catenopharyngodon idella) fish skin by response surface methodology. Bioresour Technol. 2007;98(17):3338–43. 10.1016/j.biortech.2006.03.019.Search in Google Scholar PubMed
[10] Nguyen NQ, Nguyen MT, Pham TN, Dao TP, Tran TYN. Optimization of the technological process for the production of dried soursop (Annona muricata Linn) for vitamin C content by response surface methodology. IOP Conf Ser Earth Env Sci. 2023;1142:012060. 10.1088/1755-1315/1142/1/012060.Search in Google Scholar
[11] Van Thuan T, Quynh BTP, Nguyen TD, Bach LG. Response surface methodology approach for optimization of Cu2⁺, Ni2⁺ and Pb2⁺ adsorption using KOH-activated carbon from banana peel. Surf Interfaces. 2017;6:209–17. 10.1016/j.surfin.2016.10.007.Search in Google Scholar
[12] Tran TYN, Dang TT, Do TN, Pham VT, Do VL, Chung TPT, et al. Optimization of the cold drying process of mango (Mangifera indica L.) Tu Quy variety by response surface methodology. Food Res. 2021;5(4):386–93. 10.26656/fr.2017.5(4).138.Search in Google Scholar
[13] Celebi N, Yildiz N, Demir AS, Calimli A. Optimization of benzoin synthesis in supercritical carbon dioxide by response surface methodology (RSM). J Supercrit Fluids. 2008;47(2):227–32. 10.1016/j.supflu.2008.07.022.Search in Google Scholar
[14] Sackler MD, Miller RB, Pinter EO, Rackur HE, Sackler RR, Sackler RS, et al. Method of producing standardized povidone iodine preparations and such preparations. Patent No. 4,954,351. Washington, DC: U.S. Patent and Trademark Office; 1990.Search in Google Scholar
[15] Li L, Wang Y, Wang S. Efficacy comparison of chlorhexidine and iodine preparation in reduction of surgical site infection: a systematic review and meta-analysis. Int J Nurs Stud. 2022;127:104059. 10.1016/j.ijnurstu.2021.104059.Search in Google Scholar PubMed
[16] Ministry of Health. Vietnamese Pharmacopoeia V. Hanoi: Medical Publishing House; 2018.Search in Google Scholar
[17] Percival SL, Finnegan S, Donelli G, Vuotto C, Rimmer S, Lipsky BA. Antiseptics for treating infected wounds: efficacy on biofilms and effect of pH. Crit Rev Microbiol. 2016;42(2):293–309. 10.3109/1040841X.2014.940495.Search in Google Scholar PubMed
[18] Adewoye TL, Ogunleye OO. Optimization of neem seed oil extraction process using response surface methodology. Optimization. 2012;2:6.Search in Google Scholar
[19] Ghasemi YZ, Taghian Dinani S. Optimization of ultrasound‐assisted enzymatic extraction of walnut kernel oil using response surface methodology. J Food Process Eng. 2018;41(5):e12696. 10.1111/jfpe.12696.Search in Google Scholar
[20] Cheng MH, Zhang W, Rosentrater KA, Sekhon JJK, Wang T, Jung S, et al. Environmental impact analysis of soybean oil production from expelling, hexane extraction and enzyme-assisted aqueous extraction. In 2016 ASABE Annual International Meeting (p. 1). American Society of Agricultural and Biological Engineers; 2016. http://elibrary.asabe.org/azdez.asp?JID=5&AID=46867&CID=orl2016&T=2.Search in Google Scholar
[21] Benchadli A, Mellal T, Attara T, Dali Youcef B, Choukchou-Braham E. Optimization of inhibition efficiencies process of polyvinylpyrrolidone using response surface methodology. Rev Mex Fis. 2022;68(4):041003. 10.31349/revmexfis.68.041003.Search in Google Scholar
[22] He J. Chiral analysis using capillary electrophoresis coupled to mass spectrometry: development of novel modes and applications using molecular micelles and surfactant-bound monolithic columns. Dissertation, Georgia State University; 2011. p. 1–237. 10.57709/2375338.Search in Google Scholar
© 2025 the author(s), published by De Gruyter
This work is licensed under the Creative Commons Attribution 4.0 International License.
Articles in the same Issue
- Research Articles
- Phytochemical investigation and evaluation of antioxidant and antidiabetic activities in aqueous extracts of Cedrus atlantica
- Influence of B4C addition on the tribological properties of bronze matrix brake pad materials
- Discovery of the bacterial HslV protease activators as lead molecules with novel mode of action
- Characterization of volatile flavor compounds of cigar with different aging conditions by headspace–gas chromatography–ion mobility spectrometry
- Effective remediation of organic pollutant using Musa acuminata peel extract-assisted iron oxide nanoparticles
- Analysis and health risk assessment of toxic elements in traditional herbal tea infusions
- Cadmium exposure in marine crabs from Jiaxing City, China: Insights into health risk assessment
- Green-synthesized silver nanoparticles of Cinnamomum zeylanicum and their biological activities
- Tetraclinis articulata (Vahl) Mast., Mentha pulegium L., and Thymus zygis L. essential oils: Chemical composition, antioxidant and antifungal properties against postharvest fungal diseases of apple, and in vitro, in vivo, and in silico investigation
- Exploration of plant alkaloids as potential inhibitors of HIV–CD4 binding: Insight into comprehensive in silico approaches
- Recovery of phenylethyl alcohol from aqueous solution by batch adsorption
- Electrochemical approach for monitoring the catalytic action of immobilized catalase
- Green synthesis of ZIF-8 for selective adsorption of dyes in water purification
- Optimization of the conditions for the preparation of povidone iodine using the response surface methodology
- A case study on the influence of soil amendment on ginger oil’s physicochemical properties, mineral contents, microbial load, and HPLC determination of its vitamin level
- Removal of antiviral favipiravir from wastewater using biochar produced from hazelnut shells
- Effect of biochar and soil amendment on bacterial community composition in the root soil and fruit of tomato under greenhouse conditions
- Bioremediation of malachite green dye using Sargassum wightii seaweed and its biological and physicochemical characterization
- Evaluation of natural compounds as folate biosynthesis inhibitors in Mycobacterium leprae using docking, ADMET analysis, and molecular dynamics simulation
- Novel insecticidal properties of bioactive zoochemicals extracted from sea urchin Salmacis virgulata
- Elevational gradients shape total phenolic content and bioactive potential of sweet marjoram (Origanum majorana L.): A comparative study across altitudinal zones
- Study on the CO2 absorption performance of deep eutectic solvents formed by superbase DBN and weak acid diethylene glycol
- Preparation and wastewater treatment performance of zeolite-modified ecological concrete
- Multifunctional chitosan nanoparticles: Zn2+ adsorption, antimicrobial activity, and promotion of aquatic health
- Comparative analysis of nutritional composition and bioactive properties of Chlorella vulgaris and Arthrospira platensis: Implications for functional foods and dietary supplements
- Growth kinetics and mechanical characterization of boride layers formed on Ti6Al4V
- Enhancement of water absorption properties of potassium polyacrylate-based hydrogels in CaCl2-rich soils using potassium di- and tri-carboxylate salts
- Electrochemical and microbiological effects of dumpsite leachates on soil and air quality
- Modeling benzene physicochemical properties using Zagreb upsilon indices
- Characterization and ecological risk assessment of toxic metals in mangrove sediments near Langen Village in Tieshan Bay of Beibu Gulf, China
- Protective effect of Helicteres isora, an efficient candidate on hepatorenal toxicity and management of diabetes in animal models
- Valorization of Juglans regia L. (Walnut) green husk from Jordan: Analysis of fatty acids, phenolics, antioxidant, and cytotoxic activities
- Molecular docking and dynamics simulations of bioactive terpenes from Catharanthus roseus essential oil targeting breast cancer
- Selection of a dam site by using AHP and VIKOR: The Sakarya Basin
- Characterization and modeling of kidney bean shell biochar as adsorbent for caffeine removal from aquatic environments
- The effects of short-term and long-term 2100 MHz radiofrequency radiation on adult rat auditory brainstem response
- Biochemical insights into the anthelmintic and anti-inflammatory potential of sea cucumber extract: In vitro and in silico approaches
- Resveratrol-derived MDM2 inhibitors: Synthesis, characterization, and biological evaluation against MDM2 and HCT-116 cells
- Phytochemical constituents, in vitro antibacterial activity, and computational studies of Sudanese Musa acuminate Colla fruit peel hydro-ethanol extract
- Chemical composition of essential oils reviewed from the height of Cajuput (Melaleuca leucadendron) plantations in Buru Island and Seram Island, Maluku, Indonesia
- Phytochemical analysis and antioxidant activity of Azadirachta indica A. Juss from the Republic of Chad: in vitro and in silico studies
- Stability studies of titanium–carboxylate complexes: A multi-method computational approach
- Efficient adsorption performance of an alginate-based dental material for uranium(vi) removal
- Synthesis and characterization of the Co(ii), Ni(ii), and Cu(ii) complexes with a 1,2,4-triazine derivative ligand
- Evaluation of the impact of music on antioxidant mechanisms and survival in salt-stressed goldfish
- Optimization and validation of UPLC method for dapagliflozin and candesartan cilexetil in an on-demand formulation: Analytical quality by design approach
- Biomass-based cellulose hydroxyapatite nanocomposites for the efficient sequestration of dyes: Kinetics, response surface methodology optimization, and reusability
- Multifunctional nitrogen and boron co-doped carbon dots: A fluorescent probe for Hg2+ and biothiol detection with bioimaging and antifungal applications
- Separation of sulphonamides on a C12-diol mixed-mode HPLC column and investigation of their retention mechanism
- Characterization and antioxidant activity of pectin from lemon peels
- Fast PFAS determination in honey by direct probe electrospray ionization tandem mass spectrometry: A health risk assessment insight
- Correlation study between GC–MS analysis of cigarette aroma compounds and sensory evaluation
- Synthesis, biological evaluation, and molecular docking studies of substituted chromone-2-carboxamide derivatives as anti-breast cancer agents
- The influence of feed space velocity and pressure on the cold flow properties of diesel fuel
- Acid etching behavior and mechanism in acid solution of iron components in basalt fibers
- Protective effect of green synthesized nanoceria on retinal oxidative stress and inflammation in streptozotocin-induced diabetic rat
- Evaluation of the antianxiety activity of green zinc nanoparticles mediated by Boswellia thurifera in albino mice by following the plus maze and light and dark exploration tests
- Yeast as an efficient and eco-friendly bifunctional porogen for biomass-derived nitrogen-doped carbon catalysts in the oxygen reduction reaction
- Novel descriptors for the prediction of molecular properties
- Special Issue on Advancing Sustainable Chemistry for a Greener Future
- One-pot fabrication of highly porous morphology of ferric oxide-ferric oxychloride/poly-O-chloroaniline nanocomposite seeded on poly-1H pyrrole: Photocathode for green hydrogen generation from natural and artificial seawater
- High-efficiency photocathode for green hydrogen generation from sanitation water using bismuthyl chloride/poly-o-chlorobenzeneamine nanocomposite
- Special Issue on Phytochemicals, Biological and Toxicological Analysis of Plants
- Comparative analysis of fruit quality parameters and volatile compounds in commercially grown citrus cultivars
- Total phenolic, flavonoid, flavonol, and tannin contents as well as antioxidant and antiparasitic activities of aqueous methanol extract of Alhagi graecorum plant used in traditional medicine: Collected in Riyadh, Saudi Arabia
- Study on the pharmacological effects and active compounds of Apocynum venetum L.
- Chemical profile of Senna italica and Senna velutina seed and their pharmacological properties
- Essential oils from Brazilian plants: A literature analysis of anti-inflammatory and antimalarial properties and in silico validation
- Toxicological effects of green tea catechin extract on rat liver: Delineating safe and harmful doses
- Unlocking the potential of Trigonella foenum-graecum L. plant leaf extracts against diabetes-associated hypertension: A proof of concept by in silico studies