Construction and analysis of yarn tension model in the process of electromagnetic weft insertion
-
Chengjun Zhang
 and
Xiangyang Zhou
and
Xiangyang Zhou

Abstract
In recent years, electromagnetic weft insertion has been widely studied due to its excellent speed controllability and low energy consumption. However, the yarn tension in the process of electromagnetic weft insertion is affected by many factors. In order to improve the fabric quality, this study takes three typical yarns, which are wool yarn, cotton yarn, and nylon yarn, as examples to study the yarn tension in the process of electromagnetic weft insertion and explore the variation rules of yarn tension under different materials and different weft insertion speeds. When constructing the yarn tension model, the Levenberg–Marquardt algorithm in ORIGIN software is used for data fitting. The experiment shows that the yarn tensions of the three materials all have maximum values and change positively with the weft insertion speed. In addition, this study establishes a yarn tension model, whose R 2 value exceeds 0.95, indicating a good model fitting effect. And the relationships between the maximum value, average value, standard deviation of tension, and speed are iterated respectively, providing a theoretical basis for the establishment of electromagnetic weft insertion strategies and optimal control.
1 Introduction
In the textile industry, research on yarn tension during the weft insertion process is of crucial significance. Uneven yarn tension will lead to fabric defects, such as barre and skew, which will affect the flatness and appearance of the fabric and also the knit ability of the equipment (i.e., the defect-free rate of the fabric) [1]. Improving the forming quality of the yarn is the key to enhancing manufacturing efficiency and quality. The more accurately the yarn tension is controlled, the corresponding improvement in fabric quality will be achieved [2]. When the yarn tension is too high, it is likely to cause the yarn to break, increasing the breakage rate. Frequent breakages will make the machine stop frequently for splicing; while when the yarn tension is too low, it will lead to the bending and drifting of the weft yarn, resulting in weft loop-off, non-uniform fabric density, poor fabric flatness, and other problems, and finally causing weft shrinkage defects in the fabric [3]. The stability of yarn tension will affect fabric quality, weaving efficiency, and the smooth progress of multiple links in the production process [4]. It can be seen that the research on measuring and analyzing the dynamic variation law of yarn tension, and then controlling the yarn tension and improving the process adaptability is particularly important in the textile manufacturing industry [5,6].
Initially, relevant researchers tended to study the detection techniques of yarn tension, such as the “three-roller” tension detection method for yarn in the direct-contact method, without performing real-time measurement, data collection, and analytical processing on yarn tension [7]. Subsequently, most scholars started to analyze yarn tension from the directions of non-contact measurement, online detection, etc. For example, Abuzade carried out process monitoring and online control of yarn tension in ring spinning and processed yarn tension data in real-time [2]; Mei et al. proposed using image processing technology to perform non-contact measurement of spinning tension and designed and implemented the corresponding test system [8]. Later, some experts turned their attention outside the yarn itself. By studying the loop shape in the production and manufacturing process, they analyzed the variation characteristics of yarn tension indirectly. However, this measurement method is affected by factors such as the shape and size of the yarn package, and the construction of the pre-experimental platform and the post-data processing are rather cumbersome, so its development and popularization are restricted [9–11].
On shuttleless looms, the increase in the weft insertion rate will cause the yarn tension in the weft insertion process to increase. The acceleration of the projectile in a traditional projectile loom can be as high as 680 times the gravitational acceleration within a few milliseconds [12]. Duan used a new sensor to measure yarn velocity on the projectile weaving machine by filtering charge on the yarn and found that static weft yarn tension is positively correlated with duration time of weft flight [13]. Oleynikova and Oleinikov, based on Sulzer shuttleless weaving machine, through experimental research, found that the tension of the weft yarn has a maximum value during the weft insertion process, and it increases with the increase in the distance between the weft thread accumulator and the compensator braking system [14]. Experimental measurements and related research indicate that during the weft insertion process in a traditional projectile loom, the weft yarn tension between the tension compensator and the projectile fluctuates greatly, and the fluctuation is rapid and unsmooth [15]. This technology has potential technical faults and risks during the weft insertion acceleration stage, for example, the weft yarn may suddenly break or fall off from the projectile fixture [16]. However, the electromagnetic weft insertion technology has many advantages such as high energy utilization rate, low weft insertion noise, and easy control [17–19], and has attracted the research attention of many scholars and experts in recent years.
Figure 1 is a schematic diagram of the drafting of the weft yarn during the electromagnetic weft insertion process. The weft yarn is directly released from the fixed yarn package, passes through the weft accumulator, the yarn-guiding hole, and the tension compensator, and then is connected to the shuttle. The weft accumulator is a temporary storage device for the weft yarn unwound from the bobbin before being introduced into the shed. It can supply the weft yarn required for each weft insertion with a fixed length, evenly distribute the weft insertion tension, and reduce the weft-unwinding tension, thereby reducing weft-wise defects and the weft yarn breakage rate. The stator end is made up of laminated silicon-steel sheets DW465-50, on which three-phase windings are wound. After being fed with three-phase alternating current, these windings will generate an alternating magnetic field moving in the weft-insertion direction. Permanent magnets are installed on the mover. The constant magnetic field generated by the permanent magnets interacts with the abovementioned traveling-wave magnetic field. According to Ampere’s force law, the permanent magnets on the mover will be subjected to an electromagnetic force in the linear direction, which is used to pull the shuttle to drive the weft yarn forward into the shed and complete the entire weft insertion process.
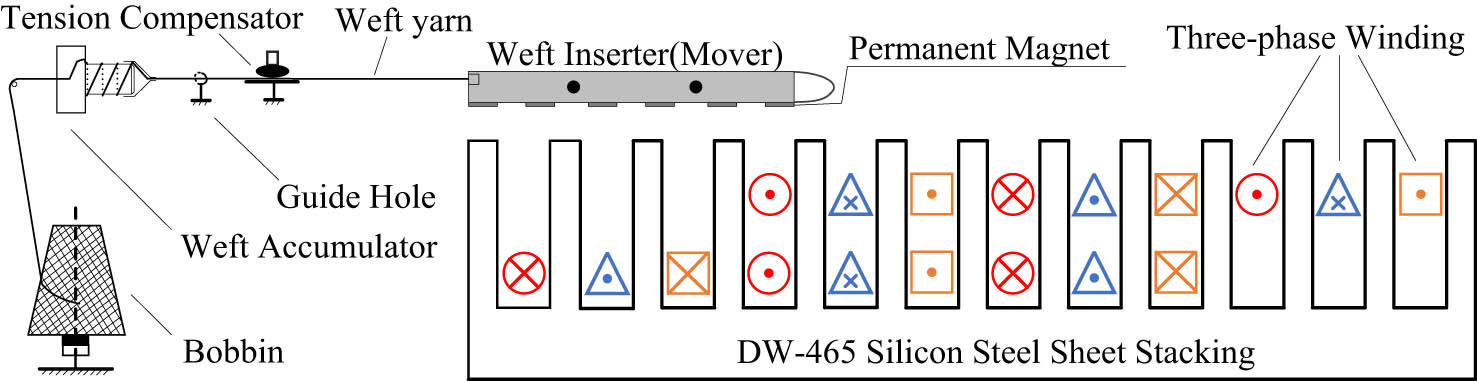
Schematic diagram of weft drafting in the process of electromagnetic weft insertion.
Considering that most of the existing literature studies the yarn tension changes in circular weaving and knitting machines, there are relatively few specific studies on the yarn tension during the electromagnetic weft insertion technology process. In order to provide crucial information for optimizing the weaving process and improving the production quality, this study analyzes yarn tension at different yarn types and weaving speeds. By accurately controlling the yarn tension on the loom, this study provides a valuable experimental basis for reducing defects in actual production.
2 Materials and methods
2.1 Experimental equipment and measurement principles
Considering the representativeness of material characteristics, the universality of industrial applications, and the convenience of comparative research, wool yarn, cotton yarn, and nylon yarn, which are three typical yarns, are used as the weft yarns in the experiment. Wool yarn is relatively soft and has unique elasticity, and its characteristics will have a special influence on the generation and change in tension. Cotton is one of the most commonly used natural fibers in the textile industry and is widely used in various cotton textiles, which is of great significance for studying the variation law of tension at different speeds. Nylon is a synthetic fiber with high strength, wear-resistance, and other characteristics. In sharp contrast to wool yarn and cotton yarn, it can be well used as an object for comparative research.
This study focuses on the influence of electromagnetic force and weft insertion speed on yarn tension during electromagnetic weft insertion. To ensure the accuracy and reliability of the experimental results, it is necessary to strictly control other factors that may interfere with the experimental results, so that the yarn count, air temperature, and ambient humidity remain consistent. The fineness of the yarn used is set at 53 Tex, the air temperature of the experimental environment is maintained at 20°C, and the ambient humidity is stable at 60%.
The range of the JZHL-T1 three-pulley yarn tension sensor (manufactured by Anhui Jinnuo Sensor Engineering Co., Ltd, China) is 10 N, with a precision of 0.1% (i.e.,1 cN), a sensitivity of 1 mV/V, and a frequency of 60 Hz. It is relatively simple in operation and structure and can meet the test requirements. It is mainly used for the dynamic real-time detection of yarn tension during the electromagnetic weft insertion process. As shown in Figure 2, A and C of the tension sensor are fixed pulleys and can only rotate. The strain gauges are integrated in part B and generate displacement under the action of yarn tension. There is a certain functional relationship between the displacement signal of the sensor and the yarn tension T, that is, T = f(F,δ), where δ represents the change in displacement [20]. The digital transmitter converts the tiny analog signal into a digital signal and transmits it to the analysis software in the computer to draw and record the experimental data. At the same time, the change curve of the yarn tension can be exported for data analysis and processing.
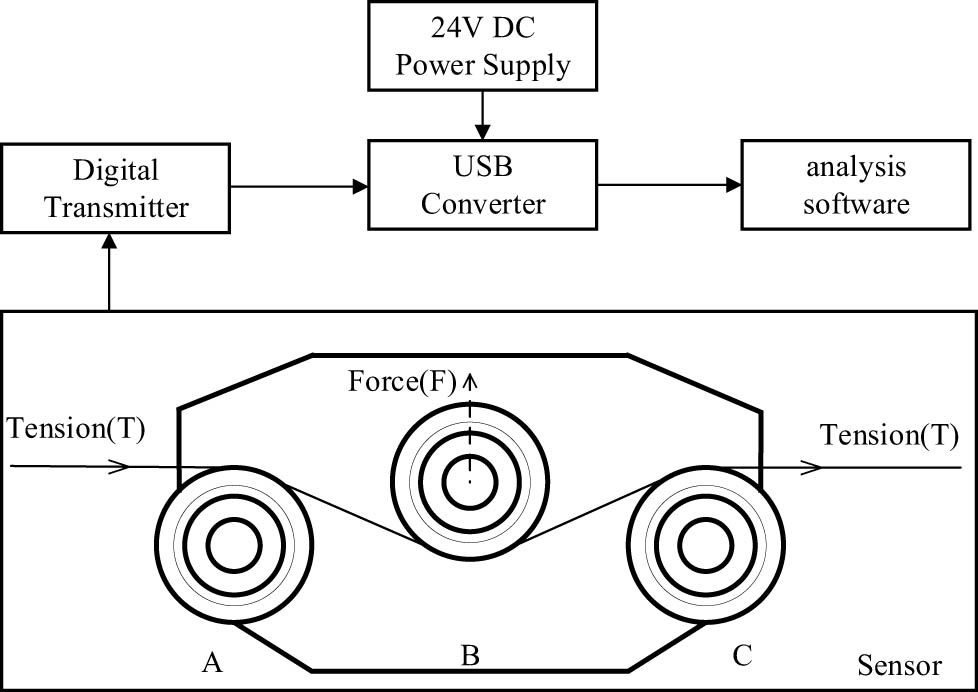
Yarn tension sensing system.
2.2 Construction of the testing system
Due to the extremely short flight time of the projectile during actual electromagnetic weft insertion, it is difficult to continuously and accurately obtain data related to yarn tension. In this study, a simulation device is constructed by using a rotary motor to replace the electromagnetic insertion, and the traction force is provided by winding the weft yarn. From the perspective of mechanical principles, the simulation device and the actual electromagnetic weft induction process has significant similarity. Whether the actual electromagnetic weft insertion drives the weft yarn with electromagnetic force, or the simulation device uses the pulling force generated by the rotating motor to wind the weft yarn, it is essentially to exert external force on the weft yarn to promote its movement. By reasonably setting the key parameters such as the rotational speed and torque of the rotary motor, the movement speed of the yarn and the changing trend of its tension can closely approximate those in the actual electromagnetic weft insertion process. This means that the simulation device can realistically reproduce the movement state of the weft yarn during the weft insertion process, providing a reliable experimental scenario for the study of yarn tension model. The rotary motor has excellent controllability and flexibility in experimental operation. Under the same experimental parameters, yarn tension experiments are carried out several times to minimize experimental errors, ensure that the obtained data are highly consistent and reliable, and improve the accuracy and reliability of the yarn tension model. In summary, the simulation device of weft winding using rotary motor instead of electromagnetic weft insertion has certain effectiveness in the study of yarn tension model in the process of electromagnetic weft insertion, which provides a feasible and reliable experimental means for related research.
The yarn tension measurement system consists of a winding cone, a 550 W speed regulating motor, a tension sensor, a compensator, a yarn bobbin, and other parts. The rotary motor is connected to the winding base through a coupling, and the outside of the winding base is connected to the winding cone. The diameter of the winding cone is 66 mm, as shown in Figure 3. The working process of this measurement system is as follows: change the winding speed of the winding cone by adjusting the knob on the motor control board, so as to set different weft insertion speeds. The weft yarn is unwound from the yarn bobbin, changes its movement direction after passing through the yarn-guiding hole, and then slows down the yarn slackness through the tension compensator. After passing through the three-pulley sensor, the weft yarn will generate a strain-gauge signal corresponding to the tension. This signal passes through the digital signal transmitter, and finally, the curve graph of the yarn tension changing with time can be seen in the analysis software of the upper computer, thus completing the entire yarn tension measurement.
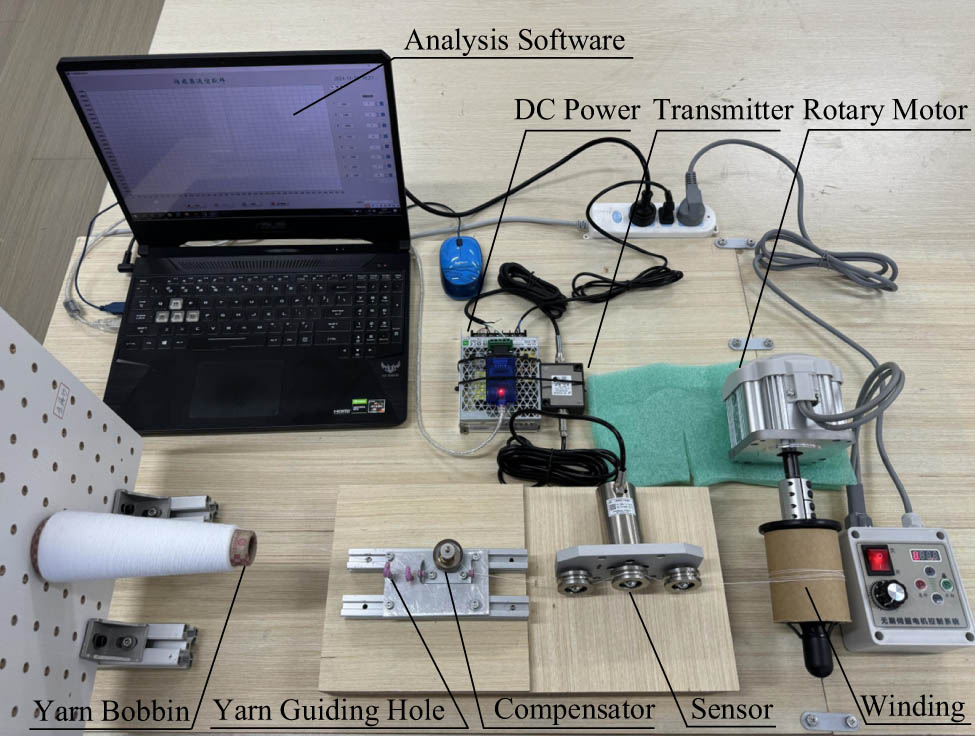
Yarn tension sensing system.
3 Yarn tension model
3.1 Real-time tension measurement
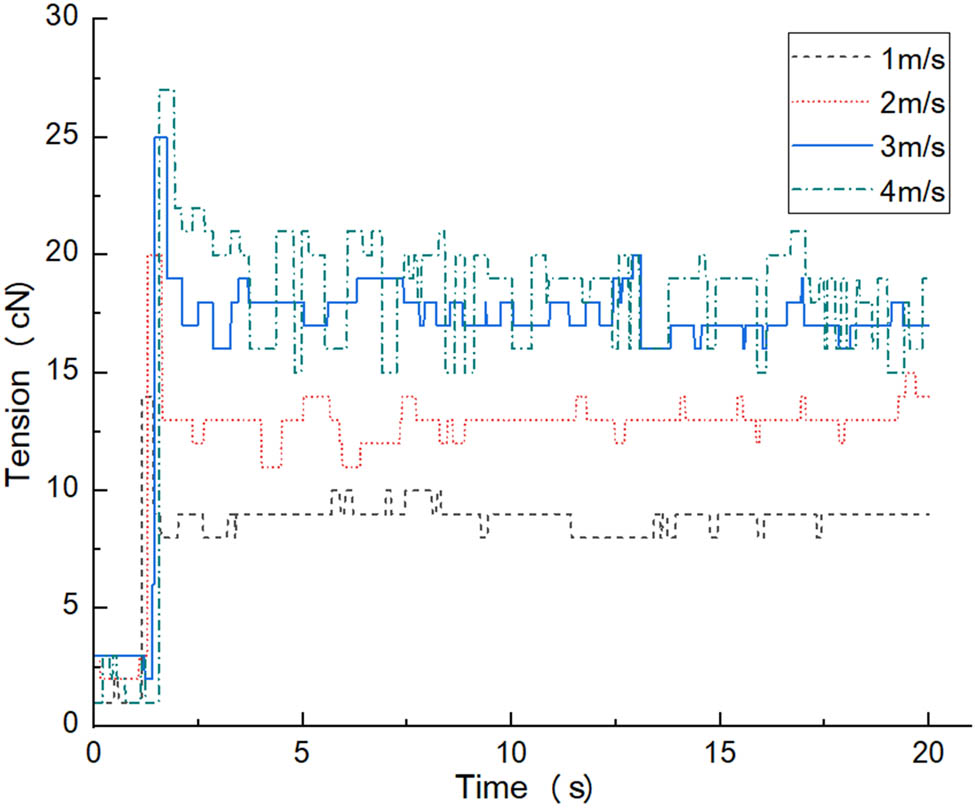
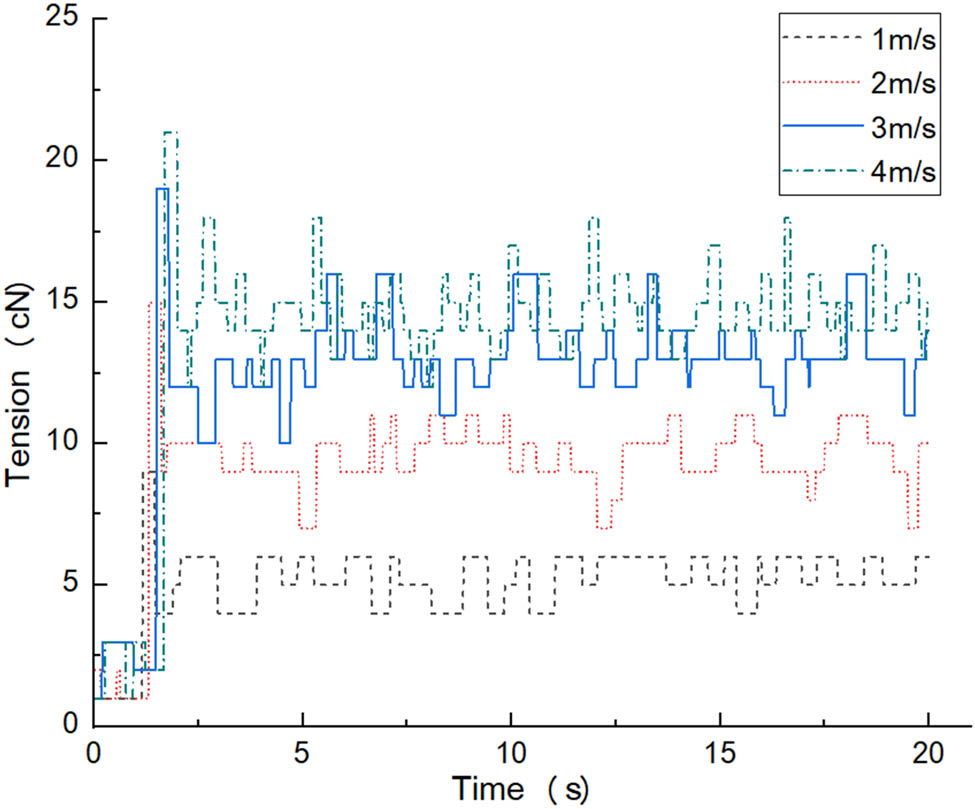
During the electromagnetic weft insertion process, the rotational speeds of the rotary motor are set to 145, 290, 435, 580, 725, 870, 1,015, and 1,160 rpm, respectively. After conversion using the formula V = ω × R, the corresponding linear velocities are 0.5, 1, 1.5, 2, 2.5, 3, 3.5, and 4 m/s, respectively. The data acquisition frequency of the yarn tension is 60 Hz, and the measurement time is set to 20 s. In order to ensure the uniqueness of variables, only the speed is changed according to the set values in each experiment, while factors such as the tightness of the compensator, the relative position between the yarn bobbin and the yarn-guiding hole, and the diameter of the winding cone are all kept unchanged to avoid generating unnecessary tension noise. Through the upper-computer software, the dynamic change curves of the cotton yarn tension during the electromagnetic weft insertion process under eight speed gradients can be obtained, as shown in Figure 4.
The function curves of cotton yarn tension at different speeds.
From Figure 4, the law of yarn tension can be intuitively obtained: as the speed of electromagnetic weft insertion increases, the yarn tension increases, and the fluctuation amplitude and frequency also increase accordingly. It can be seen from the figure that during the weft insertion process at different speeds, there are obvious highest points in the yarn tension, and as the speed increases, the time to reach the maximum value increases. For example, the time at 1 m/s is approximately 1.2 s, and the time at 4 m/s is approximately 1.8 s. The time to reach the highest point is all between 1 and 2 s. This change point is the highest tension value formed by the rotary motor pulling the relatively slack yarn and accelerating in a short time [14]. This stage is called the starting acceleration section. After the tension reaches the maximum value, due to the inertial force and inherent elasticity of the yarn, although there is a tension compensator to relieve it, the yarn will still twitch and vibrate within a certain range, so that the yarn tension always fluctuates even under the condition of uniform speed weft insertion. This state is called the fluctuation section [2].
It is assumed that the frictional force when the yarn passes through the yarn guiding hole in the experiment has the following relationship [21]:
where α is the contact angle and μ is the friction coefficient of the yarn guiding hole.
It is assumed that the yarn exhibits linear elastic properties [21].
where F is the tensile force of the weft yarn, that is, the elongation rate of the yarn, and E is the linear elastic coefficient of the weft yarn. The mass of the stretched weft yarn can be calculated according to the following formula:
where l is the length of the stretched weft yarn, ρ is the mass density of the weft yarn, and A is the cross-sectional area of the stretched weft yarn. In the actual textile industrial production, the mass per unit length of the unstretched part of the yarn is generally called the yarn count [21], which satisfies the following relationship:
Therefore, the mass of each weft yarn can be expressed as follows:
In order to evaluate the law of the fluctuation of the yarn tension curve more accurately, indicators such as the average value, standard deviation, and maximum value are introduced to quantitatively analyze the amplitude of the tension fluctuation during the electromagnetic weft insertion process [20]. The formulas for the average value and standard deviation are shown as follows, where x 1, x 2, …, x n are the measured values of the yarn tension during the electromagnetic weft insertion process, x is the total sample, and the sampling frequency of the three-pulley yarn tension sensor is 60 Hz:
Through data analysis and numerical calculation, three characteristic data of the average value, maximum value, and standard deviation of the cotton yarn tension under eight gradient speeds are obtained, as shown in Table 1.
Characteristic data of cotton yarn tension at different speeds
| Weft insertion speed (m/s) | 0.5 | 1.0 | 1.5 | 2.0 | 2.5 | 3.0 | 3.5 | 4.0 |
|---|---|---|---|---|---|---|---|---|
| Maximum value (cN) | 12 | 14 | 17 | 20 | 23 | 25 | 26 | 27 |
| Average value (cN) | 7.79 | 8.87 | 11.13 | 12.96 | 16.03 | 17.47 | 18.13 | 18.47 |
| Standard deviation (cN) | 1.50 | 2.62 | 3.56 | 4.42 | 4.81 | 5.38 | 5.65 | 5.86 |
The data in the above table were plotted and fitted with the Levenberg–Marquardt (LM) algorithm to obtain the fitted curves as a function of the mean and maximum values of cotton yarn tension, and the standard deviation function fitting curve of the cotton yarn at different speeds are shown in Figure 5.
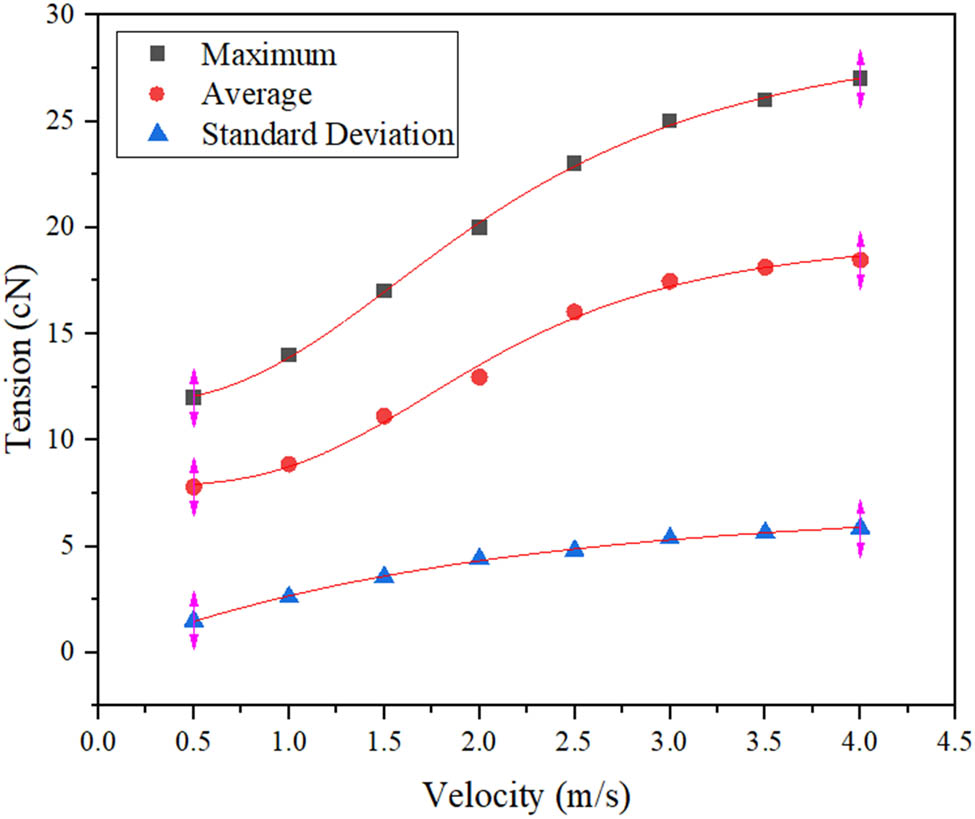
Fitting curves of the average, maximum, and standard deviation functions of cotton yarn tension.
It can be seen from Figure 5 that the weft insertion speed has a positive influence on both the average value and the maximum value of the cotton yarn tension. Linear regression and correlation analysis show that there is a high correlation between the weft insertion speed and the input tension of the cotton yarn. The correlation coefficient value R 2 is greater than 0.99, which indicates that more than 99% of the changes in the cotton yarn tension value can be explained by the explanatory variable (i.e., the weft insertion speed), and the model fitting has a 95% confidence level, excluding the possibility that the weft insertion speed and the cotton yarn tension are unrelated [20]. Use the common S-shaped function logistics to fit and iterate the weft insertion speed and the maximum and average values of the cotton yarn tension. Through the regression equation, the maximum and average values of the input tension of the cotton yarn can be predicted according to the speed of electromagnetic weft insertion. The regression equation of the maximum value fitting curve is
The regression equation of the average value fitting curve is
By analyzing Figure 5, it can be concluded that as the weft insertion speed increases, the standard deviation of the overall cotton yarn tension gradually increases. This once again indicates that during the electromagnetic weft insertion process, the weft insertion speed will have an impact on the cotton yarn tension, and the fluctuation of the cotton yarn tension will increase as the speed increases. Linear regression analysis shows that the correlation coefficient value R 2 is 0.997, that is, 99.7% of the standard deviation of the yarn tension can be explained by the weft insertion speed, and there is a good correlation between them. Use the single exponential function Expdec1 to fit and iterate the standard deviation of the cotton yarn tension. The single exponential function is a nonlinear curve fitting function, which is mainly used to fit single exponential decay curves. The regression equation of the standard deviation fitting curve is
Replace the cotton yarn with wool yarn and repeat the above experimental steps. Sort out the experimental data exported from the upper computer software, and obtain the wool yarn tension function curves during the electromagnetic weft insertion process under eight speed gradients, as shown in Figure 6.
Wool yarn tension function curves at different speeds.
It can be seen from Figure 6 that the tension value, fluctuation amplitude, and frequency of the wool yarn all increase with the increase in speed. Its acceleration time, peak maintaining time, and the law of cotton yarn tension are roughly the same, and there is also a maximum tension value. Since the wool yarn is soft in texture and has strong elasticity, it will have a higher fluctuation frequency compared with the cotton thread. The reason is that the yarn has greater elasticity. When the external conditions change, more energy is stored inside the yarn, and when the energy is released, it will cause a larger tension fluctuation.
The above curve data were calculated and processed, and the average value, maximum value, and standard deviation of wool yarn tension under eight gradient velocities were obtained, as shown in Table 2.
Characteristic data of wool yarn tension at different speeds
| Weft insertion speed (m/s) | 0.5 | 1.0 | 1.5 | 2.0 | 2.5 | 3.0 | 3.5 | 4.0 |
|---|---|---|---|---|---|---|---|---|
| Maximum value (cN) | 7 | 9 | 12 | 15 | 17 | 19 | 20 | 21 |
| Average value (cN) | 4.21 | 5.26 | 7.85 | 9.54 | 11.70 | 13.00 | 14.05 | 14.72 |
| Standard deviation (cN) | 0.68 | 1.34 | 1.87 | 2.37 | 2.81 | 3.18 | 3.50 | 3.78 |
The data in the above table were plotted and fitted with the LM algorithm to obtain the fitted curves as a function of the mean and maximum values of wool yarn tension, and the standard deviation function fitting curve of the wool yarn at different speeds are shown in Figure 7.
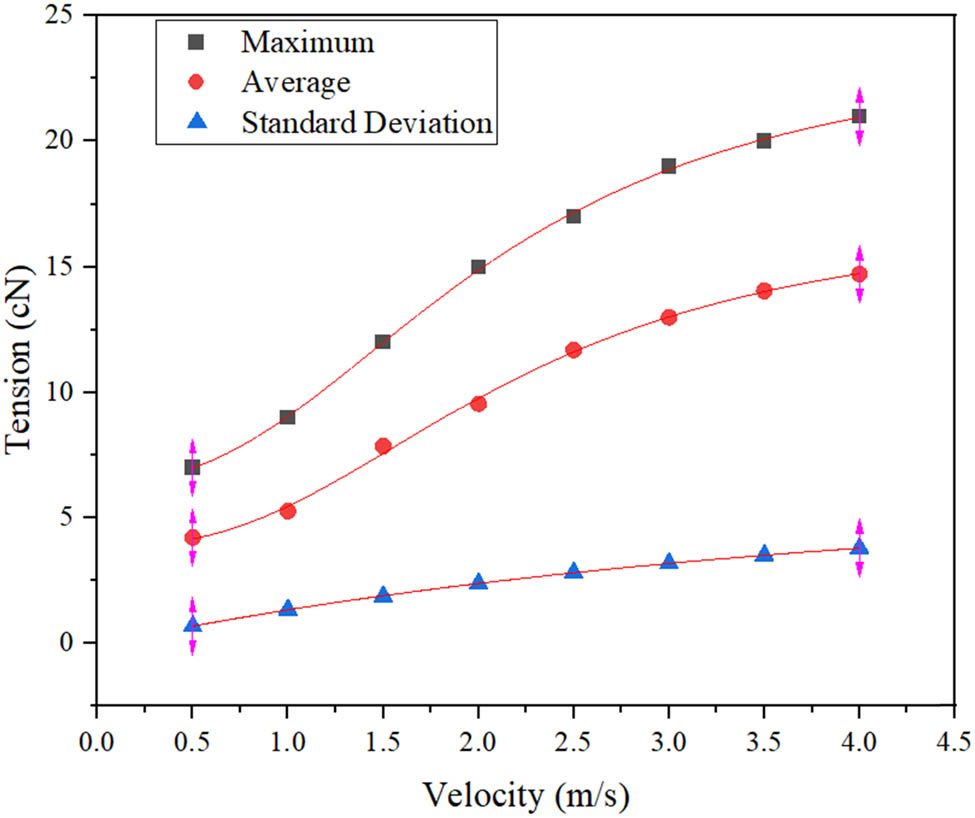
Fitting curves of the average, maximum, and standard deviation tension functions of wool yarn.
Figure 7 shows that the weft insertion speed has a positive influence on both the maximum and average values of the wool yarn tension, and there is a strong correlation between the weft insertion speed and the input tension of the wool yarn, with the correlation coefficient greater than 0.99. Similarly, use the logistics function to fit the maximum and average values of the weft insertion speed and the wool yarn tension. Through continuous iteration in ORIGIN software, the regression equation of the fitting curve of the maximum value of the wool yarn tension is obtained as follows:
The regression equation of the fitting curve of the average value of the wool yarn tension is
Similarly, use the single exponential function Expdec1 to fit and continuously iterate the standard deviation of the wool yarn tension. The regression equation of the fitting curve is
Then, replace the yarn with nylon yarn, which has higher strength and weaker elastic properties, and repeat the above experiment to obtain the nylon yarn tension function curves during the electromagnetic weft insertion process under eight speed gradients, as shown in Figure 8.
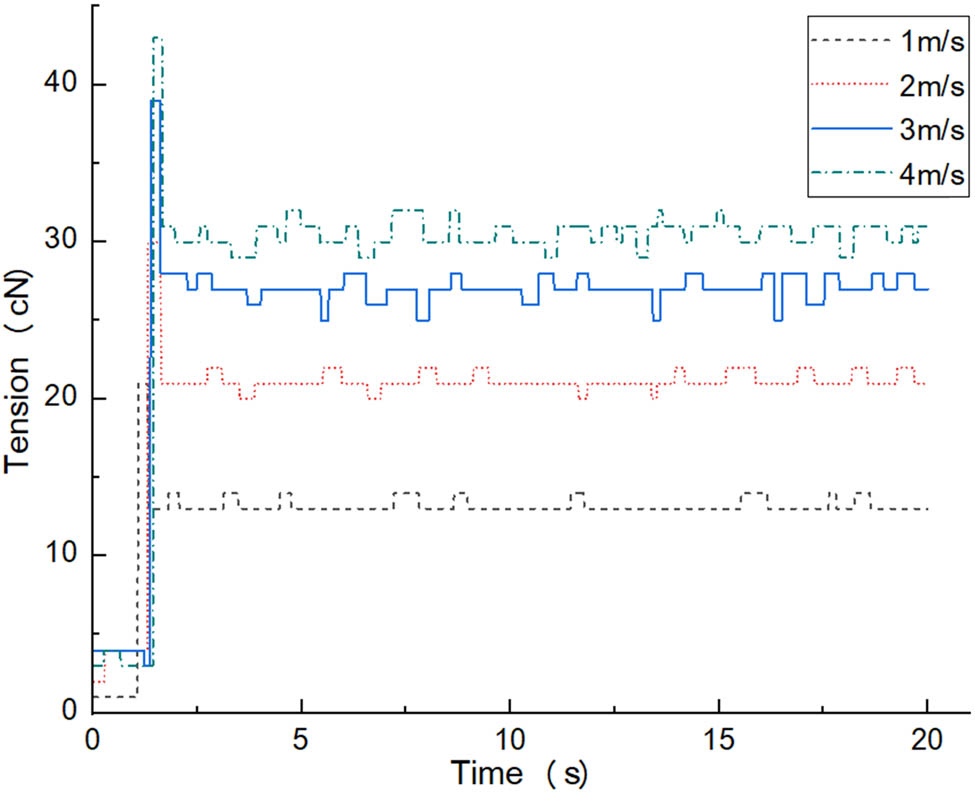
Nylon yarn tension function curves at different speeds.
By comparing and analyzing the waveform data in Figure 8 with the waveform data of wool yarn and cotton yarn, it can be known that the tension value, fluctuation amplitude, and frequency of nylon yarn will also increase as the speed increases, and there also exists a maximum tension value. However, due to the weak elastic properties of nylon yarn, although its yarn tension value is relatively large at various weft insertion speeds, its fluctuation amplitude and frequency are far lower than those of wool yarn and cotton yarn.
The curve data were analyzed, processed, and calculated, and the average value, maximum value, and standard deviation of cotton yarn tension under eight gradient velocities were obtained, as shown in Table 3.
Characteristic data of nylon yarn tension at different speeds
| Weft insertion speed (m/s) | 0.5 | 1.0 | 1.5 | 2.0 | 2.5 | 3.0 | 3.5 | 4.0 |
|---|---|---|---|---|---|---|---|---|
| Maximum value (cN) | 18 | 21 | 25 | 30 | 35 | 39 | 42 | 43 |
| Average value (cN) | 11.89 | 13.18 | 17.07 | 21.15 | 24.14 | 27.07 | 29.23 | 30.51 |
| Standard deviation (cN) | 1.87 | 2.92 | 3.78 | 4.53 | 5.27 | 6.07 | 6.80 | 7.22 |
The data in the above table were plotted and fitted with the LM algorithm to obtain the fitted curves as a function of the mean and maximum values of nylon yarn tension, and the standard deviation function fitting curves at different speeds, as shown in Figure 9.
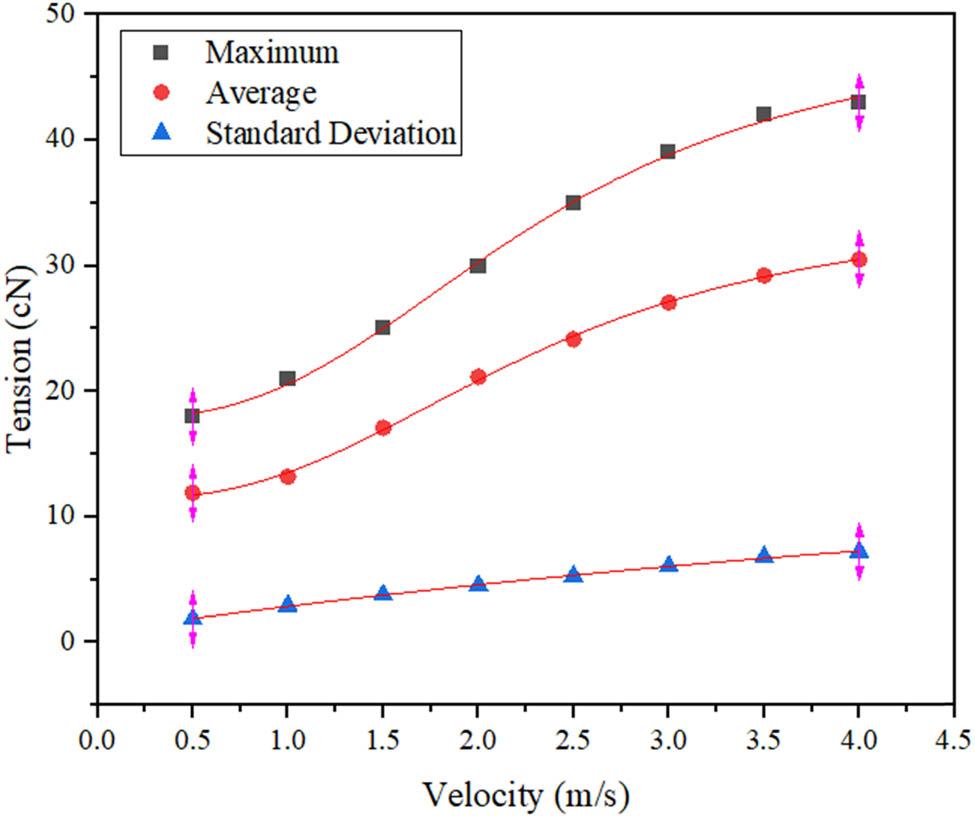
Function fitting curves of the average, maximum, and standard deviation tension functions of nylon yarn tension.
The logistics function was used with the help of ORIGIN software to fit the maximum and average values of the weft insertion speed and nylon yarn tension. After repeated iterations, the regression equation of the fitting curve of the maximum value of nylon yarn tension was obtained as follows:
The regression equation of the fitting curve of the average value of nylon yarn tension is
With the help of the single exponential function Expdec1, the standard deviation of nylon yarn tension was fitted and repeatedly iterated, and the regression equation of its fitting curve was obtained as follows:
3.2 Construction and analysis of yarn tension model
The variation law of yarn tension can be explained and analyzed according to the acceleration of the rotating motor, the system regulation response, and the physical properties of the yarn itself. The tension change in each stage has specific mechanical or dynamic equilibrium reasons. From the above experimental results, it can be found that the difference of yarn material type and speed does not cause the tension model to change. By simplifying the tension variation law, a basic model of yarn tension was proposed. This model is roughly divided into five parts, and the yarn tension variation curve of this basic model in an ideal state was drawn, as shown in Figure 10.
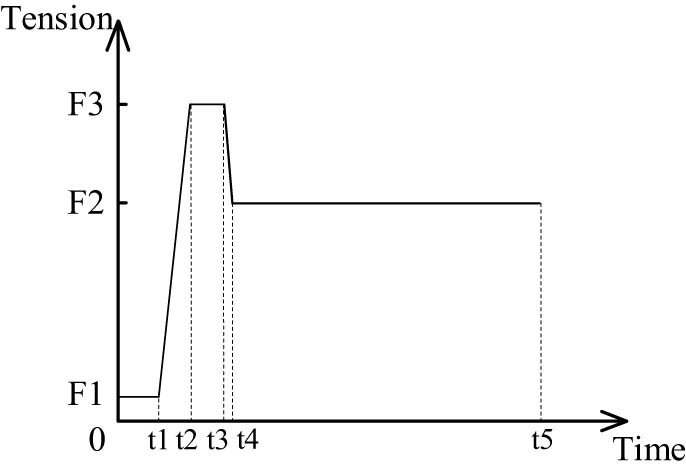
Basic model of yarn tension.
When the weft insertion device has just been started (0 ∼ t 1), the rotating motor has not yet reached a stable operating state, and the yarn is also in a relatively slack state with low tension. Friction will be exerted at multiple contact points such as the yarn guiding hole and the sensor. Due to the inertia of the testing equipment operation and the system not yet fully entering dynamic equilibrium, the yarn tension collected by the three-pulley tension sensor will fluctuate slightly with low tension. The duration of this stage is 1–2 s, and the tension fluctuates within the range of 1–3 cN. This stage is called the initial start-up stage.
When the rotating motor accelerates to a relatively high speed (t 1 ∼ t 2), the yarn is rapidly tightened, and the tension increases rapidly due to the inertia of the yarn. The acceleration of the motor changes the yarn system from a relatively slack state to a stretched state. The elastic property of the yarn causes a slight change in its length, which further increases the tension. At the moment when the motor accelerates, the yarn-guiding hole and the compensator are still unable to fully buffer the change in yarn tension, causing the tension to reach its peak value at a relatively fast speed. The duration of this stage is very short, approximately 0.1 s. This stage is called the electromagnetic weft insertion acceleration stage.
After the yarn tension reaches its peak value (t 2 ∼ t 3), the weft insertion system enters a short-lived equilibrium state. At this time, the rotating motor maintains a relatively high rotational speed, and the response of the compensator to the change in yarn tension is still in a lagging state during this stage. The forces acting on the yarn between the sensor and the winding bobbin reach a dynamic equilibrium, and the tension is maintained near the maximum value (usually 1–2 times the average value) for 0.2–0.3 s. This stage is called the peak maintaining stage.
When the rotating motor reaches a constant speed operation (t 3 ∼ t 4), the yarn tension then enters a relatively stable state. The tension compensator begins to perform its regulating function, alleviating tension fluctuations and reducing the force on the yarn. The vibrations generated during the initial stretching process of the yarn also gradually attenuate, and the yarn tension drops to a stable range. The frictional forces exerted on the yarn at positions such as the yarn-guiding hole, the contact surface of the compensator, and the winding bobbin gradually reach equilibrium with the traction force provided by the motor, causing the tension to fall back. This stage still has a relatively high speed and is called the compensation fallback stage.
After reaching the dynamic equilibrium (t 4 ∼ t 5), due to the characteristics of the yarn such as elasticity and damping, small random vibrations will occur when the yarn is under force, resulting in slight changes in tension. This stage is called the dynamic equilibrium stage.
4 Conclusion
In this study, three typical yarns, wool yarn, cotton yarn, and nylon yarn, were used as test samples. An experimental platform for yarn tension in the electromagnetic weft insertion process is built, and the tension data of various yarns under eight speed gradients are measured. A variation model of yarn tension in the weft insertion process is established, and the maximum value, average value and standard deviation are used to characterize the yarn tension. The following conclusions are drawn:
In the electromagnetic weft insertion process, the faster the speed is, the greater the tension values of various yarns and the magnitudes and frequencies of tension fluctuations will be correspondingly increased.
In the electromagnetic weft insertion process, the yarn tension has a maximum value, which is positively correlated with the weft insertion speed.
When wool yarn, cotton yarn and nylon yarn are used as weft yarns for electromagnetic weft insertion, at the same speed, the yarn tension values increase in turn. The relationship between the average value of yarn tension and the weft insertion speed satisfies the common S-shaped function logistics. With the increase in the weft insertion speed, the growth rate of the average value of yarn tension will increase at first and then gradually decrease.
Influenced by the inertia and elastic characteristics of the yarn, at the same speed, the yarn with a higher elastic coefficient has relatively larger tension fluctuation magnitudes and frequencies. The relationship between the standard deviation of yarn tension and the weft insertion speed satisfies the Expdec1 single exponential function. With the increase in the weft insertion speed, the growth rate of the standard deviation gradually decreases until it finally tends to be stable.
Adanur et al., based on Sulzer shuttleless weaving machine, found that for the control of weft, tension is critical. An increase in the maximum value of yarn tension will result in an increase in the weight of the woven fabric, and an increase in the average value of yarn tension will result in a greater degree of yarn shrinkage [12]. So, in the actual production of weaving, the average yarn tension needs to be controlled within a specific range for different yarn materials. The appropriate insertion speed can be reversed according to the above relationship and combined with the set target tension value, so as to prevent the yarn tension from being too large or too small due to the improper insertion speed. In addition, according to the functional relationship between the standard deviation of yarn tension and the insertion speed, the fluctuation amplitude of yarn tension can be predicted and the yarn pretreatment process can be adjusted when the insertion speed is given, so as to reduce yarn tension fluctuation and fabric defects. For the production of fine fabrics with high requirements for yarn tension stability, yarns with relatively low elasticity coefficients can be prioritized, and parameters such as the weft insertion speed can be precisely controlled according to the corresponding tension relations. When developing new fabric products, the yarn tension under different yarn and weaving speed combinations can also be evaluated in advance to provide a scientific basis for new product design.
Acknowledgments
This work was supported by the Wuhan Applied Basic Frontier Project (2022013988065209) and the Wuhan Knowledge Innovation Special Project (2023010201010115).
-
Funding information: This work was supported by the Wuhan Applied Basic Frontier Project (2022013988065209) and the Wuhan Knowledge Innovation Special Project (2023010201010115).
-
Author contributions: Chengjun Zhang: Project administration, Funding Acquisition; Yi Wang: Writing-Original Draft; Pengwei Liu: Data curation; Chengyuan Li: Software & Editing; Chuqiao Xu: Writing-Review; Xiaoyan Zuo: Numerical analysis; Xiangyang Zhou: Building Models.
-
Conflict of interest: The authors declare that the research was conducted in the absence of any commercial or financial relationships that could be construed as a potential conflict of interest.
-
Data availability statement: No new data were created or analyzed in this study. Data sharing does not apply to this article.
References
[1] Hossain, A. M., Ali, A. R. M. (2018). Effect of machine speed on yarn input tension and ‘on-machine’ course length for a circular weft knitting machine with positive storage feeding. International Journal of Mechanical and Production Engineering Research and Development, 8(1), 339–352.10.24247/ijmperdfeb201838Search in Google Scholar
[2] Abuzade, R. A., Gharehaghaji, A. A., Sadri, S. (2009). Study on the yarn compressive stresses at balloon control ring by signal processing. Mechatronics, 19(7), 1152–1157.10.1016/j.mechatronics.2009.03.006Search in Google Scholar
[3] Su, Z., Gao, C., Liu, Y., Chen, Z., Xu, W., Fang, J., et al. (2023). A novel method for reducing yarn hairiness with dynamic and static friction rollers on the yarn guide. Journal of The Textile Institute, 115(7), 1059–1069.10.1080/00405000.2023.2210978Search in Google Scholar
[4] Ye, G., Wu, W., Chen, R. (1998). Computation and measurement of winding tension in ring spinning. Journal of Donghua University (English Edition), 15(4), 22–26.Search in Google Scholar
[5] Tang, Z. X., Wang, X., Fraser, W. B., Wang, L. (2004). An experimental investigation of yarn tension in simulated ring spinning. Fibers and Polymers, 5(4), 275–279.10.1007/BF02875525Search in Google Scholar
[6] Tang, Z. X., Fraser, W. B., Wang, X. (2007). Modelling yarn balloon motion in ring spinning. Applied Mathematical Modelling, 31(7), 1397–1410.10.1016/j.apm.2006.03.031Search in Google Scholar
[7] Narayana, V. P. S. (2005). Novel method for dynamic yarn tension measurement and control in direct cabling process[D], Ph.D., North Carolina State University, USA.Search in Google Scholar
[8] Mei, S., Song, Z., Zhang, Z. (2004). Method and system for measuring spinning yarn tension using image measuring technique. Journal of Shanghai University, 8, 153–159.Search in Google Scholar
[9] Sonntag, E. (1993). The use of computer-aided measuring technology for ring spinning process system analysis. I. Sensory analysis. Melliand Textilberichte, 74(12), 1207–1212 + E402–E404 (7 pages).Search in Google Scholar
[10] Chiu, S. H., Lu, C. P. (2005). Noise separation of the yarn tension signal on twister using FastICA. Mechanical Systems and Signal Processing, 19(6), 1326–1336.10.1016/j.ymssp.2005.02.005Search in Google Scholar
[11] Banitalebi, H., Rafeeyan, M. (2013). A new approach for non contact measuring of tension in fixed and moving wires. International Journal of Advanced Design and ManufacturingTechnology, 5(4), 51–57.Search in Google Scholar
[12] Adanur, S., Mohamed, M. H. (1991). Analysis of yarn tension in air-jet filling insertion. Textile Research Journal, 61(5), 259–266.10.1177/004051759106100503Search in Google Scholar
[13] Duan, J. R. (2013). Analysis of weft yarn velocity on the projectile weavingmachine. Journal of Xi’an Polytechnic University, 6, 711–718.Search in Google Scholar
[14] Oleynikova, L., Oleinikov, V. (2016). Weft thread tension during filling insertion process on projectile weaving machines. Científica, 20(2), 83–91.10.46842/ipn.cien.v20n2a04Search in Google Scholar
[15] Oleinikova, L. N., Oleinikov, V. V. (2005). Motion of a thread with a jerk: Theory and experiment. Journal of The Textile Institute, 96(6), 381–388.10.1533/joti.2005.0019Search in Google Scholar
[16] Adanur, S., (2019). Handbook of weaving[M], CRC Press, Boca Raton, Florida.Search in Google Scholar
[17] He, Y., Xu, Q., Mei, S., Cui, X., Chen, Z., Tang, X. (2022). Structural design and optimization of DC excitation coil for electromagnetic launch weft insertion. Journal of The Textile Institute, 114(12), 1835–1843.10.1080/00405000.2022.2149688Search in Google Scholar
[18] He, Y., Li, D., Zhang, H., Xu, Q., Mei, S., Zhang, Z., et al. (2023). Dynamic prediction model of segmented combined electromagnetic launch weft insertion for super-wide width industrial fabrics. Journal of Industrial Textiles, 53, 152808372311736.10.1177/15280837231173602Search in Google Scholar
[19] Luo, S. M., Zhang, B., Tian, L., Ma, Z. H. (2012). Study of a electromagnetic weft insertion in textile machine. Advanced Materials Research, 591–593, 498–501.10.4028/www.scientific.net/AMR.591-593.498Search in Google Scholar
[20] Zhao, B., Cong, H., Wu, G. (2021). Construction and system realization of the yarn tension model of fully fashioned flat knitting fabric. Textile Research Journal, 91(11–12), 1380–1388.10.1177/0040517520982386Search in Google Scholar
[21] Pusch, T., Wünsch, I., Offermann, P. (2000). Dynamics of yarn tension on knitting machines. Autex Research Journal, 1(2), 54–63.10.1515/aut-2000-010202Search in Google Scholar
© 2025 the author(s), published by De Gruyter
This work is licensed under the Creative Commons Attribution 4.0 International License.
Articles in the same Issue
- Study and restoration of the costume of the HuoLang (Peddler) in the Ming Dynasty of China
- Texture mapping of warp knitted shoe upper based on ARAP parameterization method
- Extraction and characterization of natural fibre from Ethiopian Typha latifolia leaf plant
- The effect of the difference in female body shapes on clothing fitting
- Structure and physical properties of BioPBS melt-blown nonwovens
- Optimized model formulation through product mix scheduling for profit maximization in the apparel industry
- Fabric pattern recognition using image processing and AHP method
- Optimal dimension design of high-temperature superconducting levitation weft insertion guideway
- Color analysis and performance optimization of 3D virtual simulation knitted fabrics
- Analyzing the effects of Covid-19 pandemic on Turkish women workers in clothing sector
- Closed-loop supply chain for recycling of waste clothing: A comparison of two different modes
- Personalized design of clothing pattern based on KE and IPSO-BP neural network
- 3D modeling of transport properties on the surface of a textronic structure produced using a physical vapor deposition process
- Optimization of particle swarm for force uniformity of personalized 3D printed insoles
- Development of auxetic shoulder straps for sport backpacks with improved thermal comfort
- Image recognition method of cashmere and wool based on SVM-RFE selection with three types of features
- Construction and analysis of yarn tension model in the process of electromagnetic weft insertion
- Influence of spacer fabric on functionality of laminates
- Design and development of a fibrous structure for the potential treatment of spinal cord injury using parametric modelling in Rhinoceros 3D®
- The effect of the process conditions and lubricant application on the quality of yarns produced by mechanical recycling of denim-like fabrics
- Textile fabrics abrasion resistance – The instrumental method for end point assessment
- CFD modeling of heat transfer through composites for protective gloves containing aerogel and Parylene C coatings supported by micro-CT and thermography
- Comparative study on the compressive performance of honeycomb structures fabricated by stereo lithography apparatus
- Effect of cyclic fastening–unfastening and interruption of current flowing through a snap fastener electrical connector on its resistance
- NIRS identification of cashmere and wool fibers based on spare representation and improved AdaBoost algorithm
- Biο-based surfactants derived frοm Mesembryanthemum crystallinum and Salsοla vermiculata: Pοtential applicatiοns in textile prοductiοn
- Predicted sewing thread consumption using neural network method based on the physical and structural parameters of knitted fabrics
- Research on user behavior of traditional Chinese medicine therapeutic smart clothing
- Effect of construction parameters on faux fur knitted fabric properties
- The use of innovative sewing machines to produce two prototypes of women’s skirts
- Numerical simulation of upper garment pieces-body under different ease allowances based on the finite element contact model
- The phenomenon of celebrity fashion Businesses and Their impact on mainstream fashion
- Marketing traditional textile dyeing in China: A dual-method approach of tie-dye using grounded theory and the Kano model