Personalized design of clothing pattern based on KE and IPSO-BP neural network
-
Daoling Chen
 und
Pengpeng Cheng
und
Pengpeng Cheng

Abstract
In order to improve the precision of clothing development of fast fashion brands, consumers’ sense of experience, and brand loyalty, a design method of clothing pattern is proposed by combining Kansei engineering theory and improved particle swarm optimization (IPSO)–back propagation neural network (BPNN) model. First, based on the theory of Kansei engineering, the perceptual image experiment of clothing patterns was designed, and the mean value of perceptual image evaluation of clothing patterns by young consumers was obtained through an online questionnaire survey. Second, based on the IPSO and the BPNN, the nonlinear correlation mapping model between the design elements of clothing pattern and consumers’ perceptual image is established. Finally, based on the calculation of target image weight by analytic hierarchy process (AHP) method and IPSO-BPNN model, the optimal combination of clothing pattern design elements under the requirement of multi-target image is output. Taking the paper-cut pattern of sweater shirt as an example, the feasibility of this research method is verified. The research not only helped the designer to design a costume pattern that meet the individual emotional needs of consumers, but also provided a clear design index and reference, and made the costume design process more targeted, precise, and intelligent.
1 Introduction
With the advancement of science and technology and the development of society, the trend of global economic integration is becoming more and more obvious, and the pace of product iteration and updating is also accelerating. Therefore, people’s consumption concepts and consumption methods have also undergone tremendous changes. Nowadays, when consumers purchase products, they not only satisfy basic functions but also pay attention to individuality, fashion, and emotional needs [1,2]. Different from traditional clothing, fast fashion brands are cultural brands with “fashion” as their attitude and “culture” as their core. Young people use fast fashion clothing to express their youthful personality and display their unique aesthetic preferences. The consumption of fast fashion brands is fundamentally a result of young people’s identification with brand culture and their choice of positioning their own cultural identity. As a fast fashion brand, it naturally pays more attention to designing products that cater to consumers’ psychological expectations in order to enhance the competitiveness of its products. In fashion design, pattern is one of the most eye-catching elements in appearance design, which directly affects consumers’ purchasing psychology [3]. The inherent aesthetic characteristics of clothing patterns can attract consumers’ attention and promote clothing sales. At the same time, its unique attributes convey certain emotional meanings to the audience and trigger the audience’s emotional response. The special business model of fast fashion brands requires that clothing products be designed, produced, and sold quickly. At such a fast pace, how to achieve clothing pattern design that meets the emotional needs of consumers and design clothing products that cater to consumers’ psychological expectations has become a problem that needs to be solved urgently.
With the transformation of the production model of clothing enterprises, the widespread application of personalized customization models has strengthened the user-driven nature of clothing design. It has gradually become an industry consensus to carry out design practice activities based on the personalized needs of users. However, traditional clothing design is mostly led and executed by designers, following the design method under a fixed process, and the degree of user participation is relatively limited. The design result depends on the designer’s perceptual thinking and experience accumulation, and there is a certain deviation from the user’s demand, which cannot achieve the cognitive match between the designer and the user, and obtain the clothing products with a high degree of personalization. Therefore, it is essential to clearly understand the emotional needs of consumers and integrate them into fashion design, which can help designers design clothes that are popular with consumers and meet the real needs of the public [4,5]. However, the emotional needs of consumers are complex, a highly cohesive deep psychological and emotional activity, full of ambiguity and uncertainty, and the extraction of consumer emotional needs has always been a difficult problem.
Perceptual image is subjective and emotion-driven. It is the overall impression people form of a product through their five senses and cognitive activities. It reflects the user’s preference for the product and evaluation criteria. It is a synthesis of the user’s intuition and thinking reaction and is the basic way for people to recognize the product [6,7]. Since the perceptual image of a product is the sensory response and intuitive association generated by users with their own senses, it fully conveys the emotional needs of users and the evaluation criteria of the product, and is an important medium for designers to accurately grasp the real feelings and expected images of users and understand the emotional cognition of users on the product [8]. However, for a long time, consumers’ perceptual image of products involves complex psychological feelings and psychological changes, full of ambiguity and uncertainty, so it is always a difficult problem to extract the law of consumer feeling. In the face of the current consumption trend and research status, Kansei's engineering theory can provide an effective solution to this problem.
Kansei engineering is a customer demand-oriented product development technology, and it is an engineering technology meant to transform customer feelings and images into design elements. It mainly studies how to apply human feeling, perception, emotion, and other factors to product design, combining psychology, ergonomics, computer science, and other disciplines, so as to meet the deep emotional needs of users [9,10]. Kansei engineering technology is relatively mature in Japan and has been widely used in many fields such as home appliances, machinery, and automobiles, bringing considerable profits to the industry. With the development of Kansei engineering becoming more and more mature, more and more scholars are devoted to exploring the perceptual value of textile and garment products. A variety of clothing elements need to be considered in the process of fashion design, among which the application of Kansei engineering can be roughly divided into the following three aspects: (1) perceptual research on fashion styles, (2) perceptual research of clothing color, and (3) perceptual research of clothing fabrics. The style of clothing is the unity of all design elements, which can bring consumers direct psychological feelings. Many researchers have carried out perceptual evaluation studies on suits, vests, dresses, cheongsam, bras, and other clothing, so as to understand consumers’ perceptual cognition and demand preferences, and then determine the best clothing style design [11,12,13,14,15]. As one of the three elements of fashion design, color has attracted the attention of designers and researchers, and launched the emotional experience and feeling evaluation of modern consumers on clothing color, and understood and mastered the perceptual characteristics of clothing color, which helps designers and consumers to match clothing color more reasonably [16,17]. Fabric is the material body of clothing. With the gradual improvement of life quality, consumers’ demand for clothing fabrics is also gradually moving toward sensibility, requiring clothing fabrics to bring comfort to consumers while having higher aesthetic appearance value. In order to identify the aesthetic characteristics of fabrics of different materials, researchers have expanded the relationship function between the sensory image of yarn-dyed fabrics for shirts, tweed fabrics, and other clothing fabrics of different materials and the preferences of subjects, so as to facilitate designers to grasp the perceptual information implied by different fabrics [18,19,20].
The pattern of clothing is varied, and different patterns have an obvious influence on the style and perceptual image of clothing. At present, the perceptual research of clothing patterns mainly focuses on simple geometric patterns such as stripes, plaid, polka dots, etc., in terms of pattern types, the perceptual research of complex patterns is lacking, resulting in insufficient depth and perfection of the perceptual research system of clothing patterns [21,22,23]. In terms of the research content, it mainly discusses consumers’ emotional response to clothing patterns and extracts the main factors affecting the perceptual image of patterns. The lack of in-depth analysis of the corresponding relationship between pattern design elements and consumers’ emotional psychology leads to the inability to connect consumers’ tacit knowledge with pattern design knowledge, and the practical application value of the research results is limited [24]. In terms of research methods, most of them extract perceptual factors through factor analysis, determine the importance of factors by using triangular fuzzy number and gray relational degree analysis, and use partial least squares method, quantitative type I theory, etc. to establish mathematical models to simplify and quantify complex psychological phenomena [25,26,27]. Since consumers’ emotional demands themselves have great uncertainty and ambiguity, the above quantitative analysis methods are difficult to accurately grasp consumers’ emotional demands for clothing patterns.
In Kansei engineering research, artificial intelligence technology can well deal with the fuzzy relationship between consumers’ subjective information and objective indicators, solve various fuzzy problems, and transform fuzzy perceptual needs into definite perceptual values. At present, artificial intelligence methods are used in many fields to carry out perceptual research. Back propagation neural network (BPNN) is an artificial neural network trained on the backpropagation (BP) algorithm, which can calculate the error between the network output and the actual target and backpropagate it, constantly adjusting the network weight to reduce the error until it meets the preset criteria. BPNN has the characteristics of strong nonlinear mapping ability and parallel information processing ability and can learn and store the mapping relationship between input and output [28,29,30]. Compared with Class I of quantitative theory, BPNN does not need to be limited to the hypothesis of linear relationship and the hypothesis of mutual independence of variables, which is less restrictive in research, and can establish a nonlinear correlation model between design elements and perceptual image of products, improve user satisfaction through quantitative research. For example, Misaka and Aoyama studied the relationship between the crack pattern and the perceptual image of the cup by using NNs after analyzing the perceptual image data of the crack pattern. By modeling the actual crack generation mechanism, a system meeting the requirements of users was generated [31]. Wang et al. built a correlation model between user preference and perceptual cognition of pattern through BPNN, and conducted a multidimensional discussion on the selection of clothing patterns [32].
Although BPNN has the strong nonlinear fitting ability and generalization ability, it also has some disadvantages such as long training time, slow convergence speed, easy falling into local optimal solution, and difficulty in determining the hidden layer number. At the same time, BPNN is sensitive to the selection of parameters such as initial weight and learning rate, which needs to be repeatedly tested and adjusted, and the degree of automation is not high, which is difficult to deal with complex problems [33,34]. In view of the above shortcomings, many researchers have proposed improvement strategies. In the optimization process of the improved BPNN algorithm, compared with other commonly used optimization algorithms (such as traditional gradient descent method, genetic algorithm [GA], simulated annealing, etc.), the improved particle swarm optimization (IPSO) algorithm shows a series of unique advantages. First, IPSO is a global optimization algorithm that can effectively avoid the local optimal problem commonly seen in the BP network training process. The traditional gradient descent method usually relies on gradient information for updating, and it is easy to fall into the local optimality in the optimization problem of non-convex functions, resulting in an unsatisfactory optimization effect [35]. Second, compared with the GA, IPSO has fewer hyperparameter adjustment requirements [36]. Finally, IPSO has strong adaptability and flexibility. Compared with algorithms such as simulated annealing, IPSO has lower computational complexity and can converge to a better solution in a shorter time [37]. For example, Bai et al. established a ship trajectory prediction model combining IPSO and BPNN, and used ship historical sailing trajectory data to predict future ship movement [38]. Shen and Ji used this method to propose a standard sewing time prediction model [39].
In general, Kansei engineering, as a translation technology of “sensitivity-image-design elements,” can help guide the design of clothing products that are more in line with consumer preferences and emotional experiences, and plays an important role in the clothing field. However, the current Kansei engineering research in the field of clothing pattern design does not focus on the Kansei engineering of paper-cut patterns and lack of research on the implicit correlation between clothing pattern modeling characteristics and perceptual images, and does not establish a mathematical model of clothing pattern evaluation and design, so it is impossible to construct a clothing pattern design system with rational logic. Therefore, this article takes the paper-cut pattern of sweater shirt as an example and proposes a personalized design method of clothing patterns based on Kansei engineering and IPSO-BPNN. By exploring the implicit knowledge between consumers’ emotional needs and paper-cut pattern design, as well as the calculation of intelligent models, the optimal combination of clothing pattern design elements under the diversified and personalized emotional needs of consumers is recommended, to help designers improve design efficiency and design satisfaction.
2 Research process
Taking the paper-cut pattern of sweater shirt as an example, this article researches the design of clothing patterns based on Kansei engineering and IPSO-BPNN. The research is divided into three steps. First, the perceptual evaluation of representative clothing patterns by young consumers is obtained through the perceptual image experiment of clothing patterns. This step is important because it ensures that the design process is in line with consumers’ preferences and provides a basis for subsequent design. Second, the IPSO-BPNN model is constructed and verified by simulation. The key to this step is that the IPSO-BP model combines the IPSO algorithm and the BP neural network, which improves the effect of the model in design parameter optimization and ensures that the model can accurately reflect consumers’ perceptual preferences. Finally, the model is combined with analytic hierarchy process (AHP) and weighted sum method to seek intelligent recommendations of clothing pattern design scheme under the multi-objective image of consumers, and design practice and evaluation of the recommended scheme are carried out to further verify the reliability and effectiveness of the proposed method. This step solves the problem of consumers’ diverse preferences, provides a balanced design scheme, and verifies the reliability and effectiveness of the method through design practice and evaluation. These three steps together achieve the goal of this research: to develop a clothing pattern design method that can both meet consumers’ emotional needs and be practical by combining perceptual engineering and intelligent models. The research process of this article is shown in Figure 1.
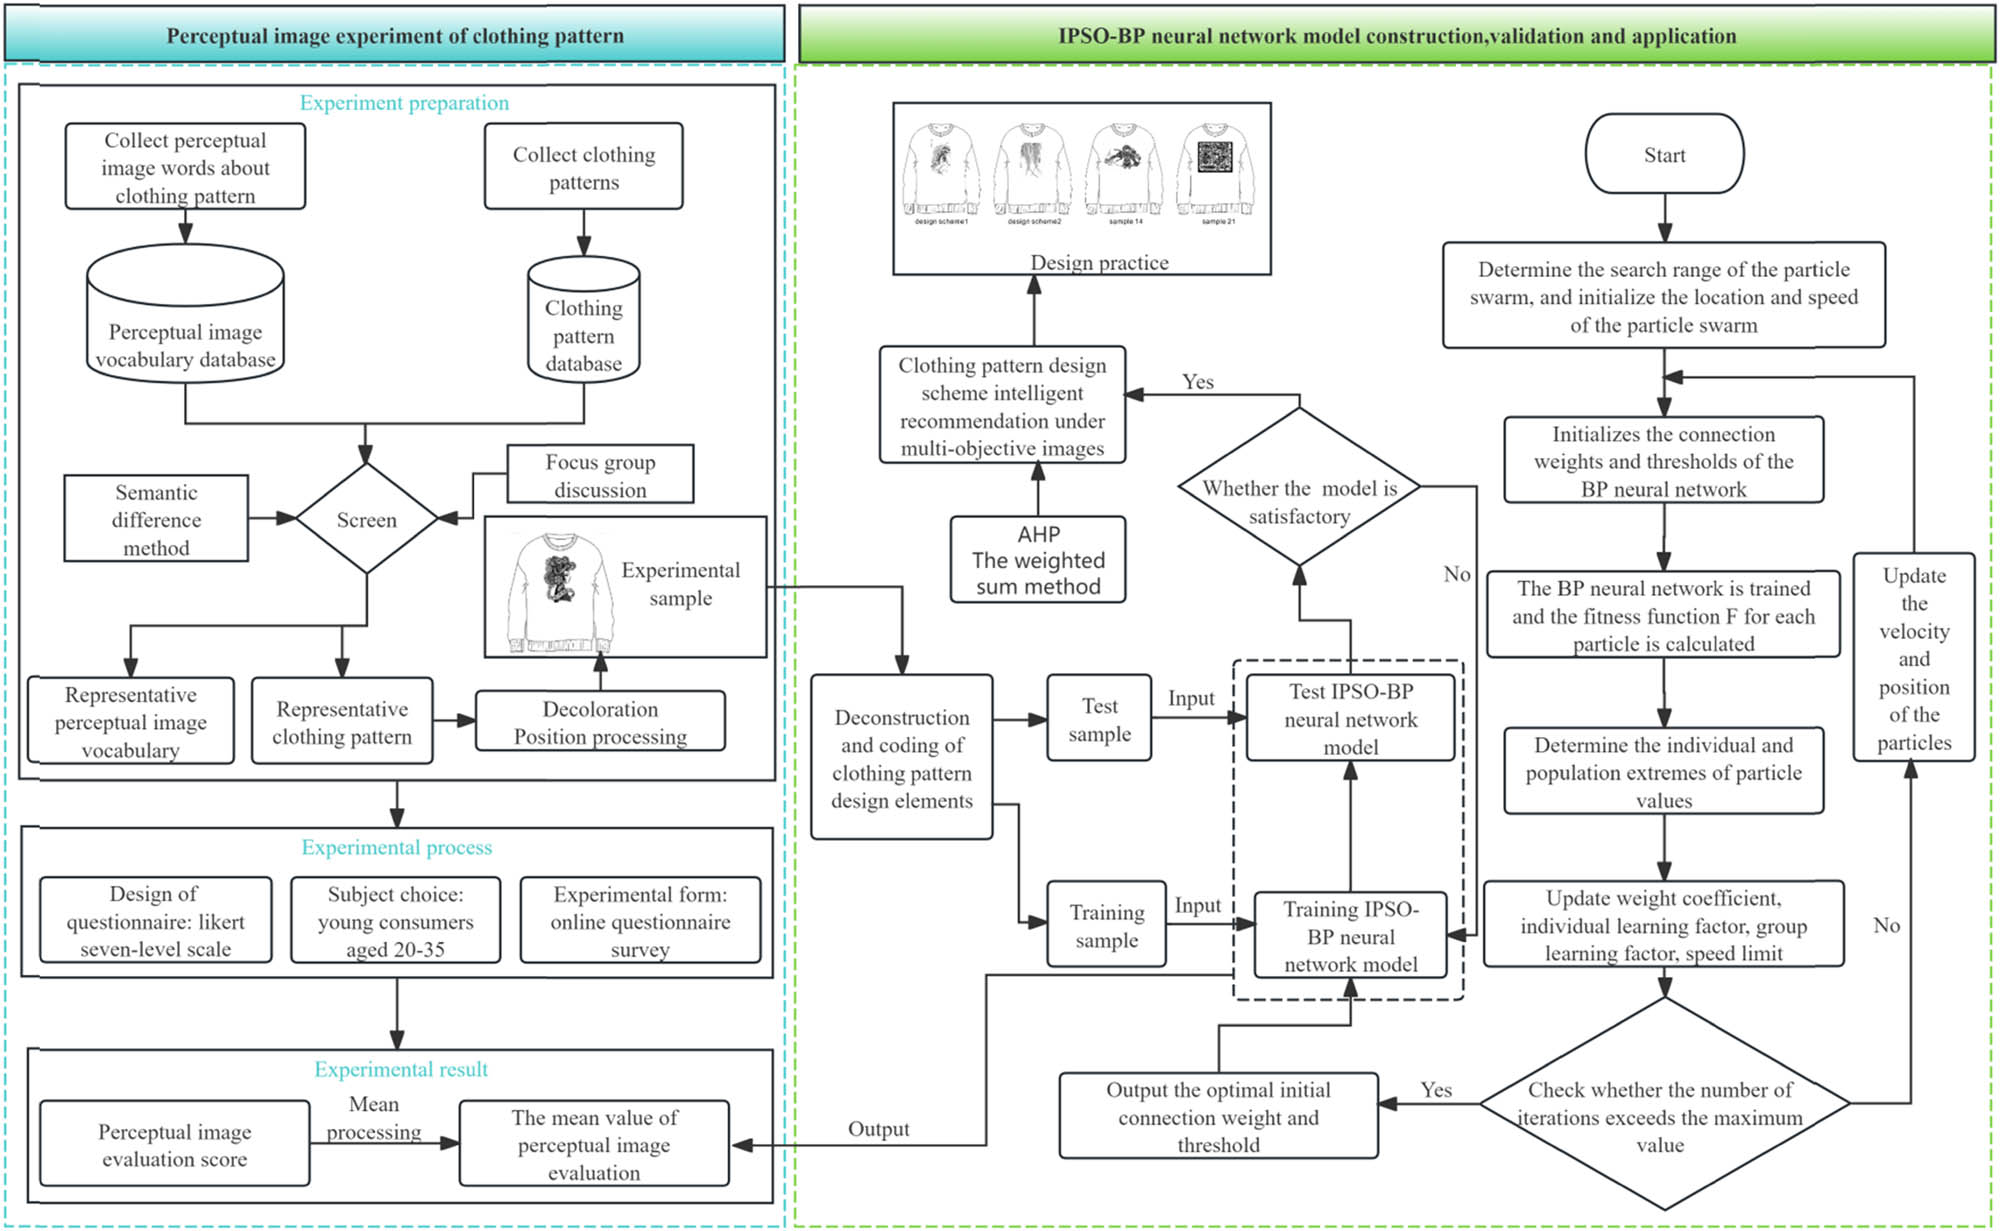
Research flow chart.
3 Perceptual image experiment of clothing pattern
3.1 Selection of perceptual image words
Through consulting relevant literature and using an octopus harvester to collect thousands of comments on clothing on e-commerce platforms such as Jingdong and Taobao, the perceptual image words related to clothing patterns were collected, and 126 groups of perceptual words were obtained. First, according to the semantic difference method in Kansei Engineering, the perceptual image words with similar meanings are deleted. Second, the research object of this article is clothing pattern, and the words inconsistent with the perceptual image of clothing pattern are eliminated. Finally, six field experts, scholars, and practitioners were invited to form focus groups for discussion, and according to the relevance and importance of clothing pattern design and perceptual images, the image words were scored using the 1–7 scale method, and the top three words were screened out, namely simple – complex, modern – tradition, and unique – ordinary.
3.2 Clothing pattern screening and stimulus image production
The application of paper-cut patterns in clothing adds a unique artistic sense to clothing and is loved by modern consumers. However, there are a variety of paper-cut patterns, and some patterns are very similar, so it is necessary to screen out some representative paper-cut patterns as test patterns. Through the field investigation of the paper-cut inheritors and the collation of paper-cut related documents and pictures, more than 200 paper-cut pictures were collected, and the pictures such as fuzzy picture and poor angle were initially screened out. Then, focus group members were invited to select representative samples, and samples that were selected more than 4 times were used as experimental samples, and finally 24 representative samples were obtained. At the same time, in order to avoid the influence of color, clothing style, and other factors on perceptual image evaluation, the representative samples were uniformly decolorized and placed in the front center position of the sweater shirt, as shown in Figure 2.
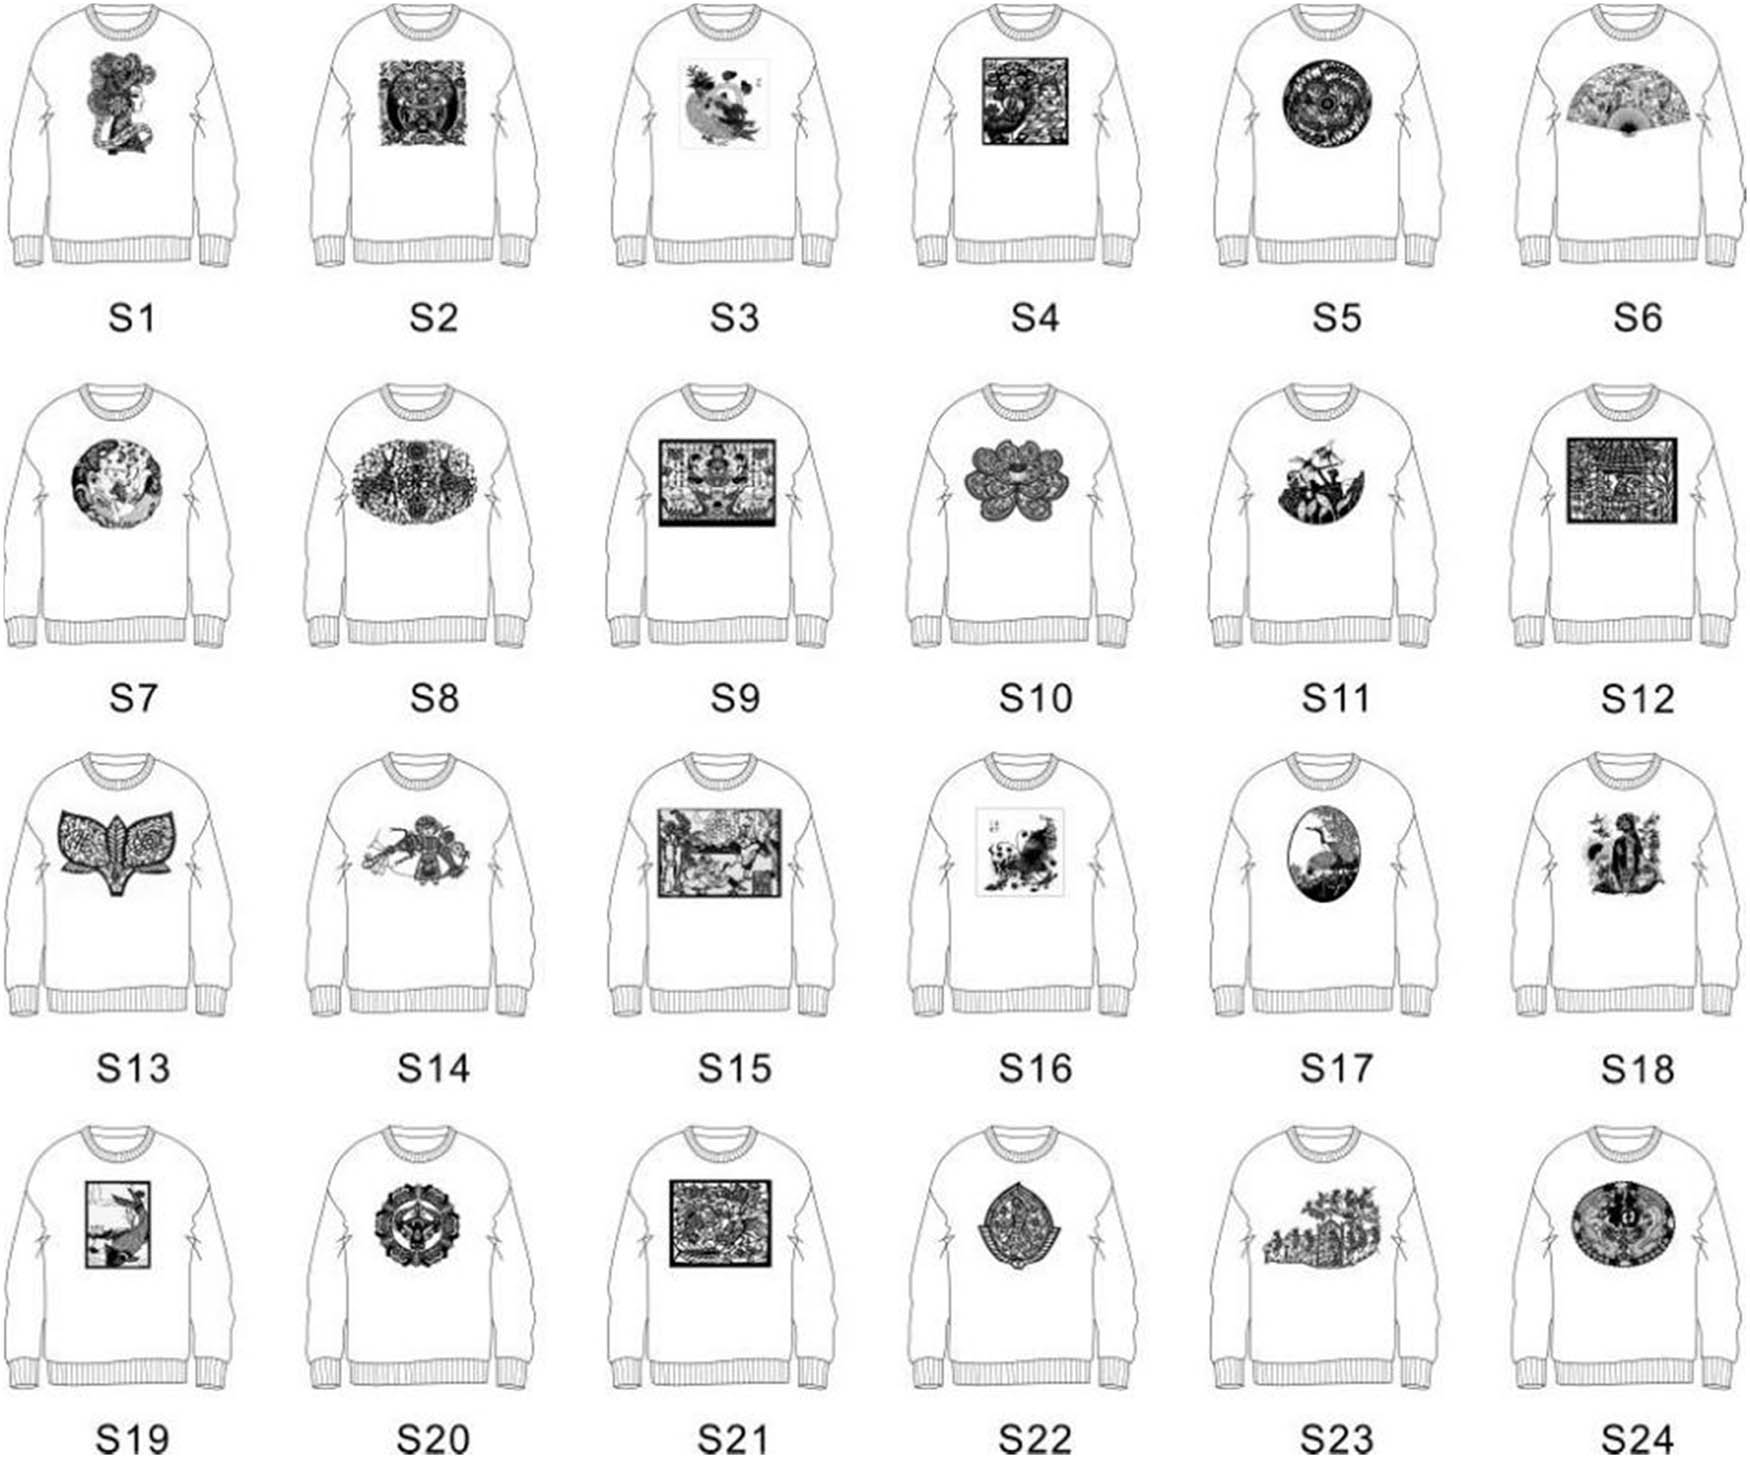
Representative sample.
3.3 Carry out the perceptual image experiment of clothing pattern
This experiment uses the Questionnaire Star website as an evaluation tool to send online questionnaires. This research selected 100 consumers of different genders aged 20–35 as participants because this group is the main consumer group of fast fashion, with a high frequency of fashion consumption and sensitivity to trends. Consumers in this age group have a strong emotional demand for clothing, which is in line with the research objectives of Kansei engineering. The respondents were not affected by region and cultural literacy and scored based on their subjective feelings. Finally, 95 questionnaires were collected, of which 90 were valid, with an efficiency of 90%. The data obtained from the 90 questionnaires were sorted and counted, and the average semantic evaluation scores of the three perceptual words corresponding to the 24 representative samples were obtained, as shown in Figure 3. Then, Cronbach’s α coefficient and split-half reliability coefficient were used to evaluate the reliability of questionnaire data. Through the analysis of SPSS 26.0 statistical software, the overall Cronbach’s α coefficient of the questionnaire was 0.873, and the Cronbach’s α coefficient of each dimension was 0.796–0.934. The total broken half reliability is 0.795, and the broken half reliability of each dimension is 0.784–0.966. The reliability of all dimensions is good, and all are >0.75, indicating that the reliability of the questionnaire is good and the data are reliable.
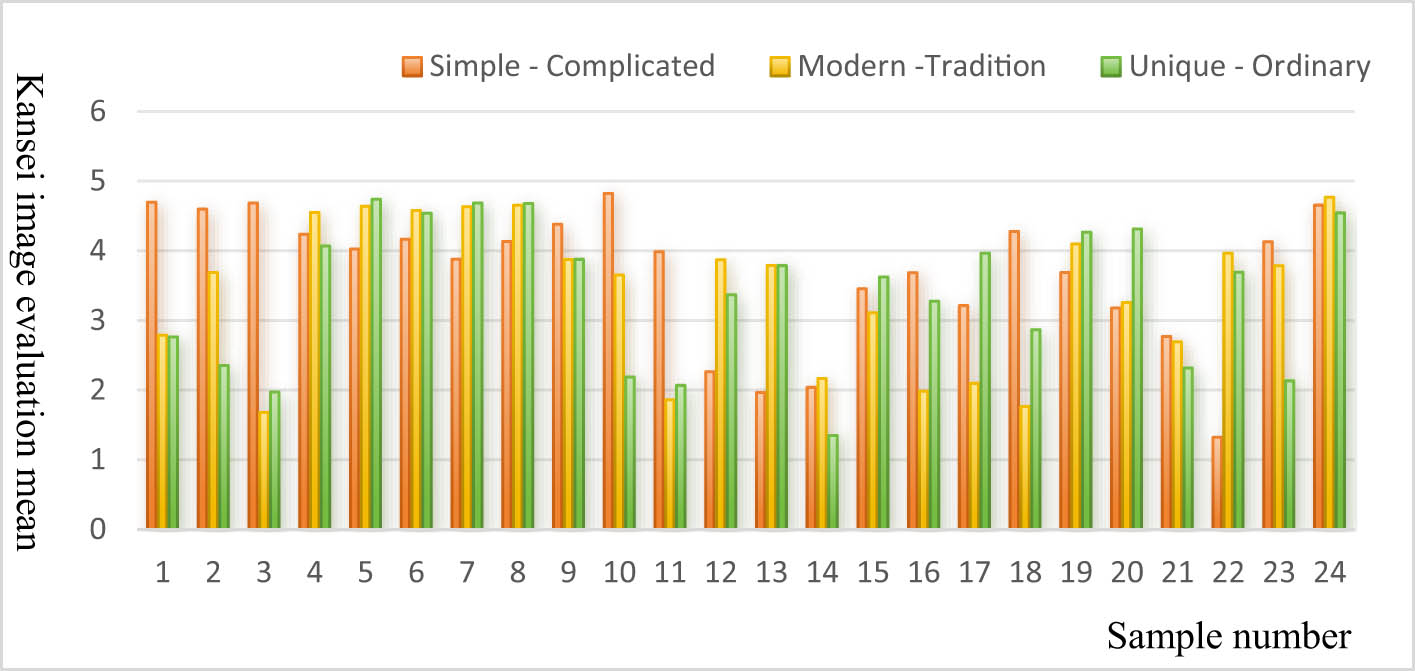
Kansei image evaluation mean of representative samples.
4 Construction and verification of IPSO-BPNN model
4.1 Construction of IPSO-BPNN model
4.1.1 IPSO algorithm
The traditional particle swarm optimization algorithm regards each solution of the optimization problem as a particle, and multiple particles constitute a population. In each iteration, each particle combines the information of individual extreme values and global extreme values to update its own speed and position, so as to search for the optimal solution. Assume that in a D-dimensional search space, there are M particles forming a population
where
By setting the upper-speed limit
Traditional particle swarm optimization algorithm tends to converge to local optimal values, thus reducing the optimization effect. In order to improve the local and global search capabilities of particle swarm optimization algorithm, the traditional particle swarm optimization algorithm is improved in terms of evolutionary strategy and parameter setting.
Add mutation operation
In order to increase the diversity of particles and enable particles to jump out of the local optimal value, the mutation operation is introduced into the particle swarm optimization algorithm. In each iteration, each particle has a certain probability of mutation, and the position and speed of the mutated particle will be re-initialized randomly.
Dynamically adjust the inertia weight, individual learning factor, group learning factor, and maximum speed.
In order to better balance the local search ability and global search ability of the particle swarm optimization algorithm, the inertia weight, individual learning factor, group learning factor, and maximum speed are dynamically adjusted. The inertia weight, individual learning factor, group learning factor, and maximum speed of the tth generation are shown in equations (3)–(6).
where
4.1.2 Using IPSO algorithm to optimize BPNN prediction model
The essence of optimizing BPNN with the IPSO algorithm is to use the IPSO algorithm to optimize the initial weights and thresholds of BPNN to improve the prediction accuracy of BPNN. The specific steps of the IPSO-BPNN algorithm are as follows:
Determine the search range of the particle swarm and initialize the position and speed of the particle swarm. The position of each particle represents the initial connection weight and threshold of the BPNN. The input of the BPNN is the design element encoding the clothing paper-cut pattern, and the output is the corresponding perceptual image value.
Initialize the connection weight and threshold of the corresponding BPNN according to each particle.
Train each BPNN with the training set, take the mean square error of the validation set as the fitness function F, and calculate the fitness function F of each particle. The expression of the fitness function F is shown in formula (7).
(7)where u is the number of samples in the validation set,
Determine the individual extreme value and group extreme value of the particle value according to the fitness function F of the particle.
Update the weight coefficient, individual learning factor, group learning factor, and speed upper limit.
Determine whether the number of iterations exceeds the maximum value. If it exceeds the maximum value, output the optimal initial connection weight and threshold of the BPNN; if it does not exceed the maximum value, update the speed and position of the particle, and ensure that the position and speed of the particle are within the set range, and then go to step (2).
When the fitness function value is less than or equal to the set minimum error value, or the number of iterations exceeds the maximum value, output the optimal initial connection weight and threshold of the BPNN, initialize the connection weight and threshold of the BPNN, train the BPNN, and test the BPNN.
4.2 Simulation verification of IPSO-BPNN model
4.2.1 Deconstruction and coding of design elements of clothing paper-cutting patterns
Since clothing pattern design elements cannot be directly used as input parameters of the model, they need to be deconstructed and coded. Two paper-cut inheritors and two clothing designers were invited to extract and classify design elements based on representative clothing pattern samples. The clothing paper-cut patterns were divided into six design elements by morphological analysis. Then, the design element types were analyzed based on representative samples, and 23 types of design elements were obtained, as shown in Table 1. The design elements of 24 representative samples were coded using switch-type nominal scale coding, and qualitative design elements were converted into quantitative data, as shown in Table 2.
Design element space of clothing paper-cut patterns
| Design elements | Type | |||||
|---|---|---|---|---|---|---|
| 1 | 2 | 3 | 4 | 5 | 6 | |
| Composition method (X1) | Central | Arc | Upright | Symmetrical | Scatter | Triangle |
| External outline shape (X2) | Square | Circle | Rectangle | Oval | Follow the shape of the object | No contour |
| Modeling technique (X3) | Realistic | Vary | Combination | |||
| Theme (pattern content) (X4) | Auspicious pattern | Daily life scene | Legend story | |||
| Line type (X5) | Thick | Thick and fine | ||||
| Paper-cut techniques (X6) | Yin carving | Yang carving | Yin and Yang carving | |||
Design element coding of representative samples
| Sample no. | Design element coding |
|---|---|
| 1 | 00100000000100100101001 |
| 2 | 00010000000100110001001 |
| ⁝ | |
| 23 | 01000000000101000101001 |
| 24 | 00010000010000110001001 |
4.2.2 Simulation verification
In order to verify the accuracy of the algorithm proposed in this article in predicting the perceptual image of clothing patterns, a simulation experiment was conducted through Matlab. A total of 18 samples were randomly selected from all samples as training samples, and the remaining 6 were used as test samples. At the same time, BPNN and PSO-BPNN were selected for comparative analysis.
The PSO-BPNN parameters adopt a 3-layer BPNN structure to construct and train the association mapping model between clothing pattern design elements and three representative image words. The input layer data is clothing paper-cut pattern design elements. From Table 1, it can be seen that the number of input layer nodes of the network is 23, and the output layer is the clothing paper-cut pattern image evaluation value, so the number of nodes is 3. The number of hidden layer nodes is selected by repeated experiments using Matlab. When the number of hidden layer neuron nodes is 9, the neural network training result is the best, so the number of hidden layer nodes of the network is finally determined to be 9. Therefore, the 3-layer BPNN structure is determined to be 23-9-3. Other parameters are set as follows: training times 1000, learning rate 0.1, learning target 0.0001. The hidden layer activation function is the S-type tangent function, and the output layer activation function is a linear function. The IPSO algorithm search space dimension D = 246; the population size M is 40; the learning factor
For fairness, the parameters of the PSO-BP algorithm are the same as above. About the traditional BPNN, the default parameters in the system library are used. In addition, the number of training times, learning rate, and learning target are the same as those of the IPSO-BPNN. As shown in Figure 3, the simulation results of the perceptual image prediction of six test samples using three network prediction models: IPSO-BPNN, PSO-BP, and BP.
It is not difficult to find from Figure 4 that the three network prediction models can well predict the perceptual image of clothing paper-cut patterns. Compared with the BPNN prediction model and the PSO-BPNN prediction model, the IPSO-BPNN prediction model has the best effect, and the predicted value is very close to the actual value. From the above results, it can be concluded that the IPSO-BPNN reliability prediction model proposed in this article has higher prediction accuracy than the other two network prediction models, and can make more accurate predictions on the perceptual image of clothing patterns.
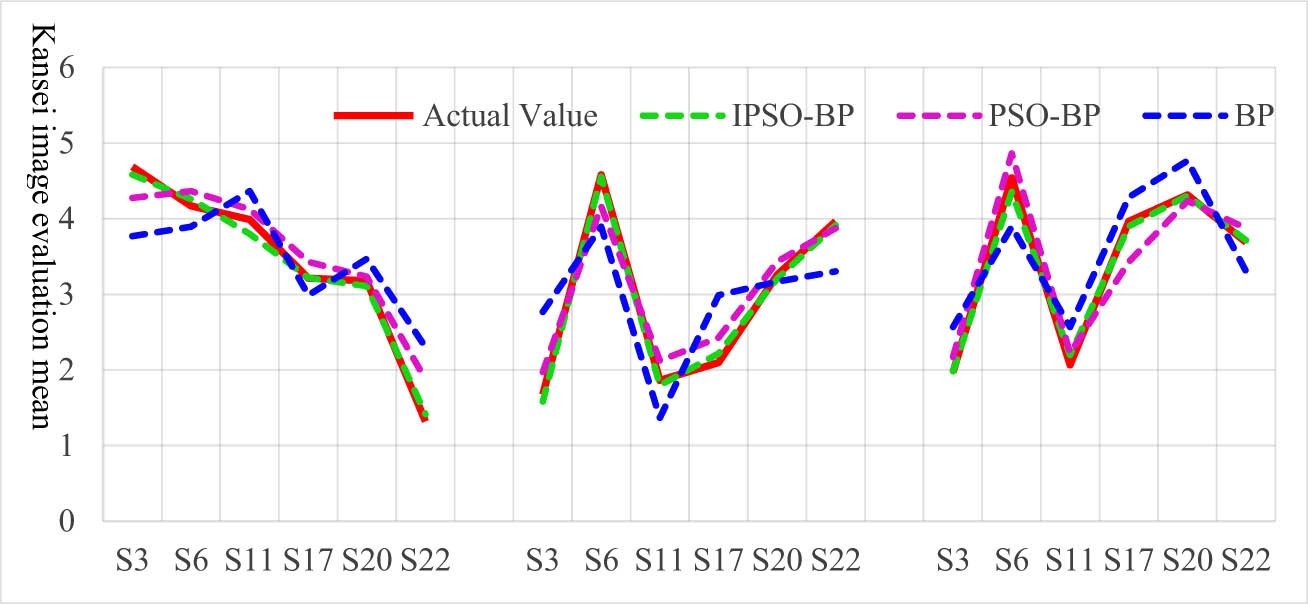
Prediction results of perceptual image reliability of test samples by three networks.
5 Clothing pattern design based on IPSO-BPNN
Consumers’ image cognition and personalized emotional needs are complex and multifaceted. In the practice of clothing pattern design, it is generally necessary to consider multi-objective images at the same time, rather than only design innovation under a single dimension. Under multiple target dimensions, the optimal design element combination corresponding to objective image A and objective image B may be different. At this time, the IPSO-BP network will have contradictions and difficulties in recommending the optimal design element combination. In order to achieve the optimization of clothing pattern design schemes under multi-objective dimensions, this article first uses the AHP method to assign weights to each objective image to reflect its relative importance and then uses the weighted sum method to seek the design element combination of the best solution for clothing patterns under multi-objective images.
5.1 Calculate the weights of multi-target images
According to the research objectives, the personalized clothing pattern design scheme is taken as the target layer, and the three perceptual images of Simple – Complicated, Modern – Traditional, and Unique – Ordinary are taken as the criterion layer to construct a hierarchical analysis model of clothing pattern perceptual images, as shown in Figure 5.
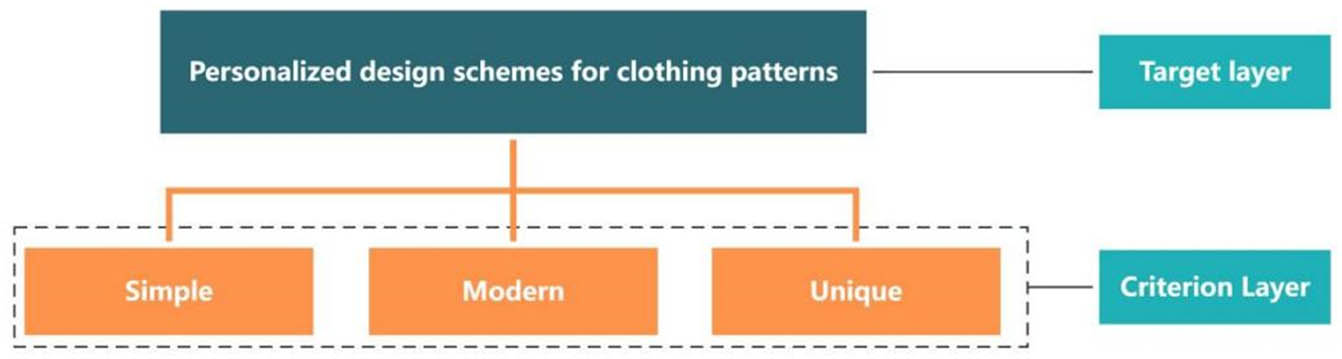
Hierarchical analysis model of perceptual image of clothing patterns.
According to the AHP analytic hierarchy process, using the 1–6 scale method, the focus group members were invited to score the importance of each image. When the importance of the two images was equal, the calibration value was 1; when one of them was much more important than the other, the calibration value was 6. The calibration table of the judgment matrix is shown in Table 3. The evaluation index is compared pairwise, the judgment matrix is constructed according to the scores, and the corresponding weights of each criterion layer, and sub-criterion layer are calculated.
1–6 Scale values and their meanings
| Calibration value | Definition |
|---|---|
| 1 | Factor i is as important as factor j |
| 2 | Factor i is slightly more important than factor j |
| 4 | Factor i is more important than factor j |
| 6 | Factor i is absolutely more important than factor j |
| 3, 5 | The median of two adjacent judgments |
After the judgment matrix is obtained, the eigenvector needs to be solved. Because the perception of sample data has high precision requirements, this article adopts the root method, which has a complicated calculation process, to calculate the weight of each. The specific steps are as follows:
Step 1: Calculate the product of the comparison results of each row of design elements with other design elements
Step 2: Calculate the m root of each element and obtain the geometric mean value
Step 3: Normalize the geometric mean value of each element and find the relative weight
Step 4: Calculate the maximum eigenroot λmax of the judgment matrix,
Step 5: Consistency test
In the formula,
Random consistency index
| N | 1 | 2 | 3 | 4 | 5 | 6 | 7 | 8 | 9 |
|---|---|---|---|---|---|---|---|---|---|
|
|
0.00 | 0.52 | 0.89 | 1.12 | 1.26 | 1.32 | 1.41 | 1.46 | 1.52 |
The team members calculated the weight value of each image according to the weight value calculation formula in the AHP method, and the result is shown in Table 5.
Criterion layer judgment matrix and weight
| Perceptual image | Simple – Complicated | Modern – Tradition | Unique – Ordinary | Weight values |
|---|---|---|---|---|
| Simple – Complicated | 1 | 1/2 | 1/2 | 0.1055 |
| Modern – Tradition | 2 | 1 | 1/3 | 0.2124 |
| Unique – Ordinary | 2 | 3 | 1 | 0.6821 |
After calculation, the above judgment matrix,
5.2 Recommendation of optimal combination of clothing pattern design elements under multi-objective image requirements
In order to recommend the combination of clothing pattern design elements under multi-objective image requirements, according to Table 1, the exhaustive method is used to re-combine the paper-cut pattern design elements, and a total of 6 × 6 × 3 × 3 × 2 × 3 = 1,944 schemes are obtained, code all possible schemes, build a sample database of garment paper-cut patterns. The trained IPSO-BPNN model is used to calculate the evaluation values of three groups of perceptual image words. After calculation, sample S106 (00001000001010001010010), S275 (00000100000110001001001), and S629 (10000000000101001001001), these three groups of codes are, respectively, the optimal design element combinations corresponding to the three single image dimensions of Simple, Modern, and Unique.
Combined with Table 3, the perceptual image prediction values of these three groups of optimal encodings under multiple image dimensions are calculated, as shown in formula (14).
where Y represents the multi-image perceptual predicted value encoded by each group after final weighting,
After calculation, the optimal combination code of clothing pattern design elements under multiple images is S629 (10000000000101001001001), and the corresponding combination of design elements is Central composition method, No outline, Vary, Daily life scene, Thick and fine lines, and Yin and Yang carving.
6 Discussion
In this section, we discuss the reliability of the above research method. Taking the optimal combination of clothing pattern design elements under multiple images obtained above as an example, it is tested through clothing pattern design practice and combined with further perceptual image evaluation experiments.
Two college students majoring in design and one young paper-cutting enthusiast are invited. According to the optimal design element combination obtained above, Central composition method, No outline, Vary, Daily life scene, Thick and fine lines, and Yin and Yang carving were used for clothing pattern design, and three design schemes were obtained, as shown in Figure 6.
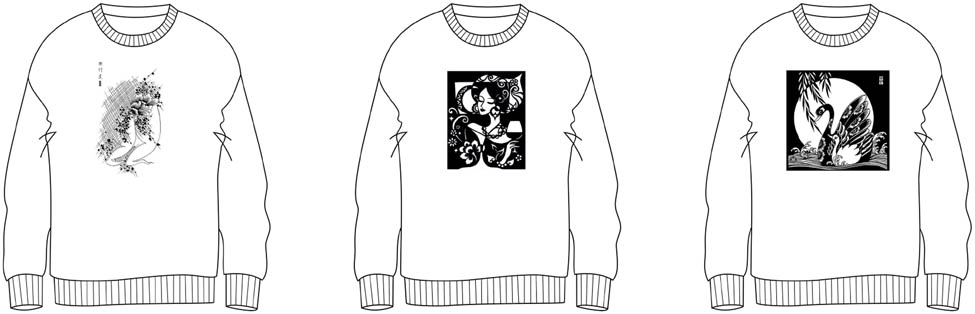
Design scheme.
In order to objectively verify the effectiveness of the proposed method, the design scheme was subjected to a perceptual evaluation experiment again. Samples 14 and 21 with high consumer evaluations in the original sample set were used as control samples to form an evaluation sample set, as shown in Figure 7.
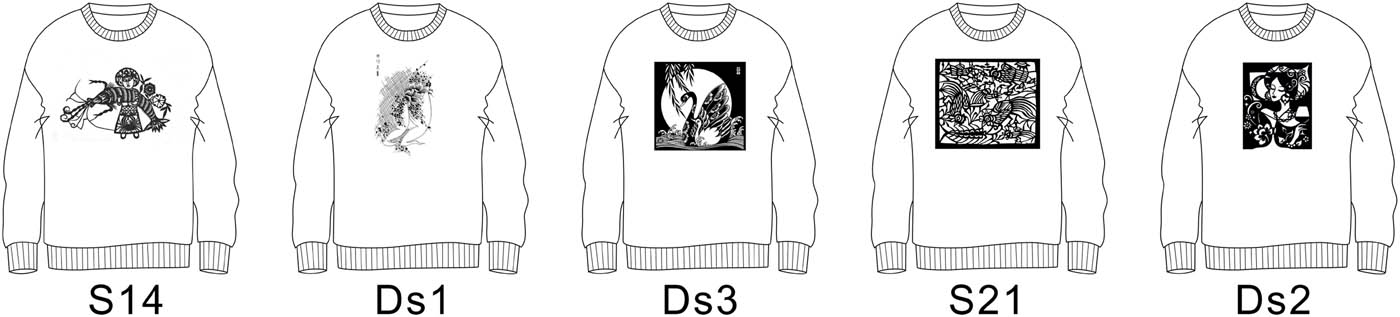
Evaluation sample set.
Then, image questionnaires were distributed online to 30 young consumers, and a total of 28 valid questionnaires were recovered. The data of image evaluation are processed by 1–4 scoring methods. According to consumers’ rating of each design scheme in a certain image dimension, the scheme with the highest score is given 4 points, and the rest are given 3 points, 2 points, and 1 points, respectively. Set under an image, the number of a scored by design scheme i is b
a
(i, a, and b are positive integers, i ∈ [1,4], a ∈ [1, 4], b ∈ [1, 28]), then the evaluation score
Take design scheme 1 as an example, and the result is shown in Table 6. According to Table 6, design scheme 1 scores 53, 80, 96 in each target image. Combined with the weight values of the above three target images, the final score of design scheme 1 is 90 points. According to this method, the final scores of other design schemes are calculated, and the results are shown in Table 7.
Image score of design scheme 1
| Score | Design scheme 1 | ||
|---|---|---|---|
| Simple | Modern | Unique | |
| 4 | 7 | 10 | 15 |
| 3 | 6 | 8 | 10 |
| 2 | 6 | 6 | 3 |
| 1 | 9 | 4 | 0 |
| Summation | 67 | 80 | 96 |
Final score of the design scheme
| Design scheme | Score |
|---|---|
| Design scheme 1 | 90 |
| Design scheme 2 | 95 |
| Design scheme 3 | 92 |
| Representative sample 14 | 86 |
| Representative sample 21 | 83 |
According to the evaluation results, the multi-objective perceptual image scores of design schemes are higher than those of the representative samples, indicating that the design schemes generated by the method in this article meet the multi-image needs of consumers, and verify the effectiveness of the method.
Although the optimal combination of clothing pattern design elements under multiple images is obtained based on the method in this article, which provides designers with a clothing pattern design strategy with specific directions and clear elements, helps designers improve design efficiency and better meet users’ diverse emotional needs, but the fixed combination of design elements may also limit the designer’s design creativity to a certain extent. It is recommended that designers combine methods such as extension graphic semantics to carry out divergent thinking and effective convergence under specific combinations, so as to provide a more sufficient and reliable method for clothing pattern design.
7 Conclusion
In order to improve the accuracy of fast fashion brand clothing development, consumer experience, and brand loyalty, this article proposes a personalized design method for clothing patterns based on Kansei engineering theory and IPSO-BPNN model and verifies the effectiveness of the research method by combining design practice and program evaluation. The research conclusions are as follows: Based on Kansei engineering and IPSO-BPNN, the mapping relationship between clothing pattern design elements and consumers’ perceptual images can be obtained, and the perceptual images of clothing patterns can be accurately predicted; the importance weight of each target image can be obtained through the AHP method; by calculating the optimal combination of design elements corresponding to a single image dimension and combining the weights of each target image, the multi-image perceptual prediction value of each sample can be obtained, and the optimal combination of design elements can be output to provide designers with a clear clothing pattern design strategy, helping them to improve design efficiency, increase the rapid response of fast fashion brands to the market, design the most popular fashion in the shortest time, and meet customer needs to the greatest extent. At the same time, the method proposed in this article can also be applied to the pattern design of other types of clothing such as luxury fashion, sportswear, sustainable clothing, etc. Based on the optimal combination recommendation of clothing pattern design elements provided by this method, designers can combine the current intelligent generation tools to try to generate design sketches or preconceived concept drawings intelligently, which is also the next research goal of the research group.
-
Funding information: This article was supported by 2023 Fujian Provincial Social Science Foundation project (FJ2023B081), Fujian Provincial Natural Science Foundation project (2024J01213), 2023 Minjiang University Fashu Charity Foundation Donated Funds Research Project (No. MFS23010), Scientific Research Foundation of Zhejiang Sci-Tech University (Grant No. XJ2024000301), and Planning of Philosophy and Social Sciences in Zhejiang Province (Grant No. 25NDJC065YBMS).
-
Author contributions: DC conceived the ideas and experimental design, performed the experiments, collected the data, interpretation of the results, and drafted the manuscript of the analysis. PC performed the experiments and participated in the manuscript writing. All authors read and approved the final manuscript.
-
Conflict of interest: The authors declare that they have no competing interests.
-
Data availability statement: The datasets used and/or analyzed during the current study are available from the corresponding author on reasonable request.
References
[1] Chiu, M. C., Lin, K. Z. (2018). Utilizing text mining and Kansei Engineering to support data-driven design automation at conceptual design stage. Advanced Engineering Informatics, 38, 826–839.Suche in Google Scholar
[2] Yan, H. B., Li, M. (2022). Consumer demand based recombinant search for idea generation. Technological Forecasting and Social Change, 175, 121385.Suche in Google Scholar
[3] Jiao, Y., Qu, Q. X. (2019). A proposal for kansei knowledge extraction method based on natural language processing technology and online product reviews. Computers in Industry, 108, 1–11.Suche in Google Scholar
[4] Rihar, L., Žužek, T., Kušar, J. (2021). How to successfully introduce concurrent engineering into new product development. Concurrent Engineering, 29(2), 87–101.Suche in Google Scholar
[5] Zhang, S. T., Wang, S. J., Liu, S. F., Li, W. X. (2022). Cobweb grey target decision-making model of multi-Kansei image in product form. Journal of Graphics, 43(3), 548–557.Suche in Google Scholar
[6] Li, Y. F., Shieh, M. D., Yang, C. C. (2019). A posterior preference articulation approach to Kansei Engineering aystem for product form design. Research in Engineering Design, 30(1), 3–19.Suche in Google Scholar
[7] Wang, C. H., Chin, H. T. (2017). Integrating affective features with engineering features to seek the optimal product varieties with respect to the niche segments. Advanced Engineering Informatics, 33, 350–359.Suche in Google Scholar
[8] Chen, J. L., Zhao, F. (2021). Research progress of product perceptual image design. Packaging Engineering, 42(20), 178–187.Suche in Google Scholar
[9] Guo, F., Ren, Z. G., Hu, M. C., Qu, Q. X., Li, F. X. (2023). A consumer-oriented kansei evaluation model through online product reviews. Journal of Intelligent & Fuzzy Systems, 45(6):1–16.Suche in Google Scholar
[10] Wang, M., Cheng, X., Liangm J. (2021). Research on the design of portable desktop air purifier based on kansei engineering. IEEE Access, 9, 138791–138802.Suche in Google Scholar
[11] Zhang, J., Mu, Y., Zhang, J., Mu, Y. (2021). Clothing design methods based on Kansei engineering: Example of suit design. Proceedings of the AHFE 2021 Virtual Conferences on Design for Inclusion, Affective and Pleasurable Design. Vol. 2021. Springer, Berlin, pp. 1111–1117.Suche in Google Scholar
[12] Chen, D. L., Cheng, P. P. (2019).The style design of professional female vest based on Kansei engineering. International Journal of Clothing Science and Clothing ScienceTechnology, 32(1), 5–11.Suche in Google Scholar
[13] Zhao, Y., Zhou, J., Zhu, S. (2020). Bra style design based on Kansei engineering and analytic hierarchy. Basic Sciences Journal of Textile Universities, 33(3), 45–50.Suche in Google Scholar
[14] Zhang, L. Q., Gu, Z. H. (2018).Sensory evaluation on men’s shirts with different collar shapes. Journal of Xi ‘an Polytechnic University, 32(4), 377–383.Suche in Google Scholar
[15] Zhang, N., Xu, J., Sun, Z. Z. (2023). Summer dress image evaluation based on perceptual engineering. Journal of Wool Spinning Technology, 10, 72–78.Suche in Google Scholar
[16] Zhong, J. D., Liang, J. F., Zhang, Z. J., Wei, S. S. (2023). The perceptual evaluation of clothing sustainable color in clothing design. Journal of Fiber Bioengineering and Informatics, 16(3), 229–241.Suche in Google Scholar
[17] Lü, X. J., Xu, J. (2021). Color matching evaluation of women’s garments based on kansei engineering. Wool Textile Journal, 49(2), 94–98.Suche in Google Scholar
[18] Takatera, M., Yoshida, R., Peiffer, J., Yamazaki, M., Yashima, K., Kim, K., et al. (2020) Fabric retrieval system for apparel e-commerce considering Kansei information. International Journal of Clothing Science and Technology, 32(1), 148–159.Suche in Google Scholar
[19] Zhou, X. X., Liang, H. E., Chen, X. X. (2016) Sensibility assessment of spring and summer shirt yarn-dyed fabrics. Journal of Textile Research, 37(8), 59–64.Suche in Google Scholar
[20] Jin, L. Y., Xue, W. L., Ma, Y. X. (2019) Image construction and evaluation of tweed products based on Kansei Engineering. International Textile Review, 52(2), 28–33.Suche in Google Scholar
[21] Li, Y., Wu, J. (2020). Correlation between consumer’s perceptual cognition of garment polka dot patterns and design elements. Journal of Textile Research, 41(10), 132–136.Suche in Google Scholar
[22] Wu, Y., Xiang, J., Zhang, N., Pan, R. R., Gao, W. D. (2020). Plaid color fabric pattern optimization combined with Interactive evaluation. Journal of Textile Research, 39(9), 50–56.Suche in Google Scholar
[23] Tang, S. S., Zhou, J. (2019). Perceptual quantitative evaluation of striped visual error dress based on fuzzy decision. Wool Textile Technology, 51(9), 85–91.Suche in Google Scholar
[24] Luo, X. D., Yang, L. L., Zhang, X. Y. (2023). Extraction and regeneration of perceptual factor of Tujia brocade pattern. Woolen Textile Science and Technology, 51(8), 54–60.Suche in Google Scholar
[25] Zheng, D. Z., Wang, J. P. (2019). Research on the sensibility of Garment Printing Pattern Design. Journal of Textiles, 41(8), 101–107.Suche in Google Scholar
[26] Guo, J. Y., Zhang, W. Q., Li, H. L., Xia, T. S. (2023). Research on visual emotion of yoga pants pattern composition. Silk, 60(7), 107–115.Suche in Google Scholar
[27] Wu, M. Y., Yu, Q. W., Wang, J. P. (2020). Regression model construction of perceptual image and design elements of Miao embroidery in southeast Guizhou. Woolen Textile Science and Technology, 51(7), 97–103.Suche in Google Scholar
[28] Zhou, M., Lv, Z. G., Di, R. H. (2022). BP neural network modeling based on small sample data. Science Technology and Engineering, 22(7), 2754–2760.Suche in Google Scholar
[29] Li, X., Wu, J. Y., Su, H. M. (2023), Construction of hand size prediction models based on BP neural network. Journal of Silk, 60(5), 59–65.Suche in Google Scholar
[30] Wu, Y. X., Hua, L. X., Chen, L., Wu, Q. (2023). Construction of environment-friendly electric bicycle styling design system based on consumers’ Kansei image. Computer-Aided Design & Applications, 20(4), 628–650.Suche in Google Scholar
[31] Misaka, M., Aoyama, H. (2018). Development of design system for crack patterns on cup surface based on KANSEI. Journal of Computational Design and Engineering, 5(4), 435–441.Suche in Google Scholar
[32] Wang, S. J., Zhou, J., Wan, Q. (2023). Design and application of apron pattern on sports bra. Knitting Industries, 5, 71–76.Suche in Google Scholar
[33] Duan, J. J., Luo, P. S., Liu, Q., Sun, F. A., Zhu, L. M. (2023). A modeling design method for complex products based on LSTM neural network and Kansei engineering. Applied Sciences, 13(2), 710.Suche in Google Scholar
[34] Chen, D., Cheng, P. P. (2023). A perceptual image prediction model of professional dress style based on PSO-BP neural network. Journal of Engineered Fibers and Fabrics, 18, 1–15.Suche in Google Scholar
[35] Zhang, X., Xu, Z. (2023). Particle swarm optimization-based backpropagation neural network for non-convex optimization problems. Neural Computing and Applications, 35(8), 1271–1283.Suche in Google Scholar
[36] Wang, Y., Li, Q. (2022). A hybrid particle swarm optimization and genetic algorithm for BP neural network training. Soft Computing, 26(5), 2387–2399.Suche in Google Scholar
[37] Liu, Y., Li, T. (2024). An improved particle swarm optimization algorithm with dynamic adjustment for neural network optimization. Journal of Computational and Applied Mathematics, 412, 113525.Suche in Google Scholar
[38] Bai, X. E., Chen, N., Xu, X. F. (2024). Research on ship track prediction based on IPSO-BP. Packaging Engineering, 45(9), 201–209.Suche in Google Scholar
[39] Shen, H., Ji, X. (2024). Optimization of garment sewing operation standard minute value prediction using an IPSO-BP neural network. AUTEX Research Journal, 24(1), 20230034.Suche in Google Scholar
© 2025 the author(s), published by De Gruyter
This work is licensed under the Creative Commons Attribution 4.0 International License.
Artikel in diesem Heft
- Study and restoration of the costume of the HuoLang (Peddler) in the Ming Dynasty of China
- Texture mapping of warp knitted shoe upper based on ARAP parameterization method
- Extraction and characterization of natural fibre from Ethiopian Typha latifolia leaf plant
- The effect of the difference in female body shapes on clothing fitting
- Structure and physical properties of BioPBS melt-blown nonwovens
- Optimized model formulation through product mix scheduling for profit maximization in the apparel industry
- Fabric pattern recognition using image processing and AHP method
- Optimal dimension design of high-temperature superconducting levitation weft insertion guideway
- Color analysis and performance optimization of 3D virtual simulation knitted fabrics
- Analyzing the effects of Covid-19 pandemic on Turkish women workers in clothing sector
- Closed-loop supply chain for recycling of waste clothing: A comparison of two different modes
- Personalized design of clothing pattern based on KE and IPSO-BP neural network
- 3D modeling of transport properties on the surface of a textronic structure produced using a physical vapor deposition process
- Optimization of particle swarm for force uniformity of personalized 3D printed insoles
- Development of auxetic shoulder straps for sport backpacks with improved thermal comfort
- Image recognition method of cashmere and wool based on SVM-RFE selection with three types of features
- Construction and analysis of yarn tension model in the process of electromagnetic weft insertion
- Influence of spacer fabric on functionality of laminates
- Design and development of a fibrous structure for the potential treatment of spinal cord injury using parametric modelling in Rhinoceros 3D®
- The effect of the process conditions and lubricant application on the quality of yarns produced by mechanical recycling of denim-like fabrics
- Textile fabrics abrasion resistance – The instrumental method for end point assessment
- CFD modeling of heat transfer through composites for protective gloves containing aerogel and Parylene C coatings supported by micro-CT and thermography
- Comparative study on the compressive performance of honeycomb structures fabricated by stereo lithography apparatus
- Effect of cyclic fastening–unfastening and interruption of current flowing through a snap fastener electrical connector on its resistance
- NIRS identification of cashmere and wool fibers based on spare representation and improved AdaBoost algorithm
- Biο-based surfactants derived frοm Mesembryanthemum crystallinum and Salsοla vermiculata: Pοtential applicatiοns in textile prοductiοn
- Predicted sewing thread consumption using neural network method based on the physical and structural parameters of knitted fabrics
- Research on user behavior of traditional Chinese medicine therapeutic smart clothing
- Effect of construction parameters on faux fur knitted fabric properties
- The use of innovative sewing machines to produce two prototypes of women’s skirts
- Numerical simulation of upper garment pieces-body under different ease allowances based on the finite element contact model
- The phenomenon of celebrity fashion Businesses and Their impact on mainstream fashion
- Marketing traditional textile dyeing in China: A dual-method approach of tie-dye using grounded theory and the Kano model