Analysis of the Cost of a Building’s Life Cycle in a Probabilistic Approach
-
M. Rogalska
 and
D. Szewczak
and
D. Szewczak

Abstract
In the article the costs of alternative roofing techniques in the life cycle of the building were calculated. The calculations were made in accordance with ISO 15686-5 standard “Buildings and constructed assets – Service life planning – Part 5: Life-cycle costing”, using normative durability periods and minimum period of annual consumption of individual building elements to determine the durability of building components. The normative periods are valid in Poland in relation to the valuation of buildings. Probabilistic costs in the life cycle of ceramic, metal and bituminous coatings were analysed. The probability density distributions were assumed: beta for pricing factors and normal for the interest rate. Calculations were carried out for the periods of 100 years of operation of coverings, taking into account the costs of replacement and utilization. As a result of the calculations, the life cycle costs of alternative coatings with probabilities from 5 to 95% were obtained.
1 Introduction
Life cycle cost analysis (LCCA) is among others a tool for determining the most cost-effective option among the various competing alternatives. All costs of the user are taken into account in the LCCA of construction projects, starting from the purchase of land through the design process, erection of the building, costs related to the use such as: management costs, periodic inspections, repairs, repairs, replacement of instrumentation and infrastructure related to the object. All costs in the analysis are discounted to the current value known as the net present value (PV). The LCCA analysis uses two approaches: Deterministic (DBC deterministic-based costing) and probabilistic (SBC simulation-based costing). It was observed that all variables used in the calculations are characterized by variability. You can only approximate the scope and cost of the renovation that would take place in 40 years. The article proposes a method for calculating the life cycle costs of a building in the SBC LCCA probabilistic approach. The proposed procedure for calculations is described. Cost-effectiveness plays a key role in any construction project. Life cycle cost analysis (LCCA) is a method of determining the total cost of a construction project in the expected period of use, including operating and maintenance costs. LCCA in the deterministic approach can be improved using alternative modern probabilistic techniques. Probabilistic calculations in which the minimum, average and maximum values are defined with specific distributions are closer to the actual values.
2 Probabilistic Life Cycle Cost Analysis
The choice of building materials when designing a building has a major impact on costs. An analysis of construction and renovation costs has been carried out over a period of 100 years. The SBC LCCA method assumes that all data used for calculations have probabilistic values. It was observed that all data are highly volatile. It was assumed that there are no grounds to claim that the result of life cycle cost calculations of individual building elements, as well as of the entire building, will be a discrete value. The article proposes a method of calculating the life cycle costs of a building in SBC LCCA. The proposed calculation procedure was described. Probabilistic calculations, in which minimum, average and maximum values are defined with specific distributions, are closer to real values. They can form the basis for information on the life cycle costs of a building. The method of SBC LCCA calculations is presented on the example of roofing material selection. Three types of materials in their life cycle were compared: clay roofing tiles, steel roofing tiles and roofing membrane.
3 SBC LCCA calculation
The collection of data needed for calculations is the most important and labour-intensive element of the method. It is necessary to determine the minimum, average, maximum and standard deviations of individual price factors, such as: materials, labour, equipment, indirect costs, material purchase costs and profit. Three valuations are obtained. On the basis of these values the standard deviation can be calculated. The calculated values are summarised in Table 1.
Comparison of minimum, average and maximum price
| No | Price-forming factor | minimum value PBCmin | average value PBCmed | maximum value PBCmax |
|---|---|---|---|---|
| 1 | M - materials | in line with price indicators 'Cost estimate value of investments' Price indices, eg SEKOCENBUD in Poland or own analysis | ||
| 190 PLN/m2 | 200 PLN /m2 | 260 PLN /m2 | ||
| 2 | R– labor work | 13,54 PLN /wh | 15,50 PLN /wh | 16,72 PLN /wh |
| 3 | S– equipment work | 68 PLN/mh | 72 PLN/mh | 84 PLN/mh |
| 4 | Kp(R,S) – indirect cost | 62 % | 65% | 72% |
| 5 | Km (M)– cost of material purchase | 7% | 8% | 10% |
| 6 | Z(R, S, Kp, Km) - profit | 11% | 12% | 13% |
After analyzing the net costs, we have the minimum PBCmin, average PBCmed and maximum PBCmax values.We can calculate the standard deviation σ net costs (2):
The next step in the calculation is to determine the probability density function for the discount rate and for the price formation factors. It is recommended by ISO 15686-5 to take a normal distribution for the discount rate. With respect to other calculation factors there are no standard recommendations. In scientific studies, different distributions of probability density in relation to price drivers are assumed: [3] triangular, [4] normal and uni, [1] logistical, logarithmic and normal, [5, 7] lognormal, [8] beta. With a large number of data, the correctness of the probability distribution can be tested using the χ2 test according to [2]. Only 3 minimum, mean and maximum values are taken into account in this calculation method. Therefore, the χ2 test cannot be carried out. In the article, the beta distribution was assumed for further calculations, as in [8]. Using the proprietary Beta Pert calculation application in EXCEL, the parameters α PBC and β PBC of beta distribution were calculated. Table 2 and equations (3,4,5) show the generalised data formulas.
Comparison of generalized data
| Lp | Price-forming factor | Symbol | Quantity survey | The unit PBC price |
|---|---|---|---|---|
| 1 | Materials | Mi | Ymi | Mi(normal; Mimin, Mimed, Mimax,σMi) lub |
| Mi(beta; Mimin, Mimed, Mimax,σMi,αMi,βMi) | ||||
| 2 | Labor work | Ri | YRi | Ri(normal; Rmin, Rmed, Rmax,σRi) lub |
| Ri(beta; Rimin, Rimed, Rimax,σRi,αRi,βRi) | ||||
| 3 | Equipment work | Si | YSi | Si(normal; Simin, Simed, Simax,σRi) lub |
| Si(beta;Simin, Simed, Simax,σSi,αSi,βSi) | ||||
| 4 | Indirect cost | Kpi=f(Ri,Si) | % | Kpi(normal, Kpmin, Kpmed, Kpmax,σKp) lub |
| Kpi(beta, Kpimin, Kpimed, Kpimax,σKp, αKpi,βKpi) | ||||
| 5 | Cost of material purchase | Kzi=g(Mi) | % | Kz((normal; Kzmin, Kzmed, Kzmax,σKzi) lub |
| Kzi(beta;Kzimin, Kzimed, Kzimax,σKzi, αKzi,βKzi) | ||||
| 6 | Profit | Z=h(Ri,Si,Kp) | % | Zi(normal; Zmin, Zmed, Zmax,σZi) lub |
| Zi(beta; Zimin, Zimed, Zimax,σZi, αZi,βZi) |
Where:
or
or
A calculation analysis is presented below. The calculation was performed using the @Risk add-on to Microsoft Excel, which enables risk analysis by means of Monte Carlo simulation. @RISK shows practically all possible results for each situation and informs about the probability of their occurrence. The calculations were carried out on the assumption that the probability distribution of pricing factors is beta and normal in relation to the inflation coefficient. The results are compared with deterministic calculations, table 3.
The results of calculations for beta distribution and deterministic data for ceramic tile
| Name | Min | Mean | Max | 5% | 95% |
|---|---|---|---|---|---|
| beta distribution primary instalation | 100,25 | 118,15 | 148,52 | 102,72 | 139,89 |
| deterministic primary instalation | 59,53 | 74,73 | 105,88 |
All calculations were carried out with reference to the present value PV (6.7.8).
Where:
PVPBC – present value,
PBC – the future amount of money, r– interest rate (is given as a percentage, but expressed as a decimal in this formula), r(beta;rmin,rmed,rmax, σr) m – is the number of compounding years between the present date and the date where the sum is worth PBC, m(normal;mmin,mmed,mmax, σm)
The cost LCCA of building can be accout (9):
Calculations were carried out using the Monte Carlo method in the @Risk Excel program. The results were obtained in a probabilistic form. The results are summarized in Table 5 and presented on figure 1.
The input data for calculations
| Lp | Price-forming factor | Type of material | minimum value PBCmin [PLN] | average value PBC med [PLN] | maximum value PBCmax [PLN] | standard deviation [PLN] | αPBC Beta | βPBC Beta |
|---|---|---|---|---|---|---|---|---|
| primary installation | ||||||||
| 1 | M –materials* | ceramic tile | 39,60 | 52,52 | 80,92 | 17,26 | 1,25 | 2,75 |
| steel tile | 22,91 | 28,99 | 37,90 | 5,44 | 1,60 | 2,40 | ||
| bitumen membrane | 25,64 | 34,56 | 39,8 | 5,84 | 2,52 | 1,48 | ||
| 2 | R - labor | all | 13,54 | 15,5 | 16,72 | 1,31 | 2,47 | 1,53 |
| ceramic tile | 7,91 | 9,06 | 9,77 | 0,94 | 2,47 | 1,53 | ||
| steel tile | 4,62 | 5,29 | 5,70 | 0,55 | 2,47 | 1,53 | ||
| bitumen membrane | 8,39 | 9,61 | 10,37 | 0,99 | 2,47 | 1,53 | ||
| 3 | S - equipment work | all | 5,50 | 7,74 | 10,2 | 2,35 | 1,91 | 2,09 |
| ceramic tile | 0,29 | 0,41 | 0,54 | 0,12 | 1,91 | 2,09 | ||
| steel tile | 0,04 | 0,53 | 0,69 | 0,16 | 1,91 | 2,09 | ||
| bitumen membrane | 0,37 | 0,53 | 0,69 | 0,01 | 1,91 | 2,09 | ||
| 4 | Kp( R,S) – indirect costs [%] | all | 62 | 65 | 72 | 4,19 | 1,2 | 2,8 |
| ceramic tile | 5,87 | 6,16 | 6,82 | 4,19 | 1,2 | 2,8 | ||
| steel tile | 3,61 | 3,78 | 4,19 | 4,19 | 1,2 | 2,8 | ||
| bitumen membrane | 6,29 | 6,59 | 7,30 | 4,19 | 1,2 | 2,8 | ||
| 5 | Km (M)– costs of material purchase [%] | all | 7% | 8% | 10% | 1,25 | 1,35 | 2,65 |
| ceramic tile | 3,68 | 4,20 | 5,25 | 1,25 | 1,35 | 2,65 | ||
| steel tile | 0,04 | 0,53 | 0,69 | 0,16 | 1,91 | 2,09 | ||
| bitumen membrane | 0,37 | 0,53 | 0,69 | 0,01 | 1,91 | 2,09 | ||
| 6 | Z(R, S, Kp, Km) – profit[%] | the same | 11% | 12% | 13% | 0,82 | 2 | 2 |
| ceramic tile | 2,18 | 2,38 | 2,58 | 0,20 | 2,00 | 2,00 | ||
| steel tile | 1,31 | 1,43 | 1,55 | 0,82 | 2,00 | 2,00 | ||
| bitumen membrane | 2,10 | 3,48 | 2,48 | 0,82 | 2,00 | 2,00 | ||
| demolition works | ||||||||
| 7 | R - labor | R total | 13,54 | 15,5 | 16,72 | 1,31 | 2,47 | 1,53 |
| ceramic tile | 7,91 | 9,06 | 9,77 | 0,94 | 2,47 | 1,53 | ||
| steel tile | 4,62 | 5,29 | 5,7 | 0,55 | 2,47 | 1,53 | ||
| bitumen membrane | 8,39 | 9,61 | 10,37 | 0,99 | 2,47 | 1,53 | ||
| 8 | S - equipment work | extract total | 5,5 | 7,74 | 10,2 | 2,35 | 1,91 | 2,09 |
| ceramic tile | 0,29 | 0,41 | 0,54 | 0,12 | 1,91 | 2,09 | ||
| steel tile | 0,04 | 0,53 | 0,69 | 0,16 | 1,91 | 2,09 | ||
| bitumen membrane | 0,37 | 0,53 | 0,69 | 0,01 | 1,91 | 2,09 | ||
| truck total | 61 | 75,87 | 91,93 | 15,47 | 1,93 | 2,07 | ||
| ceramic tile | 29,89 | 37,18 | 45,04 | 15,47 | 1,93 | 2,07 | ||
| steel tile | 5,49 | 6,83 | 8,27 | 1,39 | 1,93 | 2,07 | ||
| bitumen membrane | 5,79 | 7,21 | 8,73 | 1,47 | 1,93 | 2,07 | ||
| 9 | Kp( R,S) – indirect costs [%] | the same | 7 | 8 | 10 | 1,25 | 1,35 | 2,65 |
| ceramic tile | 28,92 | 30,32 | 33,59 | 2,39 | 1,2 | 2,8 | ||
| steel tile | 7,84 | 8,22 | 9,11 | 0,65 | 1,2 | 2,8 | ||
| bitumen membrane | 7,84 | 8,22 | 9,11 | 0,65 | 1,2 | 2,8 | ||
| 10 | Z(R, S, Kp, Km) – profit[%] | the same | 11 | 12 | 13 | 0,82 | 2 | 2 |
| ceramic tile | 8,47 | 9,24 | 10,01 | 2,39 | 2 | 2 | ||
| steel tile | 2,30 | 2,50 | 2,71 | 0,65 | 2 | 2 | ||
| bitumen membrane | 2,30 | 2,50 | 2,71 | 0,65 | 2 | 2 | ||
The output data of calculation
| Name | Material | Min | Mean | Max | probability 5% | probability 95% |
|---|---|---|---|---|---|---|
| primary instalation | ceramic tile | 132,33 | 146,99 | 170,54 | 134,58 | 162,90 |
| in total | ceramic tile | 300,08 | 415,07 | 579,14 | 332,78 | 504,62 |
| primary instalation | steel tile | 41,81 | 42,11 | 42,65 | 41,84 | 42,46 |
| in total | steel tile | 101,13 | 132,84 | 184,37 | 105,21 | 166,49 |
| primary instalation | bitumen membrane | 44,16 | 51,08 | 60,92 | 45,09 | 58,24 |
| in total | bitumen membrane | 429,21 | 569,30 | 723,70 | 472,26 | 681,59 |

The cost of installing and using roof coverings over a 100-year period
As can be seen in Figure 2, the cost of the original roofing with a steel tile and a bituminous membrane is almost three times lower than that of ceramic roof tiles.When con-sidering PLCCA over 100 years of use (shelf life of 25 years for a bituminous membrane, 10 years of steel roofing, 100 years of ceramic roof tiles), the cost of a ceramic roof tile is the lowest. Assuming the cost of LCCA bituminos membrane as 100%, the cost of a steel roof tile is 64% and ceramic tile only 26%. The probability of the cost of roof usage in 100 years has been analyzed. The results are presented on Figure 2.
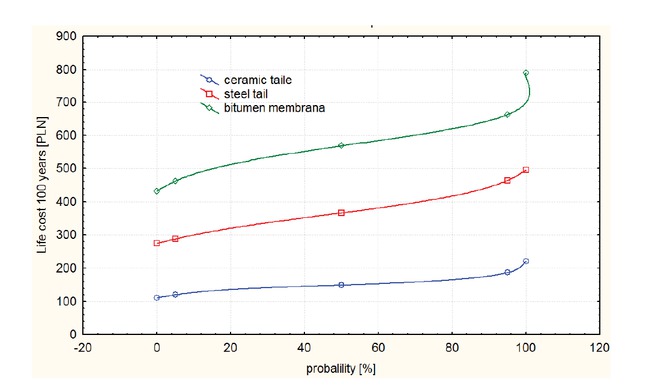
The cost of installing and using roof coverings over a 100-year period as a probability function from 0% to 100%
4 Summary and conclusions
Reilly (2004) indicates that the construction of the line London’s Jubilee subway has been delayed by two years, and the cost of implementation exceeded the planned costs by 67% (ie 1.4 billion pounds); tunnel under the channel La Manche exceeded the planned budget by 80%, the bridge over the Great Belt in Denmark is 54% of the overrun costs (Połoński 2010). Such examples can be found in literature more. However, only research carried out under the direction of Flyvbjerg (Flyvbjerg 2002) have been carried out on a large, representative statistical sample of 258 objects. The results of these tests will be unequivocally confirmed - that the problem of underestimating planned investments - is common and affects almost 9 out of 10 respondents investment, with the average analytical overrun - planned costs was 28%. Farr et al. (2016) indicate that simulation-based costing should be replaced by the traditional cost estimate. Advanced analytical tools are needed to incorporate risk and provide more defensible cost estimates. The cost calculation applies not only to the embedding process but also to the cost of use in the life cycle of the building. The article presents a probabilistic method of calculating costs in the lifecycle of a building, on the example of roof coverings. It is very important to take into account costs not only in the first phase of embedding, but also costs of demolition, repairs and replacements. The proposed method is new and has not been used so far.
References
[1] A. Abdelaty, D.J. Hyungseok, B. Dannen, F. Todey, “ Enhancing life cycle cost analysis with a novel cost classification framework for pavement rehabilitation projects”. Construction Management & Economics. 2016, Vol. 34 Issue 10, p724-736.10.1080/01446193.2016.1205206Search in Google Scholar
[2] D. S. Moore, “Tests of Chi-Squared Type Goodness of Fit Techniques,” 1986.Search in Google Scholar
[3] D. Wu, H. Liu, C. Yuan, “A risk-based optimisation for pavement preventative maintenance with probabilistic LCCA: a Chinese case”. International Journal of Pavement Engineering, 2 January 2017, 18(1):11-2510.1080/10298436.2015.1030743Search in Google Scholar
[4] E. Di Giuseppe, A. Massi, M. D’Orazio, “Probabilistic Life Cycle Cost analysis of building energy efficiency measures: selection and characterization of the stochastic inputs through a case study”. International High-Performance Built Environment Conference - A Sustainable Built Environment Conference 2016 Series (SBE16), iHBE 2016, Procedia Engineering. 2017 180:491-50110.1016/j.proeng.2017.04.208Search in Google Scholar
[5] E. Fregonara, D. G. Ferrando, “ How to Model Uncertain Service Life and Durability of Components in Life Cycle Cost Analysis Applications? The Stochastic Approach to the Factor Method”. Sustainability 2018, 10(10), 364210.3390/su10103642Search in Google Scholar
[6] ISO 15686-5 Buildings and constructed assets- Service life planning- Part 5: Life-cycle costingSearch in Google Scholar
[7] O.Swei, J. Gregory, R. Kirchain, “Probabilistic Characterization of Uncertain Inputs in the Life-Cycle Cost Analysis of Pavements Transportation Research Record”. Journal of the Transportation Research Board, No. 2366, Transportation Research Board of the National Academies, Washington, D.C., 2013, pp. 71–77.10.3141/2366-09Search in Google Scholar
[8] Z. Li, S. Madanu,” Highway Project Level Life-Cycle Benefit/Cost Analysis under Certainty, Risk, and Uncertainty: Methodology with Case Study”. Journal of the Transportation Engineering © ASCE / August 2009,10.1061/(ASCE)TE.1943-5436.0000012Search in Google Scholar
© 2019 M. Rogalska and D. Szewczak, published by De Gruyter
This work is licensed under the Creative Commons Attribution 4.0 International License.
Articles in the same Issue
- Regular Article
- Exploring conditions and usefulness of UAVs in the BRAIN Massive Inspections Protocol
- A hybrid approach for solving multi-mode resource-constrained project scheduling problem in construction
- Identification of geodetic risk factors occurring at the construction project preparation stage
- Multicriteria comparative analysis of pillars strengthening of the historic building
- Methods of habitat reports’ evaluation
- Effect of material and technological factors on the properties of cement-lime mortars and mortars with plasticizing admixture
- Management of Innovation Ecosystems Based on Six Sigma Business Scorecard
- On a Stochastic Regularization Technique for Ill-Conditioned Linear Systems
- Dynamic safety system for collaboration of operators and industrial robots
- Assessment of Decentralized Electricity Production from Hybrid Renewable Energy Sources for Sustainable Energy Development in Nigeria
- Seasonal evaluation of surface water quality at the Tamanduá stream watershed (Aparecida de Goiânia, Goiás, Brazil) using the Water Quality Index
- EFQM model implementation in a Portuguese Higher Education Institution
- Assessment of direct and indirect effects of building developments on the environment
- Accelerated Aging of WPCs Based on Polypropylene and Plywood Production Residues
- Analysis of the Cost of a Building’s Life Cycle in a Probabilistic Approach
- Implementation of Web Services for Data Integration to Improve Performance in The Processing Loan Approval
- Rehabilitation of buildings as an alternative to sustainability in Brazilian constructions
- Synthesis Conditions for LPV Controller with Input Covariance Constraints
- Procurement management in construction: study of Czech municipalities
- Contractor’s bid pricing strategy: a model with correlation among competitors’ prices
- Control of construction projects using the Earned Value Method - case study
- Model supporting decisions on renovation and modernization of public utility buildings
- Cements with calcareous fly ash as component of low clinker eco-self compacting concrete
- Failure Analysis of Super Hard End Mill HSS-Co
- Simulation model for resource-constrained construction project
- Getting efficient choices in buildings by using Genetic Algorithms: Assessment & validation
- Analysis of renewable energy use in single-family housing
- Modeling of the harmonization method for executing a multi-unit construction project
- Effect of foam glass granules fillers modification of lime-sand products on their microstructure
- Volume Optimization of Solid Waste Landfill Using Voronoi Diagram Geometry
- Analysis of occupational accidents in the construction industry with regards to selected time parameters
- Bill of quantities and quantity survey of construction works of renovated buildings - case study
- Cooperation of the PTFE sealing ring with the steel ball of the valve subjected to durability test
- Analytical model assessing the effect of increased traffic flow intensities on the road administration, maintenance and lifetime
- Quartz bentonite sandmix in sand-lime products
- The Issue of a Transport Mode Choice from the Perspective of Enterprise Logistics
- Analysis of workplace injuries in Slovakian state forestry enterprises
- Research into Customer Preferences of Potential Buyers of Simple Wood-based Houses for the Purpose of Using the Target Costing
- Proposal of the Inventory Management Automatic Identification System in the Manufacturing Enterprise Applying the Multi-criteria Analysis Methods
- Hyperboloid offset surface in the architecture and construction industry
- Analysis of the preparatory phase of a construction investment in the area covered by revitalization
- The selection of sealing technologies of the subsoil and hydrotechnical structures and quality assurance
- Impact of high temperature drying process on beech wood containing tension wood
- Prediction of Strength of Remixed Concrete by Application of Orthogonal Decomposition, Neural Analysis and Regression Analysis
- Modelling a production process using a Sankey diagram and Computerized Relative Allocation of Facilities Technique (CRAFT)
- The feasibility of using a low-cost depth camera for 3D scanning in mass customization
- Urban Water Infrastructure Asset Management Plan: Case Study
- Evaluation the effect of lime on the plastic and hardened properties of cement mortar and quantified using Vipulanandan model
- Uplift and Settlement Prediction Model of Marine Clay Soil e Integrated with Polyurethane Foam
- IoT Applications in Wind Energy Conversion Systems
- A new method for graph stream summarization based on both the structure and concepts
- “Zhores” — Petaflops supercomputer for data-driven modeling, machine learning and artificial intelligence installed in Skolkovo Institute of Science and Technology
- Economic Disposal Quantity of Leftovers kept in storage: a Monte Carlo simulation method
- Computer technology of the thermal stress state and fatigue life analysis of turbine engine exhaust support frames
- Statistical model used to assessment the sulphate resistance of mortars with fly ashes
- Application of organization goal-oriented requirement engineering (OGORE) methods in erp-based company business processes
- Influence of Sand Size on Mechanical Properties of Fiber Reinforced Polymer Concrete
- Architecture For Automation System Metrics Collection, Visualization and Data Engineering – HAMK Sheet Metal Center Building Automation Case Study
- Optimization of shape memory alloy braces for concentrically braced steel braced frames
- Topical Issue Modern Manufacturing Technologies
- Feasibility Study of Microneedle Fabrication from a thin Nitinol Wire Using a CW Single-Mode Fiber Laser
- Topical Issue: Progress in area of the flow machines and devices
- Analysis of the influence of a stator type modification on the performance of a pump with a hole impeller
- Investigations of drilled and multi-piped impellers cavitation performance
- The novel solution of ball valve with replaceable orifice. Numerical and field tests
- The flow deteriorations in course of the partial load operation of the middle specific speed Francis turbine
- Numerical analysis of temperature distribution in a brush seal with thermo-regulating bimetal elements
- A new solution of the semi-metallic gasket increasing tightness level
- Design and analysis of the flange-bolted joint with respect to required tightness and strength
- Special Issue: Actual trends in logistics and industrial engineering
- Intelligent programming of robotic flange production by means of CAM programming
- Static testing evaluation of pipe conveyor belt for different tensioning forces
- Design of clamping structure for material flow monitor of pipe conveyors
- Risk Minimisation in Integrated Supply Chains
- Use of simulation model for measurement of MilkRun system performance
- A simulation model for the need for intra-plant transport operation planning by AGV
- Operative production planning utilising quantitative forecasting and Monte Carlo simulations
- Monitoring bulk material pressure on bottom of storage using DEM
- Calibration of Transducers and of a Coil Compression Spring Constant on the Testing Equipment Simulating the Process of a Pallet Positioning in a Rack Cell
- Design of evaluation tool used to improve the production process
- Planning of Optimal Capacity for the Middle-Sized Storage Using a Mathematical Model
- Experimental assessment of the static stiffness of machine parts and structures by changing the magnitude of the hysteresis as a function of loading
- The evaluation of the production of the shaped part using the workshop programming method on the two-spindle multi-axis CTX alpha 500 lathe
- Numerical Modeling of p-v-T Rheological Equation Coefficients for Polypropylene with Variable Chalk Content
- Current options in the life cycle assessment of additive manufacturing products
- Ideal mathematical model of shock compression and shock expansion
- Use of simulation by modelling of conveyor belt contact forces