
Physical, geochemical, and clay mineralogical properties of unstable soil slopes in the Cameron Highlands
-
Abdulrasheed Olaniyan
 ,
Ismail Yusoff
,
Ismail Yusoff

Abstract
The physical, geochemical, and clay mineralogical properties are location dependent and influence landslide, yet this relationship is understudied in the Cameron Highlands. Therefore, this study demonstrates the effect of the selected physical–geochemical properties and clay mineralogy on landslide susceptibility (LS) in the Cameron Highlands, Malaysia. Seven soil samples were taken from non-landslide-affected slopes (NAS) and 13 from landslide-affected slopes (LAS), making a total of 20 samples that were analyzed. The degree of the LAS and NAS ranges from 42–80° and 30–70°, respectively. The NAS soils were characterized by lower sand, higher clay, higher organic matter content (OMC), and higher cation exchange capacity (CEC). Soils with high sand tend to have larger free pores and weak bonds, making them more vulnerable to landslides. The electrostatic charges on the clay’s surface bind the solution ions, increasing cohesion between soil particles. Also, high CEC in soils improves their stability through the binding effect resulting from the attraction between solution ions via the electrostatic surface charges of the clay in the soil. The clay mineralogy revealed the abundance of kaolinite and illite, indicating the last stage of weathering associated with the weathering of primary minerals forming the bedrock. In this study, it was demonstrated that high sand, low clay, low OMC, low CEC, and clay mineralogy of the soil were associated with slope failure in the study area.
1 Introduction
Landslides are geohazards that affect sloping terrains of the earth. Globally, between 2007 and 2013, a total of 5,741 landslide events occurred in 124 countries, causing over 20,500 fatalities from 1,827 events [1]. Malaysia is one of the affected countries in which the landslide hazard occurrence rate increases, leading to the loss of lives and properties. The Cameron Highlands is a prominent highland in Malaysia and a landslide-affected area. This hazard occurred in the Cameron Highlands on January 25, 2017, in which a Bangladeshi gardener was killed at Kampung Raja. Another recent landslide in this area was a double event on May 25, 2019, along Ringlet and Ulu Merah road, disrupting the traffic of both routes. On October 19, 2018, a major landslide that claimed nine lives was reported in George Town, Penang. Another event that claimed two lives occurred in Perak on November 10, 2020; it was reported in various news outlets across the country. Conspicuously, landslides are among the deadly hazards in Malaysia, and this calls for innovative studies.
The downslope movement of rocks, sediments, and soils in highland areas is primarily because of gravity. The parameters that influence this include hydrometeorology, geology, geomorphology, soil properties, and anthropogenic activities. Each landslide event occurred because of numerous causative factors and a single triggering factor, such as prolonged rainfall, earthquakes, melting snow, hurricanes, tsunamis, and anthropogenic activities. According to studies, Malaysia is prone to landslides because of a combination of causative factors, including geology, topography, and hydrometeorology [2]; human activities such as man-made slopes, construction errors, poor maintenance, and coastal developments [3]; soil properties [4]; and indiscriminate deforestation and land clearing [5]. The most widely recognized form of landslide in Malaysia is the shallow slide with a slide surface depth of less than 4 m. Other types include rotational slide, translational slide, rockfall, debris flow, wedge failure, and deep-seated landslides [6].
Landslides are a global threat, and there remains much to be understood regarding the mechanism of this hazard. Several methods have been used to study landslides in various parts of the world, such as geochemical, geotechnical, physical, hydrometeorological, and remote sensing. Because of the positive correlation between evaporation and the isotopic composition of water, groundwater is more depleted in isotopic compositions than surface water for the reason that surface water undergoes more evaporation and becomes more enriched in δ18O and δD. Also, δ18O and δD are lighter after rainfall but heavier because of evaporation. Many researchers have exploited the isotopic relationship between surface and groundwater in landslide studies to determine the influence of water recharge sources in an area, flow path, and natural drainage architecture on a landslide [7–9]. The effect of weathering on a landslide is another approach to landslide studies [10–12]. Hosseini et al. [10] studied the relationship between weathering and landslides and found that due to the weathering situation in the studied area, the soil cohesion is reduced by the clay minerals and fine soil particles.
Regmi et al. [11] studied the impact of various degrees of weathering on the Sangrumba landslide, the largest and most active in Nepal Himalaya, using the chemical index analysis (CIA) approach. Yahşi and Ersoy [12] used CIA in a landslide study in Trabzon Province, Turkey, where they noted a continuous increase in this parameter (CIA) with depth, but a decrease on approaching the bedrock. They concluded that the high value of CIA at such depth (2–6 m) are indications of the high rate of weathering, which is part of the reasons for the susceptibility of the area to landslide. They corroborated their claim with the study of lost on ignition (which also increases with increasing CIA, indicating high clay content resulting from the weathering) and S wave velocity of the area (which varies inversely to CIA). Some studies focused on applying cation exchange capacity (CEC) to determine the boundary of water types, water origin, and groundwater flow within landslides and recognizing the slip zone in a slope [13,14].
Most studies in Malaysia have focused on using remote sensing and GIS techniques [15–18]. Pradhan et al. [17] conducted a landslide susceptibility (LS) study in Bukit Antarabangsa using a data fusion technique that integrates high-resolution QuickBird satellite imagery (2.6 m spatial resolution) with high-resolution airborne laser scanning data (LiDAR). They classified areas based on landslide vulnerability. Other studies were based on a geotechnical approach [3,19]. Jamalluddin et al. [19] compared the physical and geotechnical properties of granitic and sedimentary residual soil taken from failed slopes at Penang and Baling, respectively. The authors found that both soils possess similar particle density (2.47 mg m−3 average) and field bulk unit weight (12.2–2014 kN m−3). However, silt dominates soil taken from Balling (68% average), while coarser soil dominates the granitic residual soil (62.7% average of gravel + sand). Moreso, sedimentary residual soil contains more moisture content with an average of 22.3% natural and 33.8% submerged moisture content. However, moisture content averaged 13% natural and 23.8% submerged moisture content in granitic residual soil. All Atterberg limits are relatively higher in sedimentary residual soil.
The soil physical–geochemical properties and clay mineralogy have not yet been well explored in landslide studies, especially in Malaysia and in the study area. These properties are location dependent and are among the factors that determine the strength and stability of slope [13]. The physical and chemical properties of the solid earth are integral factors for determining its strength and reactions to external factors. Thus, if the physical–geochemical parameters responsible for slope failure in the study area are established, some barriers to achieving effective mitigation measures to landslide hazards would be reduced, thus reducing the loss of life and properties. Therefore, this study focuses on the following: (i) determination of certain physical–geochemical properties and clay mineralogy of soil samples obtained from slopes of varying landslide susceptibilities/vulnerabilities, (ii) analysis of the effect of these properties on soil slope stability, and (iii) comparison of these properties across the slope classification (LS division).
2 Materials and methods
2.1 Site description
The Cameron Highlands is a high topographic region in the Pahang State, Malaysia, situated in the western part of the Peninsula. The study area is within the northwest and southwest part of the Cameron Highlands (101°21′–101°26′E and 4°24′–4°36′N) and covers an area of 205.4 km2 (see Figure 1). The four principal localities, namely, Ulu Telom, Brinchang, Ringlet, and Tanah Rata, overlain by the sampling points and drainage lines are represented in Figure 2. The elevation above sea level of the highlands ranges between 300 and 2,060 m [20]. Only ∼15% of the area is flat and near the main river. The river sources are near the water divide separating Pahang from Perak, and on a general perspective, their flow is easterly, with two principal rivers, namely, Sungai Telom (northern part) and Sungai Bertam (central part). The upper part of Sungai borders the Kelantan and Perak States. Sungai Telom and its tributaries drain part of the plateau around Kampung Raja. Sungai Bertam, which drains a substantial portion of the plateau, emanates from the hills close to the Kea farm area and Gunung Brinchang, flowing southernly [21].
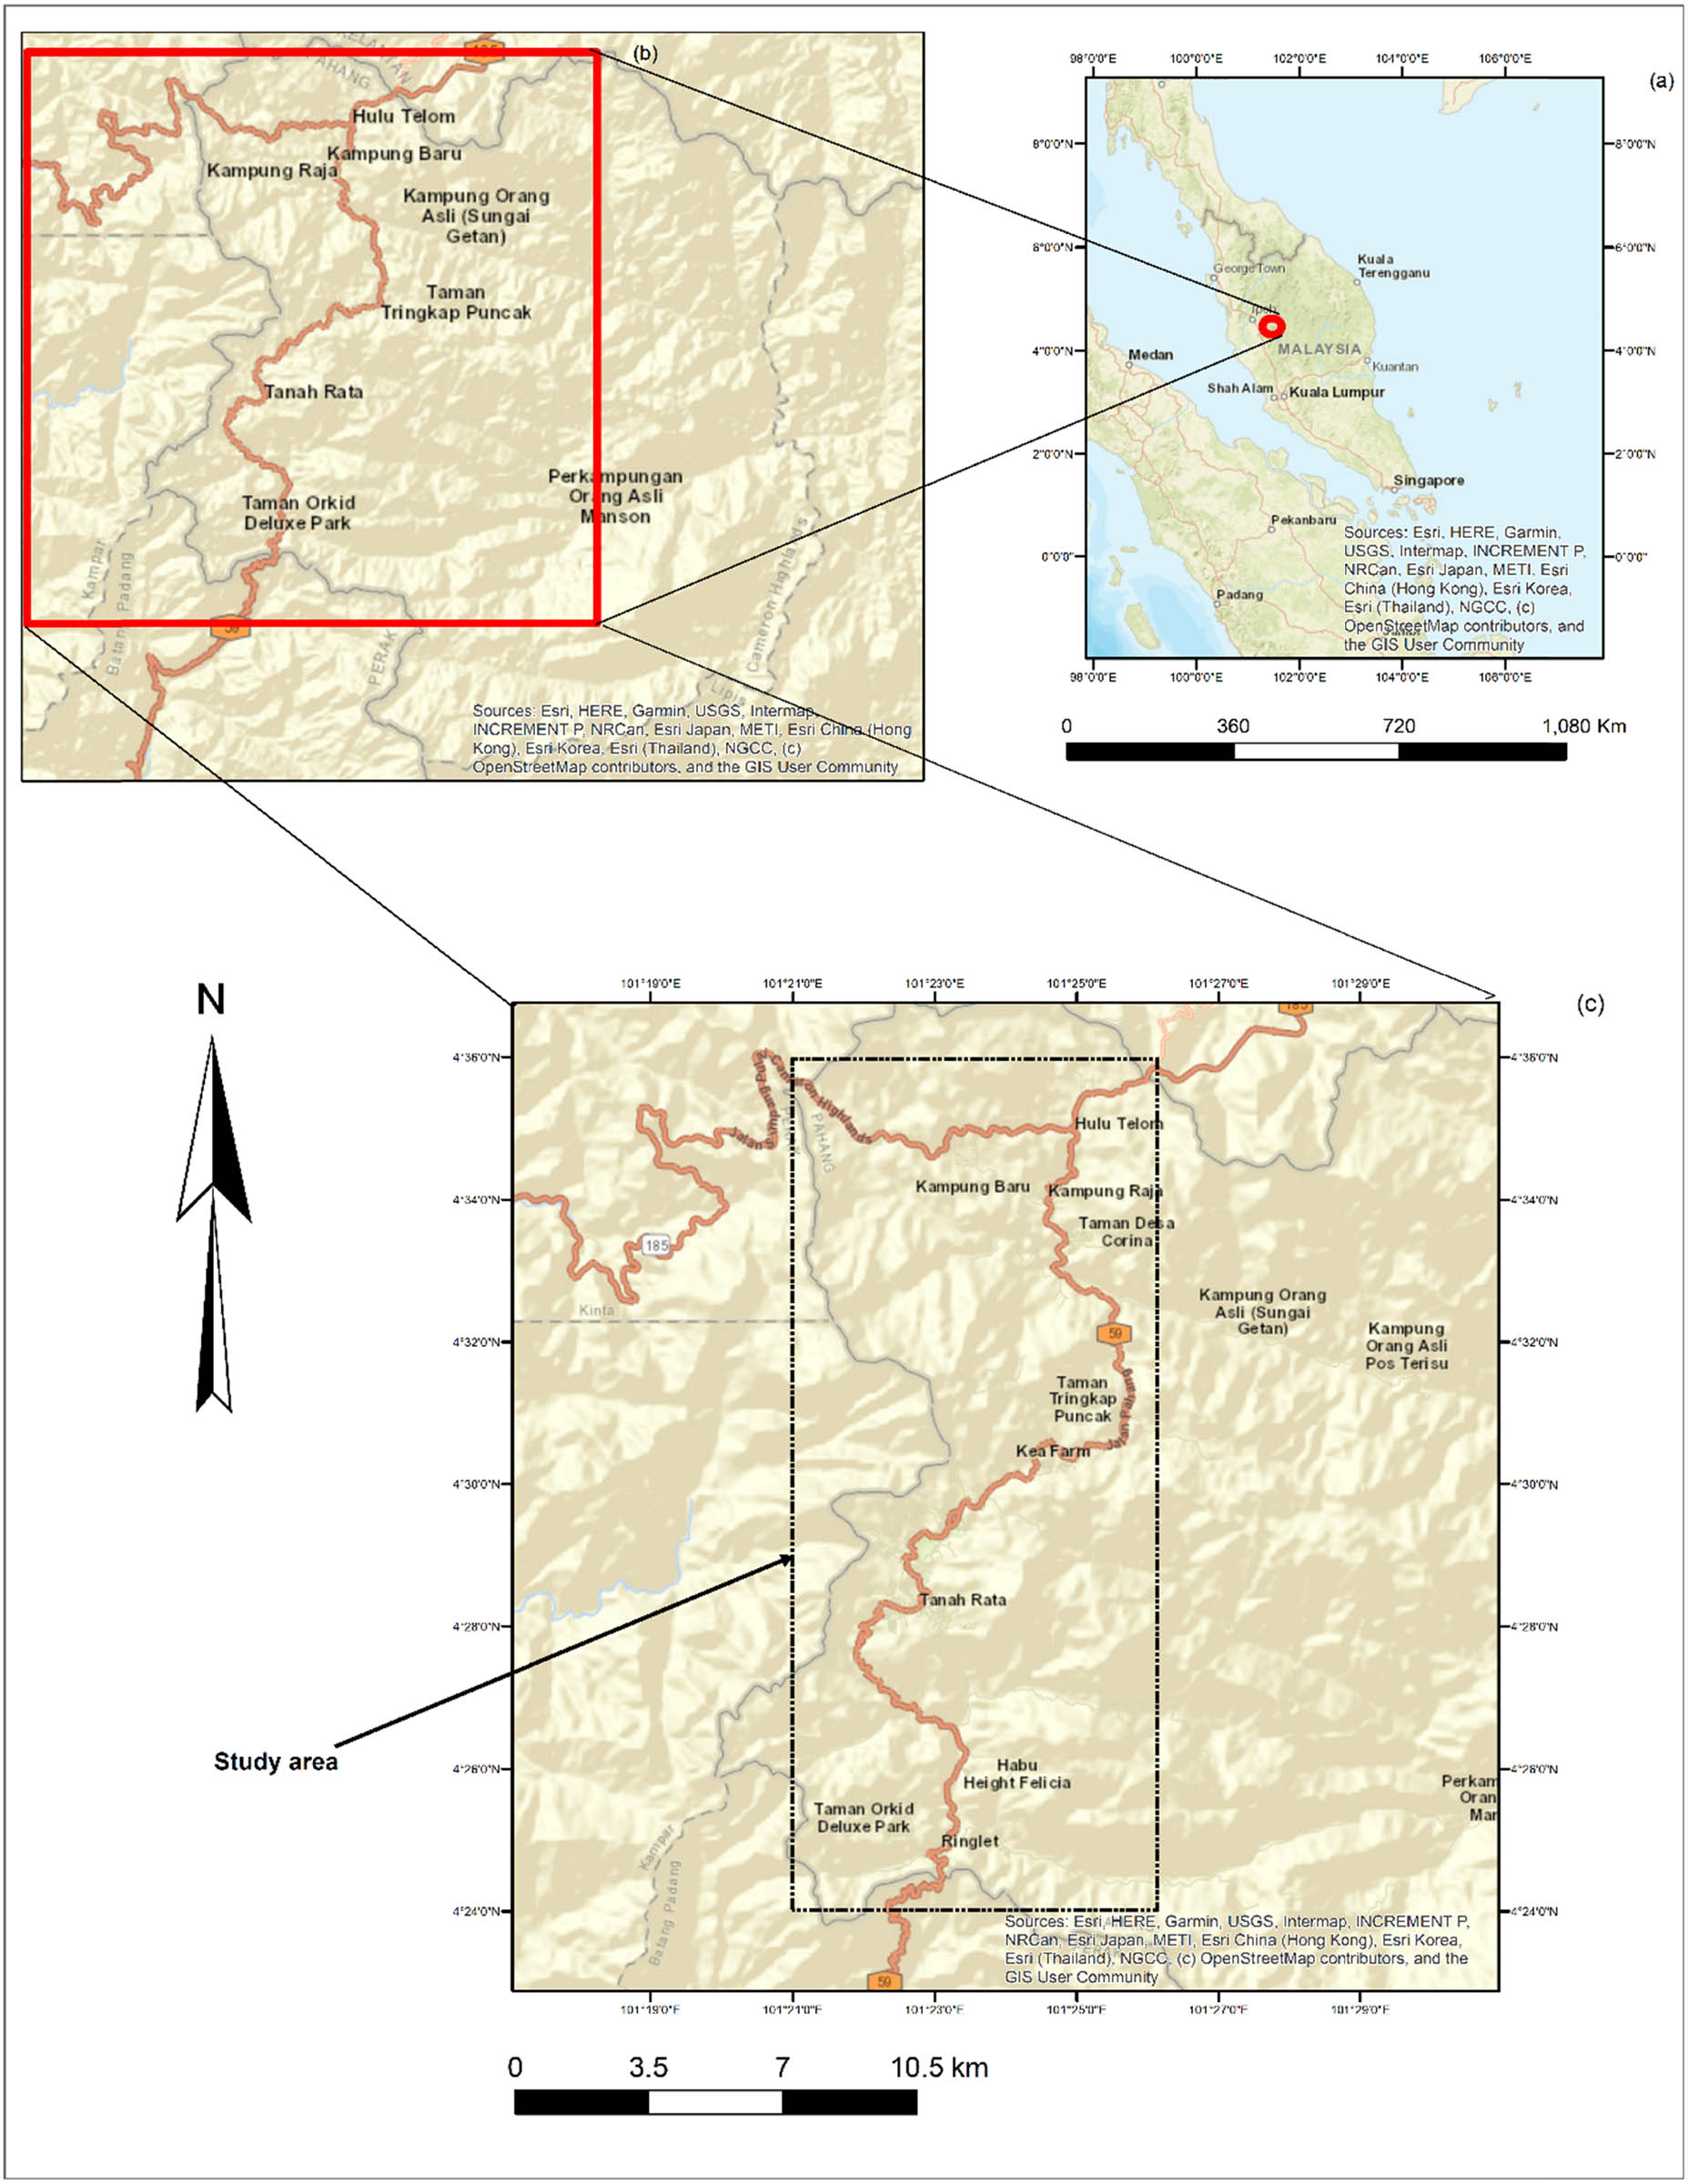
Relative position of (a) Peninsular Malaysia, (b) Cameron Highland, and (c) Study area.
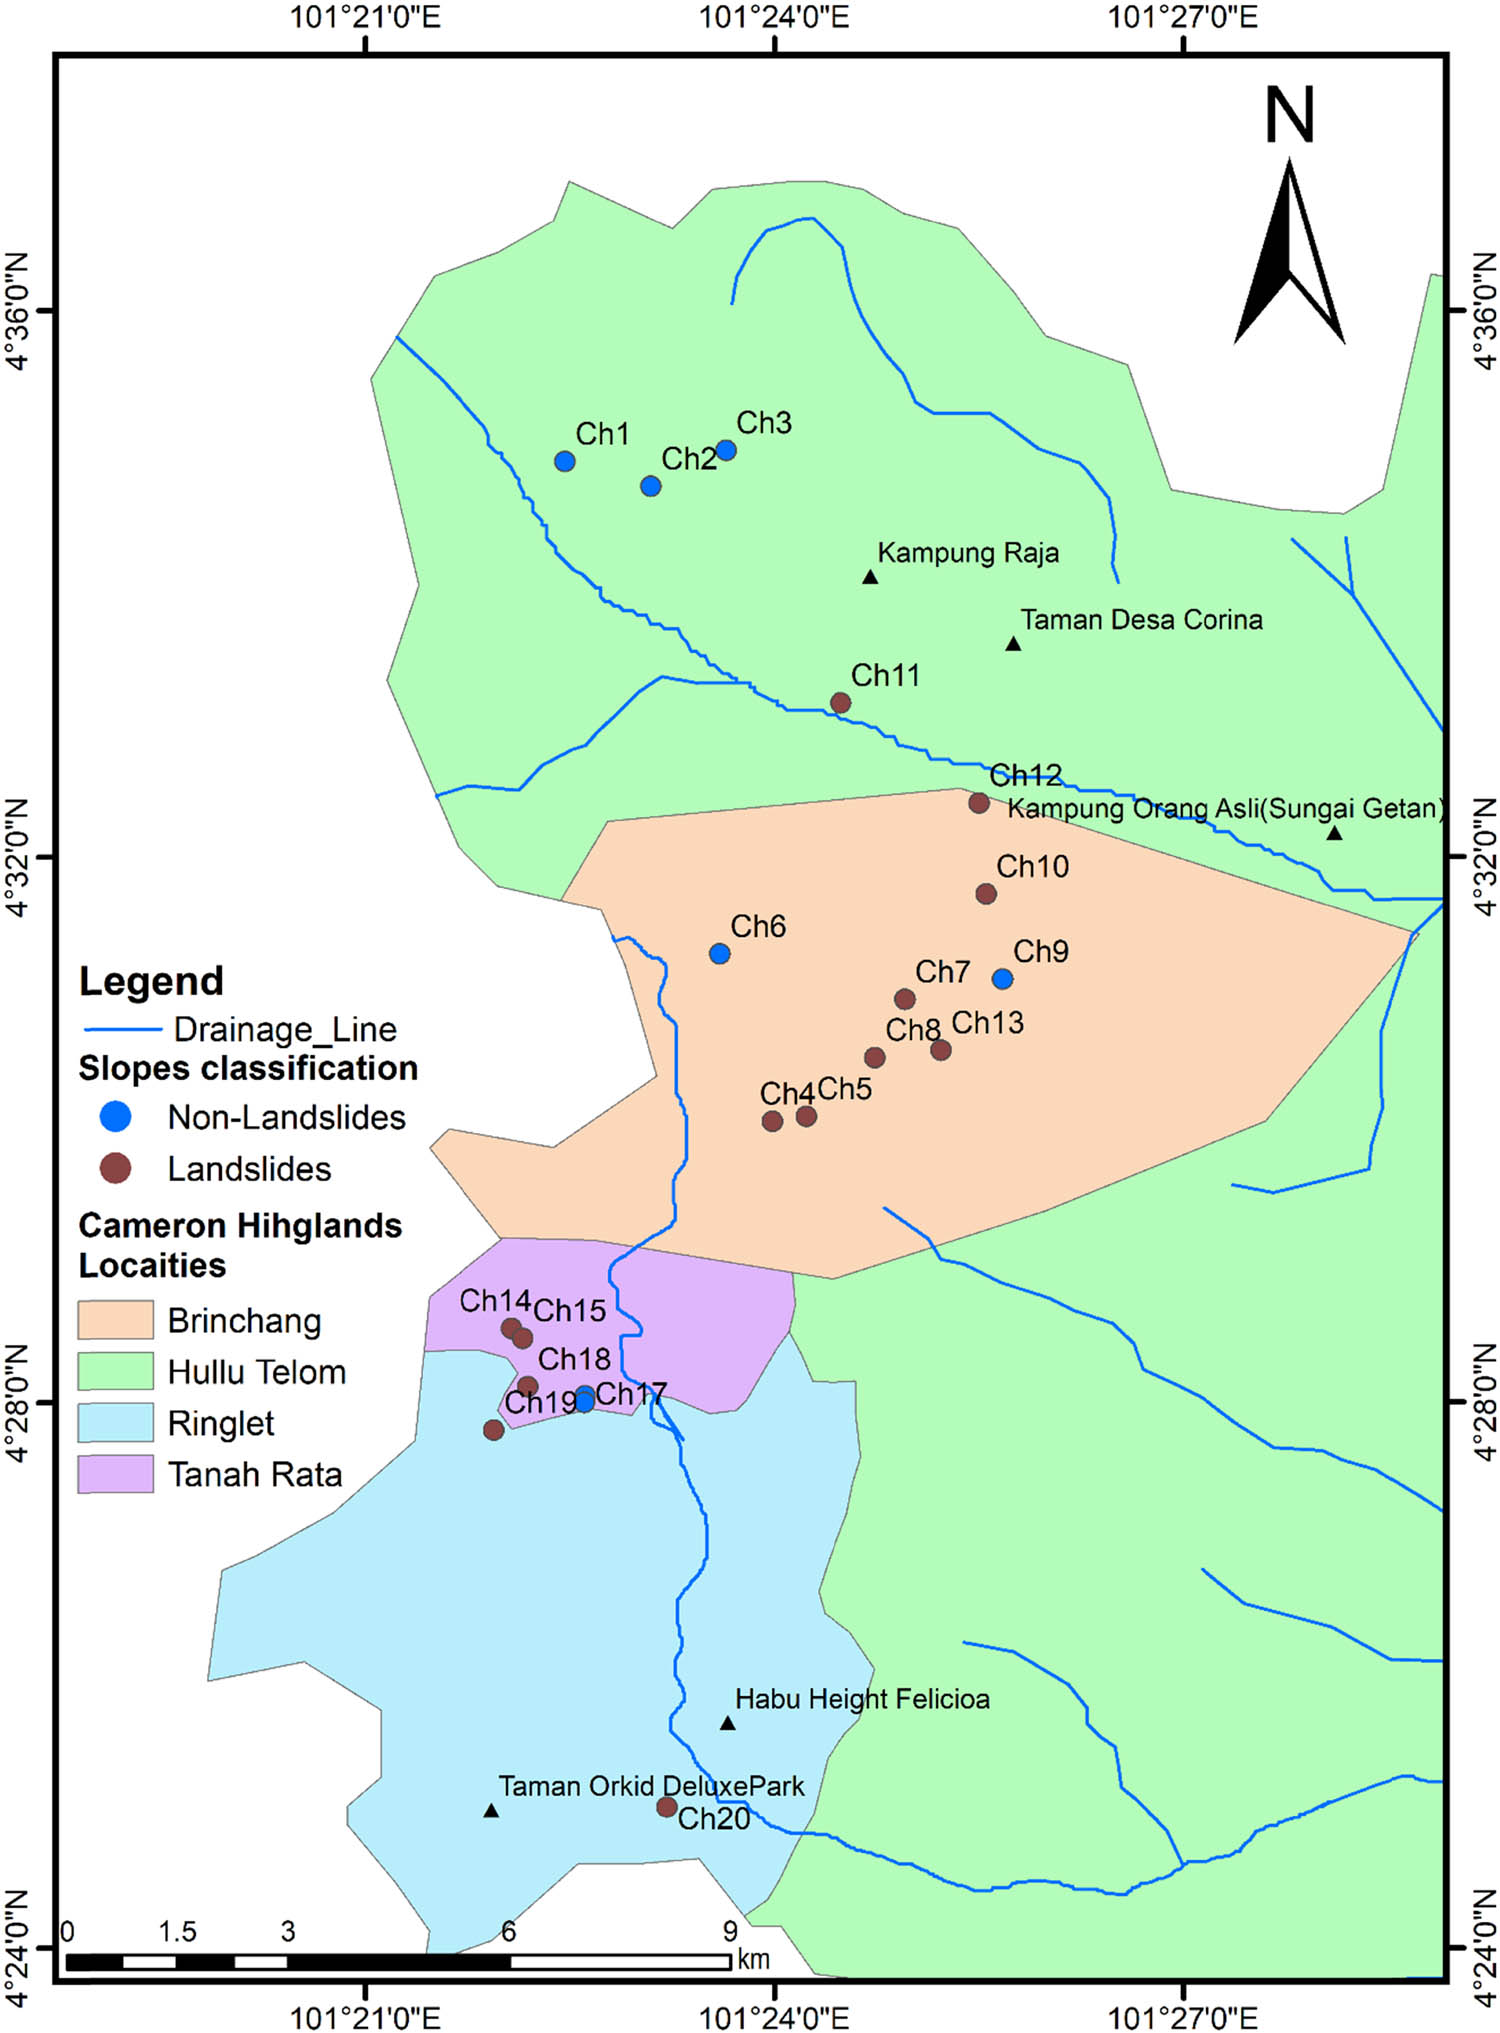
Study area overlain by sampling point classification and drainage pattern.
The study region is the hilly terrain of the Cameron Highlands (see Figure 3). More than 60% of the highlands have a slope angle of +20° [22]. The annual rainfall is high, averagely ranging from 2,500 to 3,000 mm [23]. The two pronounced wet seasons are from September to December and from February to May. The peaks are from March to May and from November to December. The single day recorded rainfall high ranges from 87 to 100 mm. During these times, many streams and rivers in the Cameron Highlands could overflow, flooding the surrounding areas, and landslides, such as debris flow, can occur along the river valleys [24]. The average daily temperature is 24°C during the day and 14°C during the night. More than 500 soil series exist in Malaysia, most of which are residual and coastal alluvial [25]. The Cameron Highlands soils are primarily derived from the local parent rocks [26]; however, with time, natural and artificial processes, such as erosion, landslides, farming, climate, and road construction, have influenced the soils. The studied soil falls under sandy loam and sandy clay loam classification according to the USDA standard. Only ∼4% of the entire Cameron Highlands is settlements, 8% is used for various agricultural purposes, 86% is forest, and 2% is reserved for recreation and other endeavors. Furthermore, tourism, agriculture, and hydroelectric power generation are the principal income sources for this area [27]. The two principal catchment areas of Hulu Telom (north) and Bertam Valley (south) provide the required water resources needed for recreation, irrigation, hydroelectric power generation, and domestic use [22]. Intense agricultural practices coupled with the rapid urbanization of this area continue to negatively affect the environment, resulting in land degradation, erosion, landslides, and flooding.
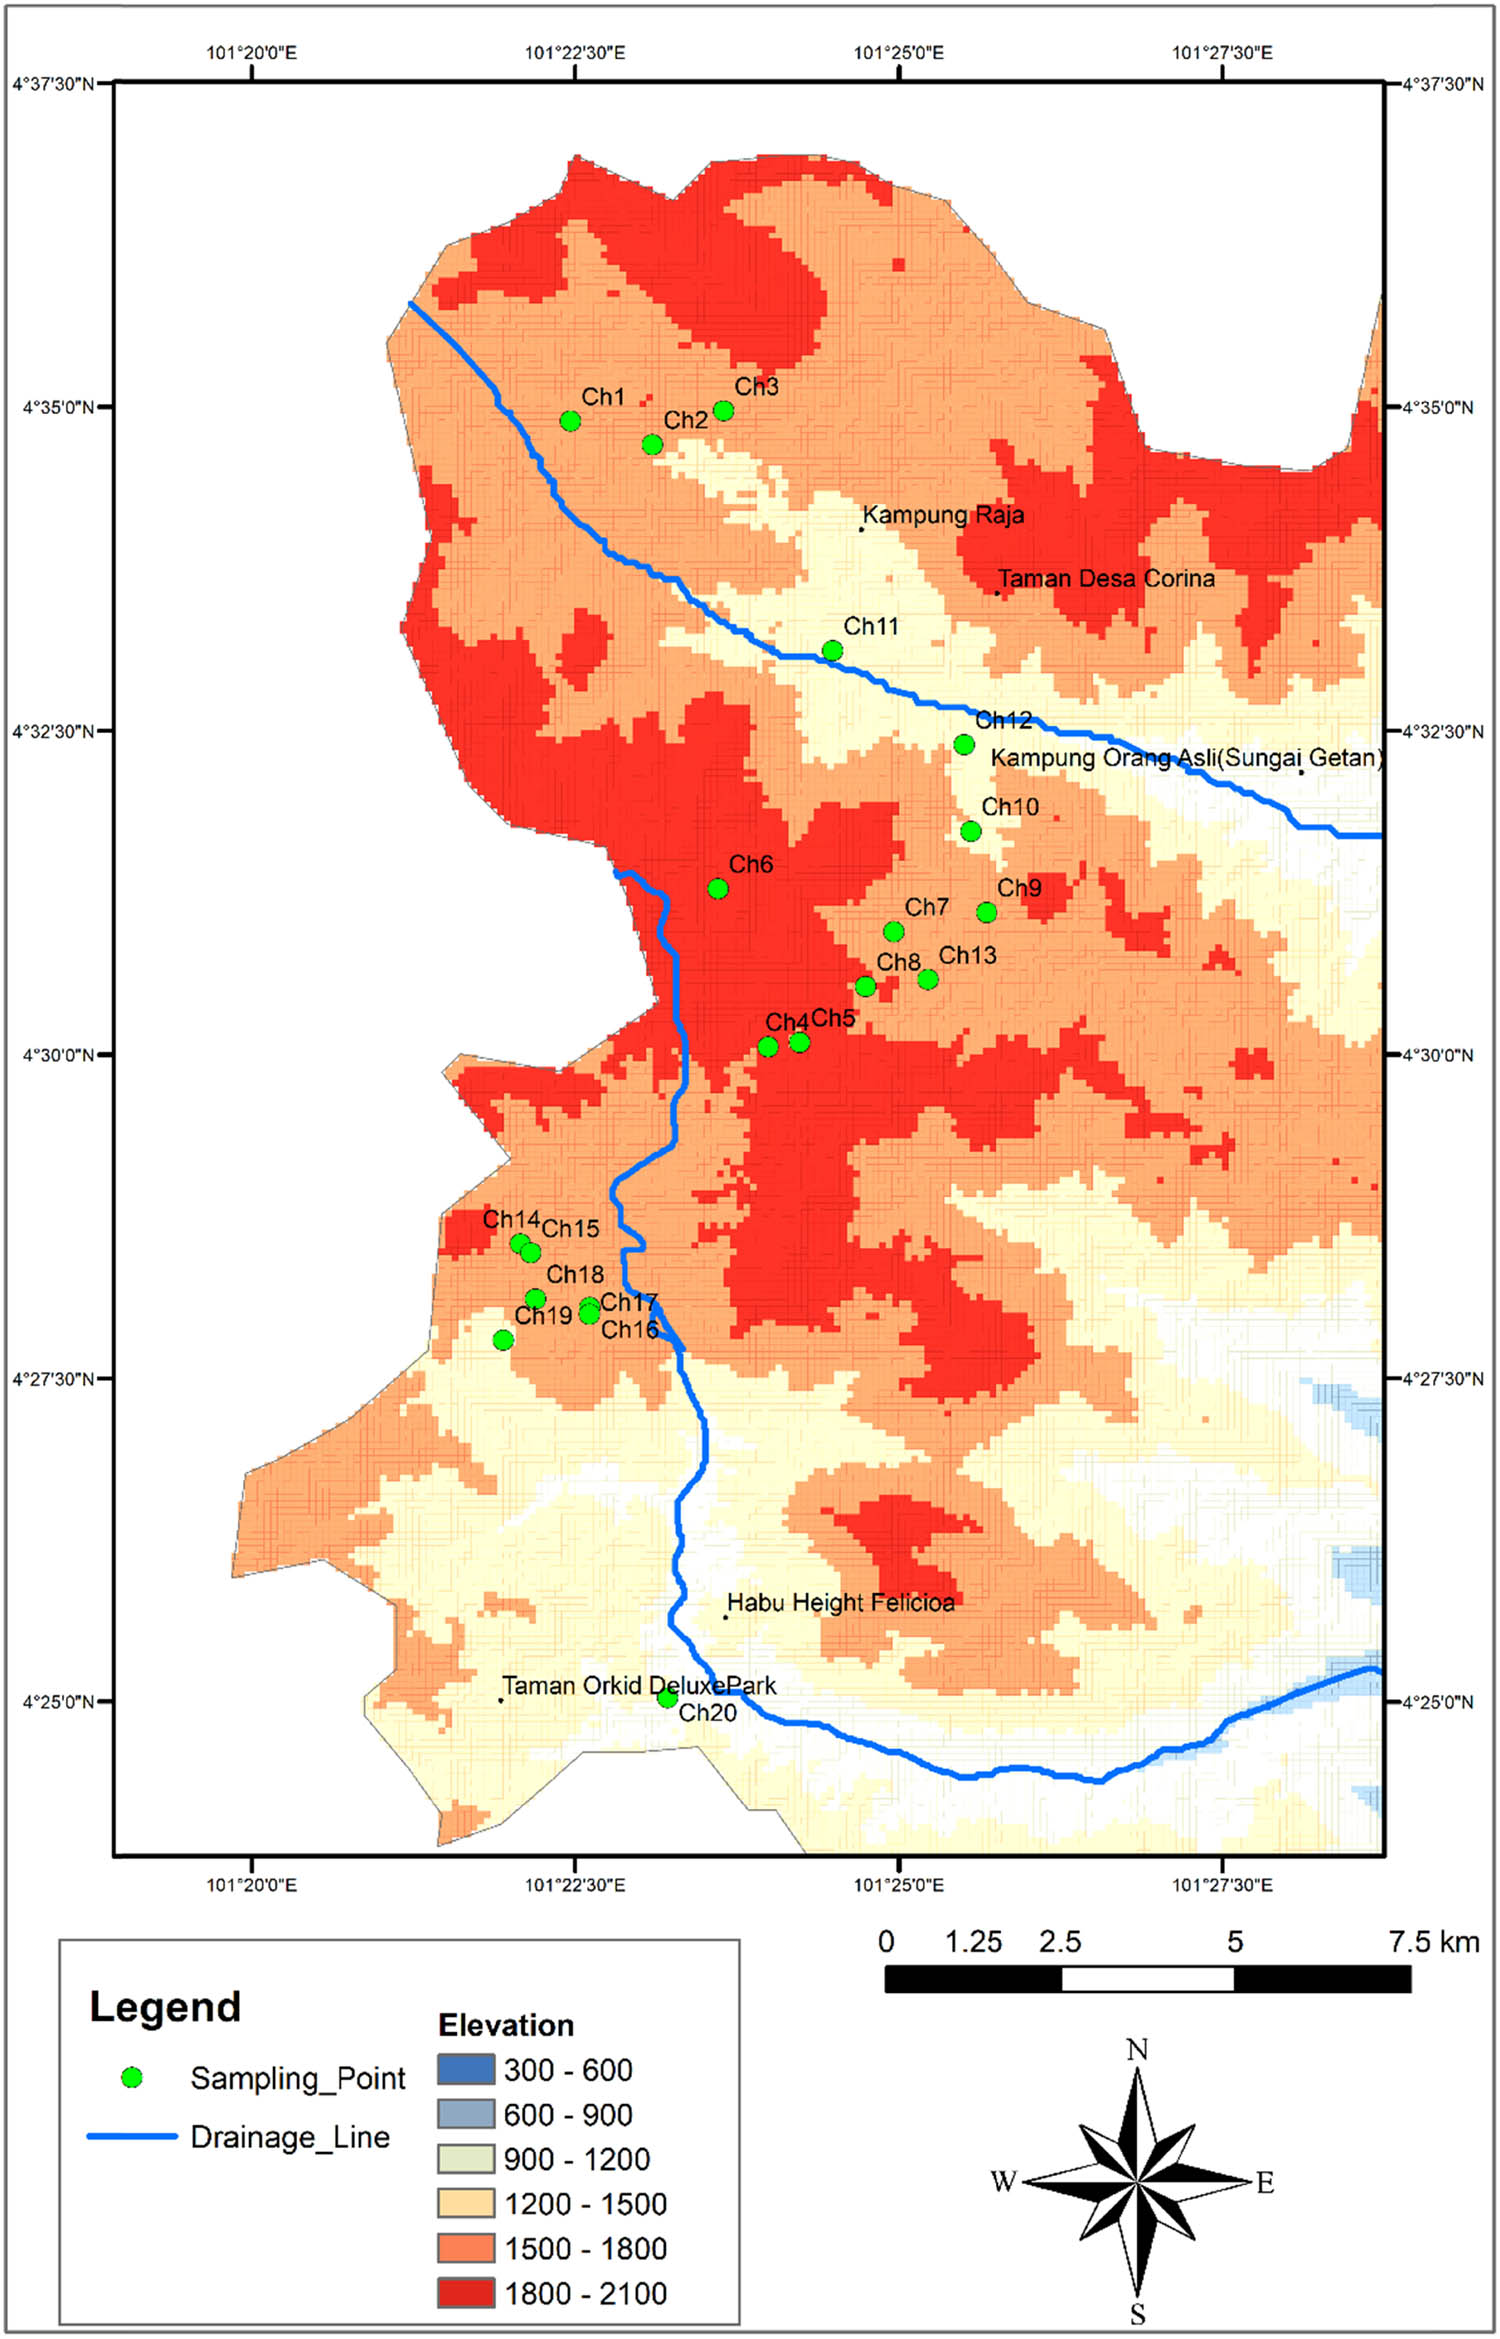
Elevation map of the study area.
2.2 Soil sampling and categorization
A total of 20 soil samples were taken from slope surfaces of varying landslide conditions using a hand auger at a depth of 50 cm from the surface. The geographic coordinate of each sampling point was recorded using a handheld portable global positioning system. To avoid contamination, the sampler (hand auger) was cleaned with water before and after each sampling. Also, direct contact with the soil was avoided. The soil was directly collected into a plastic bag, labeled, and stored in a cool box; it was then transported to the laboratory for analysis. The soil types of the 20 sampled slopes cluster around sandy loam and sandy clay loam section of USDA textural triangle. Samples were primarily grouped based on the observable landslide condition of the slopes on the field. Thirteen samples were from slopes that had experienced landslides of varying severities and classified as landslide-affected slopes (LAS). Seven samples were from locations where no landslides had occurred and grouped as nonlandslide-affected slopes (NAS). The categorization was further evaluated using hierarchical cluster analysis (HCA) and principal component analysis (PCA) based on the physicochemical characteristics of the soils.
2.3 Soil parameters determination
The grain size distribution was determined by mechanically sieving dry samples and hydrometer analysis following the ASTM D422-63 2007 standard method. Each sample was sieved using test sieves of BS 410, and the grain mass from each sieve was estimated. Hydrometer analysis was performed on samples retained in the pan using the principle of sedimentation of soil grains in water, in which the sample was added to the solution of dispersion agent (sodium hexametaphosphate powder) and distilled water. Sample readings were taken at intervals and the grain diameter was calculated using Stoke’s law. The actual hydrometer reading, corrected hydrometer reading, and temperature were noted, and grain size distributions were estimated.
The moisture content (MC) was analyzed on wet samples using the gravimetric method following the British standard method (BS 1377 1990). The organic matter content (OMC) was determined using the loss on the ignition (LOI) method [28]. The oven-dried samples at 105°C for 24 h were heated in a furnace (LT 1200–6 Furnace) at 550°C for 4 h. The weight of each sample was recorded before and after heating, and the OMC was subsequently determined using equation (1):
where M 1 is the weight of the crucible, M 2 is the weight of the crucible plus the sample, and M 3 is the weight of the crucible plus the ash.
The pH of each soil sample was measured using an Accumet AB150 pH meter following the British standard method (BS 1377). Soil samples were dried, disaggregated, and sieved through a 2 mm mesh and placed in tubes, and distilled water was added with a soil/water ratio of 1:2.5. Tubes were subsequently shaken in an orbital shaker for 1 h before settling for 24 h. The pH meter was calibrated with a buffer solution at pH 4, 7, and 10, and the pH of each sample was measured by dipping the pH probe into the tube above the soil level. CEC was determined using the methylene blue (MB) spot test method [29]. Samples were sieved through a 69-µm mesh, and 15 mL distilled water was added to 5 g of soil sample; then, 0.5 mL MB solution was incrementally added. After each increment, the solution was stirred, and a drop from the mixture was placed on a filter paper until a permanent blue halo formed around the dark blue droplet on the filter paper. The CEC was calculated using equation (2):
where V is the volume of MB used, N is the normality of MB, and W is the sample weight.
Concentrations of anions were measured using a Metrohm ® 861 advanced compact ion chromatographer (IC). Standard solutions formulated from certified multiple elements with varying concentrations (standard 1, 2, and 3) were used for calibration. The extraction process was conducted on the dried soil, and 2 mL of extract from each sample was attached to the filter using a syringe and plugged into the IC for the analysis. The result was obtained from IC Net 2.3 software installed on a system connected to the IC.
The clay mineralogy of soil samples was determined using the X-ray diffraction (XRD) technique, following the United State Geological Survey method (USGS 01-041), using PANanalytical EMPYREAN DY1032 machine made in Netherland. Nine representative samples were selected: seven from LAS and two from NAS. The samples were prepared by placing them in test tubes below 5 mL, and three drops of Calgon were added, after which distilled water was added until 30 mL. The whole setup was placed inside ultrasonic cleaner for 10 min, brought out and shaken for 1 min, and then allowed to settle for 30 min. After the samples preparation, each sample was subjected to four treatments: (1) air dried/normal, (2) glycolation, (3) heating at 350°C, and (4) heating at 550°C. Normal involves allowing the prepared sample solutions to cool on a glass slide for 15 h. Glycolation requires the treatment of samples with ethyl glycol to expand the swelling clays such as smectite. Prepared samples were placed in a container containing glycol, covered, and placed in the oven for 12 h at 69°C. The third and the fourth treatment is the heating of the prepared samples in the furnance at 350 and 550°C for 30 min and 1.5 h, respectively, to reveal changes in the crystal structure. After each treatment (Normal – 550°C), the setup was placed in the X-ray machine for 12 min/sample at an angle of 20–30°, and the mineralogy was captured into the software (Expert high score v.3.0) attached to the machine. All X-ray diffractograms (Normal – 550°C) of each sample were compared to see any changes, which will lead to the determination of the list of the available clay minerals.
2.4 Statistical analyses
The data were carefully prepared, and outliers were winsorized. The data normality was ensured using the Kolmogorov–Smirnov test via OriginPro 2020. The classification of samples based on soil properties across slopes of different landslide conditions was evaluated by HCA and PCA using OriginPro 2020 and Statistica 13, respectively. In HCA analysis, Ward’s cluster method and Euclidean distance type were applied. Also, anion properties were excluded in HCA because of fewer variations across the slopes. However, all tested properties were used in the PCA. PCA also aids in visualizing the multivariate dataset as a system of coordinates in a high-dimensional data space. Furthermore, the correlation between variables was visually summarized using PCA. A one-way analysis of variance (ANOVA) and Pearson’s correlation analysis were performed using OriginPro 2020. ANOVA was used to evaluate the significance of the difference in soil properties between the LAS and NAS, which was conducted using Fisher’s least significant difference at a significance level of p = 0.05. The significance of the association among the soil properties (independent variables) and the relationship between these properties and LS (dependent variables) was determined using Pearson’s correlation analysis.
3 Results
3.1 Field observation and soil properties of the study area
Two principal landslide types were observed in the field, namely, shallow and deep, both of which were characterized by the slide surface’s thickness. Shallow landslides are those with a slide surface of less than 4 m deep, while deep landslides are those with slide surfaces of above 4 m deep. Most sampled slopes are not highly vegetated and fall within the V–VI weathering grade. The weathering grade categories are those in which the rock is completely weathered with or without the original mass still in place. Field slope measurement showed that the degree of the slope of the entire sampled locations ranges from 30 to 80° with an average of 59.45°. The degree of the LAS and NAS ranges from 42° to 80° (mean = 63.69°) and 30–70° (mean = 51.57°), respectively. Laboratory analysis (See Table 1) revealed that the soil grain size distribution of this area is characterized by high sand content (57.13–80.08%, mean = 70.99%), low silt (2.22–23.11%, mean = 10.82%), and low clay (4.62–27.87%, mean = 18.19%). According to the USDA soil classification system, the gradation test of the soil reveals that the soil is dominated by sandy loam and sandy clay loam soil (Figure 4). The MC ranges from 13.41 to 30.62%, with an average of 20.2%. Other soil properties in the study area were OMC (1–5.31%), pH (4.05–5.21), and CEC (1.71–4.00 cmolc kg−1). The prominent anions included
Descriptive statistics of physical-chemical properties tested in the study area
| Tested parameters | Mean | SD | COV | Minimum | Maximum | Total samples |
|---|---|---|---|---|---|---|
| Sand (%) | 70.99 | 5.74 | 0.08 | 61.65 | 80.08 | 20.00 |
| Silt (%) | 10.82 | 6.06 | 0.56 | 2.22 | 23.11 | 20.00 |
| Clay (%) | 18.19 | 7.63 | 0.42 | 4.62 | 27.87 | 20.00 |
| MC (%) | 20.20 | 5.88 | 0.29 | 13.41 | 30.62 | 20.00 |
| OMC (%) | 2.79 | 0.96 | 0.34 | 1.00 | 5.31 | 20.00 |
| pH | 4.68 | 0.31 | 0.07 | 4.05 | 5.21 | 20.00 |
| CEC (cmolc kg−1) | 2.88 | 0.57 | 0.20 | 1.71 | 4.00 | 20.00 |
| Anions (mg kg−1) | ||||||
| Sulphate (
|
253.41 | 152.65 | 0.60 | 33.60 | 525.55 | 20.00 |
| Flouride (F−) | 23.06 | 21.79 | 0.95 | 0.00 | 76.80 | 20.00 |
| Chloride (Cl−) | 118.86 | 117.21 | 0.99 | 20.40 | 411.80 | 20.00 |
| Nitrate (
|
1134.68 | 1002.08 | 0.88 | 0.00 | 2404.00 | 20.00 |
| Bromide (Br−) | Negligible | Negligible | Negligible | Negligible | Negligible | 20.00 |
| Nitrite (
|
Negligible | Negligible | Negligible | Negligible | Negligible | 20.00 |
SD = standard deviation, OMC = organic matter content, COV = coefficient of variance, CEC = cation exchange capacity, Negligible = only available in small quantities in one or two samples.
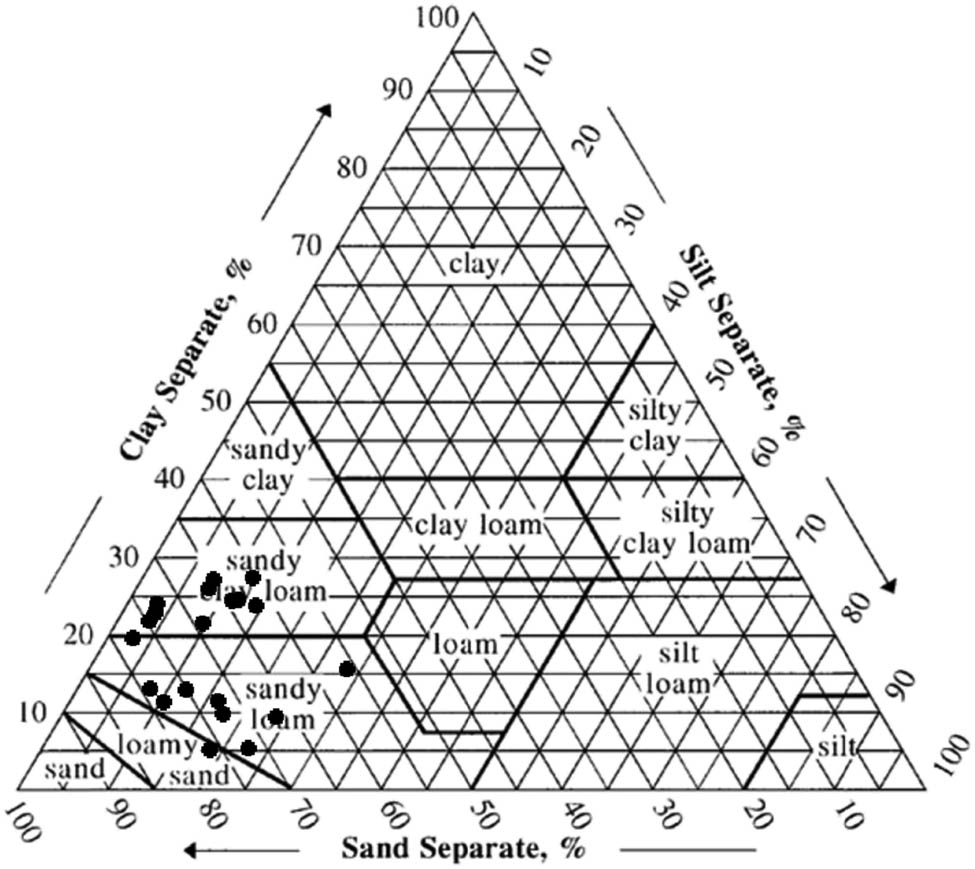
Soil type classification according to USDA standard.
Clay mineralogy from nine representative samples: seven from NAS and two from LAS samples
| Sample label | Kaolinite | Illite | Chlorite | Montmorillonite |
|---|---|---|---|---|
| CH5 | Y | Y | Y | P |
| CH8 | Y | Y | Y | N |
| CH9 | Y(s) | Y | N | N |
| CH10 | Y | Y | Y | N |
| CH12 | Y | Y | P | N |
| CH13 | Y | Y | P | N |
| CH15 | Y | Y | P | N |
| CH17 | Y | Y | Y | N |
| CH20 | Y | Y | P | N |
Y = present, Y(s) = present in small quantity, P = might be present, N = not present, CH = Cameron Highlands.
3.2 Classification of soil sample based on field observation, HCA, and PCA
HCA (see Figure 5) and PCA (see Figure 6) classifications of soils across slopes of different landslide conditions coincide with field observations (see Table 3). Samples from slopes with no landslides (less susceptible) and those from landslide-affected hills (high susceptible) independently clustered on both HCA and PCA. While soils from less-susceptible slopes were grouped, landslide-affected hill samples clustered into two. The two variations of failed slope samples slightly coincide with landslide types (shallow and deep) based on the field observation (see Table 3). For convenience, samples were grouped into NAS and LAS. In this study, NAS samples are low-susceptible slopes and NAS are high-susceptible slopes.
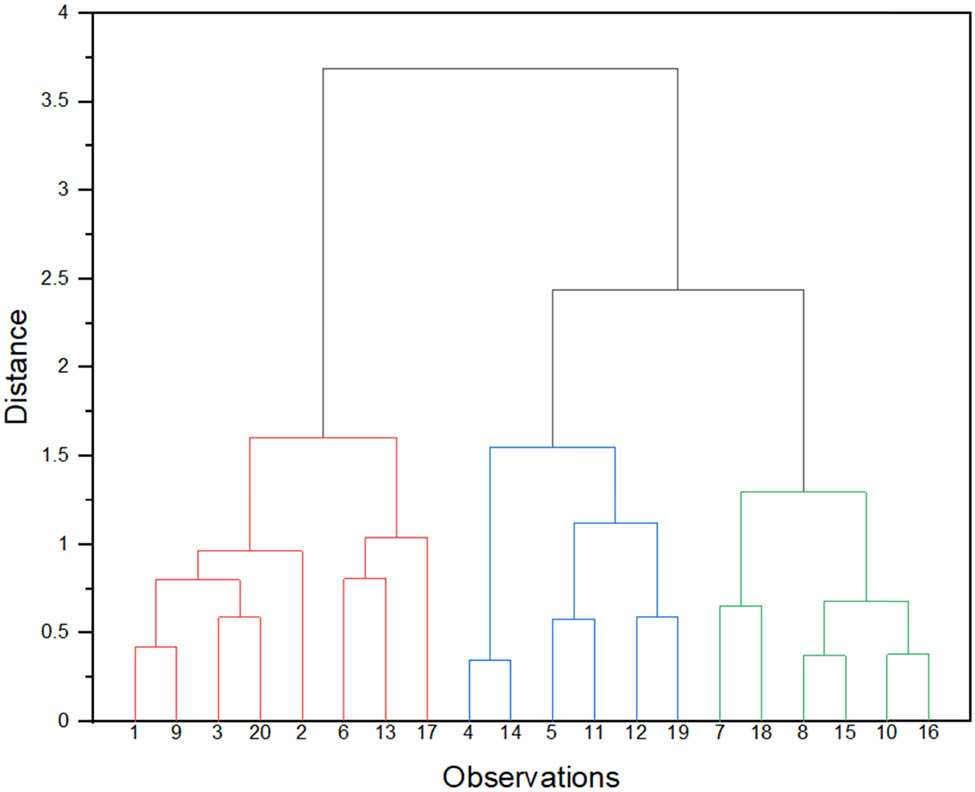
Hierarchical cluster analysis using ward’s cluster method and Euclidean distance type (All tested parameters were used except anions and clay mineralogy). Observations 1–20 represent the soil samples.
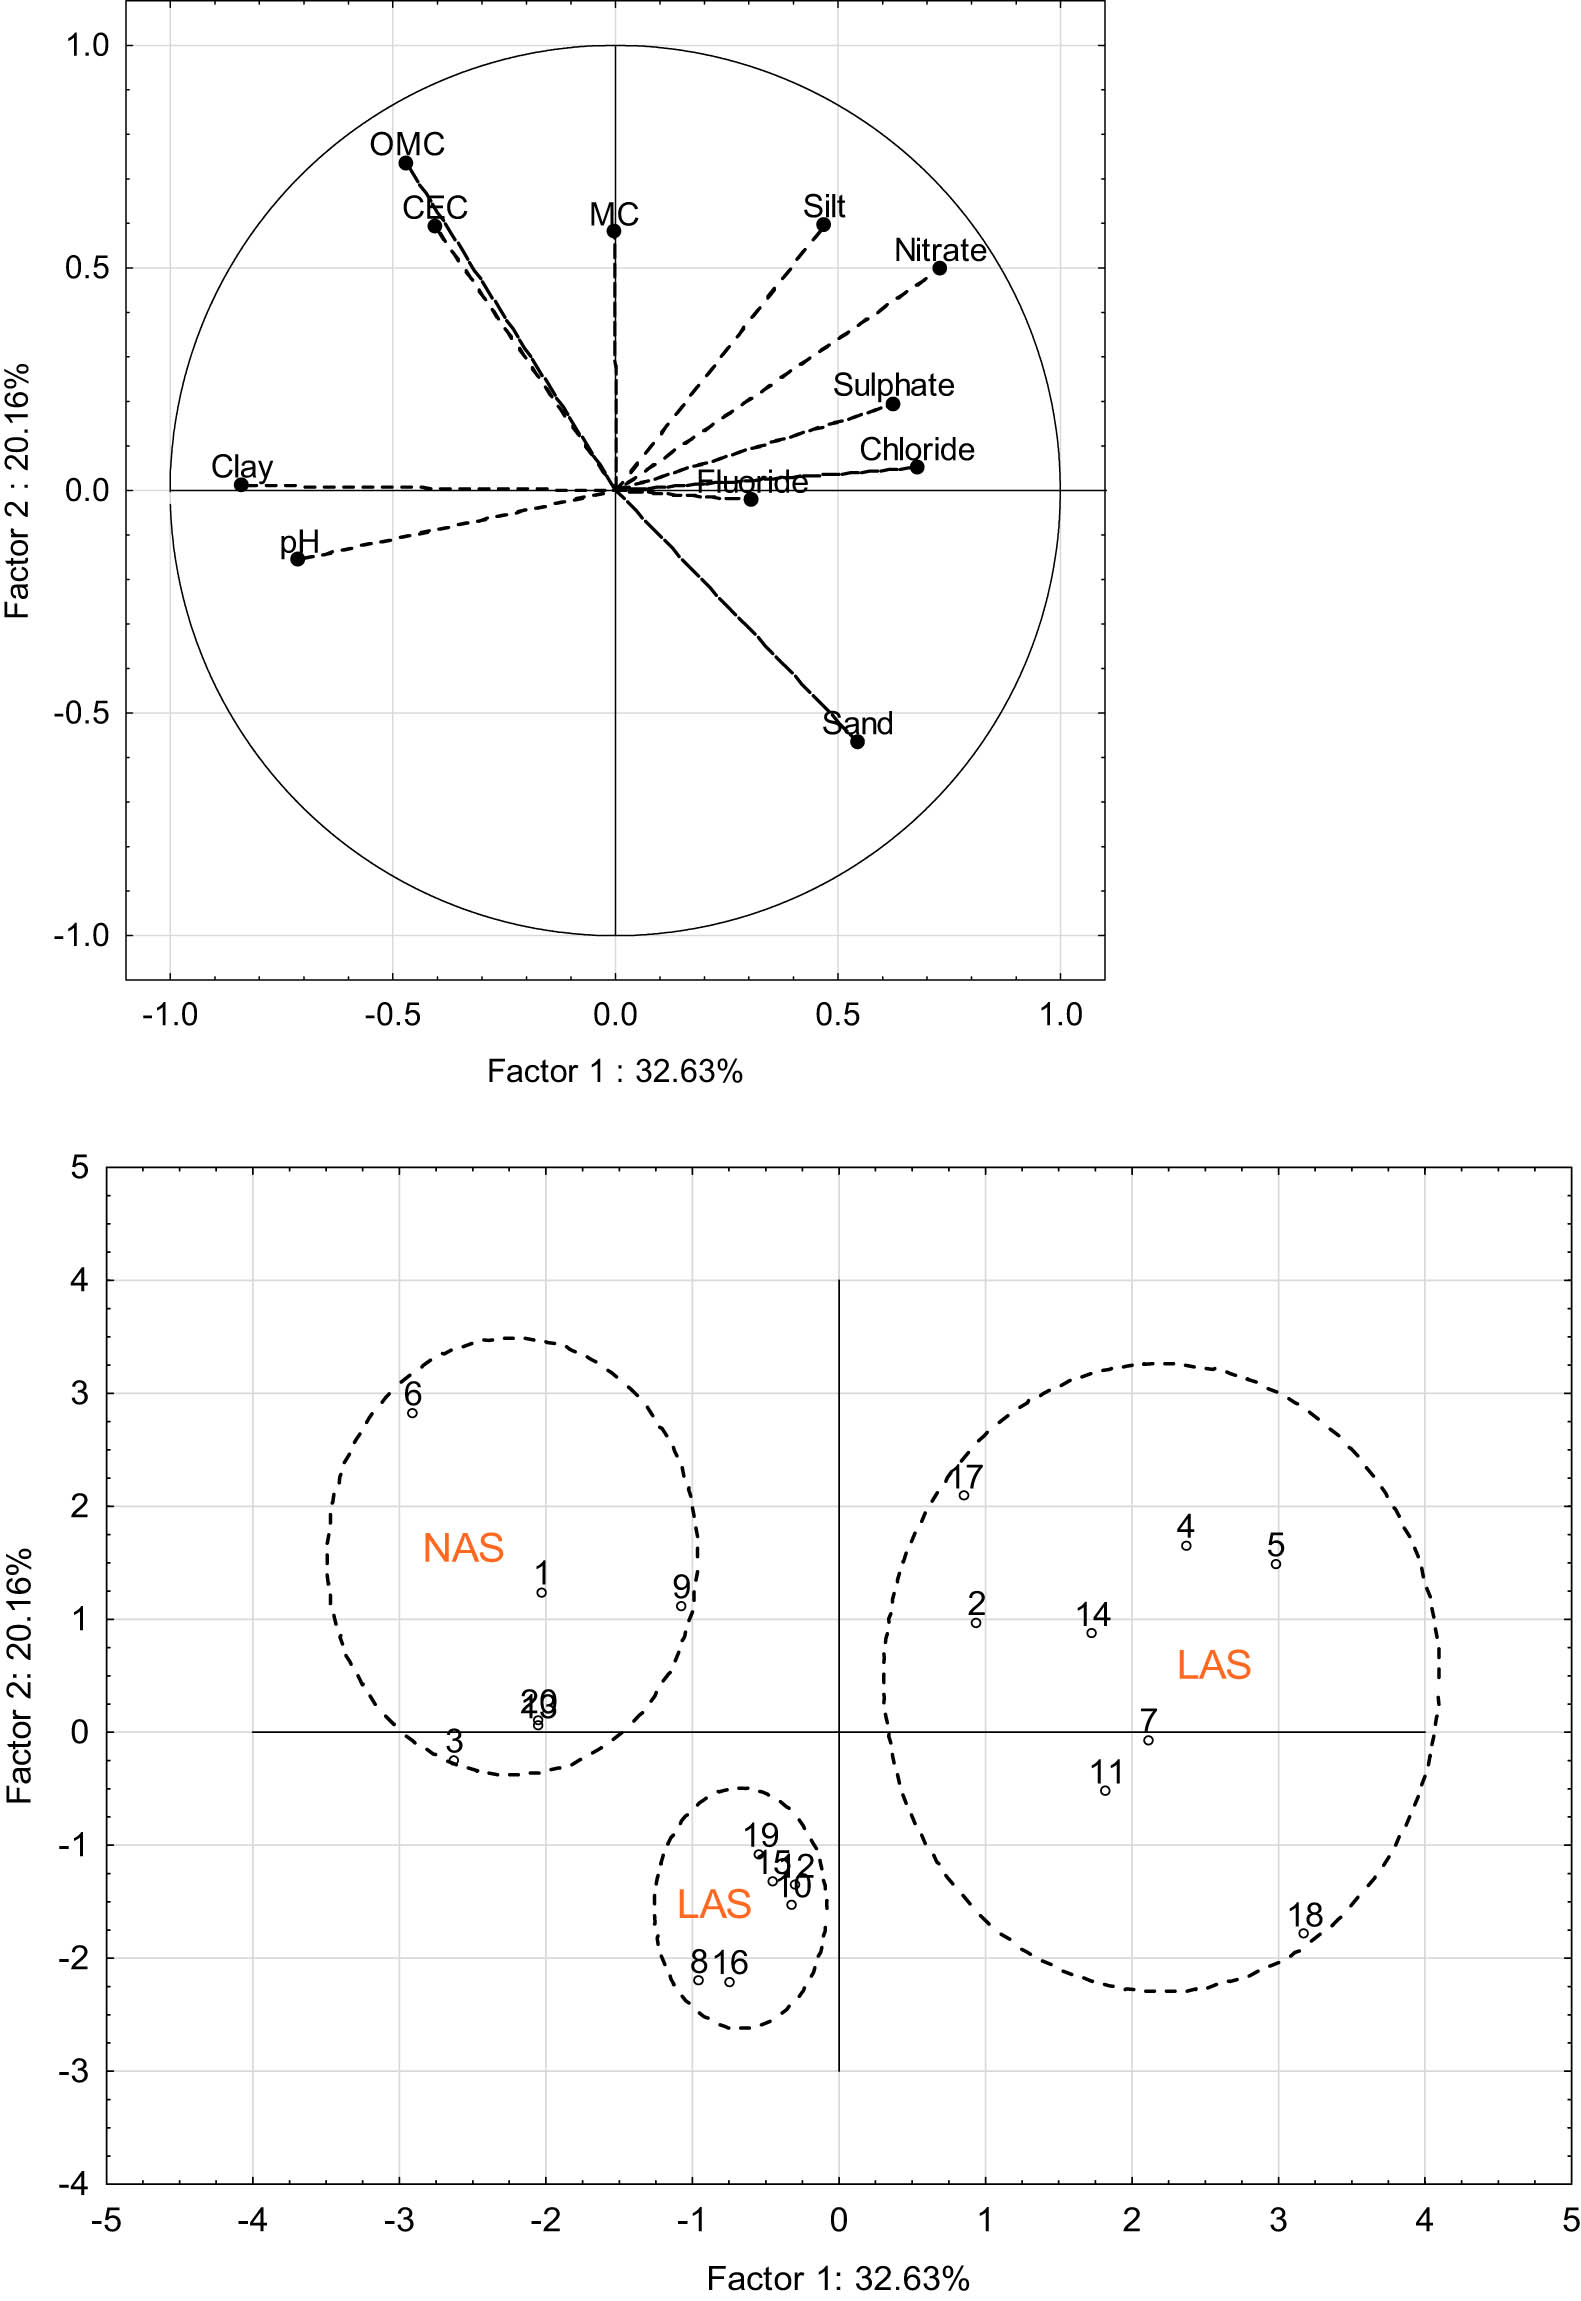
Principal component analysis (all tested properties included except clay mineralogy). NAS depict non-landslide affected samples while LAS indicates landslide affected samples.
Landslide classification
| Landslide types | Sampling locations |
|---|---|
| No landslide(NAS) | CH1, CH2, CH3, CH6, CH9, CH16, CH17 |
| Shallow (LAS) | CH4, CH5, CH8, CH10, CH12, CH13, CH15 |
| Deep (LAS) | CH7, CH11, CH14, CH18, CH19, CH20 |
CH = cameron highland, NAS = non-landslide affected slopes, LAS = landslide affected slopes.
3.3 Comparison between soil properties of NAS and LAS
The one-way ANOVA results (see Table 4) revealed a significant difference (p < 0.05) between NAS and LAS samples regarding sand, clay, OMC, and CEC. The box plot (see Figure 7) shows differences between these four properties across the LS. The soil grain size distribution of NAS samples is characterized by low sand (67.09%), low silt (9.39%), and high clay content (23.52%). Furthermore, this class exhibits relatively high MC (21.06%), high OMC (3.52%), low pH (4.63%), and high CEC (3.42 cmolc kg−1). However, the differences in the silt, MC, and pH are statistically insignificant across the LS. The anion concentrations in this group have relatively low sulfate (213.94 mg kg−1), low fluoride (12.49 mg kg−1), low chloride (56.88 mg kg−1), and high nitrate (1179.89 mg kg−1). Although anions vary across LS, this variation is statistically insignificant.
Physical-chemical properties vs slope classification
| Tested parameters | Slopes classification | Total | |
|---|---|---|---|
| NAS | LAS | Average | |
| Sand (%) | 67.09 ± 5.77a | 73.86 ± 4.27b | 70.99 ± 6.53 |
| Silt (%) | 9.39 ± 3.75a | 11.59 ± 7.02a | 10.82 ± 6.06 |
| Clay (%) | 23.52 ± 2.82a | 15.32 ± 7.92b | 18.19 ± 7.63 |
| MC (%) | 21.06 ± 7.27a | 19.74 ± 5.25a | 20.20 ± 5.88 |
| OMC (%) | 3.52 ± 1.12a | 2.39 ± 0.59b | 2.79 ± 0.96 |
| pH | 4.63 ± 0.37a | 4.71 ± 0.29a | 4.68 ± 0.31 |
| CEC (cmolc kg−1) | 3.42 ± 0.64a | 2.68 ± 0.57b | 2.88 ± 0.57 |
| Sulphate (
|
213.94 ± 158.80a | 274.67 ± 151.29a | 253.41 ± 152.65 |
| Fluoride (F−) (mg kg−1) | 12.49 ± 10.73a | 28.75 ± 24.37a | 23.06 ± 21.79 |
| Chloride (Cl−) (mg kg−1) | 56.88 ± 28.04a | 152.24 ± 133.84a | 118.86 ± 117.21 |
| Nitrate (
|
1179.89 ± 1119.19a | 1110.32 ± 980.71a | 1134.68 ± 1002.08 |
| Bromide (Br−) (mg kg−1) | Negligible | Negligible | Negligible |
| Nitrite (
|
Negligible | Negligible | Negligible |
Values are presented as mean ± standard deviation. The same letters following the values in the same row represent nonsignificant difference (i.e., Fisher’s LSD, p > 0.05). Different letters across a row indicates a significant difference.
NAS = non-landslide affected slopes, LAS = landslide affected slopes, OMC = organic matter content, CEC = cation exchange capacity.
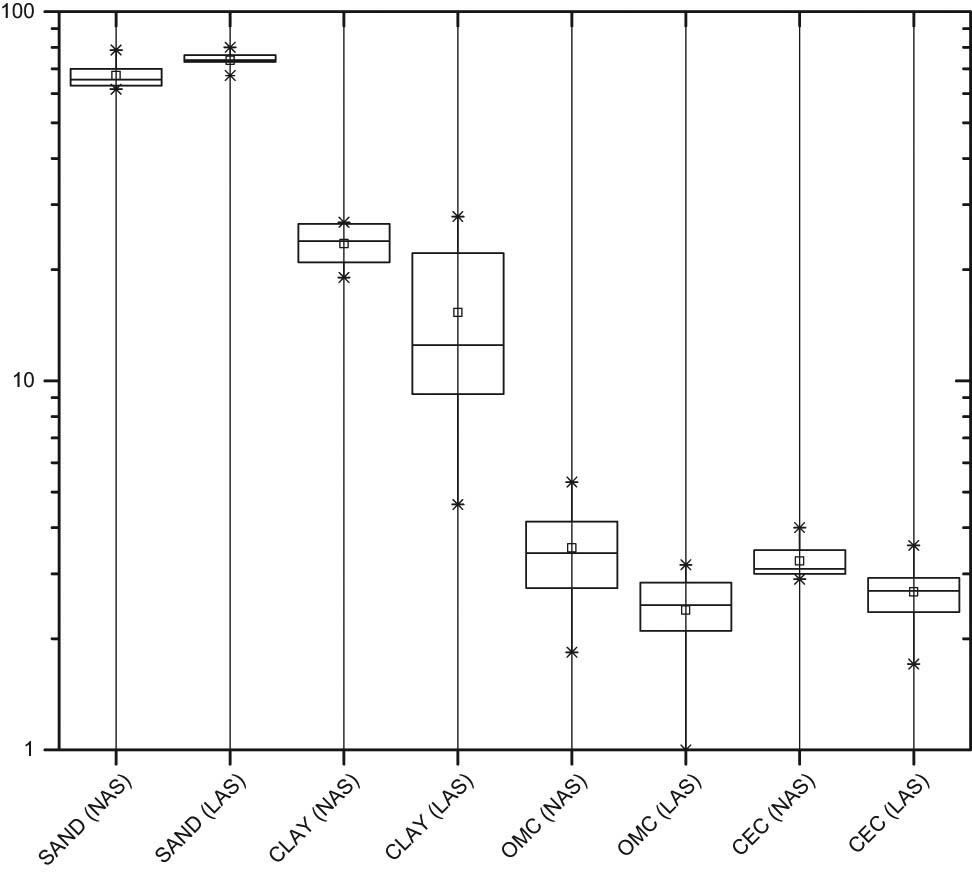
Box and whisker plot indicating differences in the parameters across slope classification. NAS depict non-landslide affected samples while LAS indicates landslide affected samples.
The grain size distribution of LAS samples is similar to the NAS soils but inversely proportional to each other. Sand is higher in LAS (73.86%), clay is lower (15.32%), and silt is not significantly different (11.59%). Also, LAS exhibits lower MC (19.74%), lower OMC (2.39%), higher pH (4.71%), and lower CEC (2.68 cmolc kg−1). Regarding anions, LAS possesses higher fluoride (28.75 mg kg−1), higher chloride (152.24 mg kg−1), slightly lower nitrate (1110.32 mg kg−1), and higher sulfate concentrations (274.67 mg kg−1). Bromide and nitrite concentrations are negligible because, of 20 samples, they were detected only in 2 and 1 samples, respectively.
Pearson’s correlation analysis (See Table 5) shows that LS was moderately and negatively correlated (p < 0.05) with clay, OMC, and CEC, but correlated positively with sand. However, the MC, pH, and anion concentration do not have any linear relationship with LS. Sand has a strong negative association with clay content and CEC and, to a lesser degree, with OMC (p < 0.02). Also, OMC exhibited a moderate positive correlation with MC and CEC (p < 0.05).
Pearson’s correlation among tested variables
| Sand | Silt | Clay | MC | OMC | CEC | pH | Sulphate | Fluoride | Chloride | Nitrate | |
|---|---|---|---|---|---|---|---|---|---|---|---|
| Silt | r = −0.24 | ||||||||||
| p = 0.31 | |||||||||||
| Clay | r = −0.62* | r = −0.57* | |||||||||
| p = 0.00 | p = 0.01 | ||||||||||
| MC | r = −0.10 | r = 0.04 | r = −0.02 | ||||||||
| p = 0.68 | p = 0.87 | p = 0.93 | |||||||||
| OMC | r = −0.58* | r = −0.06 | r = 0.40 | r = 0.51* | |||||||
| p = 0.01 | p = 0.80 | p = 0.08 | p = 0.02 | ||||||||
| CEC | r = −0.60* | r = 0.24 | r = 0.21 | r = 0.17 | r = 0.48* | ||||||
| p = 0.01 | p = 0.30 | p = 0.37 | p = 0.45 | p = 0.03 | |||||||
| pH | r = −0.12 | r = −0.19 | r = 0.29 | r = −0.05 | r = 0.14 | r = 0.37 | |||||
| p = 0.59 | p = 0.43 | p = 0.21 | p = 0.85 | p = 0.57 | p = 0.11 | ||||||
| Sulphate | r = 0.29 | r = 0.37 | r = −0.58* | r = −0.04 | r = −0.04 | r = −0.22 | r = −0.35 | ||||
| p = 0.22 | p = 0.10 | p = 0.01 | p = 0.85 | p = 0.85 | p = 0.34 | p = 0.13 | |||||
| Fluoride | r = 0.04 | r = 0.23 | r = −0.29 | r = −0.13 | r = −0.34 | r = 0.14 | r = −0.03 | r = 0.03 | |||
| p = 0.88 | p = 0.31 | p = 0.21 | p = 0.56 | p = 0.14 | p = 0.55 | p = 0.89 | p = 0.88 | ||||
| Chloride | r = 0.33 | r = 0.24 | r = −0.45* | r = −0.05 | r = −0.34 | r = −0.17 | r = −0.47 | r = 0.32 | r = 0.03 | ||
| p = 0.16 | p = 0.29 | p = 0.05 | p = 0.81 | p = 0.14 | p = 0.46 | p = 0.04 | p = 0.16 | p = 0.87 | |||
| Nitrate | r = −0.04 | r = 0.52* | r = −0.50* | r = 0.29 | r = 0.03 | r = −0.06 | r = −0.75* | r = 0.32 | r = −0.26 | r = 0.43 | |
| p = 0.87 | p = 0.02 | p = 0.02 | p = 0.21 | p = 0.87 | p = 0.79 | p = 0.00 | p = 0.17 | p = 0.27 | p = 0.06 | ||
| LS | r = 0.58* | r = 0.18 | r = −0.53* | r = −0.11 | r = −0.58* | r = −0.48* | r = 0.12 | r = 0.19 | r = 0.37 | r = 0.27 | r = −0.04 |
| p = 0.01 | p = 0.45 | p = 0.01 | p = 0.64 | p = 0.01 | p = 0.03 | p = 0.61 | p = 0.41 | p = 0.11 | p = 0.25 | p = 0.89 |
r = Pearson’s correlation coefficient, p = significant level, OMC = organic matter content, CEC = cation exchange capacity, MC = moisture content, LS = landslide susceptibility. * indicate p < 0.05.
4 Discussion
4.1 Relationship between LS, physical-geochemical parameters, anion concentrations, and clay mineralogy
The Cameron Highlands in Malaysia are susceptible to landslides because of the nature of the soil, rapid urbanization, and frequent rainfall. However, a distinction in soil properties was noticed between the LAS, which is highly susceptible, and the NAS, which is less susceptible. Sand, clay, OMC, and CEC are critical because of their statistical association with LS. Soil texture is a physical property that determines the soil slope strength. Soils with a high sand percentage with no sufficient clay-sized soil to bind the solution ions and fill the void have larger free pore spaces and weak bonds. When this feature (high sand) exists in the upper part of the slope, it becomes vulnerable to landslides (especially if the deeper part of such slope is more clayey). Thus, slopes with such soil fail more easily when there is a sufficient trigger mechanism, such as rainfall. Moreover, the electrostatic charges on the clay surface attract and bind the solution ions, increasing cohesion between the soil particles and, consequently, increasing slope stability [30,31]. Thus, when the clay content in a soil slope is very small (especially in the first two horizons) as is the case in this study, there would not be enough negative charge to bind the solution ions. Hence, the soil body would be easily slipped with continuous heavy rain because of the lose bond and over saturation.
Othman et al. [32] suggested that a soil slope with less than 15% clay content is very prone to landslide. However, soil with higher clay in the deeper layers may increase landslide because of the lower infiltration rendering the less clayey upper (sandy) part vulnerable to failure after saturation. However, at the surface level, high clay concentration (depending on the type of the clay) has a potential of reducing slope failure because of a strong bond and under saturation. Also, sand allows higher water infiltration that could apparently reduce slope failure if the deeper part is not highly clayey. The landslide in the study area usually occurs during the monsoon period when there is intense continuous rainfall. As the slope becomes saturated due to prolonged rainfall, water cannot sink in anymore. The water would become movable with a high force within the slope due to the additional water from the rainfall, which would lead to slope failure. The positive association between sand and LS and the negative relationship between clay and LS reflect the link between soil texture and LS. This finding correlates well with the works of refs. [13,32].
Clay was negatively associated with sulfate, chloride, and nitrate. However, these anions appear not to directly influence LS in the study area; therefore, there could be other factors that influence their concentrations or the correlation may be random. However,
The low OMC, CEC, and pH discovered here were aided by quick laterization, leading to the declination and, sometimes, the disappearance of primary minerals, which eventually contribute to the acidity and low organic materials of the soil [35]. High OMC in the soil contributes to the reduction in its acidity [36,37]. However, short-term changes in the soil OMC alone have a little effect on its pH because of the soil buffering capacity. Acidic soils are at risk of Ca, Mg, and K depletion. They exhibit a lower solubility rate of Mo and P compounds and a high rate of colloidal dispersion, lowering the concentrations of Mo, P, and Ca in acidic soils and, consequently, reducing the binding effect within the soil [38]. Soil with a high CEC can retain more cations (such as Ca, Mg, Na, K, and Al) to the exchange areas of OMC and clay, improving soil stability through the binding effect that results from the attraction between solution ions via electrostatic surface charges of clay in the soil [39]. Statistical analysis in this research shows that OMC and CEC were negatively interrelated with the sand content but positively with each other. The natural relationship between these parameters supports the statistical results, as elaborated on in the previous sentences. Thus, soil slopes with high OMC, high CEC, low sand, and high pH would be relatively stable.
The abundance of kaolinite and illite in the study area indicates the weathering of primary minerals of muscovite and feldspar that form the bedrock [40,41], implying that the rock is in the last stage of weathering, weakening the slope strength [12]. Illite clay originates from the weathering of rocks rich in K and Al, such as mica and K-feldspar. Similarly, kaolinite formation is related to the weathering of aluminosilicate minerals or hydrothermal alteration [42]. In the case of weathering as a form of origin of kaolinite, orthoclase feldspar is usually the weathered minerals. During the weathering process, silicon is replaced by aluminum and cations, such as Na, Ca, K, and Mg, and Fe is leached [43]. The lower cation concentrations, mentioned earlier, occasioned by the formation of kaolinite make the soil slope vulnerable to failure [32].
4.2 Mitigation measures
The physical and chemical properties of soil slopes in the Cameron Highlands are among the factors that cause frequent landslide occurrences. The causative factors identified must be improved to increase the mitigation of this hazard. Vegetation is critical in slope stability. A good root system architecture could increase the shear strength of weak soil, reducing the influence of rain and increasing the cohesiveness of the soil, thus preventing it from falling. Unfortunately, from our field observation, most slopes where samples were taken in the Cameron Highlands are not highly vegetated, exposing them to further risk of failure. Also, most slopes visited fall within the V–VI weathering grade according to the International Association for engineering geology and the environment classification; therefore, the rocks are in their last stage of weathering, exposing them to more risk of failure. Authorities should investigate and plant vegetation types using root system architecture that could stabilize the soil slopes based on their physical, geochemical, and mineralogical properties. Also, low-cost chemical alteration of the soil slope toward improving their strength will be an effective mitigation measure. If the identified causative factors in this study are improved, it will further assist in mitigating the hazard.
4.3 Future research directions
Future researchers may increase the number of samples and cover more natural slopes in Cameron Highlands to further confirm the claims in this research. Another interesting study in this area is the investigation of the vegetation types and plant root system architecture that could stabilize the soil slopes based on their physical, mineralogical, and geochemical properties. The influence of heavy metals, cations, and soil color variables of the study area on LS is another needed research. Also, low-cost chemical alteration of the soil slope toward improving their strength will be an exciting topic. Furthermore, the identification of factors that influences the soil properties (that reduces slope strength) reported in this article will be an interesting research. Apart from the Cameron Highlands, other soil slopes with similar characteristics that have undergone shallow and deep-seated landslides in Malaysia should be studied regarding physical, geochemical, and mineralogical properties. The results should be compared to ascertain the most contributing parameter(s) in the country. Also, there are very few soil mineralogical studies of Cameron highland. This is also a gap in the research that needs attention.
5 Conclusions and recommendations
Several physical, geochemical, and mineralogical properties of soil slopes from the Cameron Highlands in Malaysia were evaluated to determine their relationship with LS. The following results were found:
Sand, clay, OMC, and CEC correlated with LS (p < 0.04). Samples taken from lower susceptible slopes were characterized with a significant lower sand, higher clay, higher OMC, and higher CEC.
XD analysis shows that kaolinite and illite are abundant in this area, implying the last stage of weathering, which lowers the concentration of cations such as Na, Ca, K, and Mg, and Fe that indirectly makes the soil slope vulnerable to failure.
Overall, a high sand content, low clay content, low OMC, low CEC, and clay mineralogy of the soil were found to be part of LS factors in the study area. This study shows that the landslide of the study area is not only caused by rainfall but also by the properties of the soil.
The outcome of this research can be used in landslide mitigation studies and programs. Therefore, it is recommended that these factors should be included among the parameters to be considered in any landslide assessment in the Cameron Highland and other areas with similar soil properties and conditions.
-
Funding information: This research was funded by the Institute of Research Management and Services, University of Malaya through postgraduate research grant (PG281-2016A). It was also gratefully supported by King Saud University, Deanship of Scientific Research, and College of Science Research Center, for, Saleh Qaysi.
-
Author contributions: A.O. prepared the first draft and all co-authors reviewed it, attended the field work, participated in the lab work, carried out the statistical analysis, and acquired initial funding. A.F.A.B. supervised the work, led the field work, and assisted in the acquisition of the initial fund. I.Y. provided lab support and assisted in the acquisition of the initial fund. A.A.G. provided lab support and assisted in the acquisition of the initial fund. S.Q. provided statistical analysis support and acquired additional fund. A.K. edited the figures and assisted in the acquisition of additional fund. Hussain A. provided technical support and assisted in the acquisition of additional fund. Hassan A. provided technical support and assisted in the acquisition of additional fund.
-
Conflict of interest: Authors state no conflict of interest.
References
[1] Kirschbaum D, Stanley T, Zhou YP. Spatial and temporal analysis of a global landslide catalog. Geomorphology. 2015;249:4–15. 10.1016/j.geomorph.2015.03.016. Suche in Google Scholar
[2] Samy IE, Marghany MM, Mohamed MM. Landslide modelling and analysis using remote sensing and GIS: A case study of Cameron highland, Malaysia. J Geomat. 2014;8(2):140–7.Suche in Google Scholar
[3] Qasim S, Harahap ISH, Osman SBS. Causal factors of Malaysian landslides: a narrative study. RJASET. 2013;5(7):2303–8. 10.19026/rjaset.5.4656.Suche in Google Scholar
[4] Othman R, Hasni SI, Baharuddin ZM. Analysis of heavy metals as a key indicator to predict shallow slope failure. J Env Biol. 2016;37(5):1181–5. https://www.ncbi.nlm.nih.gov/pubmed/29989751Suche in Google Scholar
[5] Mohamed SI, Ahmadun Fl-R. Disaster types in Malaysia: an overview. Disaster Prev Manag. 2006;15(2):286–98. 10.1108/09653560610659838.Suche in Google Scholar
[6] Jebur MN, Pradhan B, Tehrany MS. Optimization of landslide conditioning factors using very high-resolution airborne laser scanning (LiDAR) data at catchment scale. Remote Sens Env. 2014;100(152):150–65. 10.1016/j.rse.2014.05.013.Suche in Google Scholar
[7] Deiana M, Cervi F, Pennisi M, Mussi M, Bertrand C, Tazioli A, et al. Chemical and isotopic investigations (δ18O, δ2H, 3H, 87Sr/86Sr) to define groundwater processes occurring in a deep-seated landslide in flysch. Hydrogeol J. 2018;26(8):2669–91. 10.1007/s10040-018-1807-1.Suche in Google Scholar
[8] Deiana M, Mussi M, Pennisi M, Boccolari M, Corsini A, Ronchetti F. Contribution of water geochemistry and isotopes (δ 18 O, δ 2 H, 3 H, 87 Sr/86 Sr and δ 11 B) to the study of groundwater flow properties and underlying bedrock structures of a deep landslide. Env Earth Sci. 2020;79(1):1–15. 10.1007/s12665-019-8772-4.Suche in Google Scholar
[9] Sajinkumar KS, Unnikrishnan WC, Muraleedharan C, Shahul HA, Rani VR, Pradeepkumar AP, et al. A study on landslides and subsurface piping, facilitated by dykes, using vertical electrical sounding and δO 18 and δH 2 stable isotopes. Bull Eng Geol Env. 2017;76(4):1297–306. 10.1007/s10064-017-1056-x.Suche in Google Scholar
[10] Hosseini S, Lashkaripour GR, Moghaddas NH, Ghafoori M. Indexing the engineering properties of residual soils in the southern slopes of Mashhad, NE Iran. J Mt Sci. 2020;17(9):2179–202. 10.1007/s11629-019-5770-7.Suche in Google Scholar
[11] Regmi AD, Yoshida K, Dhital MR, Devkota K. Effect of rock weathering, clay mineralogy, and geological structures in the formation of large landslide, a case study from Dumre Besei landslide, Lesser Himalaya Nepal. Landslides. 2013;10(1):1–13. 10.1007/s10346-011-0311-7.Suche in Google Scholar
[12] Yahşi BK, Ersoy H. Effect of mineralogical composition related to profile depth on index and strength properties of regolith soil. Bull Eng Geol Env. 2021;80(2):1791–808. 10.1007/s10064-020-01968-8.Suche in Google Scholar
[13] Summa V, Margiotta S, Colaiacovo R, Giannossi ML. The influence of the grain-size, mineralogical and geochemical composition on the Verdesca landslide. Nat Hazards Earth Syst Sci. 2015;15(1):135–46. 10.5194/nhess-15-135-2015.Suche in Google Scholar
[14] Vingiani S, Mele G, De Mascellis R, Terribile F, Basile A. Volcanic soils and landslides: a case study of the island of Ischia (southern Italy) and its relationship with other Campania events. Solid Earth. 2015;6(2):783–97. 10.5194/se-6-783-2015.Suche in Google Scholar
[15] Fanos AM, Pradhan B. A novel hybrid machine learning-based model for rockfall source identification in presence of other landslide types using LiDAR and GIS. Earth Syst Env. 2019;3(3):491–506. 10.1007/s41748-019-00114-z.Suche in Google Scholar
[16] Nhu VH, Mohammadi A, Shahabi H, Ahmad BB, Al-Ansari N, Shirzadi A, et al. Landslide detection and susceptibility modeling on Cameron Highlands (Malaysia): a comparison between random forest, logistic regression and logistic model tree algorithms. Forests. 2020;11(8):830. 10.3390/f11080830.Suche in Google Scholar
[17] Pradhan B, Jebur MN, Shafri HZM, Tehrany MS. Data fusion technique using wavelet transform and taguchi methods for automatic landslide detection from airborne laser scanning data and quickbird satellite imagery. IEEE Trans Geosci Remote Sens. 2016;54(3):1610–22. 10.1109/TGRS.2015.2484325.Suche in Google Scholar
[18] Sameen MI, Pradhan B, Bui DT, Alamri AM. Systematic sample subdividing strategy for training landslide susceptibility models. CATENA. 2020;187:104358. 10.1016/j.catena.2019.104358.Suche in Google Scholar
[19] Jamalluddin D, Ahmad F, Abidin RZ. Characteristics of soil taken from slope failures in sedimentary and granitic residual soils. Int J Civ Env Engr. 2014;14(6):31–7.Suche in Google Scholar
[20] Aik DHJ, Ismail MH, Muharam FM. Land use/land cover changes and the relationship with land surface temperature using landsat and MODIS imageries in Cameron Highlands. Malays Land. 2020;9(10):372. 10.3390/land9100372.Suche in Google Scholar
[21] Pradhan B, Lee S. Regional landslide susceptibility analysis using back-propagation neural network model at Cameron Highland, Malaysia. Landslides. 2010;7(1):13–30. 10.1007/s10346-009-0183-2.Suche in Google Scholar
[22] Nampak H, Pradhan B, Rizeei HM, Park H-J. Assessment of land cover and land use change impact on soil loss in a tropical catchment by using multitemporal SPOT‐5 satellite images and R evised U niversal Soil L oss E quation model. Land Degrad Dev. 2018;29(10):3440–55. 10.1002/ldr.3112.Suche in Google Scholar
[23] Tien BD, Shahabi H, Shirzadi A, Chapi K, Alizadeh M, Chen W, et al. Landslide detection and susceptibility mapping by airsar data using support vector machine and index of entropy models in Cameron Highlands, Malaysia. Remote Sens. 2018;10(10):1527. 10.3390/rs10101527.Suche in Google Scholar
[24] Rahman HA, Mapjabil J. Landslides disaster in Malaysia: an overview. Health Env J. 2017;8(1):58–71.Suche in Google Scholar
[25] Marto A, Yusoff SYM. Major soil type, soil classification, and soil maps. soils of Malaysia. Boca Raton: CRC Press; 2017. p. 69–101.10.1201/9781315277189-5Suche in Google Scholar
[26] Habibah J, Khairiah J, Ismail B, Kadderi M. Manganese speciation in selected agricultural soils of peninsular Malaysia. Am. J Env Sci. 2014;10(2):148–56. 10.3844/ajessp.2014.148.156.Suche in Google Scholar
[27] Rendana M, Rahim SA, Idris WMR, Lihan T, Rahman ZA. CA-Markov for predicting land use changes in tropical catchment area: a case study in Cameron Highland, Malaysia. J Appl Sci. 2015;15(4):689–95. 10.3923/jas.2015.689.695.Suche in Google Scholar
[28] Heiri O, Lotter AF, Lemcke G. Loss on ignition as a method for estimating organic and carbonate content in sediments: reproducibility and comparability of results. J Paleolimnol. 2001;25(1):101–10. 10.1023/A:1008119611481.Suche in Google Scholar
[29] Yukselen Y, Kaya A. Suitability of the methylene blue test for surface area, cation exchange capacity and swell potential determination of clayey soils. Eng Geol. 2008;102(1–2):38–45. 10.1016/j.enggeo.2008.07.002.Suche in Google Scholar
[30] Olphen HV. An introduction to clay colloid chemistry: for clay technologists, geologists, and soil chemists. London: Interscience Publishers; 1963.10.1097/00010694-196404000-00013Suche in Google Scholar
[31] Yamaki A, Anzai T. An estimation of cation exchange capacity on upland soils in Chiba Prefecture. Jpn J Soil Sci Plant Nutr. 2001;72(5):679–83.Suche in Google Scholar
[32] Othman R, Hasni SI, Baharuddin ZM, Hashim KSH-Y, Mahamod LH. Key indicator tools for shallow slope failure assessment using soil chemical property signatures and soil colour variables. Env Sci Pollut Res. 2017;24(29):22861–72. 10.1007/s11356-017-9715-9 Suche in Google Scholar PubMed
[33] Mohammed A, Vipulanandan C. Testing and modeling the short-term behavior of lime and fly ash treated sulfate contaminated CL soil. Geotech Geol Eng. 2015;33(4):1099–114. 10.1007/s10706-015-9890-8.Suche in Google Scholar
[34] Sato Y, Kometani M, Satake H, Nozaki T, Kusakabe M. Calcium–sulfate rich water in landslide area of Tateyama Caldera, northern central Japan. Geochem J. 2013;47(6):609–23. 10.2343/geochemj.2.0284.Suche in Google Scholar
[35] Almajmaie A, Hardie M, Doyle R, Birch C, Acuna T. Influence of soil properties on the aggregate stability of cultivated sandy clay loams. J Soils Sediment. 2017;17(3):800–9. 10.1007/s11368-016-1568-1.Suche in Google Scholar
[36] Blake WH, Droppo IG, Humphreys GS, Doerr SH, Shakesby RA, Wallbrink PJ. Structural characteristics and behavior of fire-modified soil aggregates. J Geophys Res. 2007;112(F2):1–8. 10.1029/2006JF000660.Suche in Google Scholar
[37] Liu T, Wu X, Li H, Alharbi H, Wang J, Dang P, et al. Soil organic matter, nitrogen and pH driven change in bacterial community following forest conversion. For Ecol Manag. 2020;477:118473. 10.1016/j.foreco.2020.118473.Suche in Google Scholar
[38] Delgado A, Gómez JA. The soil: Physical, chemical and biological properties. In: Villalobos FJ, Fereres E, editors. Principles of Agronomy for Sustainable Agriculture. Switzerland: Springer International Publishing; 2016. p. 15–26. 10.1007/978-3-319-46116-8_2.Suche in Google Scholar
[39] Olorunfemi I, Fasinmirin J, Ojo A. Modeling cation exchange capacity and soil water holding capacity from basic soil properties. Eurasian J Soil Sci. 2016;5(4):266–74. 10.18393/ejss.2016.4.266-274.Suche in Google Scholar
[40] Noran N, Simon N, Azimah H, Rodeano R, Ern L. Chemical properties characterization failed slopes along the Ranau-tambahan road, Sabah, Malaysia (in Malay, abstract in English). Sains Malays. 2017;46(6):867–77.10.17576/jsm-2017-4606-05Suche in Google Scholar
[41] Cesarano M, Bish DL, Cappelletti P, Cavalcante F, Belviso C, Fiore S. Quantitative mineralogy of clay-rich siliciclastic landslide terrain of the Sorrento Peninsula, Italy, using a combined XRPD and XRF approach. Clays Clay Min. 2018;66(4):353–69. 10.1346/CCMN.2018.064108.Suche in Google Scholar
[42] Sayin A. Origin of kaolin deposits: evidence from the Hisarcık (Emet-Kütahya) deposits, western Turkey. Turk J Earth Sci. 2007;16(1):77–96.Suche in Google Scholar
[43] White AF, Bullen TD, Schulz MS, Blum AE, Huntington TG, Peters NE. Differential rates of feldspar weathering in granitic regoliths. Geochim Cosmochim Acta. 2001;65(6):847–69. 10.1016/S0016-703700577-9.Suche in Google Scholar
© 2021 Abdulrasheed Olaniyan et al., published by De Gruyter
This work is licensed under the Creative Commons Attribution 4.0 International License.
Artikel in diesem Heft
- Regular Articles
- Lithopetrographic and geochemical features of the Saalian tills in the Szczerców outcrop (Poland) in various deformation settings
- Spatiotemporal change of land use for deceased in Beijing since the mid-twentieth century
- Geomorphological immaturity as a factor conditioning the dynamics of channel processes in Rządza River
- Modeling of dense well block point bar architecture based on geological vector information: A case study of the third member of Quantou Formation in Songliao Basin
- Predicting the gas resource potential in reservoir C-sand interval of Lower Goru Formation, Middle Indus Basin, Pakistan
- Study on the viscoelastic–viscoplastic model of layered siltstone using creep test and RBF neural network
- Assessment of Chlorophyll-a concentration from Sentinel-3 satellite images at the Mediterranean Sea using CMEMS open source in situ data
- Spatiotemporal evolution of single sandbodies controlled by allocyclicity and autocyclicity in the shallow-water braided river delta front of an open lacustrine basin
- Research and application of seismic porosity inversion method for carbonate reservoir based on Gassmann’s equation
- Impulse noise treatment in magnetotelluric inversion
- Application of multivariate regression on magnetic data to determine further drilling site for iron exploration
- Comparative application of photogrammetry, handmapping and android smartphone for geotechnical mapping and slope stability analysis
- Geochemistry of the black rock series of lower Cambrian Qiongzhusi Formation, SW Yangtze Block, China: Reconstruction of sedimentary and tectonic environments
- The timing of Barleik Formation and its implication for the Devonian tectonic evolution of Western Junggar, NW China
- Risk assessment of geological disasters in Nyingchi, Tibet
- Effect of microbial combination with organic fertilizer on Elymus dahuricus
- An OGC web service geospatial data semantic similarity model for improving geospatial service discovery
- Subsurface structure investigation of the United Arab Emirates using gravity data
- Shallow geophysical and hydrological investigations to identify groundwater contamination in Wadi Bani Malik dam area Jeddah, Saudi Arabia
- Consideration of hyperspectral data in intraspecific variation (spectrotaxonomy) in Prosopis juliflora (Sw.) DC, Saudi Arabia
- Characteristics and evaluation of the Upper Paleozoic source rocks in the Southern North China Basin
- Geospatial assessment of wetland soils for rice production in Ajibode using geospatial techniques
- Input/output inconsistencies of daily evapotranspiration conducted empirically using remote sensing data in arid environments
- Geotechnical profiling of a surface mine waste dump using 2D Wenner–Schlumberger configuration
- Forest cover assessment using remote-sensing techniques in Crete Island, Greece
- Stability of an abandoned siderite mine: A case study in northern Spain
- Assessment of the SWAT model in simulating watersheds in arid regions: Case study of the Yarmouk River Basin (Jordan)
- The spatial distribution characteristics of Nb–Ta of mafic rocks in subduction zones
- Comparison of hydrological model ensemble forecasting based on multiple members and ensemble methods
- Extraction of fractional vegetation cover in arid desert area based on Chinese GF-6 satellite
- Detection and modeling of soil salinity variations in arid lands using remote sensing data
- Monitoring and simulating the distribution of phytoplankton in constructed wetlands based on SPOT 6 images
- Is there an equality in the spatial distribution of urban vitality: A case study of Wuhan in China
- Considering the geological significance in data preprocessing and improving the prediction accuracy of hot springs by deep learning
- Comparing LiDAR and SfM digital surface models for three land cover types
- East Asian monsoon during the past 10,000 years recorded by grain size of Yangtze River delta
- Influence of diagenetic features on petrophysical properties of fine-grained rocks of Oligocene strata in the Lower Indus Basin, Pakistan
- Impact of wall movements on the location of passive Earth thrust
- Ecological risk assessment of toxic metal pollution in the industrial zone on the northern slope of the East Tianshan Mountains in Xinjiang, NW China
- Seasonal color matching method of ornamental plants in urban landscape construction
- Influence of interbedded rock association and fracture characteristics on gas accumulation in the lower Silurian Shiniulan formation, Northern Guizhou Province
- Spatiotemporal variation in groundwater level within the Manas River Basin, Northwest China: Relative impacts of natural and human factors
- GIS and geographical analysis of the main harbors in the world
- Laboratory test and numerical simulation of composite geomembrane leakage in plain reservoir
- Structural deformation characteristics of the Lower Yangtze area in South China and its structural physical simulation experiments
- Analysis on vegetation cover changes and the driving factors in the mid-lower reaches of Hanjiang River Basin between 2001 and 2015
- Extraction of road boundary from MLS data using laser scanner ground trajectory
- Research on the improvement of single tree segmentation algorithm based on airborne LiDAR point cloud
- Research on the conservation and sustainable development strategies of modern historical heritage in the Dabie Mountains based on GIS
- Cenozoic paleostress field of tectonic evolution in Qaidam Basin, northern Tibet
- Sedimentary facies, stratigraphy, and depositional environments of the Ecca Group, Karoo Supergroup in the Eastern Cape Province of South Africa
- Water deep mapping from HJ-1B satellite data by a deep network model in the sea area of Pearl River Estuary, China
- Identifying the density of grassland fire points with kernel density estimation based on spatial distribution characteristics
- A machine learning-driven stochastic simulation of underground sulfide distribution with multiple constraints
- Origin of the low-medium temperature hot springs around Nanjing, China
- LCBRG: A lane-level road cluster mining algorithm with bidirectional region growing
- Constructing 3D geological models based on large-scale geological maps
- Crops planting structure and karst rocky desertification analysis by Sentinel-1 data
- Physical, geochemical, and clay mineralogical properties of unstable soil slopes in the Cameron Highlands
- Estimation of total groundwater reserves and delineation of weathered/fault zones for aquifer potential: A case study from the Federal District of Brazil
- Characteristic and paleoenvironment significance of microbially induced sedimentary structures (MISS) in terrestrial facies across P-T boundary in Western Henan Province, North China
- Experimental study on the behavior of MSE wall having full-height rigid facing and segmental panel-type wall facing
- Prediction of total landslide volume in watershed scale under rainfall events using a probability model
- Toward rainfall prediction by machine learning in Perfume River Basin, Thua Thien Hue Province, Vietnam
- A PLSR model to predict soil salinity using Sentinel-2 MSI data
- Compressive strength and thermal properties of sand–bentonite mixture
- Age of the lower Cambrian Vanadium deposit, East Guizhou, South China: Evidences from age of tuff and carbon isotope analysis along the Bagong section
- Identification and logging evaluation of poor reservoirs in X Oilfield
- Geothermal resource potential assessment of Erdaobaihe, Changbaishan volcanic field: Constraints from geophysics
- Geochemical and petrographic characteristics of sediments along the transboundary (Kenya–Tanzania) Umba River as indicators of provenance and weathering
- Production of a homogeneous seismic catalog based on machine learning for northeast Egypt
- Analysis of transport path and source distribution of winter air pollution in Shenyang
- Triaxial creep tests of glacitectonically disturbed stiff clay – structural, strength, and slope stability aspects
- Effect of groundwater fluctuation, construction, and retaining system on slope stability of Avas Hill in Hungary
- Spatial modeling of ground subsidence susceptibility along Al-Shamal train pathway in Saudi Arabia
- Pore throat characteristics of tight reservoirs by a combined mercury method: A case study of the member 2 of Xujiahe Formation in Yingshan gasfield, North Sichuan Basin
- Geochemistry of the mudrocks and sandstones from the Bredasdorp Basin, offshore South Africa: Implications for tectonic provenance and paleoweathering
- Apriori association rule and K-means clustering algorithms for interpretation of pre-event landslide areas and landslide inventory mapping
- Lithology classification of volcanic rocks based on conventional logging data of machine learning: A case study of the eastern depression of Liaohe oil field
- Sequence stratigraphy and coal accumulation model of the Taiyuan Formation in the Tashan Mine, Datong Basin, China
- Influence of thick soft superficial layers of seabed on ground motion and its treatment suggestions for site response analysis
- Monitoring the spatiotemporal dynamics of surface water body of the Xiaolangdi Reservoir using Landsat-5/7/8 imagery and Google Earth Engine
- Research on the traditional zoning, evolution, and integrated conservation of village cultural landscapes based on “production-living-ecology spaces” – A case study of villages in Meicheng, Guangdong, China
- A prediction method for water enrichment in aquifer based on GIS and coupled AHP–entropy model
- Earthflow reactivation assessment by multichannel analysis of surface waves and electrical resistivity tomography: A case study
- Geologic structures associated with gold mineralization in the Kirk Range area in Southern Malawi
- Research on the impact of expressway on its peripheral land use in Hunan Province, China
- Concentrations of heavy metals in PM2.5 and health risk assessment around Chinese New Year in Dalian, China
- Origin of carbonate cements in deep sandstone reservoirs and its significance for hydrocarbon indication: A case of Shahejie Formation in Dongying Sag
- Coupling the K-nearest neighbors and locally weighted linear regression with ensemble Kalman filter for data-driven data assimilation
- Multihazard susceptibility assessment: A case study – Municipality of Štrpce (Southern Serbia)
- A full-view scenario model for urban waterlogging response in a big data environment
- Elemental geochemistry of the Middle Jurassic shales in the northern Qaidam Basin, northwestern China: Constraints for tectonics and paleoclimate
- Geometric similarity of the twin collapsed glaciers in the west Tibet
- Improved gas sand facies classification and enhanced reservoir description based on calibrated rock physics modelling: A case study
- Utilization of dolerite waste powder for improving geotechnical parameters of compacted clay soil
- Geochemical characterization of the source rock intervals, Beni-Suef Basin, West Nile Valley, Egypt
- Satellite-based evaluation of temporal change in cultivated land in Southern Punjab (Multan region) through dynamics of vegetation and land surface temperature
- Ground motion of the Ms7.0 Jiuzhaigou earthquake
- Shale types and sedimentary environments of the Upper Ordovician Wufeng Formation-Member 1 of the Lower Silurian Longmaxi Formation in western Hubei Province, China
- An era of Sentinels in flood management: Potential of Sentinel-1, -2, and -3 satellites for effective flood management
- Water quality assessment and spatial–temporal variation analysis in Erhai lake, southwest China
- Dynamic analysis of particulate pollution in haze in Harbin city, Northeast China
- Comparison of statistical and analytical hierarchy process methods on flood susceptibility mapping: In a case study of the Lake Tana sub-basin in northwestern Ethiopia
- Performance comparison of the wavenumber and spatial domain techniques for mapping basement reliefs from gravity data
- Spatiotemporal evolution of ecological environment quality in arid areas based on the remote sensing ecological distance index: A case study of Yuyang district in Yulin city, China
- Petrogenesis and tectonic significance of the Mengjiaping beschtauite in the southern Taihang mountains
- Review Articles
- The significance of scanning electron microscopy (SEM) analysis on the microstructure of improved clay: An overview
- A review of some nonexplosive alternative methods to conventional rock blasting
- Retrieval of digital elevation models from Sentinel-1 radar data – open applications, techniques, and limitations
- A review of genetic classification and characteristics of soil cracks
- Potential CO2 forcing and Asian summer monsoon precipitation trends during the last 2,000 years
- Erratum
- Erratum to “Calibration of the depth invariant algorithm to monitor the tidal action of Rabigh City at the Red Sea Coast, Saudi Arabia”
- Rapid Communication
- Individual tree detection using UAV-lidar and UAV-SfM data: A tutorial for beginners
- Technical Note
- Construction and application of the 3D geo-hazard monitoring and early warning platform
- Enhancing the success of new dams implantation under semi-arid climate, based on a multicriteria analysis approach: Case of Marrakech region (Central Morocco)
- TRANSFORMATION OF TRADITIONAL CULTURAL LANDSCAPES - Koper 2019
- The “changing actor” and the transformation of landscapes