
Influence of diagenetic features on petrophysical properties of fine-grained rocks of Oligocene strata in the Lower Indus Basin, Pakistan
-
Abdul Majeed Shar
 ,
Aftab Ahmed Mahesar
,
Aftab Ahmed Mahesar

Abstract
Nari Formation is considered as one of the most important oil and gas exploration targets. These fine-grained tight sandstone reservoirs face enormous challenges due to their extremely low matrix porosity and permeability. Hence, in this regard, the study was carried out to collect the high-quality data on petrophysical properties along with mineralogy and microstructural characteristics and diagenesis. The experiments performed includes the petrographic study and scanning electron microscopy, and X-ray diffraction analyses. Besides, the measurement of petrophysical properties was carried out to assess the likely influence of the reservoir quality. The petrographic analysis shows predominantly fine- to medium-grained grey samples along with calcite, clay, lithic fragments and iron oxides. Further, the thin-section observations revealed that the quartz is a principal mineral component in all the analysed samples ranging from 52.2 to 92.9%. The bulk volume of clay minerals that range from 5.3 to 16.1% of. The porosity and permeability measured range from 5.08 to 18.56% (average 7.22%) and from 0.0152 to 377 mD (average 0.25 mD), respectively. The main diagenetic processes that affected the sandstones of Nari Formation are mechanical compaction, grain deformation, cementation and quartz dissolution and have played a significant role in influencing the quality of the reservoir rock. Overall, it appears that the primary petrophysical properties (porosity and permeability) were decreased due to the mechanical compaction, lithification, cementation, and framework grain dissolution. Based on the integrated mineralogical, microstructural analysis, and the laboratory-based petrophysical properties, the samples exhibited poor porosity, permeability, and moderate clay content, which indicate that the Nari Formation is a poor quality reservoir.
1 Introduction
In today’s world, the dominant source of energy being used by industrial sectors is mainly the hydrocarbons [1,2,3,4,41]. However, due to urbanization and industrialization, the demand for energy has rapidly increased [1,2,42]. The present-day demand of energy requirements cannot be met by the conventional resources. Therefore, oil and gas industries have made efforts to develop the unconventional hydrocarbon resources (tight gas) [1,2,3,4,5,43]. It is very challenging to develop such resources by conventional means (this is due to the tight formation exhibiting extremely low matrix porosity and permeability and possessing complex pore network) and it involves advanced technology, i.e. acidizing [3,44,45,46], hydraulic fracturing [2,3,4,5,6,7,8,9,10], and liquid nitrogen fracturing (recently developed technique) [9,10,11,12]. Fine-grained sedimentary formations are typically tight and are considered as nonporous or impermeable reservoirs with less than 10% matrix porosity and 0.1 milli darcy (mD) permeability [12,47]. Production from such hydrocarbon resources (tight gas) is very challenging due to low matrix porosity and permeability, presence of clay mineralogy, stress sensitivity, and rock heterogeneity [1,2,3,4,5,6,48,49,50]. Hence, it is essential to develop efficient exploitation and development strategies for effective production from tight resources. Effective production from any reservoir depends on the reservoir’s quality [1,2,3,4,5,6,7,51]. The key factors that influence any reservoir’s quality include (a) petrophysical rock properties (porosity and permeability), (b) depositional environment, and (c) diagenesis [24,25,26,27,28,29,30]. In addition, the petrophysical and microstructural characterizations are essential to achieve effective production, storage, and fluid flow from unconventional hydrocarbon reservoir rocks [1,2,5]. Petrophysical properties (e.g. permeability, porosity, water and oil saturations) of these rocks are mainly controlled by diagenetic changes [2,6,7,8,9,10,11,12]. Therefore, detailed assessment of petrophysical properties, i.e. permeability, porosity, and mineralogical and microstructural characteristics, is essential and an integral part of any field development plans. Further, the reservoir’s fluid flow properties are controlled by pore morphology and depositional environment, diagenetic modifications, geothermal gradients, and pore pressures [2,8,9,10,11]. Main reservoir rock properties that are affected by diagenetic events are the porosity and permeability, which in turn are partly affected by the textural characteristics such as grain size, shape, grain packing and their arrangements [4,8,10,12,13,14]. Subsequently, the diagenetic processes affecting fine-grained sedimentary rocks include the grain fracturing, deformation, compaction, dissolution, authigenesis, biological actions, hydration, cementation, and recrystallization [15,16,17,18,19,20,21,22,23,24,25,26,27]. Mostly, the petrophysical data sets are unavailable for tight formations of the Lower Indus Basin of Pakistan; hence, the exploration and production companies are in an initial phase and are relying on the data sets that are available in public domain for the assessment of unconventional prospects. An integrated study was carried out to collect comprehensive high-quality data on petrophysical properties, mineralogy, microstructure, and diagenesis of samples obtained from Lower Indus Basin, Pakistan.
The objectives of present study are threefold: (i) collect data sets of high-quality petrophysical properties, (ii) integrate the petrophysical properties and microstructural data sets to assess the reservoir quality and (iii) improve understanding of diagenetic events and their impact on reservoir rocks quality. For this reason, we obtained exposed outcrop analogue samples from Nari Formation Lower Indus Basin, Pakistan. For accurate estimation of rock properties, it is essential to have a set of whole core samples recovered from wells while drilling the reservoir section. Obtaining a fresh core from reservoir section is the best option to be used for reservoir characterization studies [20,28]. However, it is very difficult to access such kinds of samples, because these are often unavailable or their presence is very scarce or most of the companies secure them for their advanced phases of the project. In such circumstances, it would be far better to get outcrop analogues that could be used to acquire preliminary evidence about target reservoir. The present study obtained outcrop analogues for describing the petrographic and petrophysical characterization and further described the diagenetic events that impact the quality of reservoir rocks and to collect the high-quality data on petrophysical properties of these sandstones.
1.1 Geological context of the study area
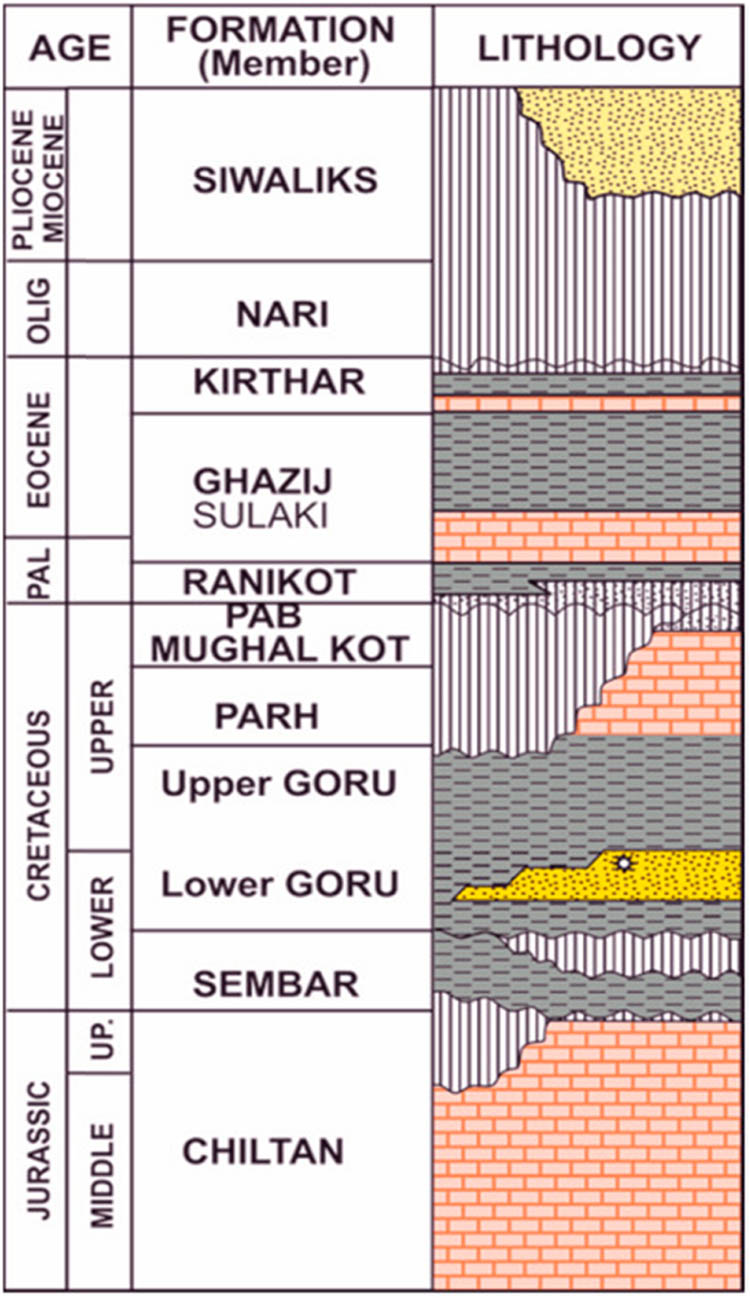
The Indus Basin is located between the boundary of the Indian, Asian and Arabian plates [29]. The Indus Basin is divided into two parts, Upper Indus Basin and the Lower Indus Basin [30,31]. The general stratigraphy of Lower Indus Basin including various different formations is presented in Table 1. The study area lies in the Karachi trough, part of Lower Indus Basin. The rocks are ranging from Eocene to subrecent. The lower contact of mostly exposed Nari Formation in Sindh is mostly conformable and gradational with Kirthar Formation while in our study area it is unconformable with Laki Formation and upper contact is unconformable with recent deposits. The formation consists of sandstone, shale, and subordinate limestone. The study area lies in the upper part of Nari Formation where limestone is absent; generally fossiliferous limestone is present around Karachi City [31,32]. It is mainly composed of sandstone with minor amount of shale [32] (Figure 1).
Generalized sequence stratigraphy along with main lithology encountered in the Indus Basin Pakistan [52]
 |
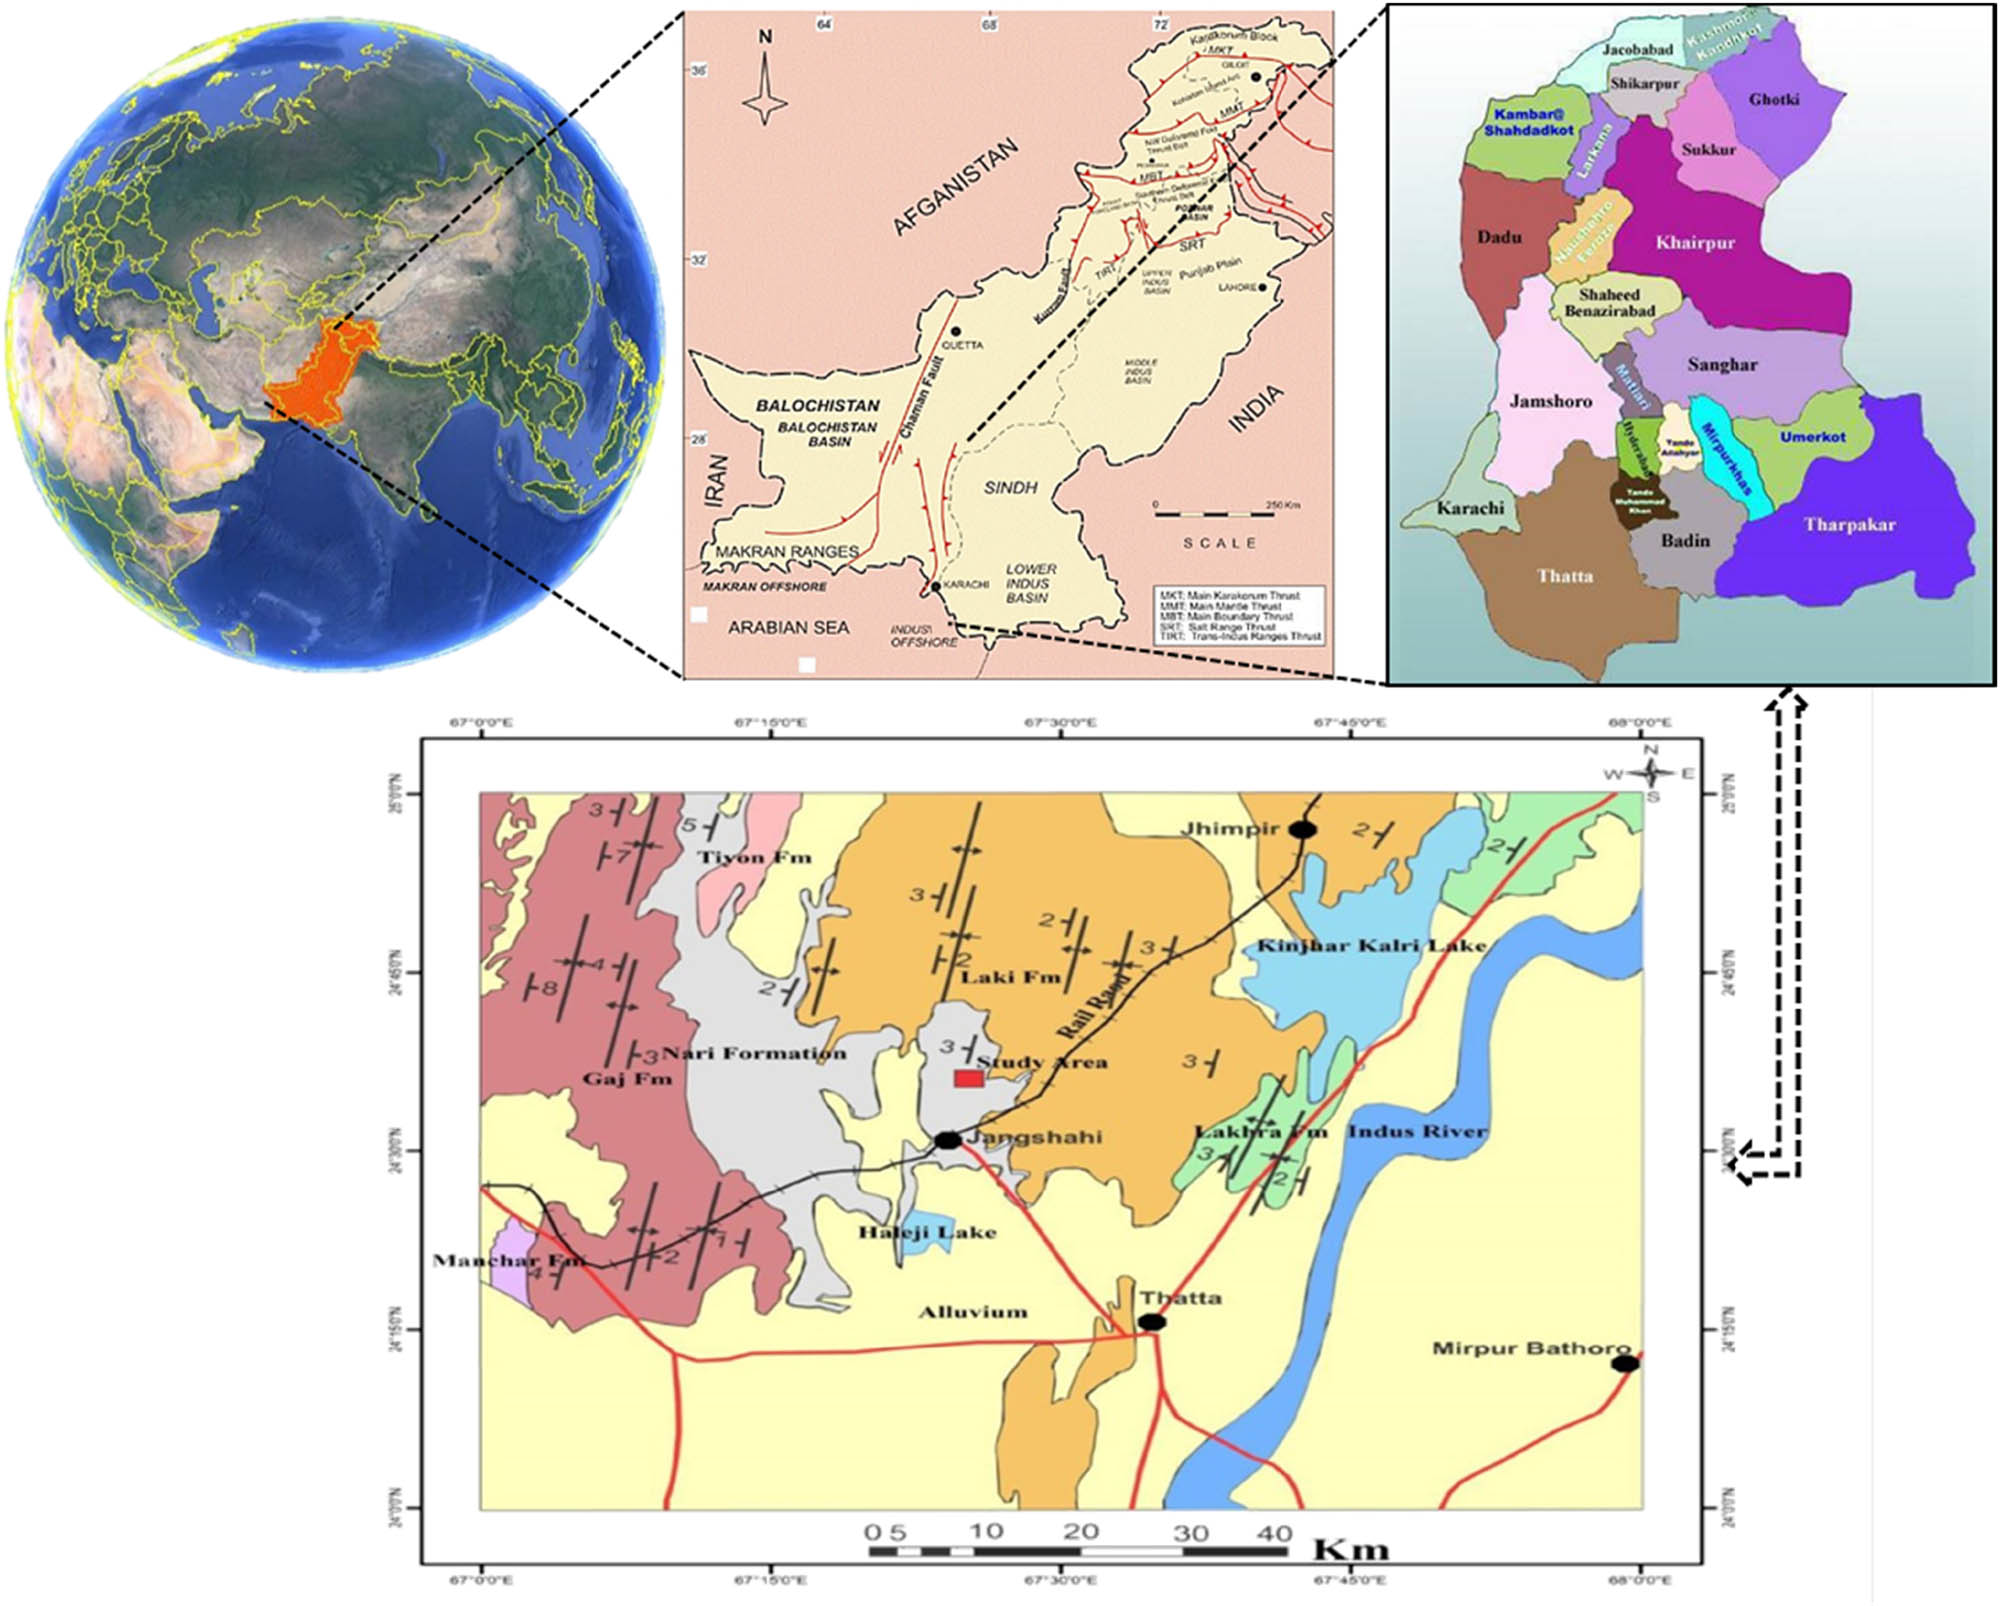
Geological map of Pakistan showing the study area with basic geological information and location of sampling sites.
2 Sampling and methodology
This study addresses the petrographic and petrophysical characterizations of potential oil and gas exploitation target in the region. The overall methodology to analyse the petrographic and petrophysical characteristics of Nari Formation is depicted in Figure 2, and the number of samples analysed and the measurements are given in Table 2, considering the following analysis steps.
Selecting the study area based on the potential reservoir rock
Identifying the surface outcrop as an analogue to characterize the reservoir rock
Collecting and preparing samples for laboratory analysis
Analysing of petrographic thin section and mineral contents
Measuring petrophysical properties
Interpreting data and correlating petrographic and petrophysical data for reservoir quality assessment.
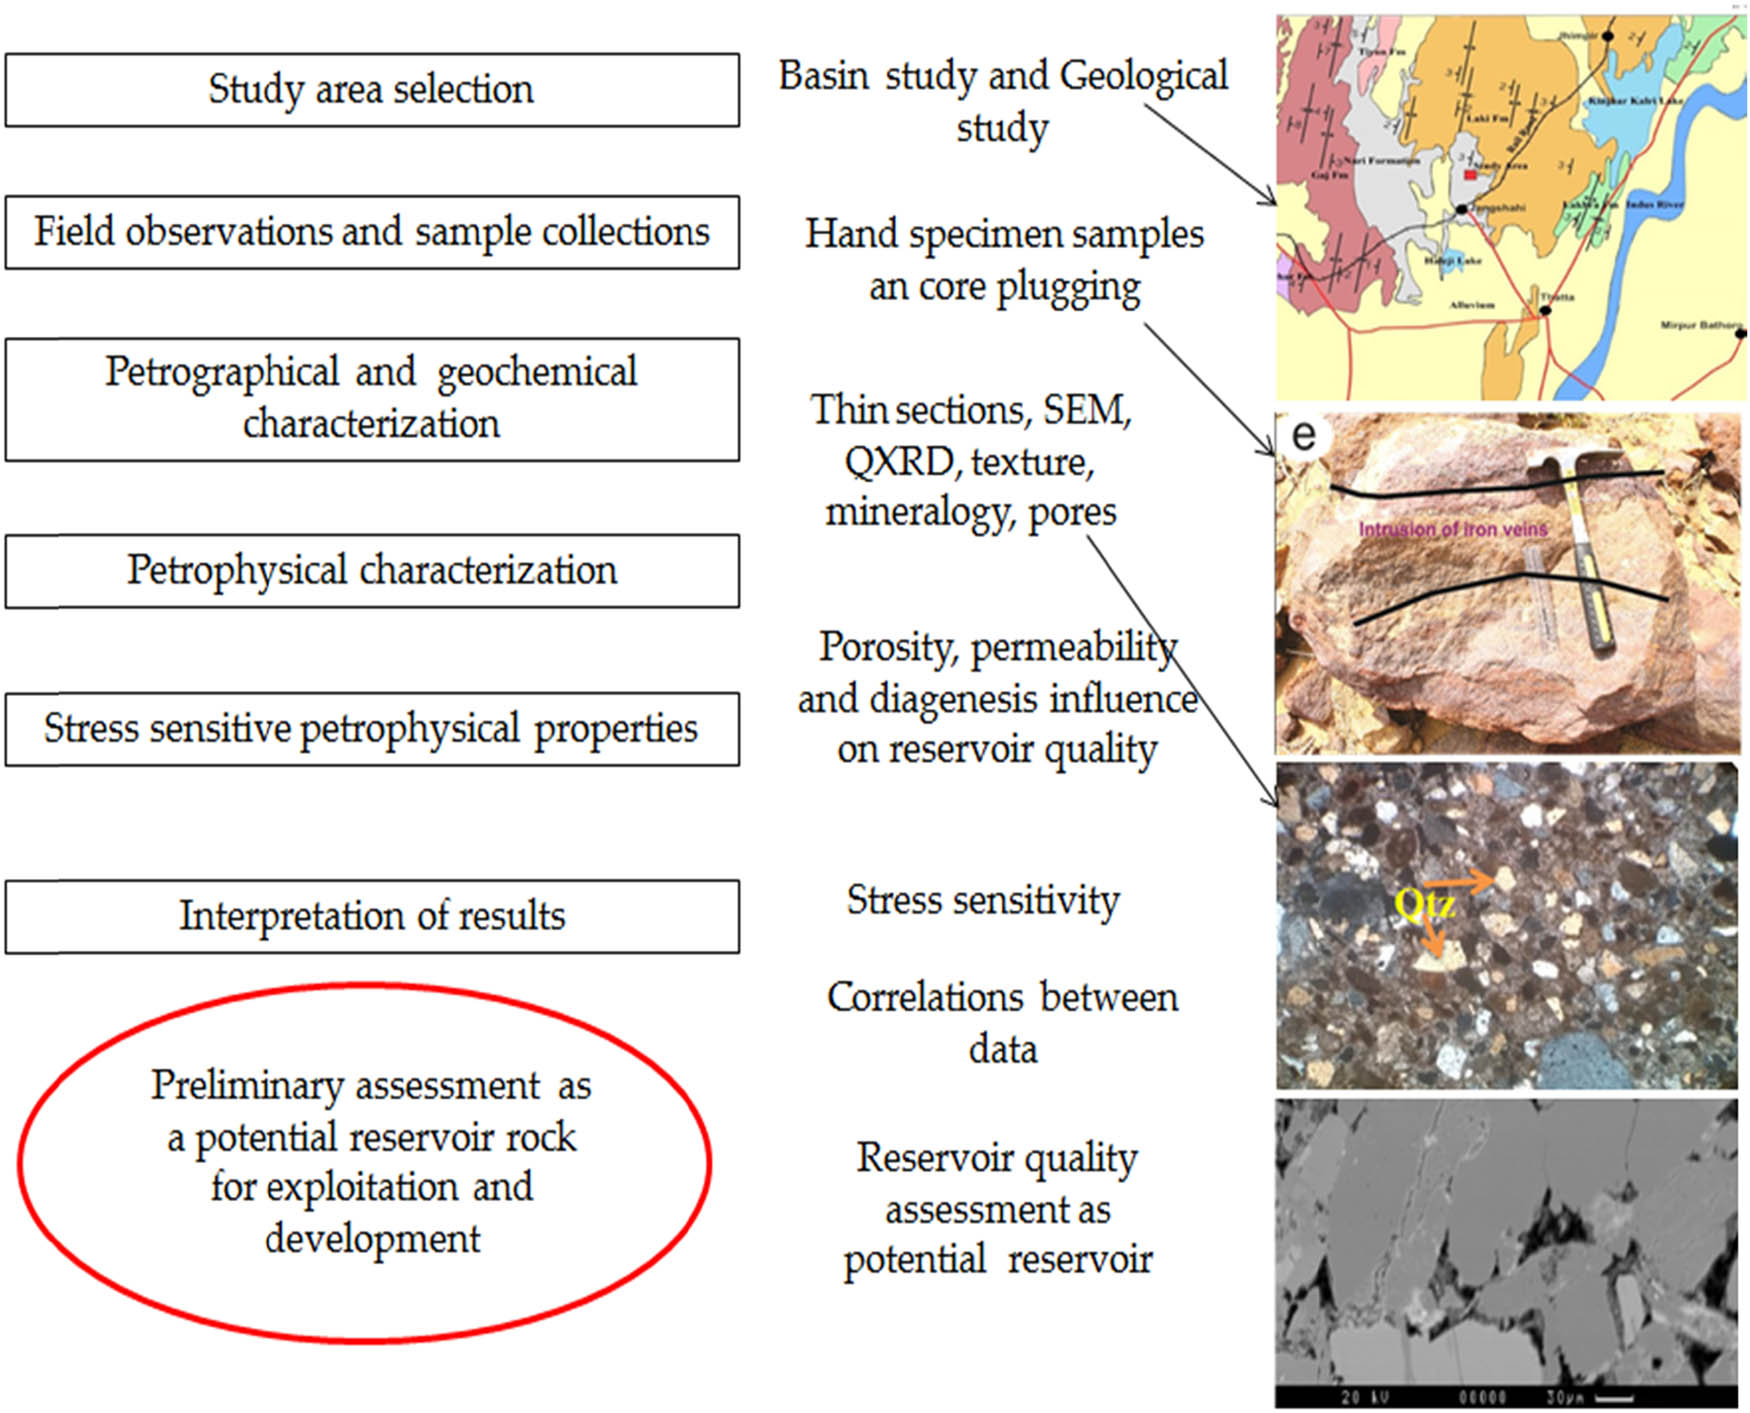
The schematic representation of the overall workflow followed in this study.
Summary of the experiments carried out and samples collected from Nari Formation in the Lower Indus Basin, Pakistan
| S. No. | Sample ID | XRD | Petrography | SEM-EDS | Porosity and permeability |
|---|---|---|---|---|---|
| 1 | 18-JT-1a | √ | √ | √ | √ |
| 2 | 18-JT-2 | √ | √ | √ | √ |
| 3 | 18-JT-3 | √ | × | √ | √ |
| 4 | 18-JT-5 | √ | √ | √ | √ |
| 5 | 18-JT-6a | √ | √ | √ | √ |
| 6 | 18-JT-6b | √ | × | √ | × |
| 7 | 18-JT-4 | √ | √ | √ | √ |
| 8 | 18-JT-7 | √ | √ | √ | √ |
| 9 | 18-JT-8 | √ | √ | √ | √ |
| 10 | 18-JT-9 | × | × | × | √ |
| 11 | 18-JT-10 | √ | √ | √ | × |
| 12 | 18-JT-10a | × | × | × | √ |
2.1 Petrography
For petrographic thin-section observations, Leica optical microscope was used to study the rock lithology and microstructure of the Nari sandstone samples. The experiments were carried out at the Geological Survey of Pakistan (GSP), Karachi laboratory. In addition, cathodoluminescence can identify minerals and fossils, along with their microscopic features. The Leica optical microscope was used to analyse the essential microscopic features of thin section under polarized microscopes.
2.2 XRD analysis
X-ray powder diffraction (XRD) is a fast analytical method basically adapted to identify the different phases of crystalline materials. Prior to analysis, the material was powdered, finely crushed, and made very homogeneous so the average bulk composition of material is obtained. These experiments were conducted at the University of Sindh Geology Department. QXRD analysis was performed on 1 cm3 size, and the sample covering the overall sandstone mineralogy was also taken.
2.3 Scanning electron microscopy (SEM) analysis
The smooth and fresh rock chips of samples were prepared and then mounted on the sample stub of SEM. The samples were mounted with the help of the conductive double-sided carbon solution tape. The sample stub was then mounted in the sample chamber JEOL JSM-6590LV of SEM, which is also equipped with an extra and important accessory component, Bruker of energy dispersive X-ray spectrometer (EDS). The IMAGINING INTERFACE software controlled the system in JEOL JSM-6590LV in SEM whereas in the EDS , QUANTAX. The desired images were taken and controlled from computer to study the various topographic features and compositions of the samples.
2.4 Measurement of density, porosity, and permeability
Cylindrical samples were prepared for permeability and porosity measurement. The samples prepared in varying lengths and diameters. All samples were cleaned to remove the unnecessary particles which may affect results. All the samples were then dried into a humidity-controlled oven at 60°C prior to measurements.
2.4.1 Bulk density measurement
The bulk density of rock samples was obtained by determining the core plugs (cylindrical plugs), dimension, and the bulk volume (V b); and the dry weight of these samples (W d) was obtained using a precision calliper (0.1 mm precision) and an electronic balance (0.1 mg precision).
2.4.2 Porosity and permeability tests
Permeability and porosity measurements were made for the samples obtained and the experimental procedures are described in ref. [7].
3 Results
3.1 Petrographic analysis
Thin-section observation shows that Nari Formation samples are moderate to poorly sorted. The mineralogical compositions are shown in Table 3, and the diagenetic features are shown in Figure 3. The occurrence of quartz considerably varies in proportion from 62 to 91.20%. The observed accompanying mineral assemblage includes the calcareous matrix, ferric oxides, calcite cement, clays, and lithic grains along with feldspars and mica. The proportions of all the associated minerals except quartz are shown in Figure 4. Ferric oxide, calcareous mud, and calcite observed from thin-section analysis dominated the cementing materials. These cements very densely packed these rocks, thereby resulting in poor pore spaces and subsequently leading to tight sandstones which exhibit poor porosity and permeability. From Figure 4, it was observed that the clay is the dominating mineral in samples 18-JT-8 and 18-NR-2. Many observations showed that the monocrystalline quartz was in principal quantity than the polycrystalline. At most places, the quartz grains are fractured and it may be due to the external stress (Figure 5b). The tectonic stress could be the major cause of grain breakage and fracturing (Figure 5d). The dark coloured patches within these samples display those iron oxides within these Nari sandstone samples along with calcareous mud. Both alkali feldspar (Figure 5c) and plagioclase (Figure 5c) were observed in the samples.
Mineralogical composition from petrographic thin sections point counting analysis
| S. No | Sample ID | Mineral components (%) | ||||||
|---|---|---|---|---|---|---|---|---|
| Quartz | K-feldspars | Plagioclase | Mica | Calcite | Lithic fragments | Clay mineral | ||
| 1 | 18-JT-1a | 77 | 12 | 3.0 | 2.0 | 4.0 | 4.0 | 2.0 |
| 2 | 18-JT-2 | 83 | 5.0 | 8.0 | 2.0 | 2.30 | 2.0 | 3.0 |
| 3 | 18-JT-3 | 76 | 7.0 | 5.0 | 2.0 | 2.00 | 3.0 | 3.0 |
| 4 | 18-JT-5 | 89 | 2.0 | 2.0 | 3.0 | 1.00 | 1.0 | 2.0 |
| 5 | 18-JT-6a | 69 | 8.0 | 5.0 | 4.0 | 5.00 | 6.0 | 3.0 |
| 6 | 18-JT-6b | 90 | 4.0 | 3.0 | 2.0 | 3.00 | 1.0 | — |
| 7 | 18-JT-4 | 75 | 9.0 | 3.0 | 3.0 | 5.00 | 3.0 | 2.0 |
| 8 | 18-JT-7 | 73 | 7.0 | 5.0 | 2.0 | 3.00 | 4.0 | 9.0 |
| 9 | 18-JT-8 | 75 | 3.0 | 3.0 | 2.0 | 3.0 | 2.0 | 15.0 |
| 10 | 18-JT-10 | 91 | 6.0 | — | 2.0 | — | 2.0 | 12.0 |
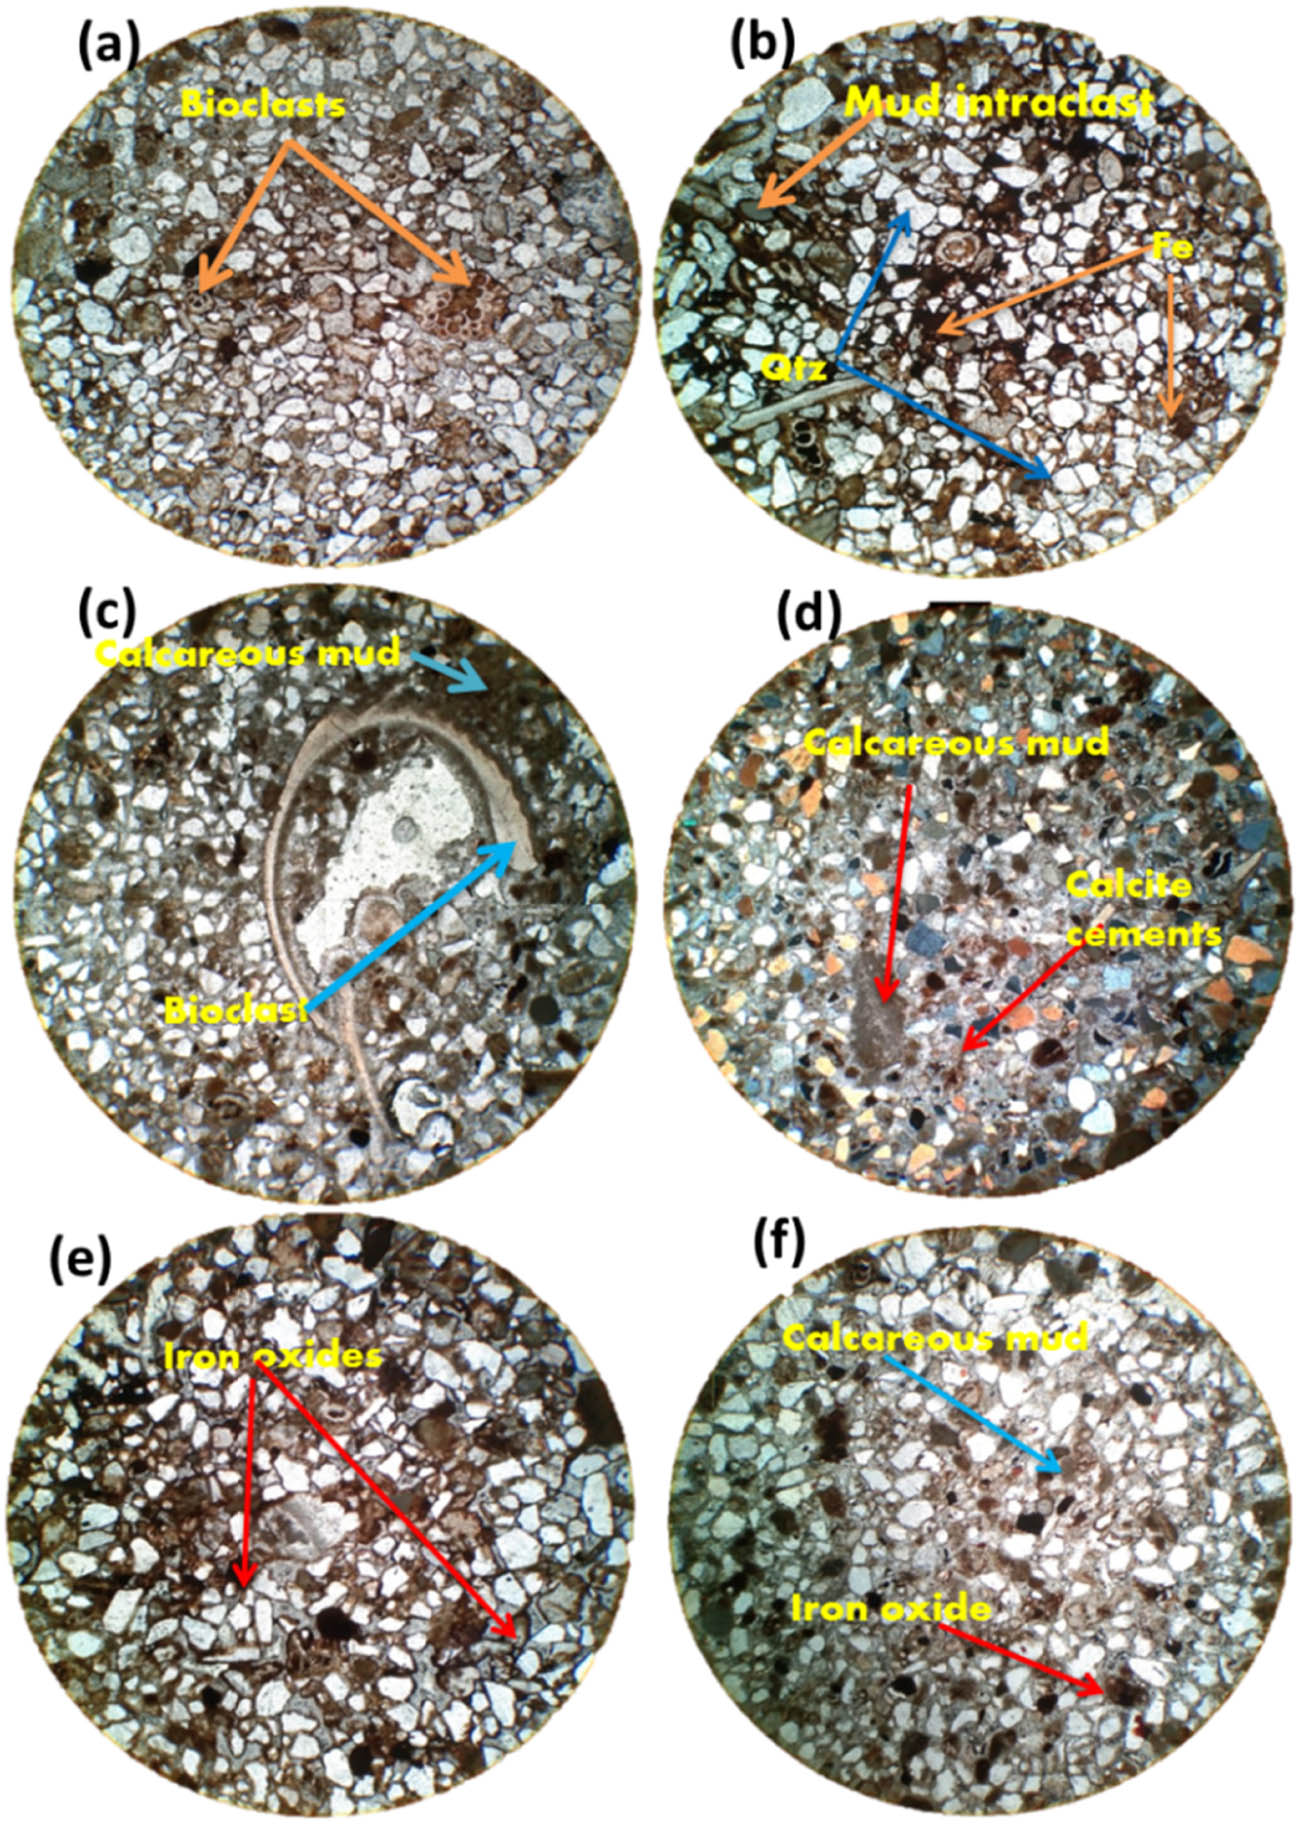
Thin-section photomicrograph of Nari Formation sandstones showing diagenetic features: (a) Bioclasts. (b) Mud interclasts along with iron oxides among quartz grains. (c) Calcareous mud and bioclasts are shown. (d) Calcite cements and calcareous muds are visible from the image. (d) Iron oxides coating quartz grains are visible from the image. (f) Calcerous muds and iron oxides are shown.
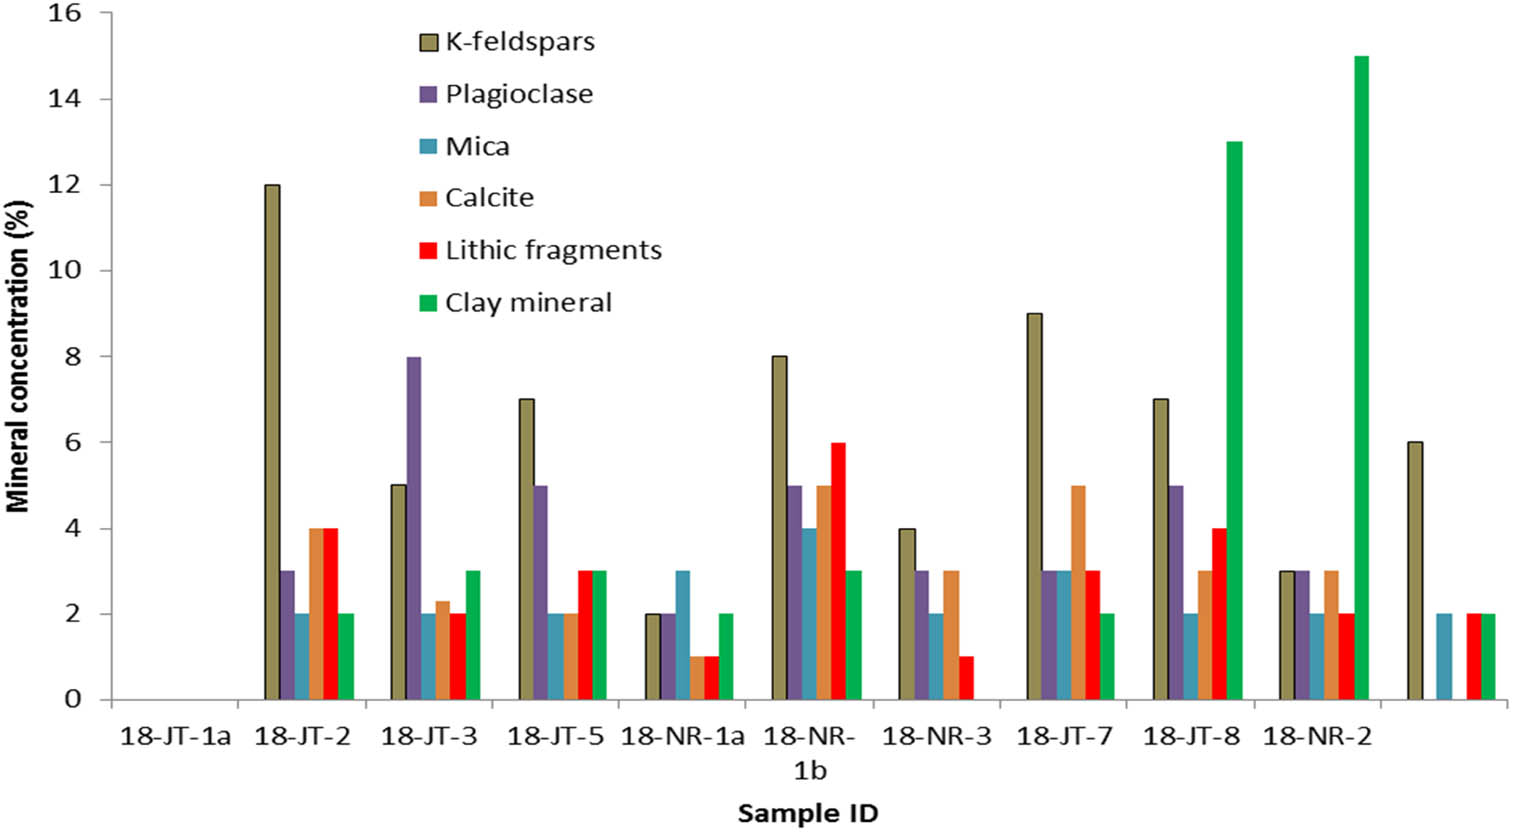
Mineral concentration of samples of Nari Formation other than quartz, as quartz is a highly dominated mineral within this formation.
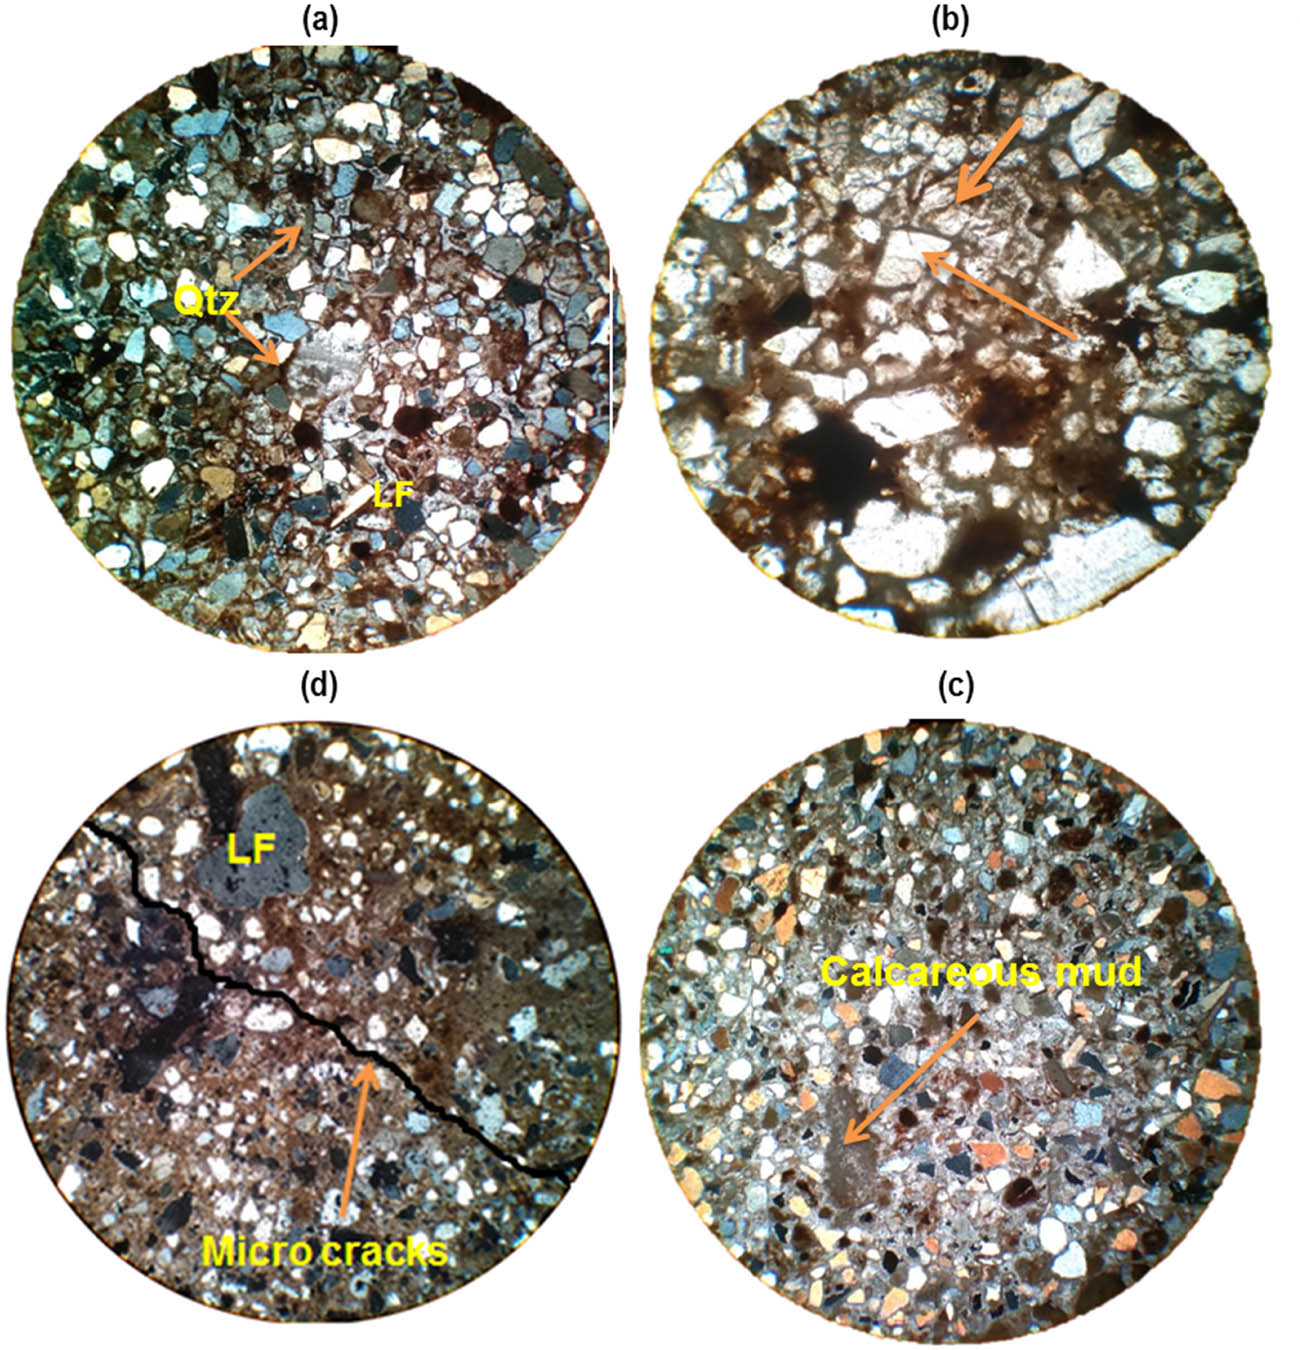
Photomicrographs of sandstone samples analysed from Nari Formation showing: (a) moderately sorted, subangular to subrounded grains of quartz. (b) Monocrystalline and polycrystalline characteristics governing within these samples as quartz crystal. (c) Lithic framework grains along with observed fracture. (d) Some observed alkali feldspar grains.
3.2 Microstructural observations
Samples selected for the SEM-EDS analysis were named after their location from where they were collected, such as 18-NR-1 and 18-NR-2 were collected from station 1, and those which were collected from station 2 were labelled as JT-1, JT-2, 3, 4, 5, 8, 9, 10, 12, and 13. From SEM analysis, the various minerals identified are represented as Qtz = quartz, C = calcite, Fe = iron, and CM = clay minerals.
All samples from stations 1 and 2 were analysed in order to identify their general elemental structure. In JT-1 sample, the general concentration of elements is analysed under EDS in the form of peaks. The highest peaks of this sample are of silicon, oxygen, calcium, and iron, as shown in Figures 6 and 7. The presence of dominant minerals such as quartz, calcite, and iron sand was confirmed under SEM analysis of sample 18-JT-1. The point analysis of this sample is based on the white colour. Figure 7 indicates the highest peaks of the silicon, iron, and calcium in which the tone of the iron was confirmed under SEM analysis of sample 18-JT-1. Sample 18-JT-2 general elemental concentration indicates the highest peak of silicon, and all other peaks are averaged as shown in Figure 7. The presence of quartz was confirmed under SEM analysis of sample 18-JT-2. Further elemental concentration of sample 18-JT-3 indicates the highest peaks of silicon, oxygen, and calcium in Figure 7. The presence of quartz and calcite minerals were confirmed under SEM analysis of sample 18-JT-3. The point analysis (a) of this sample is based on the dark grey shown in Figure 7, which indicates the highest peak of silicon7. The tone of the quartz was confirmed under SEM analysis of sample 18-JT-3. The point analysis of this sample is based on the light grey indicating the highest peaks of the oxygen, silicon, and calcium (Figure 7). The tone of the calcite was confirmed under SEM analysis of sample JT-3. Further, it was found that in the samples 18-JT-4 to J18-T-8, their elemental concentration ranged from their highest peaks of silicon, oxygen, and calcium, and the presence of quartz and calcite minerals were confirmed under SEM analysis.
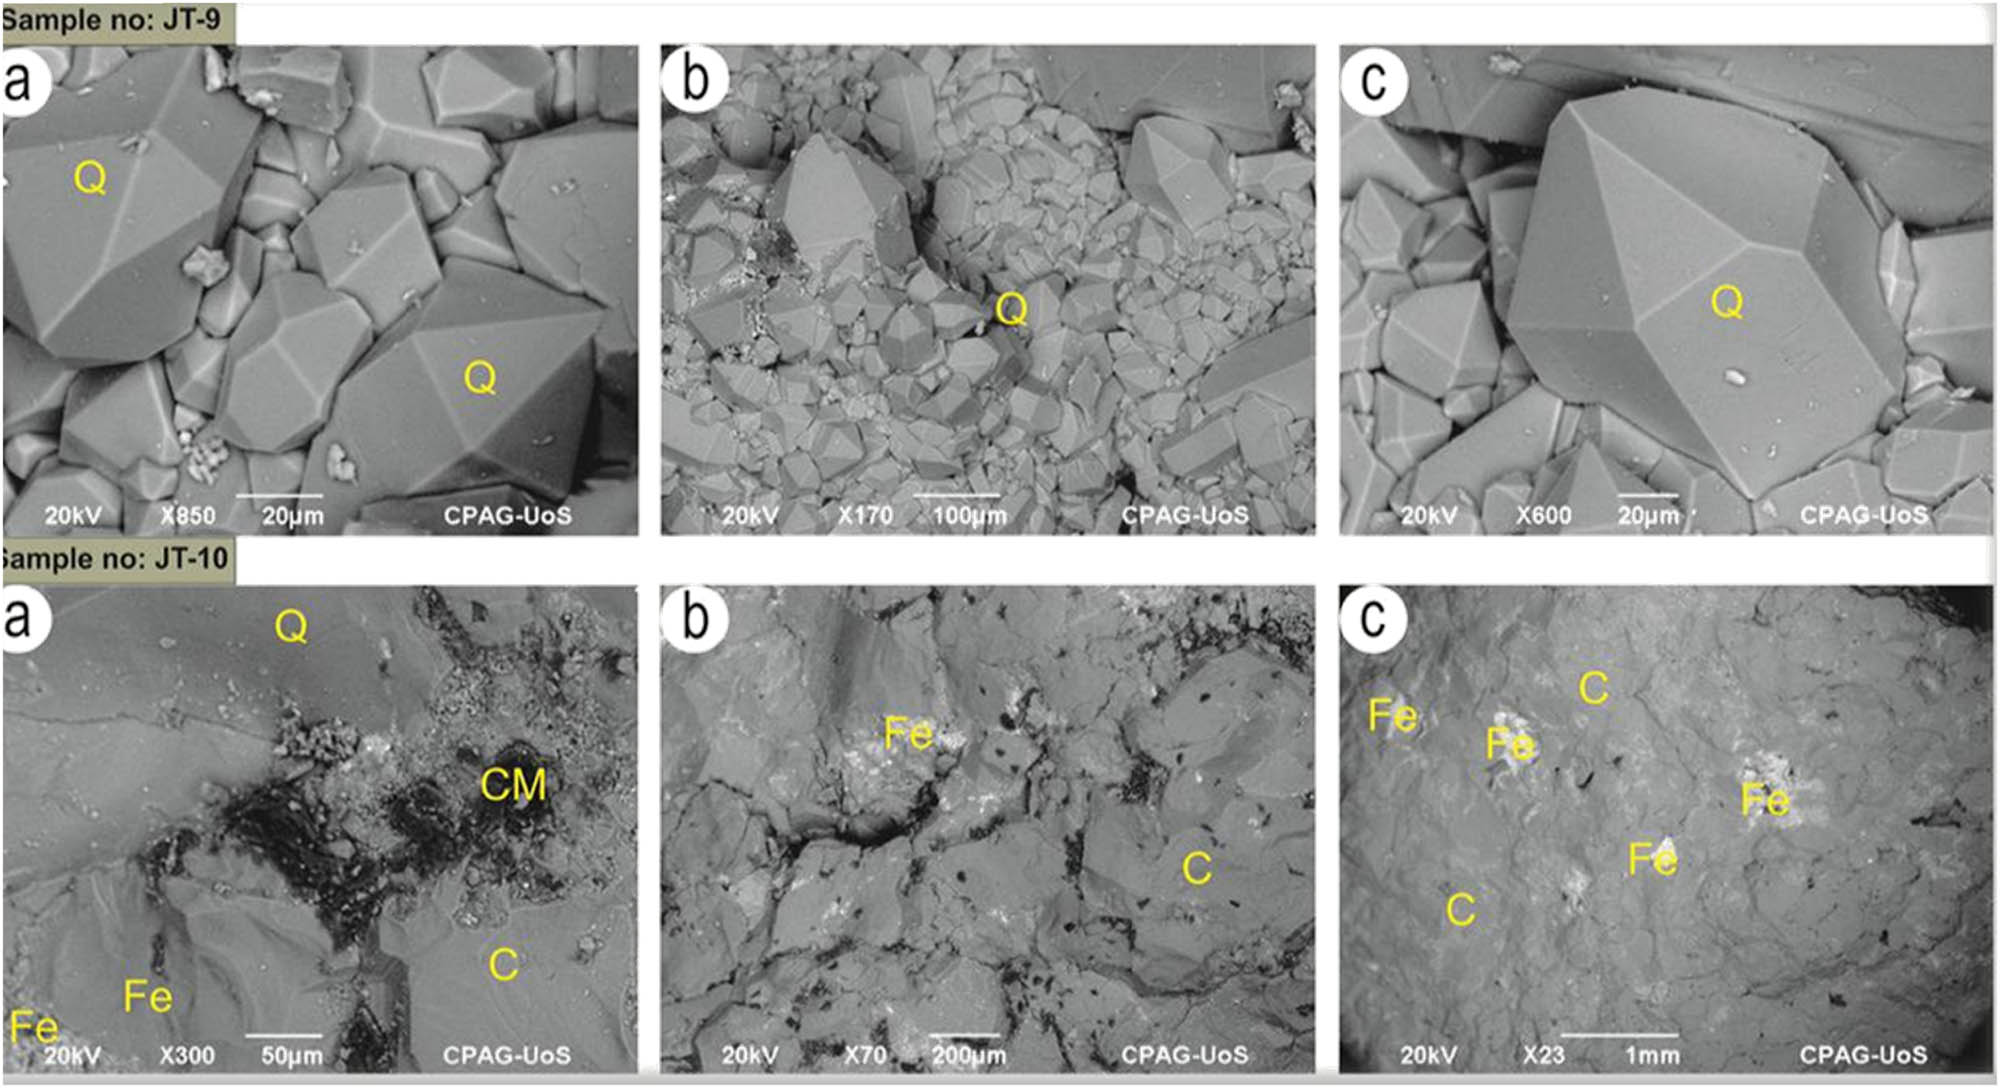
Mineral composition under SEM observation is quartz and calcite (in Figure a, b, and c sample JT-9). Quartz mineral indicates its tone as dark grey while the calcite mineral indicates its tone as light grey. The sample JT-10 (a–c) displays quartz as its dominant mineral along with iron oxides, calcite, and clay minerals. Clay minerals as kaolinite are present in JT-10 (a). The symbols represent Q = quartz, C = calcite, Fe = iron and CM = clay minerals.

The scanning electron microscopy images of Nari sandstone samples along with energy dispersive X-ray (EDX) spectrum revealing the different elemental composition.
The general elemental concentration of 18-JT-9 sample indicates the highest peak is of silicon and then oxygen as the lowest peak as shown in Figure 7. The presence of the dominant mineral quartz was confirmed under SEM analysis of sample JT-9, which consists of beautifully developed crystals of quartz (Figure 6). The general elemental concentration of 18-JT indicated the highest peak of silicon and oxygen. The presence of dominant mineral quartz was confirmed under SEM analysis of sample JT-10. The point analysis (Figure 7) of this sample is based on the dark black seen in the image which indicates the highest peaks of silicon, oxygen, potassium, and calcium. The tone of the clay minerals was confirmed under SEM analysis of sample JT-10.
3.3 Mineral composition
Results from XRD analysis are presented in Table 3; this shows the compositional analysis for all analysed sandstone samples. It was observed that the main components are quartz and feldspar, and the iron oxide, cement, and clay of variable mineralogy. Other minerals observed include the kaolinite, dolomite, calcite, gypsum, mica, pyrite, chlorite, and lithic fragments. The cementing materials observed are mainly comprised of carbonate (9.4%), ironic (10.6%), and micrite muds (12.8%); in the samples collected from Nari station 1, the major cementing materials are clay minerals (14.2%), ironic (4.7%), and plagioclase (2.2%). From the XRD analysis (Figure 8), it was found that the quartz content in all samples is very high, i.e., it was 91.2% and above 91.6%, which is typically quartz sandstone. Most of the samples are lithic quartz sandstone, possessing clay minerals in variable quantities as shown in Table 3. The feldspar content is very small and can be neglected. The average total clay content (24.35%) of Station 1 Formation is larger than the average total clay content (15%) in Station 2 Formation in the region (Table 4).
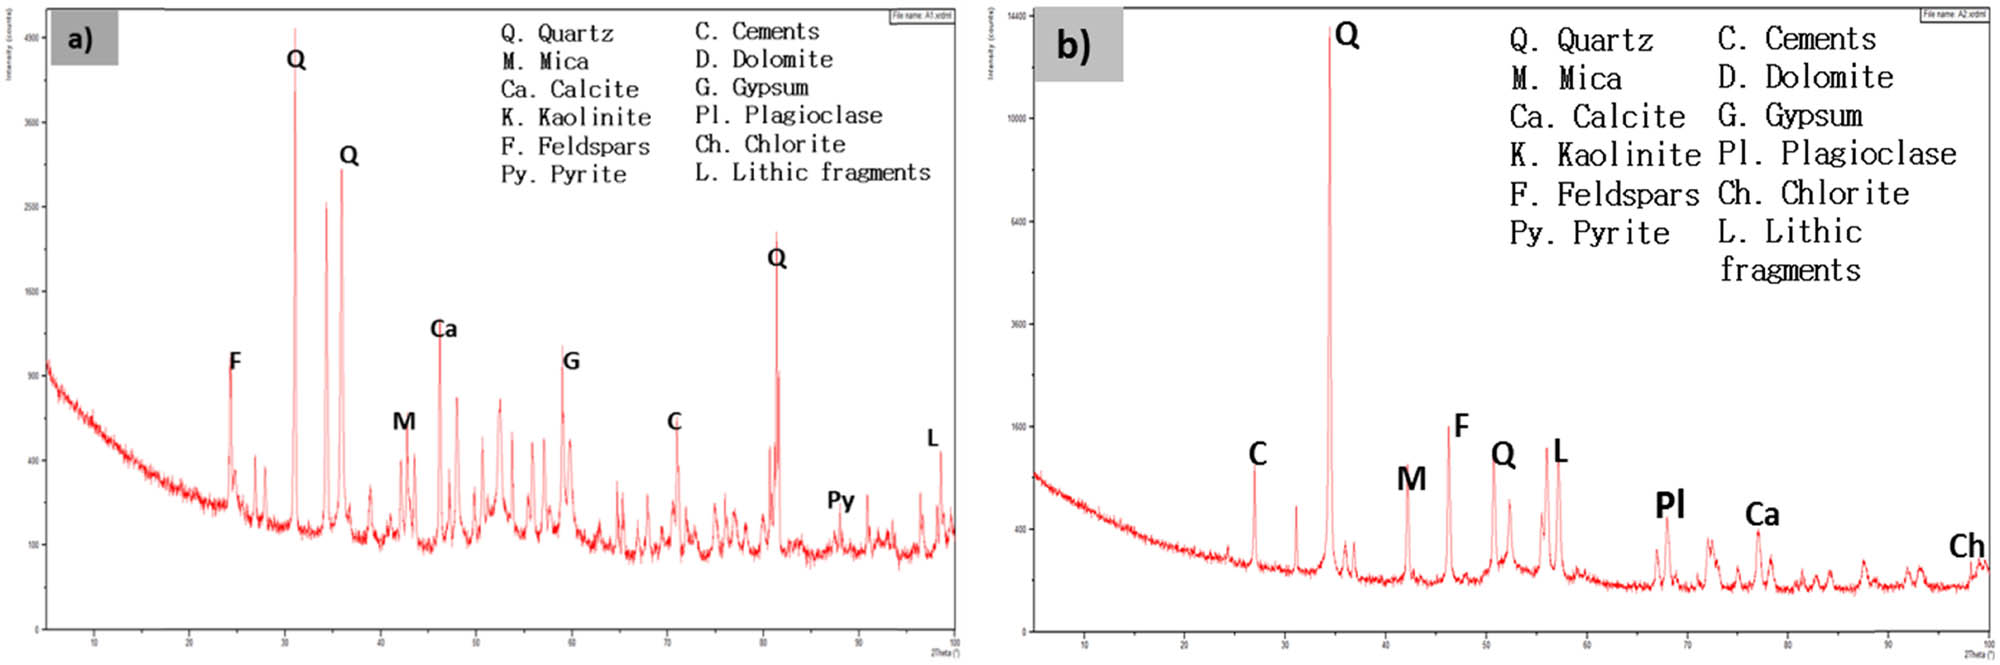
The illustration shows the X-ray diffraction patterns of two selected sandstone samples (a and b) from Nari Formation.
The XRD results signifying the mineral composition and concentration (wt%)
| Sample ID | Mineral components (%) | ||||||
|---|---|---|---|---|---|---|---|
| Quartz (SiO2) | K-feldspars | Plagioclase | Mica | Calcite | Lithic fragments | Clay mineral | |
| 18-JT-1a | 77 | 8.20 | 3 | 2 | 4 | 4 | 2 |
| 18-JT-2 | 83 | 5.30 | 2 | — | 2 | 5 | 3 |
| 18-JT-3 | 76 | 9.10 | 3 | 2 | — | 9 | 2 |
| 18-JT-4 | 69 | 12.3 | 4 | 2 | 3 | 8 | 2 |
| 18-JT-5 | 75 | 9.12 | 3 | 2 | 4 | 4 | 2 |
| 18-JT-7 | 63 | 5.27 | 3 | 4 | 3 | 6 | 12 |
| 18-JT-8 | 65 | 3.12 | 2 | 3 | 3 | 4 | 16 |
| 18-JT-9a | 71 | 10.02 | 5 | 2 | 4 | 6 | 2 |
3.4 Petrophysical property results
Permeability and porosity data of Nari sandstones along with their slippage factor values are presented in Table 5. The results obtained were cross plotted and are shown in Figure 9, where a reasonably virtuous correlation between permeability and porosity can be perceived on the semilogarithmic plot. It is interesting to note that, the permeability value >0.1 mD, shows the linear correlation between permeability and porosity. However, the permeability and porosity values <0.01 mD are quite scattered on the semilog plot, which means that the effect of other parameters such as pore-filling clays and grain-coating clays along with cementing materials significantly affect the permeability. The cross-plotted permeability and porosity demonstrate that the trend line of samples with no clay minerals shows linear trend line; however, the sandstones possessing clay minerals, calcareous muds, and cements resulted in low and scattered permeability and porosity, which in turn makes this reservoir very poor quality. The permeability varies by several factors due to the varying mineral proportions. The main factors that control the permeability of these reservoir rocks are clay mineralogy, cementing and mud influx materials. The permeability reductions experienced imply that the Nari Formation could have a significant impact on the single-phase flow, especially when production from these reservoirs begins. Further the samples which were cemented due to diagenetic modifications have shown large reduction in permeability values. It was observed that some low-permeability sandstones exhibited overlapping permeability–porosity characteristics (Figure 10). Almost identical behaviour of permeability data could be noticed by the action of grain-coating clays and pore-filling clays (Figure 10). The overlapping was usually noticed in the data where permeability of these samples was very low, that is, less than <0.1 mD particularly for rocks with pore-filling clays and grain-coating clays. The distribution characteristic of clay mineralogy within sandstone formation is described in Figure 10. The lower permeability of Nari Formation sands is the result of the existence of clays, which is obvious from SEM and XRD data. Pore-fillings clays demonstrate that the permeability in these sands is less compared to the grain-coating clays; however, this needs further refinement for accurate prediction of permeability and porosity of Nari Formation reservoirs. Laboratory measurements of porosity and permeability of numerous sandstone and mudstone samples have demonstrated that it is mainly controlled by the clay mineralogy. From the permeability and clay content cross plot, a scatter of data is observed (Figure 11). The scatter in permeability and porosity could be the result of different grain sizes and occurrence of diverse mineral contents and is well elaborated in ref. [33].
Basic petrophysical properties of Oligocene Nari sandstone in the Lower Indus Basin Sindh, Pakistan
| Petrophysical parameters | Min | Max | Mean | SD | |
|---|---|---|---|---|---|
| 1 | Rock density (g/cc) | 2.27 | 2.69 | 2.390 | 2.20 |
| 2 | Porosity (%) | 5.80 | 18.5 | 7.20 | 3.30 |
| 3 | Permeability (mD) | 0.0152 | 377 | 0.052 | 32.2 |
| 4 | Gas slippage factor (1/psi) | 5.0 | 125 | 43.50 | 12.5 |
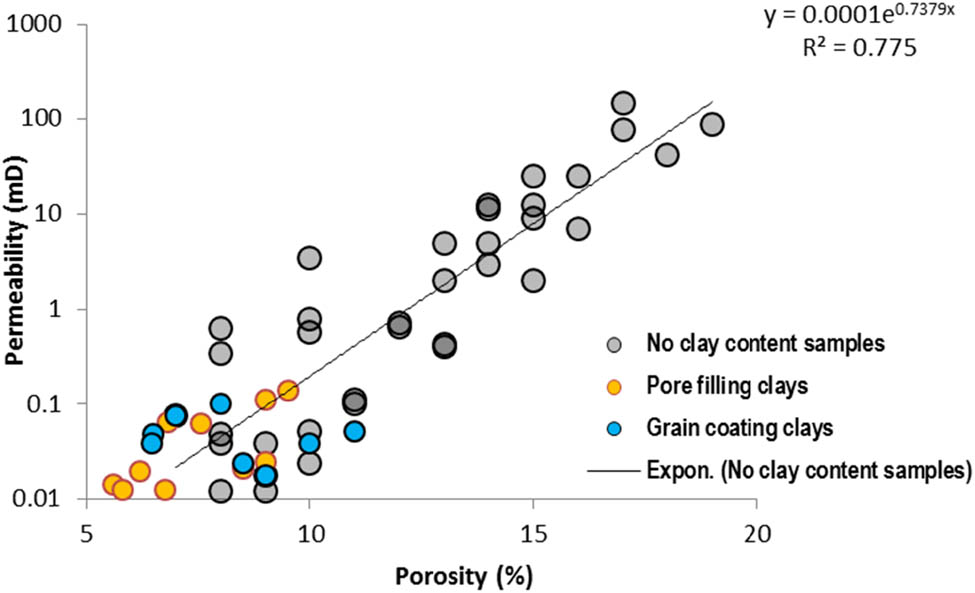
The cross plot of porosity and permeability of samples from Nari sandstone formation.
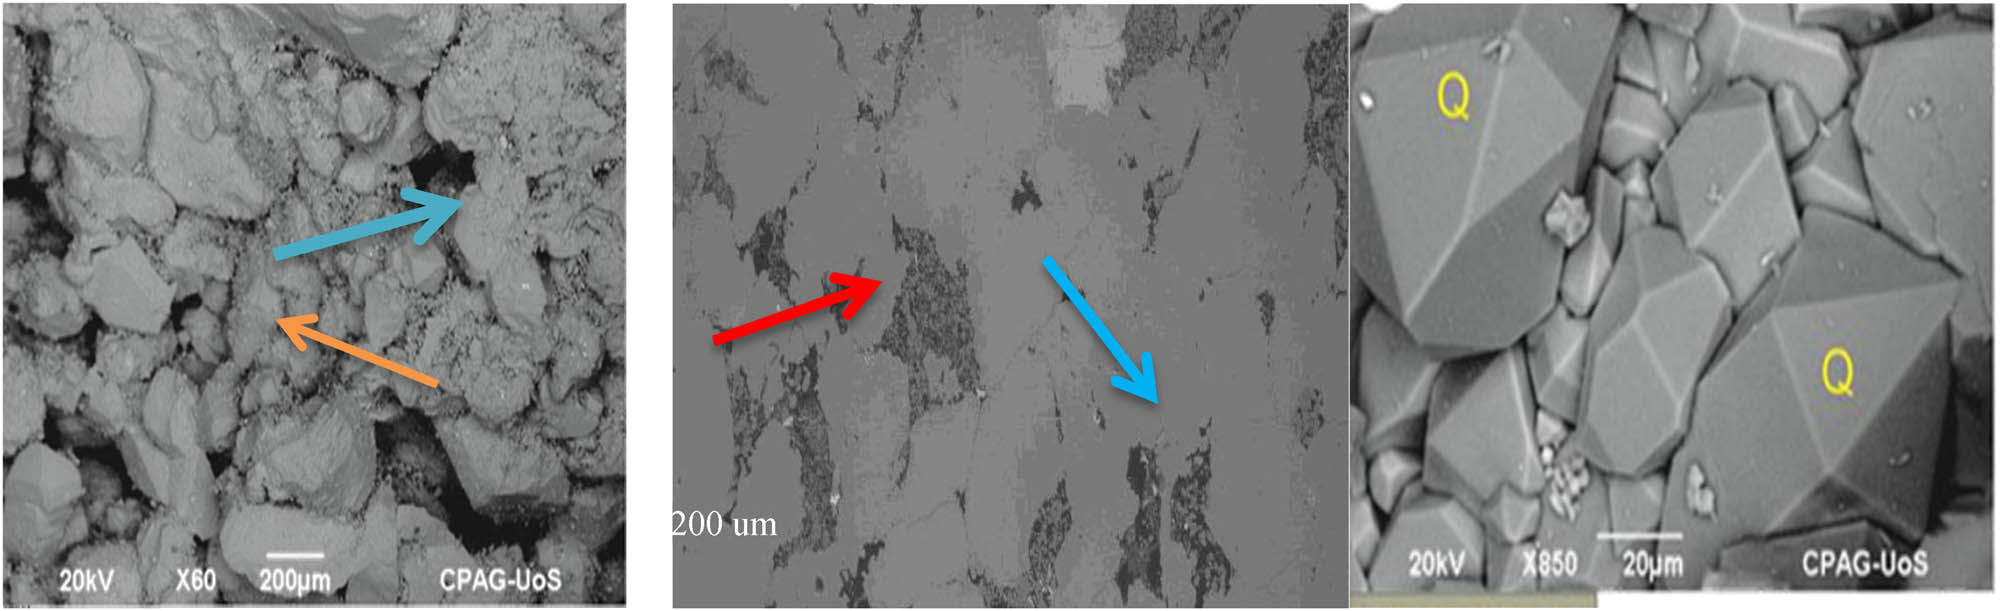
The clay mineralogy distribution and its impact on reservoir rock properties. From left to right this illustration displays the grain- coating clays, pore-filling clays, and no clay as observed from the scanning electron microscopy images.
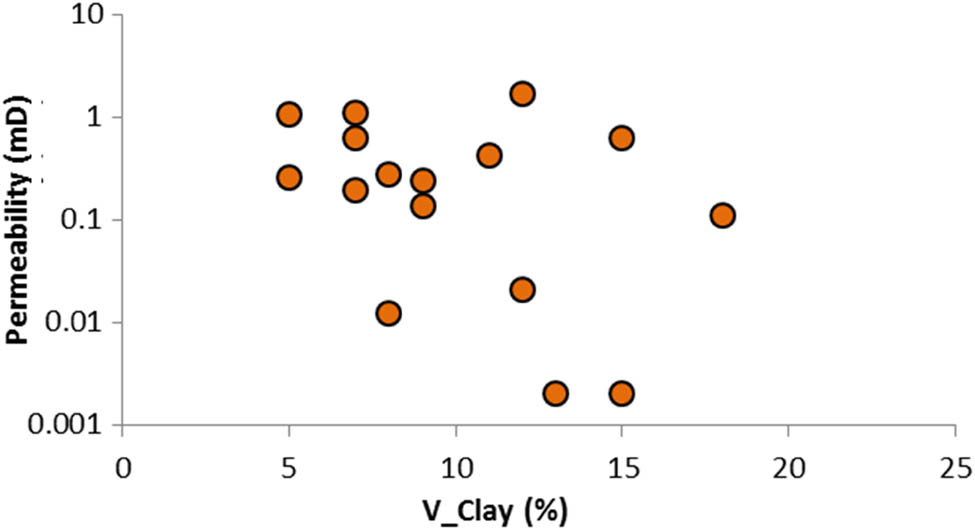
The relationship between permeability and clay content.
4 Discussion
4.1 Diagenetic controls on quality of reservoir
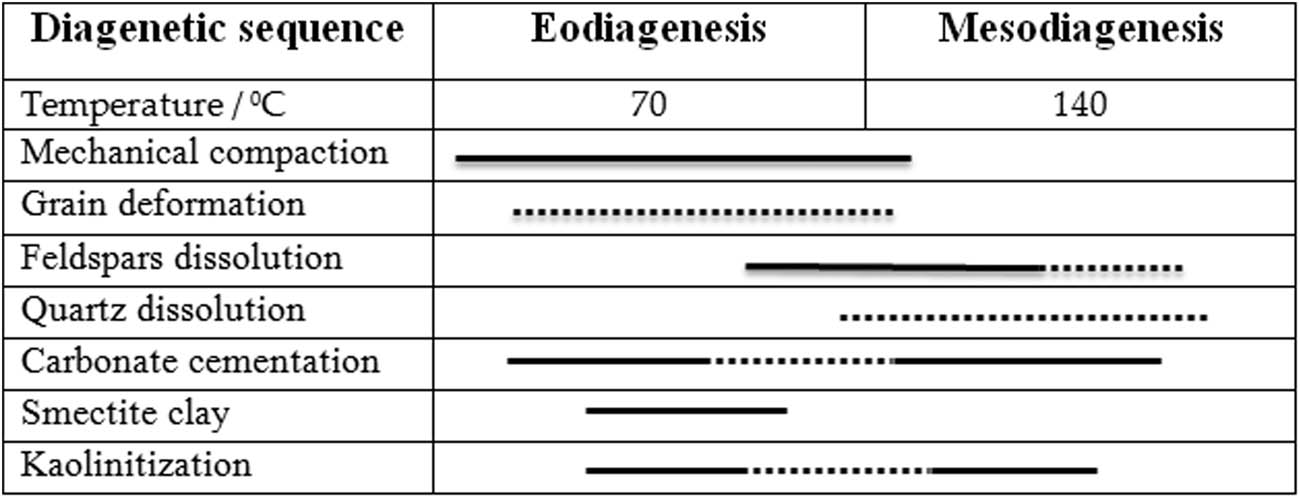
The main diagenetic processes that affected the Nari Formation sandstones are the mechanical compaction, deformation, cementation, and dissolution, which play a significant role in the reservoir quality of the sandstone. It has been observed that the porosity and permeability reduction as a result of calcite cements are larger than those due to the coating cement (i.e. clay minerals). It has been reported that the calcite cement observed in the Nari sandstone formation usually exists in other sandstone formations around the globe e.g. ref. [34]. Subsequently, it is perceived that the fluid flow may exhibit difficulty in moving through pores with a higher percentage (>20%) of calcite cements [35,36,37]. On the other hand, if calcite cements are found to be in smaller amounts, that is, less than 20%, it may result in slight increase in secondary porosity [36,38]. The likely sources of calcite cements may consist of the carbonate rock fragments dissolution, dissolution of K-feldspar, the diagenesis of interclasts and calcareous muds, alteration of clay minerals such as kaolinite to illite, and the transformation of smectite to illite [4,34,38,39]. The Nari Formation sandstones mostly contain interclast muds, which leads to the likely chances of alteration of authingenic minerals. The petrographic analysis displays that calcite cements are dispersed in most of the places in the Nari Formation sandstone samples. Consequently, the key cause of calcite cements in these samples is believed to be the results of exterior mudstones and interclasts. The diagenesis that affected Nari Formation sandstones is mainly classified as early and late diagenesis (Table 6).
Illustrates the diagenetic events experienced by Nari Formation sandstone reservoirs
 |
4.2 Paragenetic sequence
The textural connections among the diagenetic minerals combined with the petrographic studies were conducted to establish an overall paragenetic sequence of the Nari Formation. The main diagenetic minerals identified within these sample paragenesis are predominantly the cementation by carbonate mud influx, clay minerals, and quartz cements. Diagenetic modification showed discrepancy between different samples. The diagenetic events experienced by sandstone samples of Nari Formation is summarized in Table 6.
4.2.1 Early diagenesis
Depositional facies and detrital composition control the earlier processes of the diagenesis. They include mechanical compaction, earlier cementation dissolution, grain coating of smectite clay, and kaolinite precipitation. Porosity and permeability are controlled as inverse relation with mechanical compaction. The higher the compaction, the smaller the porosity and permeability in the sandstone facies. Studied samples indicate the mechanical compaction is mostly inferred by the closer grain packing of quartz grains (Figure 3a–f). Other indicators of mechanical compaction observed were the ruptured nature of earlier bioclasts, rock fragments, and mud intraclasts (Figure 3a–c). Cementation largely comprises iron oxide, early calcareous mud, and later stage calcite in the studied samples. The calcareous mud indicates the carbonate influx in the basin (Figure 3d and e). The cementation of iron oxide and calcareous mud also reduces the porosity and permeability in the studied samples significantly.
4.2.2 Late diagenesis
Detrital fragments such as feldspar undergo dissolution with interaction of meteoritic water. The meteoritic water come into contact with sediments when they are uplifted to shallower depths mostly of less than 2 km. The resulting dissolution alters the silicate such as feldspar and produce kaolinite. The degree of feldspar kaolinitization varies broadly. As such the fluvial sandstone alters more extensively than the shallow marine sandstone. Dissolution enhances the porosity and permeability. The presence of minor amount of kaolinite in the studied samples indicates lesser degree of kaolinitization (Figure 6 JT-10a) which shows smaller dissolution; hence, the trivial porosity and permeability enhancement. Late stage calcite cementation is also evidenced in the samples.
4.3 Burial diagenetic modifications on reservoir quality
For the successful exploitation and development of any reservoir, it is essential to have a sound knowledge of their mineral compositions, microstructural characteristics, associated depositional environment and burial diagenetic history, overburden stress, and reservoir rock heterogeneity [13,14,40,41,42,43,44,45,46,47,48,49,50,51]. The main diagenetic processes that affected the Nari Formation sandstones are the mechanical compaction, deformation, cementation, and dissolution, which play a significant role in the reservoir quality of the sandstone. The following events played a significant role in controlling the porosity and permeability of the Nari sandstone.
4.3.1 Mechanical compaction
Mechanical compaction reduced the porosity by rearrangement, grain packing, and displacement of detrital sediments. Small amount of earlier diagenetic cement in the samples rendered compaction to be a dominant factor to reduce the pore spaces between the sediments. This resulted in the overall porosity and permeability reduction.
4.3.2 Cementation
In the studied samples, cementation mainly comprises iron oxide (Figure 3e), calcite, and early calcareous mud. This influx of calcareous mud indicates the deltaic to shallow marine depositional environment. The calcareous influx also brought some bioclasts (Figure 3a and c). The cementation of iron oxide and calcareous mud is of pore-filling type and significantly reduced the porosity and permeability in the studied samples in the later stage of diagenesis.
4.3.3 Dissolution
In the later stage of diagenesis, epidiagenesis is the main phase for the formation of secondary dissolution pores. Kaolinitization is less evident in the studied samples, which shows that minor dissolution process has occurred. Hence, the secondary porosity is not significantly produced.
5 Conclusions
Integrated analyses of mineralogy, microstructure, petrography, and petrophysical properties on Nari sands were performed to evaluate the impact on the reservoir quality of the Lower Indus Basin, Pakistan. The following conclusions were drawn from the data analysis:
Analysed samples reveal that these are mainly composed of medium- to fine-grained, angular to subrounded quartz, associated with feldspars as well as some lithic fragments along with the broken fragments of fossils, cementing materials of iron oxides and calcites. The XRD result also confirms that quartz is the principal mineral component, forming 52.2–92.9% in all the analysed samples.
XRD results demonstrate that the bulk volume of the samples possesses clay minerals ranging from 5.3 to 16.1%. The most common clay mineral in all the samples was chlorite forming 4.1–9.4% of the bulk volume, and the illite and kaolinite clays were in very small quantity and considered as insignificant.
The Klinkenberg-corrected gas permeability obtained at maximum overburden stress of 2,500 psi confining pressure was ranging from 0.542 to 0.0112 mD. The presence of calcite and iron oxides along with clay minerals leads to significantly lower porosities and permeabilities resulting in poor quality reservoir.
The main diagenetic processes that affected the Nari Formation sandstones are the mechanical compaction, deformation, cementation, and dissolution. The permeability and porosity of Nari sandstones are smaller in values due to the mechanical compaction, authigenic cements pore filling of minerals and cements such as mud interclass bioclats, clay minerals, and iron oxides which turned this into tight reservoir rock.
Acknowledgements
First and second authors acknowledge their respective institutes for the support provided for this research. Authors also acknowledge the technical support from GSP, Pakistan, and ECU, Australia.
-
Funding information: No funds were received for this research work.
-
Author contributions: The research conceptualization, A.M.S, Experimental work conducted by G.R.A and A.A.M, performed petrographic analysis done by A.A.N; validation, field work conducted by A.A.H., and formal analysis, A.M.S and A.A.H and writing—original draft preparation by A.M.S.
-
Conflict of interest: The authors declare no conflict of interest.
-
Data availability statement: All the required data are already presented in this article. No further data are available.
References
[1] Taylor TR, Giles MR, Hathon LA, Diggs TN, Braunsdorf NR, Birbiglia GV, et al. Sandstone diagenesis and reservoir quality prediction: models, myths, and reality. AAPG Bull. 2010;94(8):1093–132.10.1306/04211009123Search in Google Scholar
[2] Ali Abro W, Majeed Shar A, Sang Lee K, Ali Narejo A. An integrated analysis of mineralogical and microstructural characteristics and petrophysical properties of carbonate rocks in the lower Indus Basin. Pak Open Geosci. 2019;11(1):1151–67.10.1515/geo-2019-0088Search in Google Scholar
[3] Hawkins P. Relationship between diagenesis, porosity reduction, and oil emplacement in late Carboniferous sandstone reservoirs, Bothamsall Oilfield, E Midlands. J Geol Soc. 1978;135(1):7–24.10.1144/gsjgs.135.1.0007Search in Google Scholar
[4] Umar M, Friis H, Khan AS, Kassi AM, Kasi AK. The effects of diagenesis on the reservoir characters in sandstones of the Late Cretaceous Pab Formation, Kirthar Fold Belt, southern Pakistan. J Asian Earth Sci. 2011;40(2):622–35.10.1016/j.jseaes.2010.10.014Search in Google Scholar
[5] Shar AM, Mahesar AA, Chandio AD, Memon KR. Impact of confining stress on permeability of tight gas sands: an experimental study. J Pet Explor Prod Technol. 2017;7(3):717–26.10.1007/s13202-016-0296-9Search in Google Scholar
[6] He J, Wang H, Zhang C, Yang X, Shangguan Y, Zhao R, et al. A comprehensive analysis of the sedimentology, petrography, diagenesis and reservoir quality of sandstones from the Oligocene Xiaganchaigou (E3) Formation in the Lengdong area, Qaidam Basin, China. J Pet Explor Prod Technol. 2019;9(2):953–69.10.1007/s13202-018-0571-zSearch in Google Scholar
[7] Mahesar AA, Shar AM, Ali M, Tunio AH, Uqailli MA, Mohanty US, et al. Morphological and petro physical estimation of eocene tight carbonate formation cracking by cryogenic liquid nitrogen; a case study of Lower Indus basin, Pakistan. J Pet Sci Eng. 2020;192:107318.10.1016/j.petrol.2020.107318Search in Google Scholar
[8] Bjørlykke K, Høeg K. Effects of burial diagenesis on stresses, compaction and fluid flow in sedimentary basins. Mar Pet Geol. 1997;14(3):267–76.10.1016/S0264-8172(96)00051-7Search in Google Scholar
[9] Amthor JE, Okkerman J. Influence of early diagenesis on reservoir quality of Rotliegende sandstones, northern Netherlands. AAPG Bull. 1998;82(12):2246–65.Search in Google Scholar
[10] Noh JH, Lee I. Diagenetic pore fluid evolution in the Pohang Miocene sediments: oxygen isotopic evidence of septarian carbonate concretions and authigenic mineral phases. Geosci J. 1999;3(3):141–9.10.1007/BF02910270Search in Google Scholar
[11] Zhu H, Zhong D, Zhang T, Liu G, Yao J, He C. Diagenetic controls on the reservoir quality of fine-grained “tight” sandstones: a case study based on NMR analysis. Energy Fuels. 2018;32(2):1612–23.10.1021/acs.energyfuels.7b03734Search in Google Scholar
[12] Baiyegunhi C, Liu K, Gwavava O. Diagenesis and reservoir properties of the Permian Ecca Group sandstones and mudrocks in the Eastern Cape Province, South Africa. Minerals. 2017;7(6):88.10.3390/min7060088Search in Google Scholar
[13] Chima P, Baiyegunhi C, Liu K, Gwavava O. Diagenesis and rock properties of sandstones from the Stormberg Group, Karoo Supergroup in the Eastern Cape Province of South Africa. Open Geosci. 2018;10(1):740–71.10.1515/geo-2018-0059Search in Google Scholar
[14] Fu M-Y, Song RC, Gluyas J, Zhang SN, Huang Q. Diagenesis and reservoir quality of carbonates rocks and mixed siliciclastic as response of the Late Carboniferous glacio-eustatic fluctuation: a case study of Xiaohaizi Formation in western Tarim Basin. J Pet Sci Eng. 2019;177:1024–41.10.1016/j.petrol.2019.03.011Search in Google Scholar
[15] Boggs JrS, Boggs S. Petrology of sedimentary rocks. Cambridge: Cambridge university press; 2009.10.1017/CBO9780511626487Search in Google Scholar
[16] Khan I, Ahmad S, Arif M, Ali N. Impact of diagenetic and depositional fabric on reservoir quality; a synthesis from Late Cretaceous and Early Paleocene sandstones in Eastern Sulaiman Range, Pakistan. Arab J Geosci. 2016;9(5):388.10.1007/s12517-016-2372-3Search in Google Scholar
[17] Curtis CD. Geochemistry: sedimentary geochemistry: environments and processes dominated by involvement of an aqueous phase. Philos Trans R Soc Lond Ser A Math Phys Sci. 1977;286(1336):353–72.10.1098/rsta.1977.0123Search in Google Scholar
[18] Giles MR, Marshall JD. Constraints on the development of secondary porosity in the subsurface: re-evaluation of processes. Mar Pet Geol. 1986;3(3):243–55.10.1016/0264-8172(86)90048-6Search in Google Scholar
[19] Francis J, Frakes L, Wright V. Sedimentology review. Sedimentol Rev. 1993;1:17–30.10.1002/9781444304534.ch2Search in Google Scholar
[20] Bloch S, Lander RH, Bonnell L. Anomalously high porosity and permeability in deeply buried sandstone reservoirs: origin and predictability. AAPG Bull. 2002;86(2):301–28.10.1306/61EEDABC-173E-11D7-8645000102C1865DSearch in Google Scholar
[21] Worden R, Burley S. Sandstone diagenesis: the evolution of sand to stone. Sandstone Diagen Recent Anc. 2003;4:3–44.10.1002/9781444304459.chSearch in Google Scholar
[22] Reed J, Eriksson K, Kowalewski M. Climatic, depositional and burial controls on diagenesis of Appalachian Carboniferous sandstones: qualitative and quantitative methods. Sediment Geol. 2005;176(3–4):225–46.10.1016/j.sedgeo.2004.11.003Search in Google Scholar
[23] Ajdukiewicz JM, Lander RH. Sandstone reservoir quality prediction: The state of the art. AAPG Bull. 2010;94(8):1083–91.10.1306/intro060110Search in Google Scholar
[24] Morad S, Al-Ramadan K, Ketzer JM, De Ros LF. The impact of diagenesis on the heterogeneity of sandstone reservoirs: a review of the role of depositional facies and sequence stratigraphy. AAPG Bull. 2010;94(8):1267–309.10.1306/04211009178Search in Google Scholar
[25] Zou C, Zhu R, Liu K, Su L, Bai B, Zhang X, et al. Tight gas sandstone reservoirs in China: characteristics and recognition criteria. J Pet Sci Eng. 2012;88:82–91.10.1016/j.petrol.2012.02.001Search in Google Scholar
[26] Molenaar N. Origin of low-permeability calcite-cemented lenses in shallow marine sandstones and CaCO3 cementation mechanisms: an example from the lower jurassic luxemburg sandstone, luxemburg. Carbonate cementation in sandstones: distribution patterns and geochemical evolution; 1998. p. 193–211.10.1002/9781444304893.ch9Search in Google Scholar
[27] Macquaker JHS, Taylor KG, Keller M, Polya D. Compositional controls on early diagenetic pathways in fine-grained sedimentary rocks: implications for predicting unconventional reservoir attributes of mudstones diagenesis of organic-rich mudstones. AAPG Bull. 2014;98(3):587–603.10.1306/08201311176Search in Google Scholar
[28] Mackenzie FT. Sediments, diagenesis, and sedimentary rocks: treatise on geochemistry. Vol. 7, Elsevier; 2005.Search in Google Scholar
[29] Hakro AAAD, Xiao W, Yan Z, Mastoi AS. Provenance and tectonic setting of early eocene sohnari member of Laki Formation from southern Indus Basin of Pakistan. Geol J. 2018;53(5):1854–70.10.1002/gj.3011Search in Google Scholar
[30] Kadri IB. Petroleum geology of Pakistan. Pakistan Petroleum Limited; 1995.Search in Google Scholar
[31] Shah S. Stratigraphy of Pakistan (Memoirs of the Geological Survey of Pakistan). The Geological Survey of Pakistan; 2009. p. 22.Search in Google Scholar
[32] Brohi I, Bablani S, Solangi S. Geology and economic significance of tertiary rocks, Khorwari Section, Surjan Anticline, Thano Bula Khan, Sindh. Sindh Univ Res J (Sci Ser). 2009;41:1.Search in Google Scholar
[33] Revil A, CathlesIii L. Permeability of shaly sands. Water Resour Res. 1999;35(3):651–62.10.1029/98WR02700Search in Google Scholar
[34] Walderhaug O, Bjørkum P. Calcite cement in shallow marine sandstones: growth mechanisms and geometry. Carbonate cementation in sandstones: distribution patterns and geochemical evolution; 1998. p. 179–92.10.1002/9781444304893.ch8Search in Google Scholar
[35] Xiao M, Yuan X, Cheng D, Wu S, Cao Z, Tang Y, et al. Feldspar dissolution and its influence on reservoirs: a case study of the Lower Triassic Baikouquan Formation in the northwest margin of the Junggar Basin, China. Geofluids. 2018;2018:2018–19.10.1155/2018/6536419Search in Google Scholar
[36] Yu Y, Lin L, Zhai C, Wang Y, Li Y, Guo Y. Diagenesis and reservoir characteristics analysis of the Late Triassic Xujiahe Formation tight gas sandstone in the northern Sichuan Basin, China. Energy Explor Exploit. 2018;36(4):743–63.10.1177/0144598717745778Search in Google Scholar
[37] Yuan J, Luo D, Feng L. A review of the technical and economic evaluation techniques for shale gas development. Appl Energy. 2015;148:49–65.10.1016/j.apenergy.2015.03.040Search in Google Scholar
[38] Higgs KE, Zwingmann H, Reyes AG, Funnell RH. Diagenesis, porosity evolution, and petroleum emplacement in tight gas reservoirs, Taranaki Basin, New Zealand. J Sediment Res. 2007;77(12):1003–25.10.2110/jsr.2007.095Search in Google Scholar
[39] Zhang Y, Lebedev M, Al-Yaseri A, Yu H, Xu X, Iglauer S. Characterization of nanoscale rockmechanical properties and microstructures of a Chinese sub-bituminous coal. J Nat Gas Sci Eng. 2018;52:106–16.10.1016/j.jngse.2018.01.037Search in Google Scholar
[40] Krevor S, Blunt MJ, Benson SM, Pentland CH, Reynolds C, Al-Menhali A, et al. Capillary trapping for geologic carbon dioxide storage–From pore scale physics to field scale implications. Int J Greenh Gas Control. 2015;40:221–37.10.1016/j.ijggc.2015.04.006Search in Google Scholar
[41] Shar AM, Mahesar AA, Memon KR. Could shale gas meet energy deficit: its current status and future prospects. J Pet Explor Prod Technol. 2018;8(4):957–67.10.1007/s13202-017-0399-ySearch in Google Scholar
[42] Bentley RW. Global oil and gas depletion: an overview. Energy Policy. 2002;30(3):189–205.10.1016/S0301-4215(01)00144-6Search in Google Scholar
[43] Farrokhrouz M, Taheri A, Keshavarz A. Numerical reactive flow transport simulation on core samples during acid fracturing in carbonaceous shale. J Nat Gas Sci Eng. 2020;84:103615.10.1016/j.jngse.2020.103615Search in Google Scholar
[44] Dahraj NU, Ali M, Khan MN. In end of linear flow time picking in long transient hydraulically fractured wells to correctly estimate the permeability, fracture half-length and original gas in place in liquid rich shales. PAPG/SPE Pakistan Section Annual Technical Conference and Exhibition. Society of Petroleum Engineers; 2016.10.2118/185303-MSSearch in Google Scholar
[45] Aftab A, Ali M, Sahito MF, Mohanty US, Jha NK, Akhondzadeh H, et al. Environmental friendliness and high performance of multifunctional tween 80/ZnO-nanoparticles-added water-based drilling fluid: an experimental approach. ACS Sustain Chem Eng. 2020;8(30):11224–43.10.1021/acssuschemeng.0c02661Search in Google Scholar
[46] Aftab A, Ali M, Arif M, Panhwar S, Saady NMC, Al-Khdheeawi EA, et al. Influence of tailor-made TiO2/API bentonite nanocomposite on drilling mud performance: towards enhanced drilling operations. Appl Clay Sci. 2020;199:105862.10.1016/j.clay.2020.105862Search in Google Scholar
[47] Ali M, Aftab A. Unconventional reservoirs. Scholarly Community Encyclopedia; 2020.10.32545/encyclopedia202007.0023.v3Search in Google Scholar
[48] Ali M, Jarni HH, Aftab A, Ismail AR, Saady NMC, Sahito MF, et al. Nanomaterial-based drilling fluids for exploitation of unconventional reservoirs: a review. Energies. 2020;13(13):3417.10.3390/en13133417Search in Google Scholar
[49] Mahesar AA, Ali M, Shar AM, Memon KR, Mohanty US, Akhondzadeh H, et al. Effect of cryogenic liquid nitrogen on the morphological and petrophysical characteristics of tight gas sandstone rocks from kirthar fold belt, Indus Basin, Pakistan. Energy Fuels. 2020;34(11):14548–59.10.1021/acs.energyfuels.0c02553Search in Google Scholar
[50] Memon KR, Mahesar AA, Ali M, Tunio AH, Mohanty US, Akhondzadeh H, et al. Influence of cryogenic liquid nitrogen on petro-physical characteristics of mancos shale: an experimental investigation. Energy Fuels. 2020;34(2):2160–8.10.1021/acs.energyfuels.9b03700Search in Google Scholar
[51] Mahesar AA, Shar AM, Ali M, Tunio AH, Uqailli MA, Mohanty US, et al. Morphological and petro physical estimation of eocene tight carbonate formation cracking by cryogenic liquid nitrogen; a case study of Lower Indus basin, Pakistan. J Pet Sci Eng. 2020;192:107318.10.1016/j.petrol.2020.107318Search in Google Scholar
[52] Berger A, Gier S, Krois P. Porosity-preserving chlorite cements in shallow-marine volcaniclastic sandstones: evidence from Cretaceous sandstones of the Sawan gas field, Pakistan. AAPG Bull. 2009;93(5):595–615.10.1306/01300908096Search in Google Scholar
© 2021 Abdul Majeed Shar et al., published by De Gruyter
This work is licensed under the Creative Commons Attribution 4.0 International License.
Articles in the same Issue
- Regular Articles
- Lithopetrographic and geochemical features of the Saalian tills in the Szczerców outcrop (Poland) in various deformation settings
- Spatiotemporal change of land use for deceased in Beijing since the mid-twentieth century
- Geomorphological immaturity as a factor conditioning the dynamics of channel processes in Rządza River
- Modeling of dense well block point bar architecture based on geological vector information: A case study of the third member of Quantou Formation in Songliao Basin
- Predicting the gas resource potential in reservoir C-sand interval of Lower Goru Formation, Middle Indus Basin, Pakistan
- Study on the viscoelastic–viscoplastic model of layered siltstone using creep test and RBF neural network
- Assessment of Chlorophyll-a concentration from Sentinel-3 satellite images at the Mediterranean Sea using CMEMS open source in situ data
- Spatiotemporal evolution of single sandbodies controlled by allocyclicity and autocyclicity in the shallow-water braided river delta front of an open lacustrine basin
- Research and application of seismic porosity inversion method for carbonate reservoir based on Gassmann’s equation
- Impulse noise treatment in magnetotelluric inversion
- Application of multivariate regression on magnetic data to determine further drilling site for iron exploration
- Comparative application of photogrammetry, handmapping and android smartphone for geotechnical mapping and slope stability analysis
- Geochemistry of the black rock series of lower Cambrian Qiongzhusi Formation, SW Yangtze Block, China: Reconstruction of sedimentary and tectonic environments
- The timing of Barleik Formation and its implication for the Devonian tectonic evolution of Western Junggar, NW China
- Risk assessment of geological disasters in Nyingchi, Tibet
- Effect of microbial combination with organic fertilizer on Elymus dahuricus
- An OGC web service geospatial data semantic similarity model for improving geospatial service discovery
- Subsurface structure investigation of the United Arab Emirates using gravity data
- Shallow geophysical and hydrological investigations to identify groundwater contamination in Wadi Bani Malik dam area Jeddah, Saudi Arabia
- Consideration of hyperspectral data in intraspecific variation (spectrotaxonomy) in Prosopis juliflora (Sw.) DC, Saudi Arabia
- Characteristics and evaluation of the Upper Paleozoic source rocks in the Southern North China Basin
- Geospatial assessment of wetland soils for rice production in Ajibode using geospatial techniques
- Input/output inconsistencies of daily evapotranspiration conducted empirically using remote sensing data in arid environments
- Geotechnical profiling of a surface mine waste dump using 2D Wenner–Schlumberger configuration
- Forest cover assessment using remote-sensing techniques in Crete Island, Greece
- Stability of an abandoned siderite mine: A case study in northern Spain
- Assessment of the SWAT model in simulating watersheds in arid regions: Case study of the Yarmouk River Basin (Jordan)
- The spatial distribution characteristics of Nb–Ta of mafic rocks in subduction zones
- Comparison of hydrological model ensemble forecasting based on multiple members and ensemble methods
- Extraction of fractional vegetation cover in arid desert area based on Chinese GF-6 satellite
- Detection and modeling of soil salinity variations in arid lands using remote sensing data
- Monitoring and simulating the distribution of phytoplankton in constructed wetlands based on SPOT 6 images
- Is there an equality in the spatial distribution of urban vitality: A case study of Wuhan in China
- Considering the geological significance in data preprocessing and improving the prediction accuracy of hot springs by deep learning
- Comparing LiDAR and SfM digital surface models for three land cover types
- East Asian monsoon during the past 10,000 years recorded by grain size of Yangtze River delta
- Influence of diagenetic features on petrophysical properties of fine-grained rocks of Oligocene strata in the Lower Indus Basin, Pakistan
- Impact of wall movements on the location of passive Earth thrust
- Ecological risk assessment of toxic metal pollution in the industrial zone on the northern slope of the East Tianshan Mountains in Xinjiang, NW China
- Seasonal color matching method of ornamental plants in urban landscape construction
- Influence of interbedded rock association and fracture characteristics on gas accumulation in the lower Silurian Shiniulan formation, Northern Guizhou Province
- Spatiotemporal variation in groundwater level within the Manas River Basin, Northwest China: Relative impacts of natural and human factors
- GIS and geographical analysis of the main harbors in the world
- Laboratory test and numerical simulation of composite geomembrane leakage in plain reservoir
- Structural deformation characteristics of the Lower Yangtze area in South China and its structural physical simulation experiments
- Analysis on vegetation cover changes and the driving factors in the mid-lower reaches of Hanjiang River Basin between 2001 and 2015
- Extraction of road boundary from MLS data using laser scanner ground trajectory
- Research on the improvement of single tree segmentation algorithm based on airborne LiDAR point cloud
- Research on the conservation and sustainable development strategies of modern historical heritage in the Dabie Mountains based on GIS
- Cenozoic paleostress field of tectonic evolution in Qaidam Basin, northern Tibet
- Sedimentary facies, stratigraphy, and depositional environments of the Ecca Group, Karoo Supergroup in the Eastern Cape Province of South Africa
- Water deep mapping from HJ-1B satellite data by a deep network model in the sea area of Pearl River Estuary, China
- Identifying the density of grassland fire points with kernel density estimation based on spatial distribution characteristics
- A machine learning-driven stochastic simulation of underground sulfide distribution with multiple constraints
- Origin of the low-medium temperature hot springs around Nanjing, China
- LCBRG: A lane-level road cluster mining algorithm with bidirectional region growing
- Constructing 3D geological models based on large-scale geological maps
- Crops planting structure and karst rocky desertification analysis by Sentinel-1 data
- Physical, geochemical, and clay mineralogical properties of unstable soil slopes in the Cameron Highlands
- Estimation of total groundwater reserves and delineation of weathered/fault zones for aquifer potential: A case study from the Federal District of Brazil
- Characteristic and paleoenvironment significance of microbially induced sedimentary structures (MISS) in terrestrial facies across P-T boundary in Western Henan Province, North China
- Experimental study on the behavior of MSE wall having full-height rigid facing and segmental panel-type wall facing
- Prediction of total landslide volume in watershed scale under rainfall events using a probability model
- Toward rainfall prediction by machine learning in Perfume River Basin, Thua Thien Hue Province, Vietnam
- A PLSR model to predict soil salinity using Sentinel-2 MSI data
- Compressive strength and thermal properties of sand–bentonite mixture
- Age of the lower Cambrian Vanadium deposit, East Guizhou, South China: Evidences from age of tuff and carbon isotope analysis along the Bagong section
- Identification and logging evaluation of poor reservoirs in X Oilfield
- Geothermal resource potential assessment of Erdaobaihe, Changbaishan volcanic field: Constraints from geophysics
- Geochemical and petrographic characteristics of sediments along the transboundary (Kenya–Tanzania) Umba River as indicators of provenance and weathering
- Production of a homogeneous seismic catalog based on machine learning for northeast Egypt
- Analysis of transport path and source distribution of winter air pollution in Shenyang
- Triaxial creep tests of glacitectonically disturbed stiff clay – structural, strength, and slope stability aspects
- Effect of groundwater fluctuation, construction, and retaining system on slope stability of Avas Hill in Hungary
- Spatial modeling of ground subsidence susceptibility along Al-Shamal train pathway in Saudi Arabia
- Pore throat characteristics of tight reservoirs by a combined mercury method: A case study of the member 2 of Xujiahe Formation in Yingshan gasfield, North Sichuan Basin
- Geochemistry of the mudrocks and sandstones from the Bredasdorp Basin, offshore South Africa: Implications for tectonic provenance and paleoweathering
- Apriori association rule and K-means clustering algorithms for interpretation of pre-event landslide areas and landslide inventory mapping
- Lithology classification of volcanic rocks based on conventional logging data of machine learning: A case study of the eastern depression of Liaohe oil field
- Sequence stratigraphy and coal accumulation model of the Taiyuan Formation in the Tashan Mine, Datong Basin, China
- Influence of thick soft superficial layers of seabed on ground motion and its treatment suggestions for site response analysis
- Monitoring the spatiotemporal dynamics of surface water body of the Xiaolangdi Reservoir using Landsat-5/7/8 imagery and Google Earth Engine
- Research on the traditional zoning, evolution, and integrated conservation of village cultural landscapes based on “production-living-ecology spaces” – A case study of villages in Meicheng, Guangdong, China
- A prediction method for water enrichment in aquifer based on GIS and coupled AHP–entropy model
- Earthflow reactivation assessment by multichannel analysis of surface waves and electrical resistivity tomography: A case study
- Geologic structures associated with gold mineralization in the Kirk Range area in Southern Malawi
- Research on the impact of expressway on its peripheral land use in Hunan Province, China
- Concentrations of heavy metals in PM2.5 and health risk assessment around Chinese New Year in Dalian, China
- Origin of carbonate cements in deep sandstone reservoirs and its significance for hydrocarbon indication: A case of Shahejie Formation in Dongying Sag
- Coupling the K-nearest neighbors and locally weighted linear regression with ensemble Kalman filter for data-driven data assimilation
- Multihazard susceptibility assessment: A case study – Municipality of Štrpce (Southern Serbia)
- A full-view scenario model for urban waterlogging response in a big data environment
- Elemental geochemistry of the Middle Jurassic shales in the northern Qaidam Basin, northwestern China: Constraints for tectonics and paleoclimate
- Geometric similarity of the twin collapsed glaciers in the west Tibet
- Improved gas sand facies classification and enhanced reservoir description based on calibrated rock physics modelling: A case study
- Utilization of dolerite waste powder for improving geotechnical parameters of compacted clay soil
- Geochemical characterization of the source rock intervals, Beni-Suef Basin, West Nile Valley, Egypt
- Satellite-based evaluation of temporal change in cultivated land in Southern Punjab (Multan region) through dynamics of vegetation and land surface temperature
- Ground motion of the Ms7.0 Jiuzhaigou earthquake
- Shale types and sedimentary environments of the Upper Ordovician Wufeng Formation-Member 1 of the Lower Silurian Longmaxi Formation in western Hubei Province, China
- An era of Sentinels in flood management: Potential of Sentinel-1, -2, and -3 satellites for effective flood management
- Water quality assessment and spatial–temporal variation analysis in Erhai lake, southwest China
- Dynamic analysis of particulate pollution in haze in Harbin city, Northeast China
- Comparison of statistical and analytical hierarchy process methods on flood susceptibility mapping: In a case study of the Lake Tana sub-basin in northwestern Ethiopia
- Performance comparison of the wavenumber and spatial domain techniques for mapping basement reliefs from gravity data
- Spatiotemporal evolution of ecological environment quality in arid areas based on the remote sensing ecological distance index: A case study of Yuyang district in Yulin city, China
- Petrogenesis and tectonic significance of the Mengjiaping beschtauite in the southern Taihang mountains
- Review Articles
- The significance of scanning electron microscopy (SEM) analysis on the microstructure of improved clay: An overview
- A review of some nonexplosive alternative methods to conventional rock blasting
- Retrieval of digital elevation models from Sentinel-1 radar data – open applications, techniques, and limitations
- A review of genetic classification and characteristics of soil cracks
- Potential CO2 forcing and Asian summer monsoon precipitation trends during the last 2,000 years
- Erratum
- Erratum to “Calibration of the depth invariant algorithm to monitor the tidal action of Rabigh City at the Red Sea Coast, Saudi Arabia”
- Rapid Communication
- Individual tree detection using UAV-lidar and UAV-SfM data: A tutorial for beginners
- Technical Note
- Construction and application of the 3D geo-hazard monitoring and early warning platform
- Enhancing the success of new dams implantation under semi-arid climate, based on a multicriteria analysis approach: Case of Marrakech region (Central Morocco)
- TRANSFORMATION OF TRADITIONAL CULTURAL LANDSCAPES - Koper 2019
- The “changing actor” and the transformation of landscapes