
Experimental study on the behavior of MSE wall having full-height rigid facing and segmental panel-type wall facing
-
Myoung-Soo Won
 and
Gwan-Hee Choi
and
Gwan-Hee Choi

Abstract
The amount of the lateral displacements on the mechanically stabilized earth (MSE) wall depends on the reinforcement extensibility and length, reinforcement-to-facing connection, and the wall facing, among others. In this study, the deformation behavior of MSE wall models was focused considering two types of wall facing and three types of reinforcement. A series of small-scale model tests were undertaken on the MSE wall having a full-height rigid (FHR) facing and a segmental panel-type (SPT) wall facing. At the same time, the models were using discrete geogrids, geosynthetic strips, and steel rods as reinforcement. The results showed that the geogrids-reinforced MSE wall with FHR facing exhibited the highest load capacity with the least vertical displacements. The MSE wall models with steel reinforcements generally exhibited the least lateral displacements at wall facing than those with geosynthetics reinforcements. Finally, the results showed that MSE wall models with FHR facing have generally lesser lateral displacements at the wall facing compared to those with SPT wall facing.
1 Introduction
The Saemangeum Development Project in South Korea builds the world’s longest seawall (33.9 km) connecting Gunsan and Buan to create reclaimed land (291 km2) and lake (118 km2), by developing 3.3 km2 of Gogunsan islands outside the seawall and 4.4 km2 of the new port. It is a national project to build the “global luxury Saemangeum” that will emerge as an economic center in Northeast Asia. Its project is underway for road, railway, and port constructions for internal development. The construction of the railway is going to happen in Saemangeum. Henceforth, land reclamations and the development of new international cities like Saemangeum could be a great opportunity for the application of mechanically stabilized earth (MSE) walls on railway and road projects. Although MSE walls have been used in Korea on highways for about four decades now [1], the MSE wall technology is not yet fully embraced in railway projects.
The MSE walls having a staged constructed full-height rigid (FHR) facing have been widely used in Japan and have performed well during the 1996 Great Kobe and the 2011 Great East Japan earthquakes [2,3,4]. About 320 failed geosynthetics-reinforced mechanically stabilized earth (MSE) walls were recorded in 2018 worldwide, wherein 75% were using modular concrete blocks [5,6]. The majority of the MSE wall failures considering the facing type are using segmental or modular blocks. In this case, failure may occur because not all blocks are attached to the reinforcements. The vertical spacing of reinforcements is generally high wherein several blocks are not directly connected to the reinforcements. These blocks were connected using pins, yet the connecting pins were too short to hold each other during excessive deformations at the wall facing. In addition, reinforcements are connected to the pin at the weak transverse member (rib) of the geogrids. A strong connection is important between the reinforcements and the facing element. The detachment of the wall facing from the reinforcement commonly occurred on the MSE wall having segmental panel-type wall facing. Several situations wherein the backfill soils raveled out through the gap between adjacent panels especially during heavy rains or flood, or even because of the wide gap between panels. The loss of a large quantity of backfill soil will eventually cause wall collapse. It has to be considered also that direct construction of the MSE wall with FHR facing is also susceptible to large wall deformations after the propping has been removed. In addition to the type of construction, it makes compaction difficult near the wall facing. Hence, poor or inadequate compaction of the backfill has been a major cause of wall failures as mentioned earlier. Nevertheless, the conventional retaining walls are out of the options because it has been proven to be more expensive, uneconomical especially on high-rise wall, may need pile foundation, and could not withstand high seismic forces [1,2,3,4,5,6,7].
The MSE wall system is composed majorly of backfill soil, reinforcement, and facing system whose performance depends on the interaction among the components, particularly between soil and reinforcement [8]. The reinforcements improved the mechanical properties of the reinforced soil mass by compensating the tensile strength and developing shear resistance from the friction at the soil–reinforcement interface to support the soil mass against deformations. This improvement is caused by the interaction at the interface between the reinforcement and the soil wherein stresses are transferred by friction or passive resistance [7,9,10]. The magnitude of the horizontal deformation at wall facing depends on the reinforcement extensibility, reinforcement length, reinforcement stiffness, reinforcement-to-facing connection details and the wall facing details, compaction efforts, and other significant parameters [8,9,11,12,13].
The objective of this article is to present the deformation behavior of MSE wall models using a simple experimental comparison between the FHR facing and segmental panel-type (SPT) wall facing. In this study, six small-scale models were simulated having three different types of reinforcement, such as discrete geogrids, geosynthetic strips, and steel rods, and two different types of wall facing, such as the SPT wall facing and FHR facing. The experiment focused on the comparison of the vertical and horizontal deformations of the six models. For simplicity, all models have the same loading condition and experimental setup.
2 Experiment setup and methodology
2.1 The specimen box
A customized specimen box was used to enclose the MSE wall model. The specimen box is walled with a stainless steel sheet at rear and at the sides and a polycarbonate sheet in front for viewing purposes as shown in Figure 1. The specimen box is rectangular with internal dimensions of 1.5 m in length, 0.5 m in width, and 1.0 m in height. The front wall is made of a 10 mm thick transparent polycarbonate sheet, through which the interior could be observed, and is reinforced with equal angle steel bars and steel channels. The top of the specimen box is kept open for the operation, while two pieces of detachable equal-angle steel bars are placed as reinforcement during testing. The bottom plate is made of a stainless steel plate and braced with steel channels on-center. The walls are reinforced with steel framings and secured to prevent deformation and undesirable movements of the specimen box during testing. The specimen box is placed on top of the supporting platform made of a 15 mm thick steel plate with rollers and stabilizing locks.
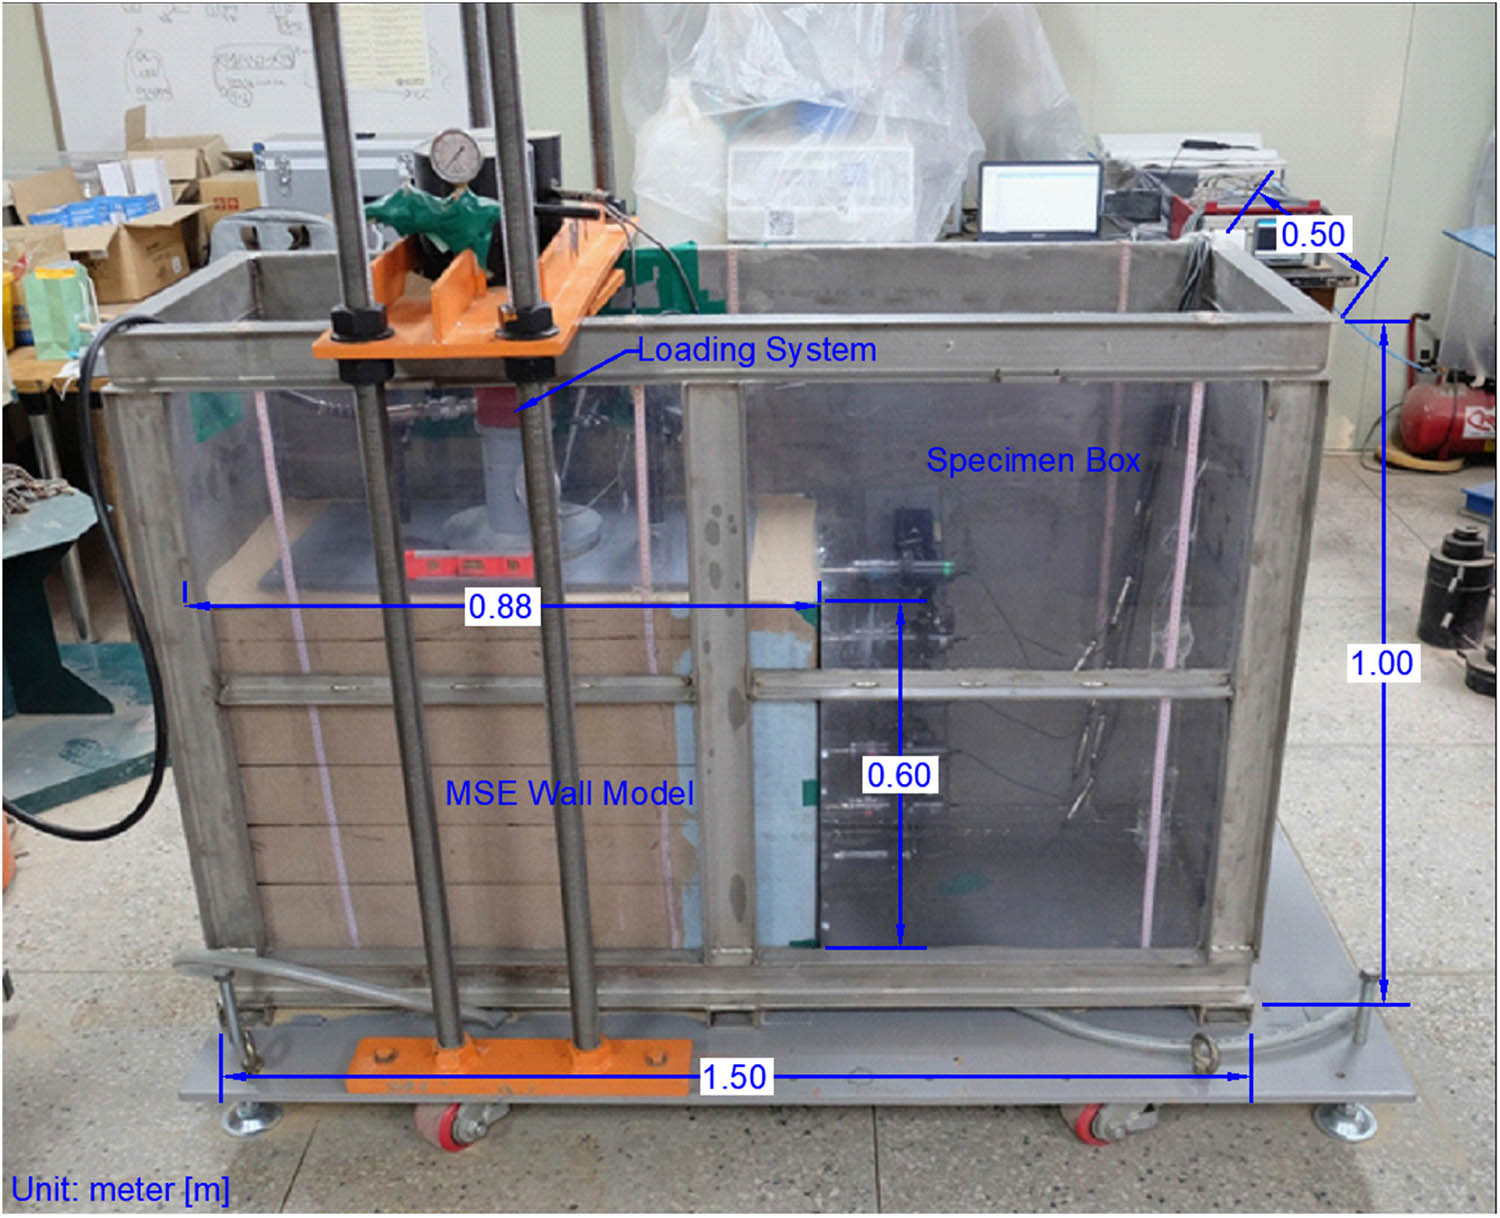
Specimen box for the model test.
2.2 The test setup
The model test setup was composed of the model specimen, the loading system, and the instrumentation as shown in Figure 2. The setup simulates a small-scale model of MSE wall having a height of 60 cm from the base and a width of 50 cm. The reinforced sand backfill has a length of 42 cm, and the retained sand backfill has a length of 45 cm, with a total backfill length of 88 cm. The MSE wall model rests directly on top of the steel plate, which represents a model built on top of a bedrock foundation. There was no soil foundation considered in the model test to avert the influence of foundation deformation on the behavior of the MSE wall model. A loading plate was placed at the top-center of the MSE wall model with an equal distance of 0.15H from the rear wall boundary and from the wall facing. The loading plate is made of steel with a thickness of 15 mm, a width of 40 cm, and a length of 70 cm. The load was applied on the model through a steel loading plate for at least 19 min or 50 kN, whichever comes first, and was recorded manually with 10 s interval. The pressure applied to the model was measured through the load gauge with a maximum capacity of 50 kN. The load gauge was mounted to the hydraulic jack. The hydraulic jack was manually controlled with a loading speed of 1 min per millimeter, which is done with the aid of a dial gauge and a timer. In addition, six 50 mm-LVDTs were used to measure the lateral displacement at the wall facing and were installed horizontally at the wall facing, with a vertical spacing of 10 cm on centers. Furthermore, two 100 mm-LVDTs were used to measure the vertical displacements at the loading plate and were installed vertically on the top of the loading plate at distances 24 and 64 cm from the wall facing. Finally, a dial gauge (DG) was placed on the middle of the loading plate to show the actual settlement during loading. All the instruments were connected to the data logger. The data logger was connected to the laptop, where the readings were recorded having a 1 s reading interval of all the instruments.
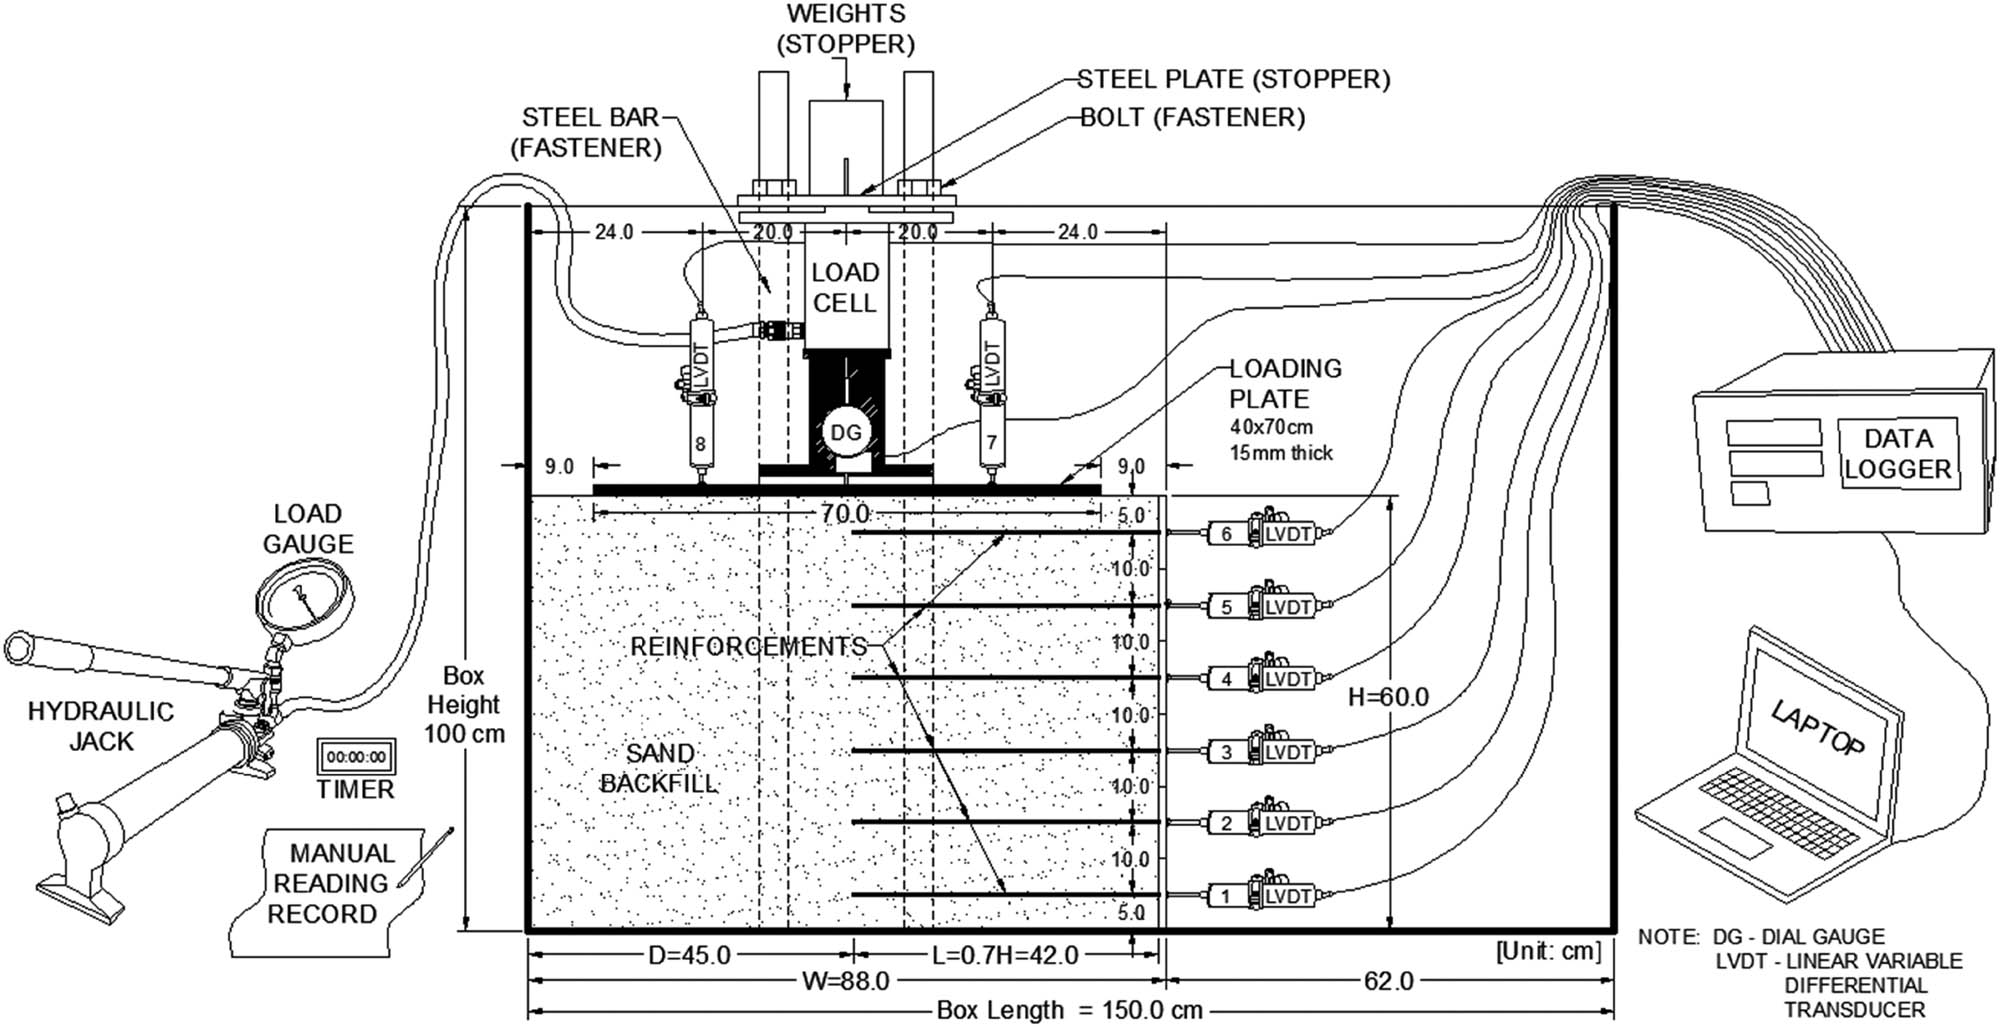
Schematic drawing of the model setup, loading system, and instrumentation.
2.3 The test cases
In this study, there are six model test cases having different types of reinforcement and wall facing as summarized in Table 1. Case 1 refers to the MSE wall model using geogrids reinforcement and FHR wall facing. Case 2 refers to the MSE wall model using geo-strips reinforcement and FHR wall facing. Case 3 refers to the MSE wall model using steel rods reinforcement and FHR wall facing. Case 4 refers to the MSE wall model using geogrids reinforcement and SPT wall facing. Case 5 refers to the MSE wall model using geo-strips reinforcement and SPT wall facing. Finally, Case 6 refers to the MSE wall model using steel rods reinforcement and SPT wall facing. Furthermore, each model cases have six layers of reinforcements having a uniform vertical spacing of 10 cm and a uniform length of 42 cm. The length of reinforcement was considered to be 0.7H according to FHWA [9].
List of model test cases and specifications
| Name | Reinforcements | Wall facings | |||||
|---|---|---|---|---|---|---|---|
| Type | Horizontal spacing (mm) | Vertical spacing (mm) | Length (mm) | Type | Height (mm) | Width (mm) | |
| Case 1 | Geogrids | 152.5 | 100 | 420 | FHR facing | 600 | 500 |
| Case 2 | Geo-strips | 62.0 | |||||
| Case 3 | Steel rods | 62.0 | |||||
| Case 4 | Geogrids | 152.5 | 100 | 420 | Segmental panels (6 layers) | 600 | 500 |
| Case 5 | Geo-strips | 62.0 | |||||
| Case 6 | Steel rods | 62.0 | |||||
2.4 The wall facing materials
The two types of wall facing material used in the model tests are shown in Figure 3. The first wall type is a full-height rigid (FHR) facing (see Figure 3(a)), which was made of rectangular steel plate with a thickness of 10 mm, a height of 600 mm, and a width of 500 mm. There were forty-eight holes punched through the wall facing for the reinforcement connections and were arranged uniformly having a horizontal spacing of 62 mm and vertical spacing of 100 mm. The second wall type is segmental-panel type (SPT) wall facing, which were composed of 24 segmental panels with interlocking connections (see Figure 3(b)). One segmental panel was made of rectangular steel plate with a thickness of 12 mm, a height of 100 mm, and a width of 124 mm. There were two holes punched through each segmental panel for the reinforcement connections. The segmental panels had protruding parts on top and at the side to connect and interlock with each other. The fully constructed SPT wall facing had a total height of 600 mm and a total width of 500 mm.
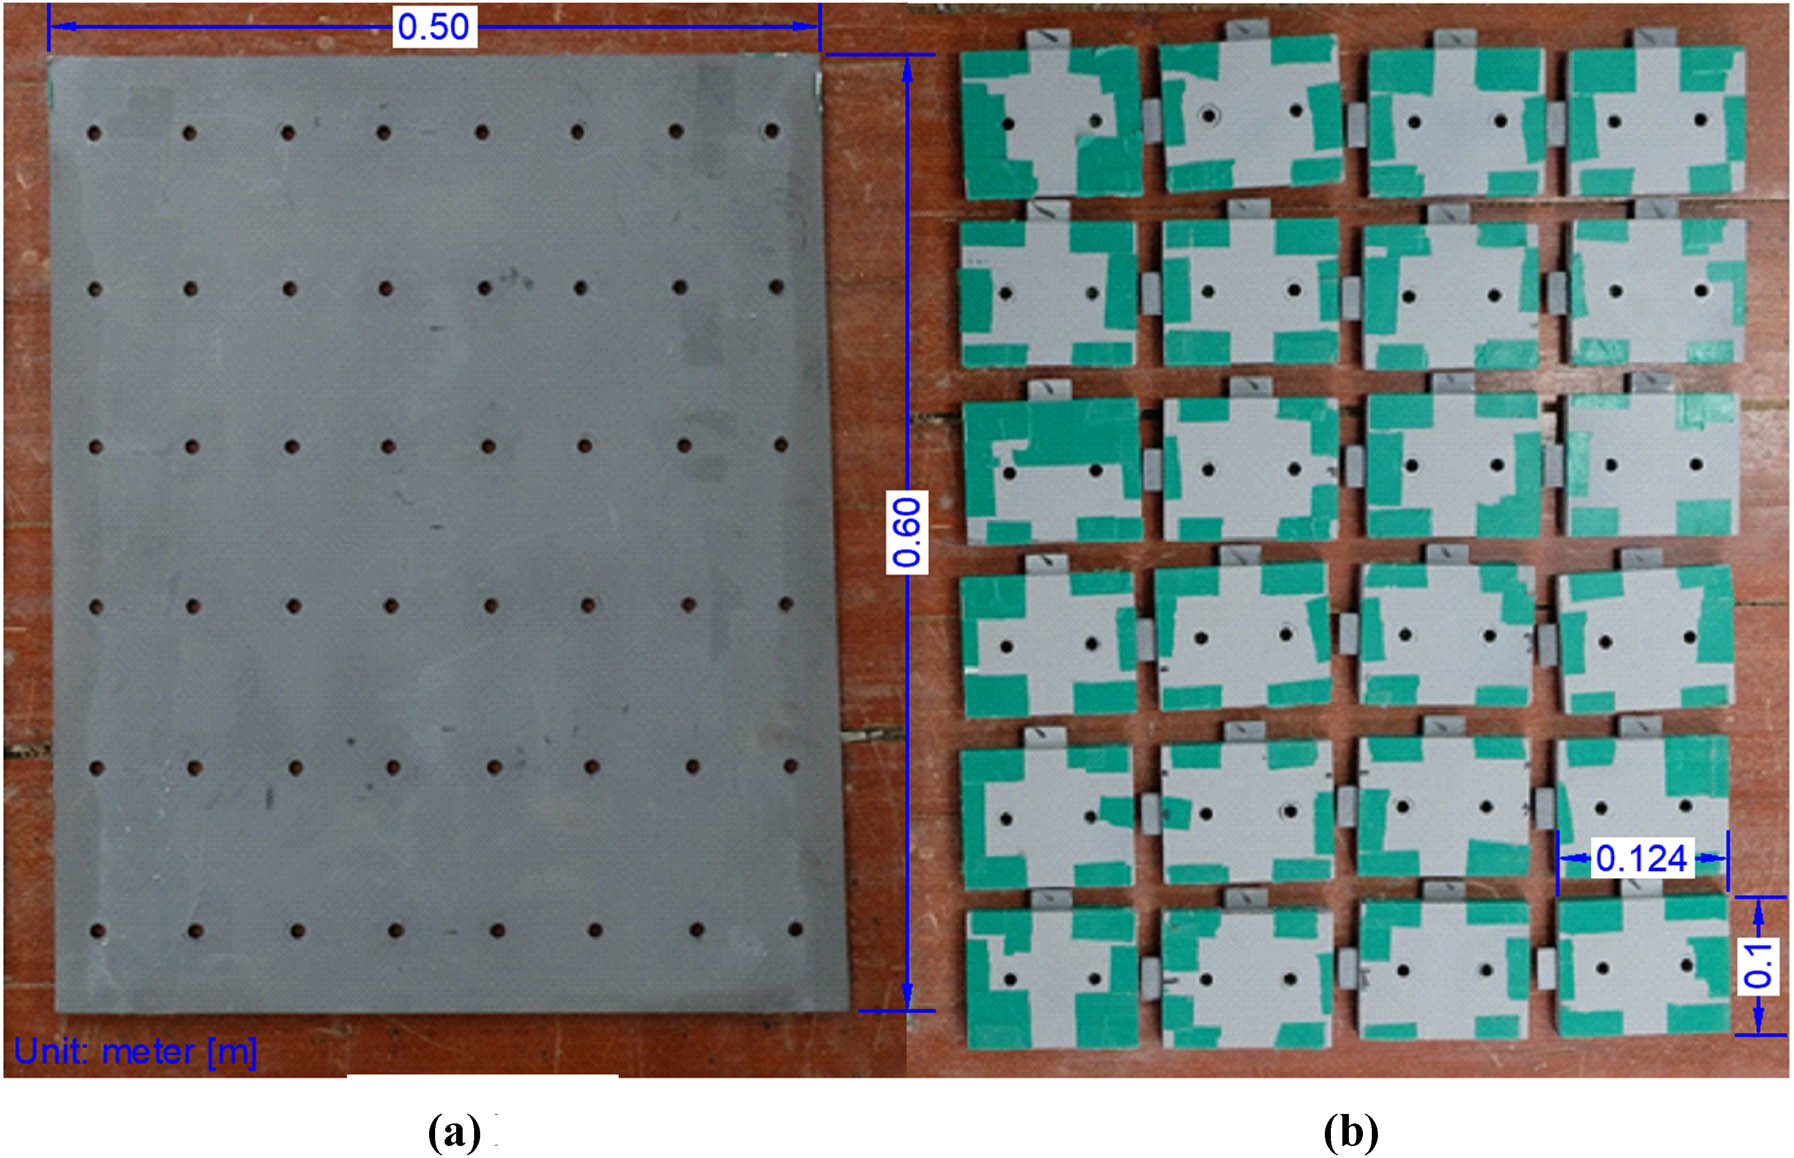
Types of wall facing used in the study: (a) FHR facing and (b) SPT wall facing.
2.5 The reinforcement arrangement and wall facing connection
The typical arrangement of the three different reinforcements and the connection scheme at the wall facing are shown in Figure 4. The arrangement of the reinforcements was referred from a related study of MSE wall reinforced with geogrids, geo-strips, and steel strips [14]. The first type of reinforcement used 2 mm-thick geogrids with a width of 113 mm, at left and right sides, and a width of 50 mm, at the center Figure 4(a). It has the horizontal spacing (Sh), equivalent to 152.50 mm from center to center of the geogrids. For the wall facing and reinforcement connection, the metal square U-bolts were fastened to the facing material, then geogrids were wrapped around the square U-bolts having an equal overlapping length of 420 mm. Small wires were used to tie the folded geogrids together. The second type of reinforcement used 8 mm width geosynthetic strips (geo-strips). The geo-strips were arranged uniformly having a horizontal spacing (Sh), of 62 mm on centers as shown in Figure 4(b). For the wall facing and reinforcement connection, the geo-strip was inserted in the hole of the wall facing material and on a 10 mm diameter metal nut. The geo-strip was then inserted back on the same hole, while the nut was left on the front side of the wall facing. The geo-strip was folded equally with the same length of 420 mm. Finally, the third type of reinforcement used a 9 mm diameter steel threaded rods arranged uniformly with horizontal spacing (Sh), of 62 mm on centers, similar to Case 2 (see Figure 4(c)). Here, the steel threaded rod was directly inserted into the hole and fastened to the wall facing material using a 10 mm diameter bolt nut. Furthermore, all reinforcements have uniform vertical spacing (Sv), of 100 mm and a reinforcement length (L), of 420 mm (see Table 1).
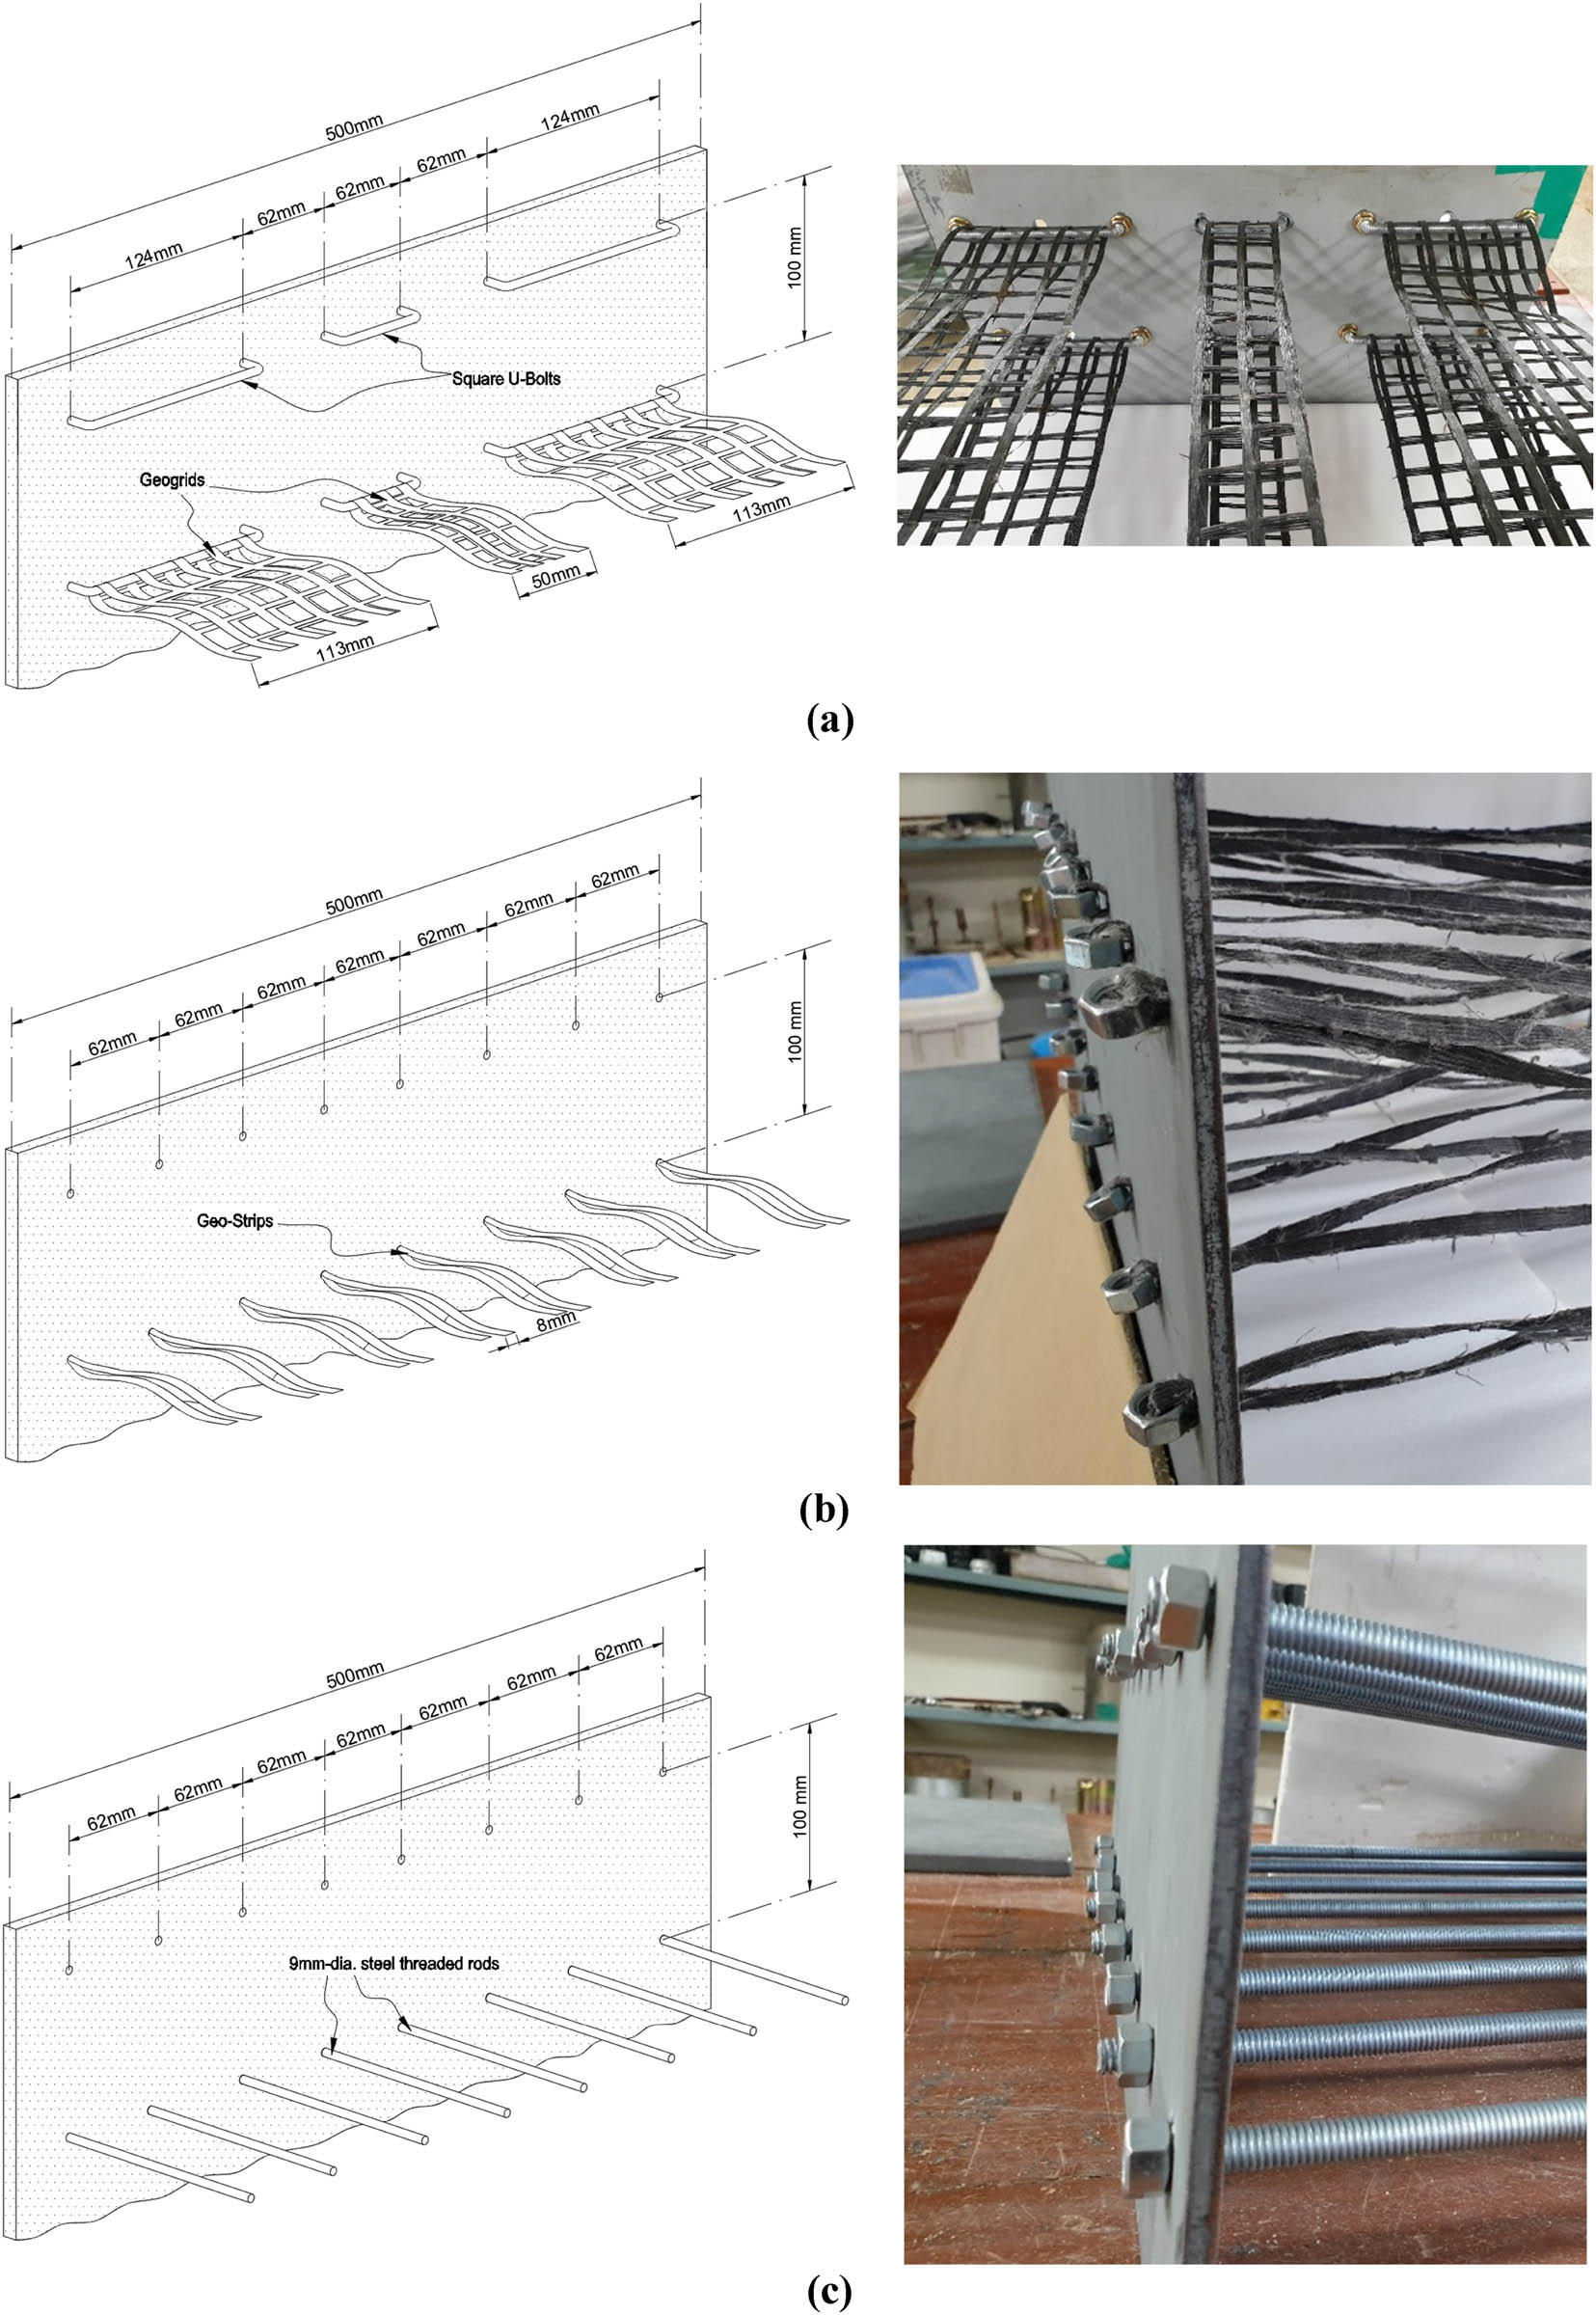
Reinforcement type, arrangement, and reinforcement-wall connection: (a) geogrids, (b) geo-strips, and (c) steel rods.
2.6 Model test construction
First step in the construction was to set up the wall facing support system. Using wooden bars, the wall facing support was setup to prevent wall deformation or movement during construction. A magnetic spirit level was used to ensure the plumbness of the wall during and after construction. Then, the first layer of SPT wall facing or the whole FHR facing was placed inside the specimen box where the line marked for wall facing was indicated. The reinforcements were installed including the accessories for the wall joint connection. The reinforcements were ensured to be horizontally leveled and not crumpled. The sand backfill was slowly poured behind wall facing with the constant free-falling height of 50 cm from the surface to achieve a uniform density for all the model test cases. The reinforcement installation and sand backfill application continued until the final layer was reached. At the final layer, the sand backfill surface was leveled. Then, using a spirit level, the evenness of the sand backfill surface was ensured before placing of the loading plate. After the MSE wall model has been constructed, the wall facing support system was slowly removed. The six 50 mm LVDTs were then installed horizontally at the wall facing. The first LVDT was installed at 5 cm from the base of the wall. Then the succeeding LVDTs were installed having a vertical spacing of 10 cm from each other. The six LVDTs were wired connecting to the data logger and were tested to ensure that they were fully functional. An initial reading was conducted on the lateral displacement of the wall facing before placing the loading equipment on top of the MSE wall model. Slowly, the loading plate was placed at the center of the sand backfill keeping 0.15H distance from the wall facing and from the rear end. Then, a 12 mm thick circular steel plate and the tubular steel spacer were placed at the center of the loading plate. Then, the load cell was slowly placed on top of the spacer. Finally, a 29.5 mm2 steel plate was placed on top of the load cell to close the small gap before the stopper plate (see Figure 2). Note that the stopper plate was fixed and fastened to the specimen box. After the loading system was completely set up, the two 100 mm LVDTs were installed vertically on top of the loading plate at 24 and 64 cm distance from the wall facing, and finally, the DG was installed below the load cell. The actual completed model test set up is shown in Figure 1. The instruments were tested to ensure full functionality before the loading started. A preloading, until 0.5 mm settlement, was conducted on all model cases in addition to the existing weights of the loading plate and the materials above it, which were approximately 1 kN. After the preloading has been recorded, the instruments were reset back to zero. Then, the manual loading was applied on the model with a speed of 1 mm/min until the settlement, S, of 19 mm or until 50 kN was reached, whichever came first. The loading was limited up to 50 kN to avoid deformation of the frames, which might lead to unrealistic results. Afterward, the final applied load was held constant, and the reading continued until the end of 1 h to check if there were further deformation that occurred after the final loading.
3 Experiment materials and properties
3.1 The reinforcement materials
The properties of the reinforcement materials used in the model test are summarized in Table 2. The results on a wide-width tensile test (KS K ISO 10319) on the geogrid material obtained a tensile strength of 72.87 kN/m at 7.9% strain. The geo-strip used in the study was the longitudinal rib of a geogrids whose results on the tensile test (KS K ISO 10319) showed 112.16 kN/m tensile strength at 5% strain. Finally, a commercial round steel-threaded rod was used as the third reinforcing material whose calculated load capacity is 2.65 kN.
Reinforcement material physical properties
| Parameter | Name | Unit | Reinforcements | ||
|---|---|---|---|---|---|
| Material | — | — | Geogrids | Geo-strips | Steel rods |
| Width | w | mm | 113 (sides), 50 (center) | 8 | 9 |
| Thickness/diameter | t | mm | 2 | 2 | 9 |
| Tensile strength (KS S ISO 10319) | T | kN/m | 72.87 | 112.16 | — |
| Strain (KS S ISO 10319) |
|
% | 7.9 | 5 | — |
| Load capacity | — | kN | — | — | 2.65 |
3.2 The sand backfill material
Sand was used in the study because it has been documented as an effective backfill material. The properties of the sand are presented in Table 3. The sand particles were finer than the No. 20 sieve with 100% passing, but were generally retained in the No. 40 sieve with 6.4% passing. The sand was classified, using the USCS, as poorly graded sand (SP). Moreover, a triaxial test was conducted on the sand material under consolidated-drained (CD) condition. The sand samples were tested with four different confining pressures: 50, 100, 150, and 200 kPa, and these results are plotted in Figure 5. The cohesionless sand obtained a friction angle of 37.5 degrees. In this study, the sand backfill was not subjected to compaction loads. To have a uniform density for all models, the sand was poured directly into the specimen box with a constant falling height of 50 cm from the surface. The relative density was obtained based on the air pluviation method [15,16]. The method resulted in a loose to medium relative density with a calculated dry unit weight of 14.51 kN/m3.
Sand material properties
| USCS class | D 60 (mm) | D 30 (mm) | D 10 (mm) | C u | C c | Dry unit weight (kN/m3) | Specific gravity | Cohesion (kPa) | Friction angle (degrees) |
|---|---|---|---|---|---|---|---|---|---|
| SP | 0.63 | 0.51 | 0.44 | 1.40 | 0.94 | 14.51 | 2.715 | 0 | 37.5 |
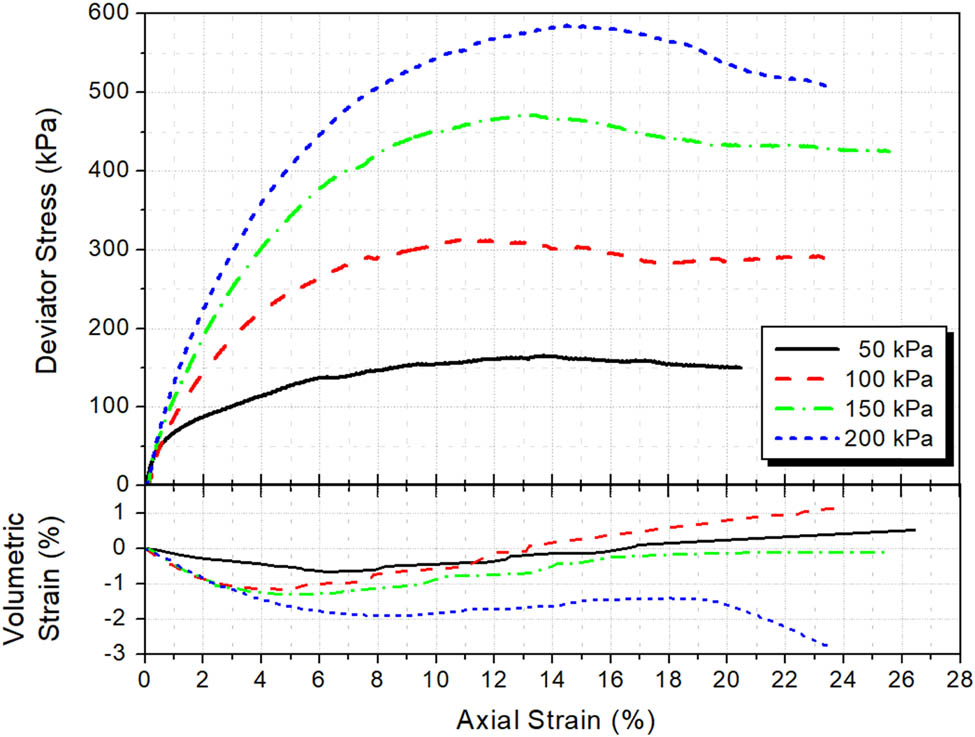
Triaxial test results: deviator stress and volumetric strain versus axial strain graph.
4 Experiment results and discussion
4.1 Vertical displacement on top of MSE wall model
The vertical displacement of the loading plate will be designated, in the following context of this article, as settlement (S) and the settlement ratio is expressed in percentage and is computed as S/B, where B is the length of the loading plate, equivalent to 700 mm. The load–settlement curves obtained after the series of model tests are plotted in Figure 6. The load–settlement curves are graphed based from the applied load (P) on the loading plate against the settlement (S), of the loading plate. The loading, N, was obtained based on the applied load (P), over the area of the loading plate.
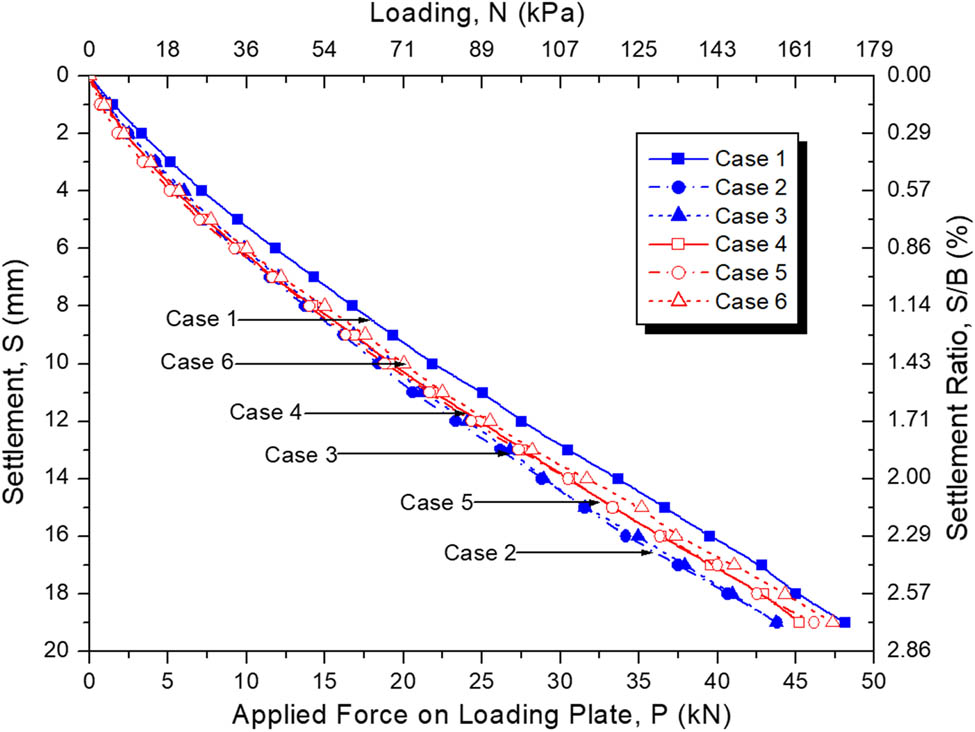
Load–settlement curve up to 19 mm settlement.
During the load application, the loading plate penetrated deeper through the backfill sand and the settlement slowly increased in accordance with the amount of applied load. The load–settlement curves in Figure 6 showed that Case 1, the MSE wall model having FHR facing and reinforced with discrete geogrids, consistently exhibited the best result against all other models and obtained the highest applied load of 172 kPa at the end of 19 mm settlement. Then, Case 2 and Case 3, which have FHR facing, showed similar deformation behavior. While Case 4, Case 5, and Case 6, all MSE wall models having SPT wall facing, showed similar deformation behavior. The results inferred that geo-strips reinforcement is generally the weakest compared to discrete geogrids and steel rods.
4.2 Settlement–loading ratio
The influence of the wall facing type used in the MSE wall, having a similar reinforcement type, was analyzed using the load ratio (LR) as shown in Figure 7. Here, the LR was computed as follows:
where
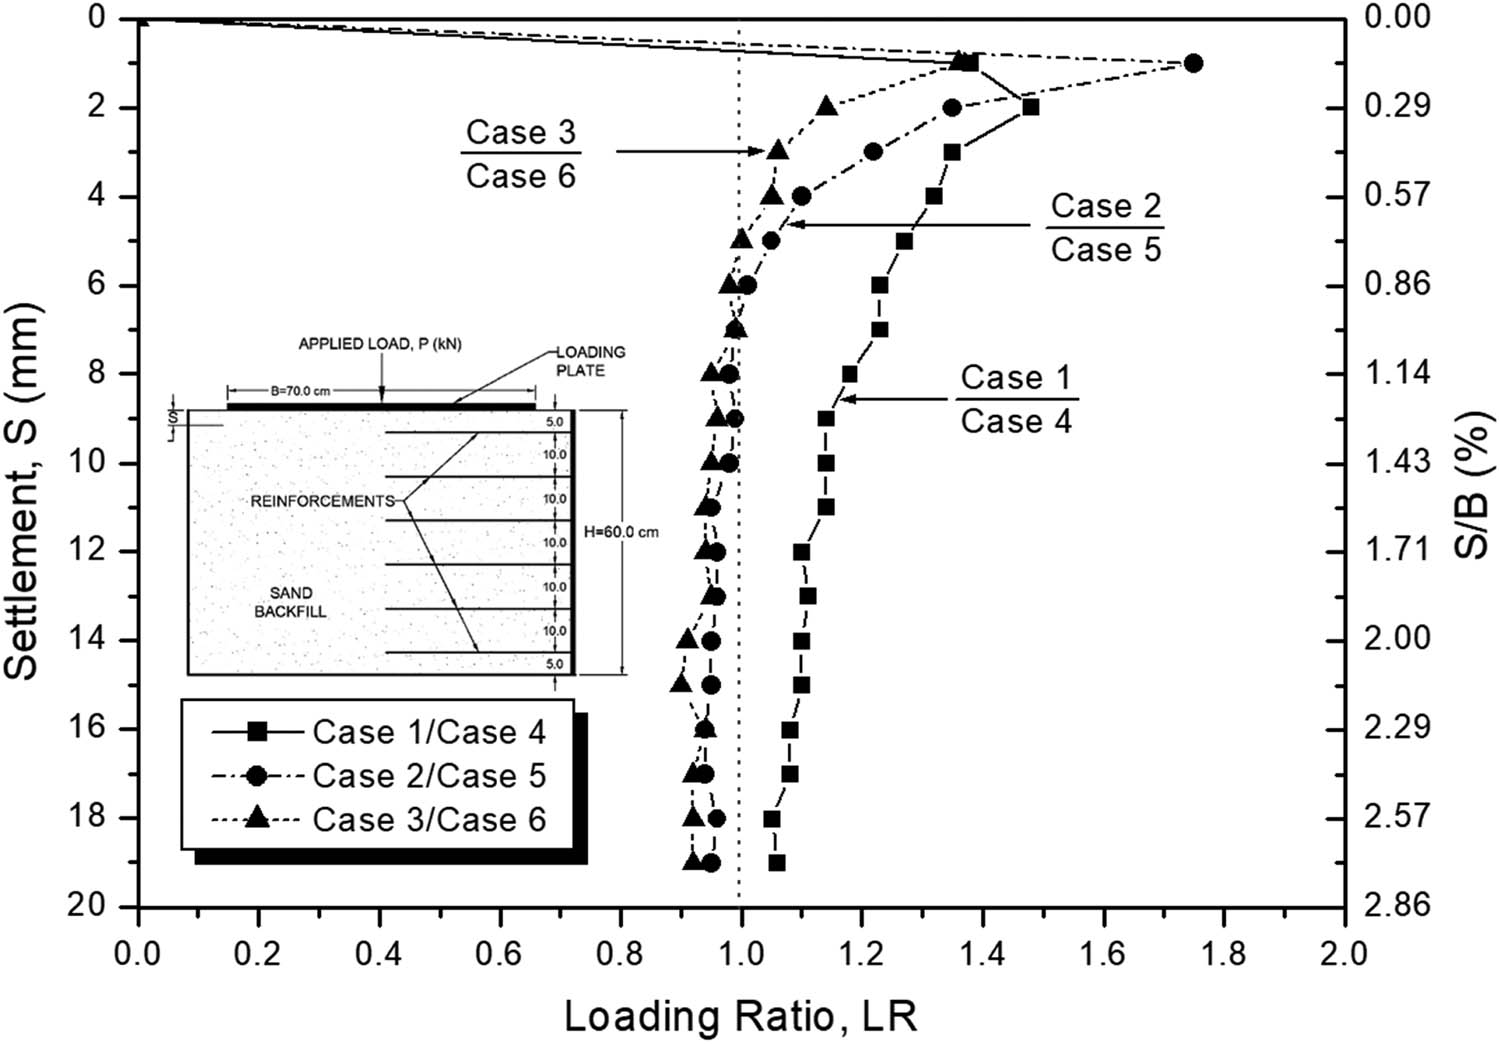
Loading ratio between FHR facing and SPT wall facing.
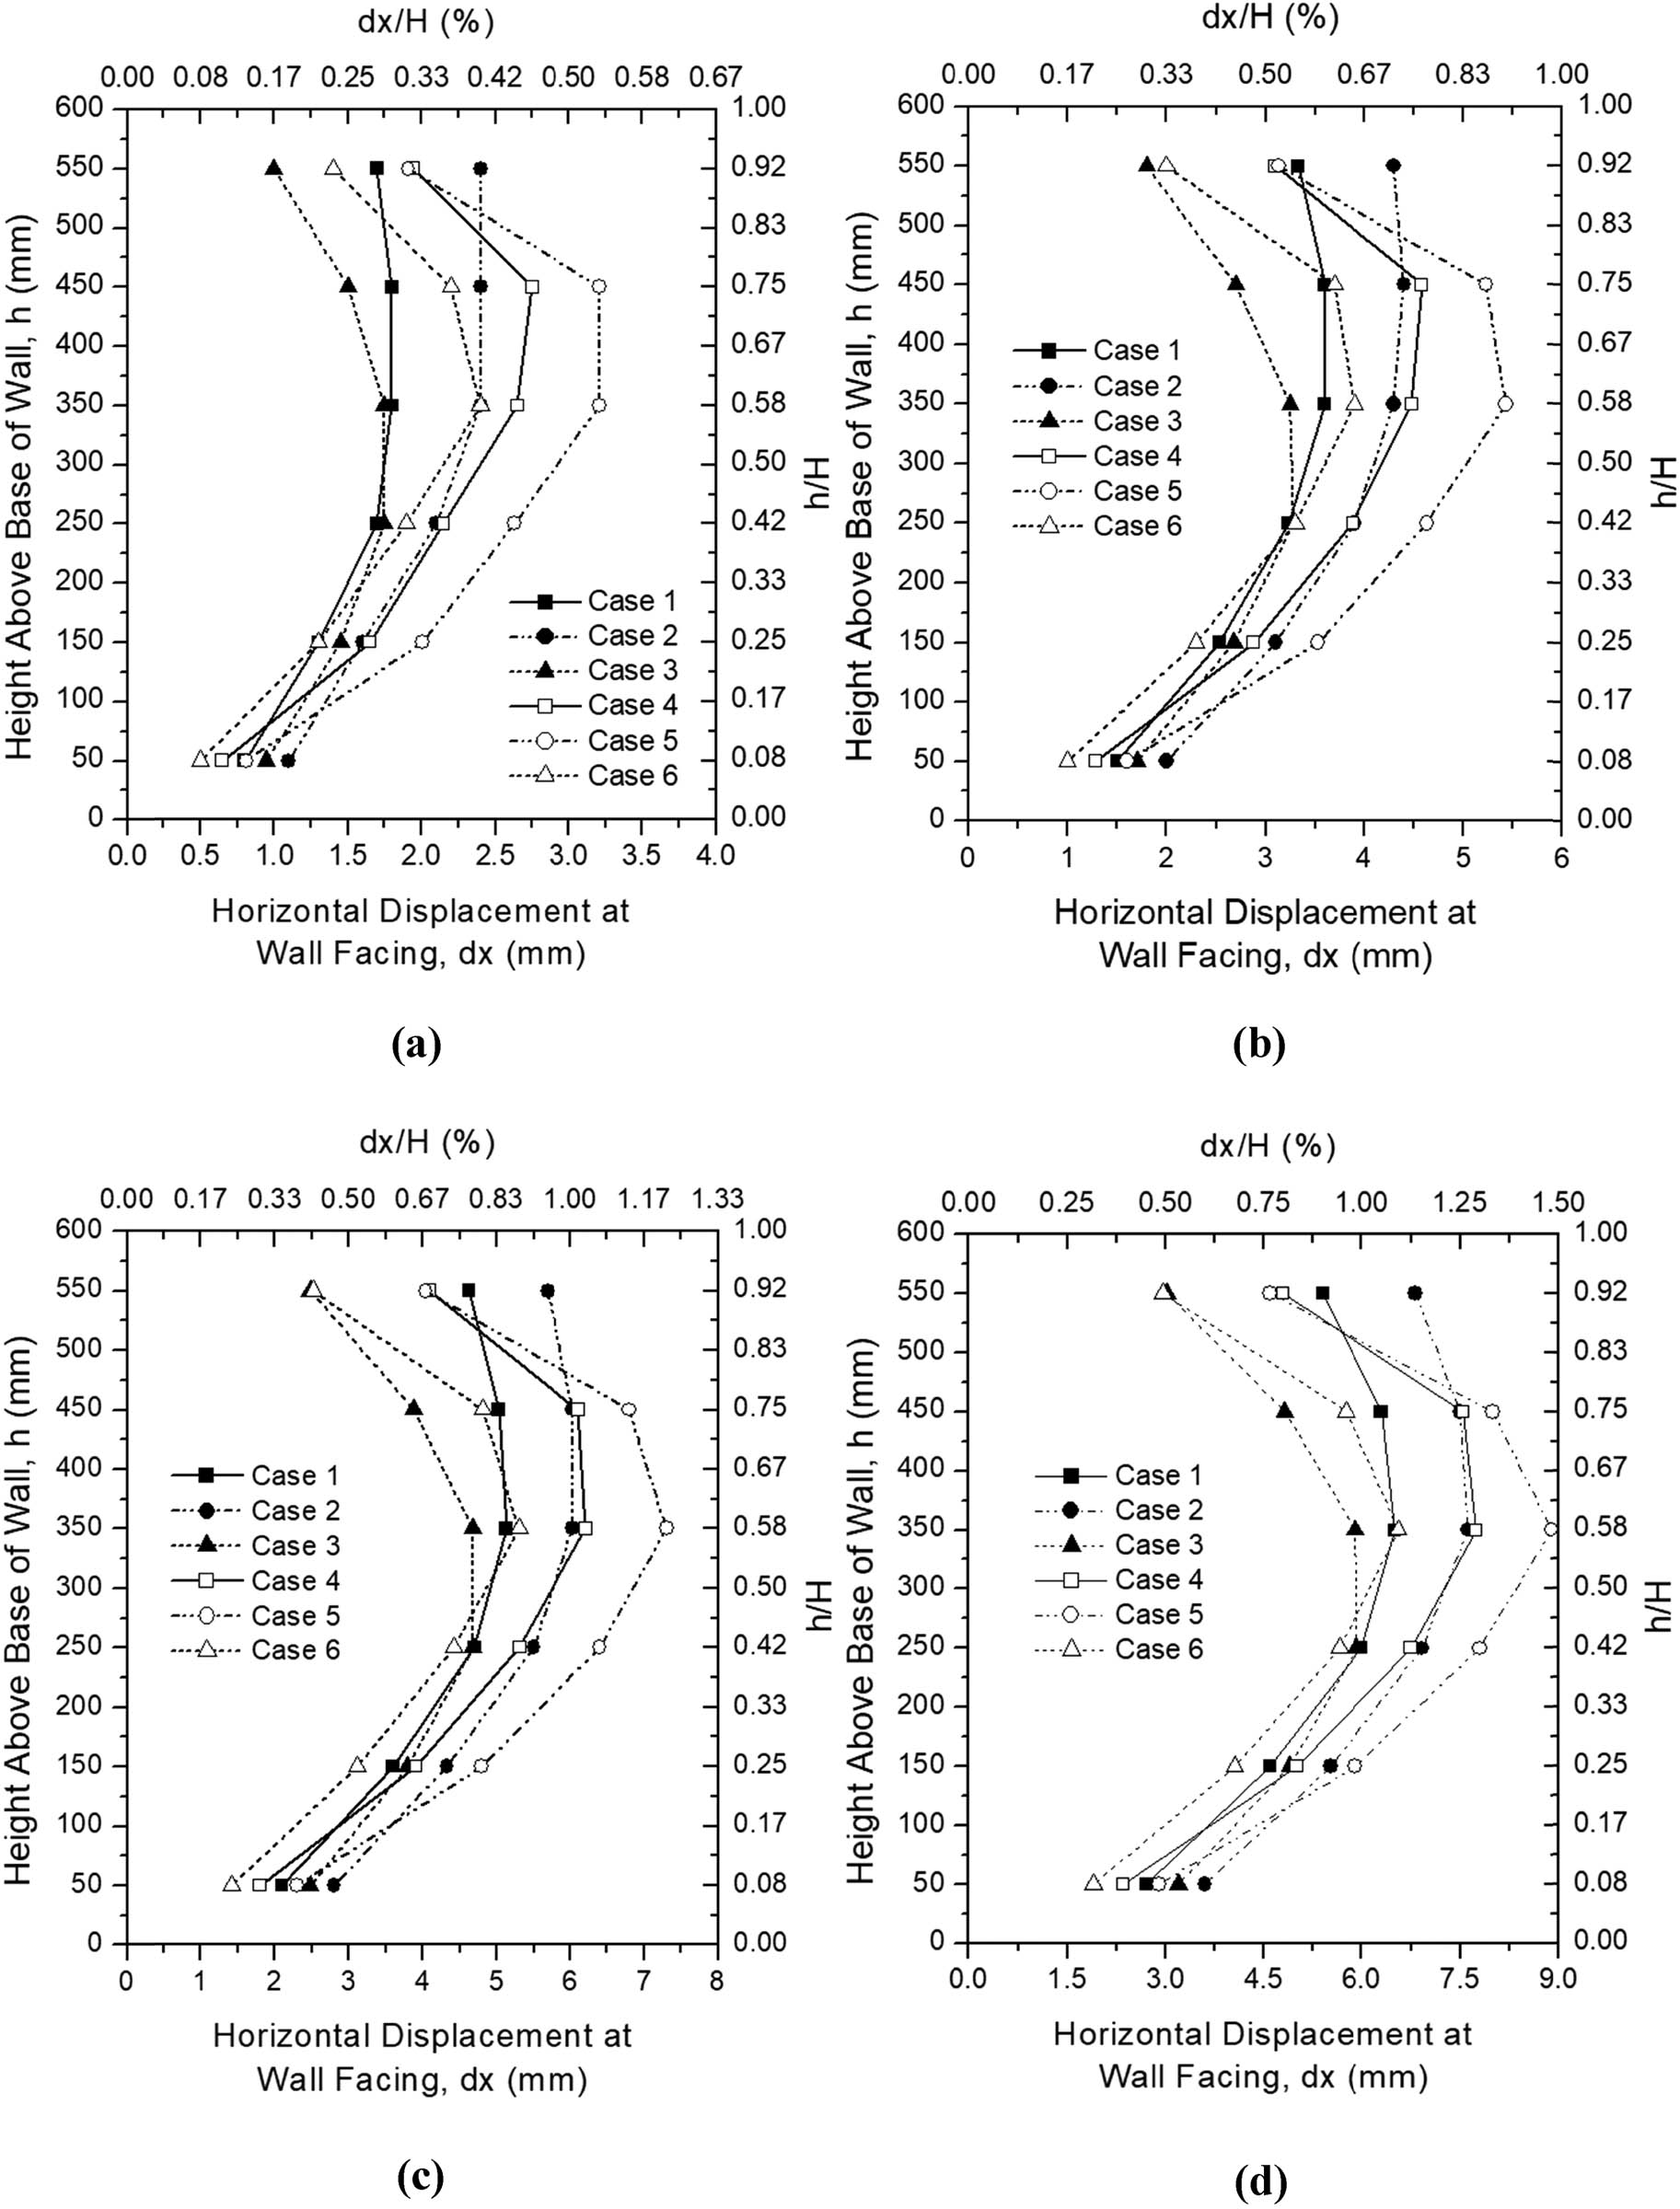
Variation of lateral displacement at wall facing with applied load: (a) P = 10 kN, (b) P = 20 kN, (c) P = 30 kN, and (d) P = 40 kN.
4.3 Lateral displacements at wall facing with incremental loading
The lateral displacements (dx) at wall facing were basically caused by the load applied on top of the MSE wall model and were also influenced by the types of reinforcement and wall facing material used. Concurrent with the increasing settlement of the loading plate during the load application was the increasing lateral displacement at the wall facing. It is evident that the application of every 10 kN load induced a remarkable increase in the lateral displacements at wall facing. The percentage differences between the applied loads on every 10 kN were calculated based on the increment of lateral displacement. The results showed the average percentage increase was 81–91%, 41–49%, 25–30%, and 17–21% for 10, 20, 30, and 40 kN load applied, respectively. It can be observed that the increment on lateral displacements depreciates after the succeeding 10 kN load is applied.
To clearly understand the behavior of the dx for each model test cases, the incremental dx after every 10 kN of applied loading is shown in Figure 8. The points on the dx curves were the readings obtained from the six LVDTs installed at the wall facing with elevation of 50 mm (0.08H), 150 mm (0.25H), 250 mm (0.42H), 350 mm (0.58H), 450 mm (0.75H), and 550 mm (0.92H). The results inferred that the application of linearly increasing load on top of the MSE wall exhibited great effects especially at the middle half (0.25–0.75H) of the wall facing profile. It can be observed that a significant increase in dx was visible after the first 10 kN load has been applied and increased more after the succeeding 10 kN has been applied. Moreover, it can be observed that the models with FHR facing (Case 1–3) exhibited more dx near the base of the wall than the models with SPT wall facing (Case 4–6). Generally, the models with FHR facing exhibited lesser dx curves than the models with SPT wall facing (also see Figure 10). In addition, the maximum dx generally occurred between 0.58 and 0.75H.
Nevertheless, after the load application, the final wall facing profile for each model cases are shown in Figure 9. The photos showed that the wall facing remained intact after the loading was applied, yet exhibited significant lateral displacements. A sketch is shown in Figure 10 to visualize the difference of the wall facing profiles between FHR facing and SPT wall facing at the end of 40 kN loading.
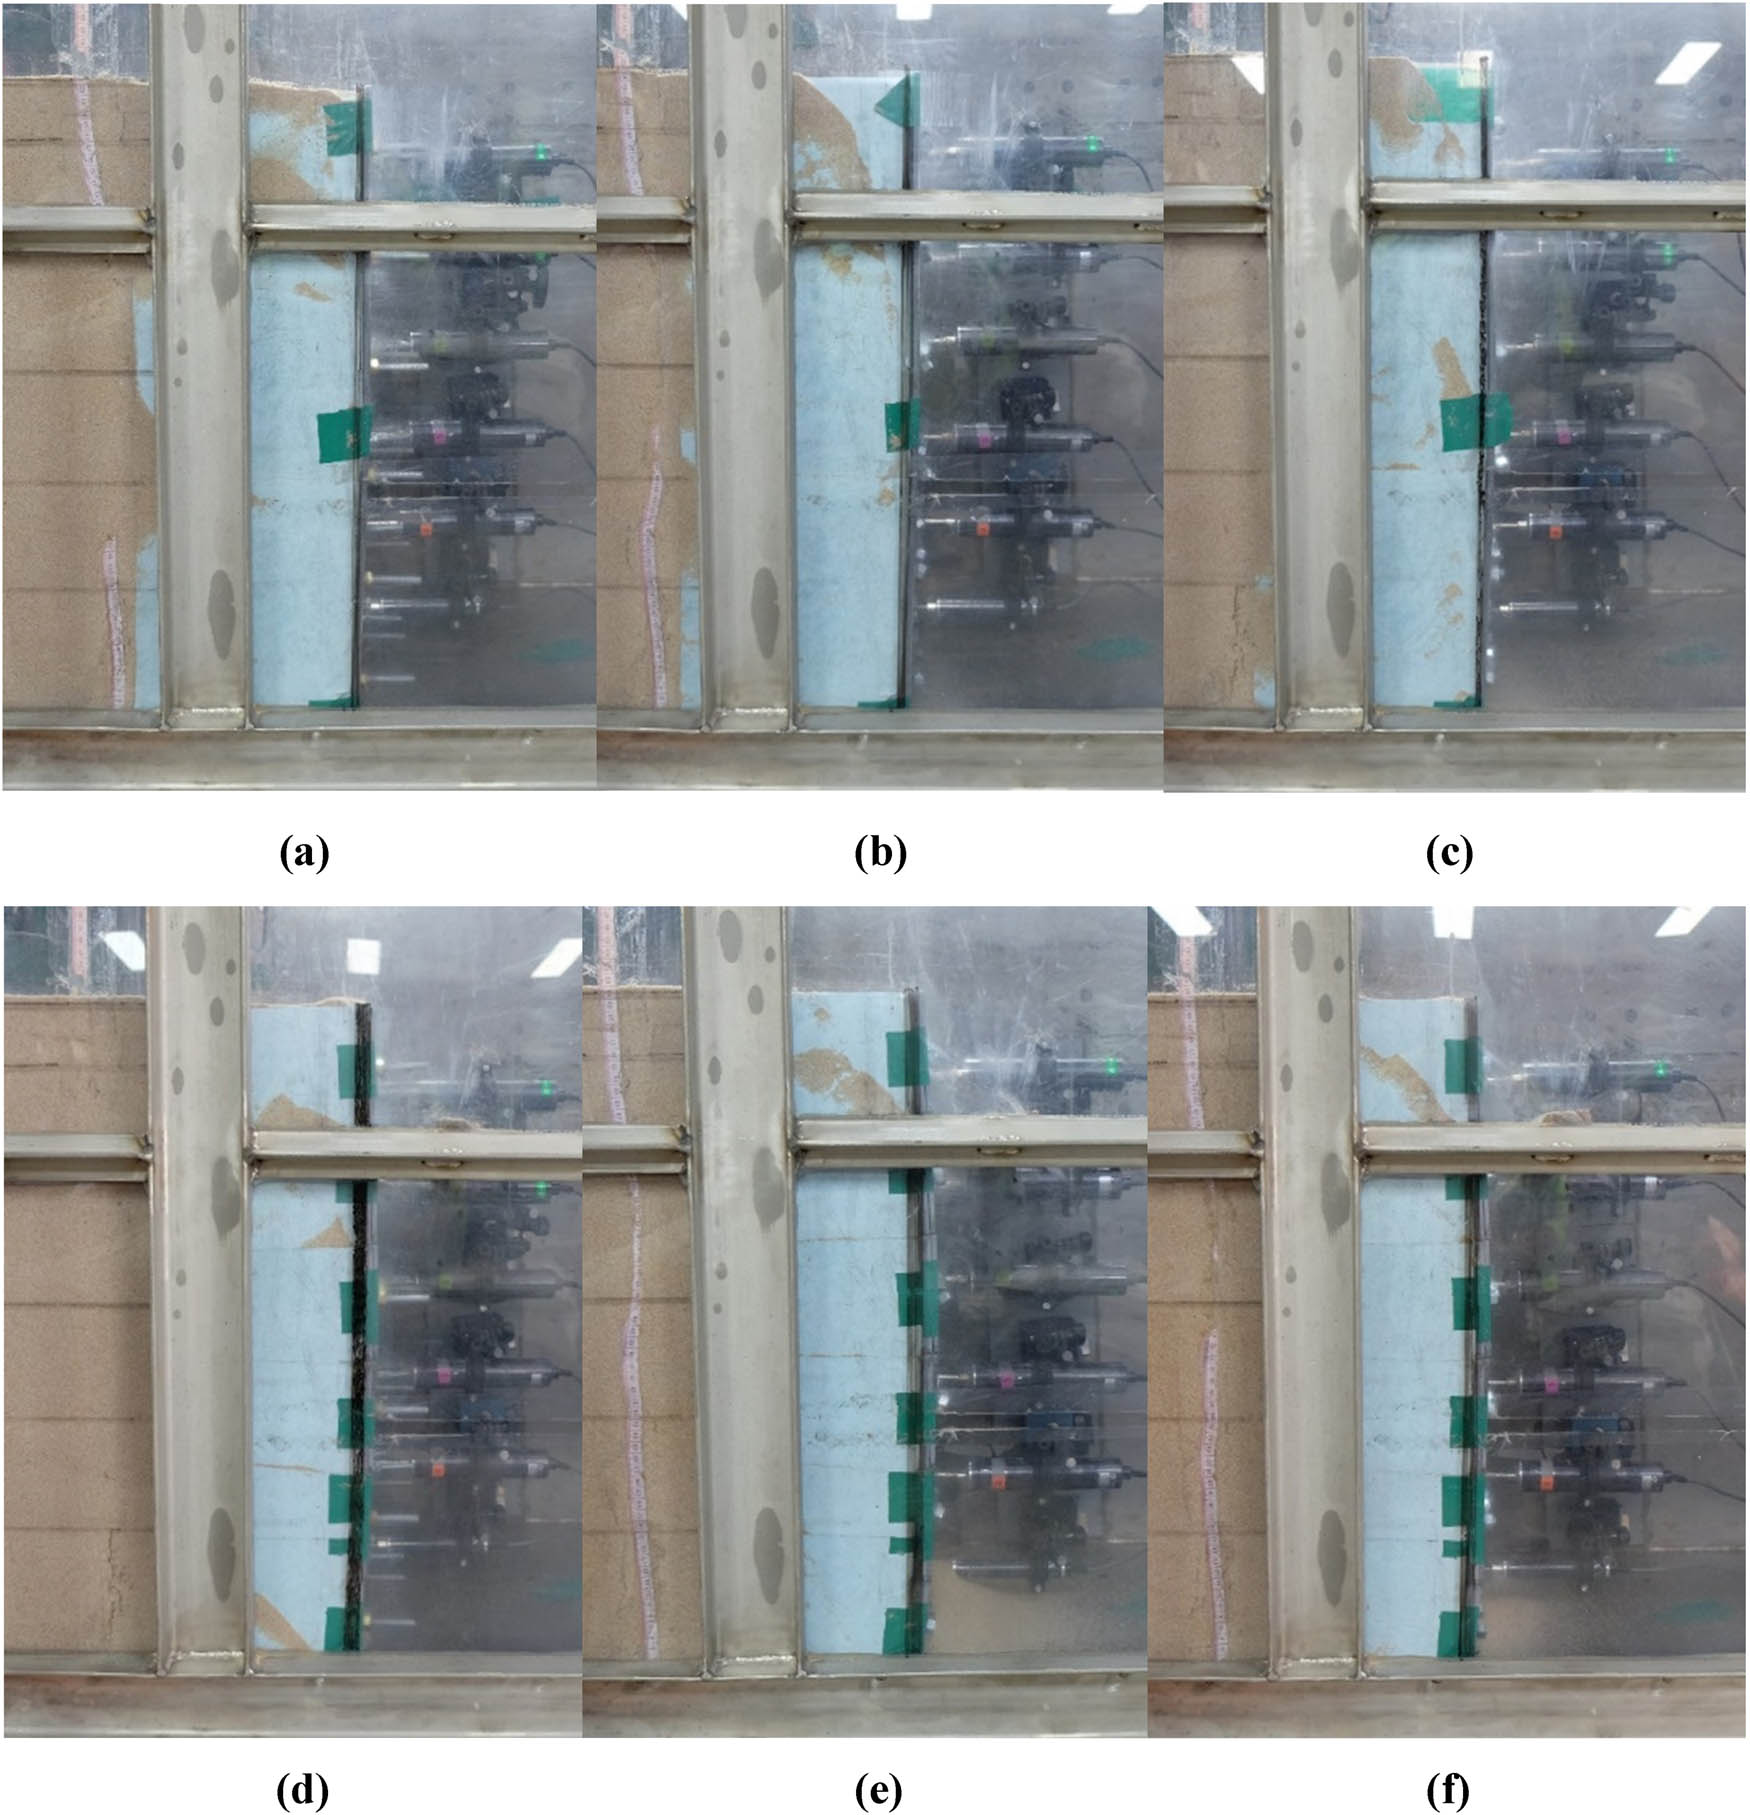
Photos of the final wall facing profile after the loading: (a) Case 1, (b) Case 2, (c) Case 3, (d) Case 4, (e) Case 5, and (f) Case 6.
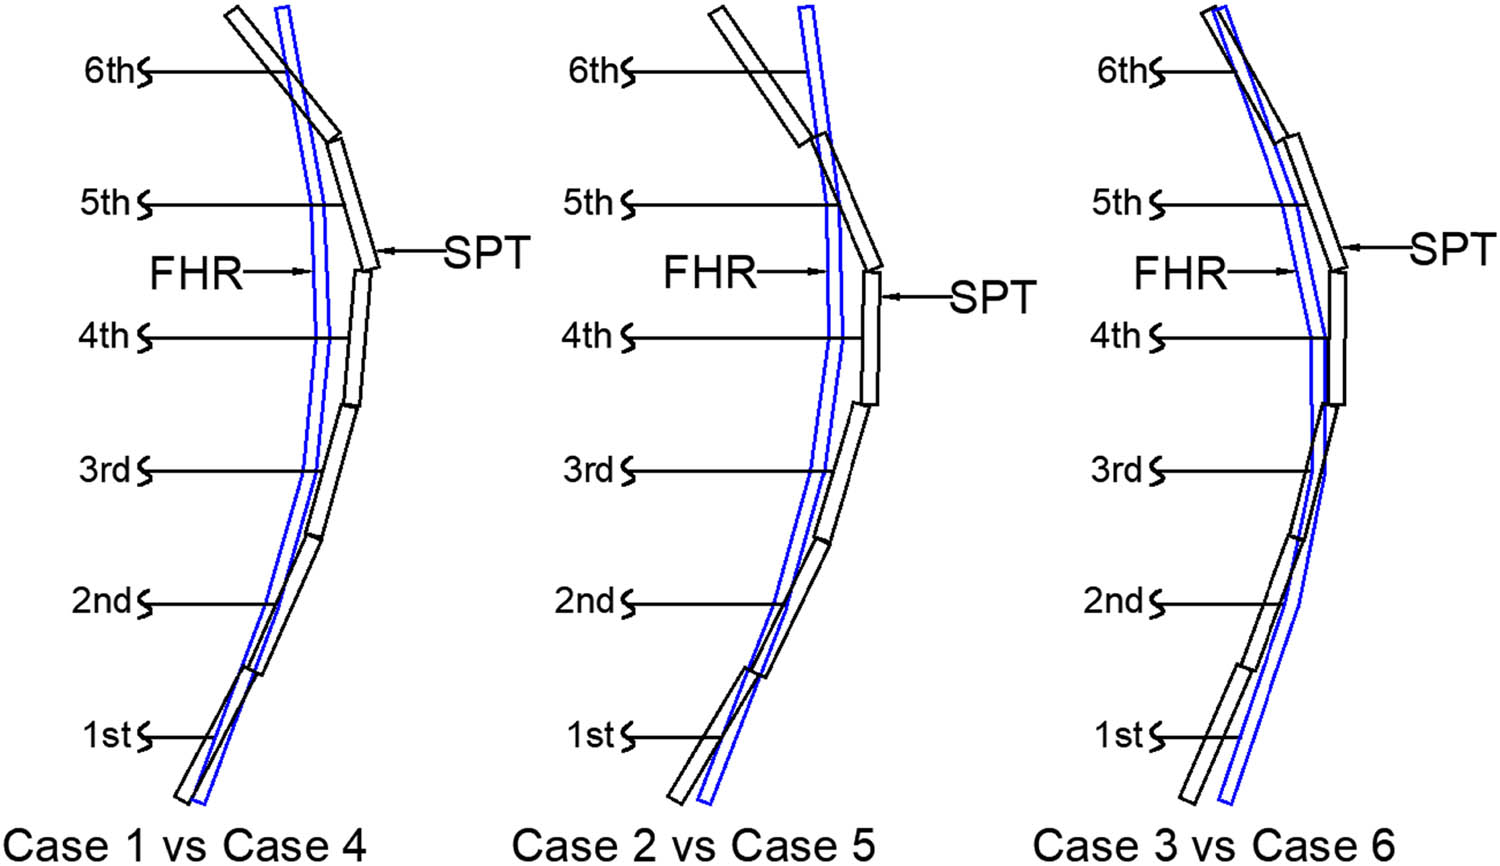
Sketch of the wall facing profile between full height rigid (FHR) facing and segmental panel-type (SPT) wall facing at 40 kN load.
5 Conclusion
The main conclusions drawn from the series of experimental analyses on six small-scale models of the MSE wall having FHR facing and SPT wall facing are as follows:
For the vertical displacement, the MSE wall model having FHR facing and discrete geogrids reinforcement showed higher load capacity compared to other models. At the beginning of the vertical displacement, the models with FHR facing showed a larger load than those of the models with SPT wall facing.
The MSE wall models using steel reinforcements generally exhibited the least lateral displacements at wall facing than those of the geosynthetic reinforcements. The MSE wall models using geo-strip reinforcements generally exhibited large lateral displacements at wall facing than other reinforcements.
Generally, the models with FHR facing exhibited lesser dx curves than the models with SPT wall facing. In addition, the maximum lateral displacements at wall facing occurred between 0.58 and 0.75H.
It was found that the lateral displacement at wall facing was more affected by the type of reinforcement and the type of wall facing used in the MSE wall compared to the vertical displacement.
Acknowledgment
This research was supported by Basic Science Research Program through the National Research Foundation of Korea (NRF) funded by the Ministry of Education (NRF2021R1A6A1A0304518511).
-
Conflict of interest: Authors state no conflict of interest.
References
[1] Shin EC, Cho SD, Lee KW. Case study of reinforced earth wall failure during extreme rainfall. Proceeding of TC302 Symposium Osaka 2011: International Symposium on Backwards Problem in Geotechnical Engineering and Monitoring of Geo-Construction; 2011. p. 146–53.Search in Google Scholar
[2] Tatsuoka F, Tateyama M, Uchimura T, Koseki J. Geosynthetic-reinforced soil retaining walls as important permanent structures. Geosynth Int. 1997;4(2):81–136.10.1680/gein.4.0090Search in Google Scholar
[3] Tatsuoka F, Tateyama M, Mohri Y, Matsushima K. Remedial treatment of soil structures using geosynthetics-reinforcing technology. Geotext Geomembr. 2007;25:204–20.10.1016/j.geotexmem.2007.02.002Search in Google Scholar
[4] Tatsuoka F, Tateyama M, Koseki J, Yonezawa T. Geosynthetic-reinforced soil structures for railways in Japan. Transp Infrastruct Geotechnol. 2014;1:3–53.10.3850/978-981-07-3559-3_101-0007Search in Google Scholar
[5] Koerner RM, Koerner GR. A data base, statistics and recommendations regarding 171 failed geosynthetic reinforced mechanically stabilized earth (MSE) walls. Geotext Geomembr. 2013;40:20–7.10.1016/j.geotexmem.2013.06.001Search in Google Scholar
[6] Koerner RM, Koerner GR. An extended data base and recommendations regarding 320 failed geosynthetic reinforced mechanically stabilized earth (MSE) walls. Geotext Geomembr. 2018;46:904–12.10.1016/j.geotexmem.2018.07.013Search in Google Scholar
[7] Holtz RD. 46th Terzaghi lecture: geosynthetic reinforced soil: from the experimental to the familiar. J Geotech Geoenviron Eng. 2017;143(9):03117001-1-21.10.1061/(ASCE)GT.1943-5606.0001674Search in Google Scholar
[8] Kibria G, Hossain S, Khan MS. Influence of soil reinforcement on horizontal displacement of MSE wall. Int J Geomech. 2014;14(1):130–41.10.1061/(ASCE)GM.1943-5622.0000297Search in Google Scholar
[9] Berg RR, Christopher BR, Samtani NC. Design of mechanically stabilized earth walls and reinforced soil slopes – volume I, FHWA-NHI-10-024 FHWA GEC 011-Vol I. Washington, DC: National Highway Institute, Federal Highway Administration, US Department of Transportation; 2009.Search in Google Scholar
[10] Das BM. Principles of foundation engineering, SI. 7th edn. Stamford, CT, USA: Cengage Learning; 2012.Search in Google Scholar
[11] Bilgin Ö, Mansour E. Effect of reinforcement type on the design reinforcement length of mechanically stabilized earth walls. Eng Struct. 2014;59:663–73.10.1016/j.engstruct.2013.11.013Search in Google Scholar
[12] Abdelouhab A, Dias D, Freitag N. Numerical analysis of the behavior of mechanically stabilized earth walls reinforced with different types of strips. Geotext Geomembr. 2011;29(2):116–29.10.1016/j.geotexmem.2010.10.011Search in Google Scholar
[13] Sadat MR, Huang J, Bin-Shafique S, Rezaeimalek S. Study of the behavior of mechanically stabilized earth (MSE) walls subjected to differential settlements. Geotext Geomembr. 2018;46:77–90.10.1016/j.geotexmem.2017.10.006Search in Google Scholar
[14] Won MS, Langcuyan CP. A 3D numerical analysis of the compaction effects on the behavior of panel-type MSE walls. Open Geosci. 2020;12:1704–24.10.1515/geo-2020-0192Search in Google Scholar
[15] Won MS. Effects of reinforcement on bearing capacity of loose sand foundation and deformation behavior of buried flexible pipes. J Test Eval. 2010;38(2):232–41.10.1520/JTE101627Search in Google Scholar
[16] Won MS, Langcuyan CP, Gao YC. A study on the utilization of clayey soil as embankment material through model bearing capacity tests. Appl Sci. 2020;10(7):2315.10.3390/app10072315Search in Google Scholar
© 2021 Myoung-Soo Won et al., published by De Gruyter
This work is licensed under the Creative Commons Attribution 4.0 International License.
Articles in the same Issue
- Regular Articles
- Lithopetrographic and geochemical features of the Saalian tills in the Szczerców outcrop (Poland) in various deformation settings
- Spatiotemporal change of land use for deceased in Beijing since the mid-twentieth century
- Geomorphological immaturity as a factor conditioning the dynamics of channel processes in Rządza River
- Modeling of dense well block point bar architecture based on geological vector information: A case study of the third member of Quantou Formation in Songliao Basin
- Predicting the gas resource potential in reservoir C-sand interval of Lower Goru Formation, Middle Indus Basin, Pakistan
- Study on the viscoelastic–viscoplastic model of layered siltstone using creep test and RBF neural network
- Assessment of Chlorophyll-a concentration from Sentinel-3 satellite images at the Mediterranean Sea using CMEMS open source in situ data
- Spatiotemporal evolution of single sandbodies controlled by allocyclicity and autocyclicity in the shallow-water braided river delta front of an open lacustrine basin
- Research and application of seismic porosity inversion method for carbonate reservoir based on Gassmann’s equation
- Impulse noise treatment in magnetotelluric inversion
- Application of multivariate regression on magnetic data to determine further drilling site for iron exploration
- Comparative application of photogrammetry, handmapping and android smartphone for geotechnical mapping and slope stability analysis
- Geochemistry of the black rock series of lower Cambrian Qiongzhusi Formation, SW Yangtze Block, China: Reconstruction of sedimentary and tectonic environments
- The timing of Barleik Formation and its implication for the Devonian tectonic evolution of Western Junggar, NW China
- Risk assessment of geological disasters in Nyingchi, Tibet
- Effect of microbial combination with organic fertilizer on Elymus dahuricus
- An OGC web service geospatial data semantic similarity model for improving geospatial service discovery
- Subsurface structure investigation of the United Arab Emirates using gravity data
- Shallow geophysical and hydrological investigations to identify groundwater contamination in Wadi Bani Malik dam area Jeddah, Saudi Arabia
- Consideration of hyperspectral data in intraspecific variation (spectrotaxonomy) in Prosopis juliflora (Sw.) DC, Saudi Arabia
- Characteristics and evaluation of the Upper Paleozoic source rocks in the Southern North China Basin
- Geospatial assessment of wetland soils for rice production in Ajibode using geospatial techniques
- Input/output inconsistencies of daily evapotranspiration conducted empirically using remote sensing data in arid environments
- Geotechnical profiling of a surface mine waste dump using 2D Wenner–Schlumberger configuration
- Forest cover assessment using remote-sensing techniques in Crete Island, Greece
- Stability of an abandoned siderite mine: A case study in northern Spain
- Assessment of the SWAT model in simulating watersheds in arid regions: Case study of the Yarmouk River Basin (Jordan)
- The spatial distribution characteristics of Nb–Ta of mafic rocks in subduction zones
- Comparison of hydrological model ensemble forecasting based on multiple members and ensemble methods
- Extraction of fractional vegetation cover in arid desert area based on Chinese GF-6 satellite
- Detection and modeling of soil salinity variations in arid lands using remote sensing data
- Monitoring and simulating the distribution of phytoplankton in constructed wetlands based on SPOT 6 images
- Is there an equality in the spatial distribution of urban vitality: A case study of Wuhan in China
- Considering the geological significance in data preprocessing and improving the prediction accuracy of hot springs by deep learning
- Comparing LiDAR and SfM digital surface models for three land cover types
- East Asian monsoon during the past 10,000 years recorded by grain size of Yangtze River delta
- Influence of diagenetic features on petrophysical properties of fine-grained rocks of Oligocene strata in the Lower Indus Basin, Pakistan
- Impact of wall movements on the location of passive Earth thrust
- Ecological risk assessment of toxic metal pollution in the industrial zone on the northern slope of the East Tianshan Mountains in Xinjiang, NW China
- Seasonal color matching method of ornamental plants in urban landscape construction
- Influence of interbedded rock association and fracture characteristics on gas accumulation in the lower Silurian Shiniulan formation, Northern Guizhou Province
- Spatiotemporal variation in groundwater level within the Manas River Basin, Northwest China: Relative impacts of natural and human factors
- GIS and geographical analysis of the main harbors in the world
- Laboratory test and numerical simulation of composite geomembrane leakage in plain reservoir
- Structural deformation characteristics of the Lower Yangtze area in South China and its structural physical simulation experiments
- Analysis on vegetation cover changes and the driving factors in the mid-lower reaches of Hanjiang River Basin between 2001 and 2015
- Extraction of road boundary from MLS data using laser scanner ground trajectory
- Research on the improvement of single tree segmentation algorithm based on airborne LiDAR point cloud
- Research on the conservation and sustainable development strategies of modern historical heritage in the Dabie Mountains based on GIS
- Cenozoic paleostress field of tectonic evolution in Qaidam Basin, northern Tibet
- Sedimentary facies, stratigraphy, and depositional environments of the Ecca Group, Karoo Supergroup in the Eastern Cape Province of South Africa
- Water deep mapping from HJ-1B satellite data by a deep network model in the sea area of Pearl River Estuary, China
- Identifying the density of grassland fire points with kernel density estimation based on spatial distribution characteristics
- A machine learning-driven stochastic simulation of underground sulfide distribution with multiple constraints
- Origin of the low-medium temperature hot springs around Nanjing, China
- LCBRG: A lane-level road cluster mining algorithm with bidirectional region growing
- Constructing 3D geological models based on large-scale geological maps
- Crops planting structure and karst rocky desertification analysis by Sentinel-1 data
- Physical, geochemical, and clay mineralogical properties of unstable soil slopes in the Cameron Highlands
- Estimation of total groundwater reserves and delineation of weathered/fault zones for aquifer potential: A case study from the Federal District of Brazil
- Characteristic and paleoenvironment significance of microbially induced sedimentary structures (MISS) in terrestrial facies across P-T boundary in Western Henan Province, North China
- Experimental study on the behavior of MSE wall having full-height rigid facing and segmental panel-type wall facing
- Prediction of total landslide volume in watershed scale under rainfall events using a probability model
- Toward rainfall prediction by machine learning in Perfume River Basin, Thua Thien Hue Province, Vietnam
- A PLSR model to predict soil salinity using Sentinel-2 MSI data
- Compressive strength and thermal properties of sand–bentonite mixture
- Age of the lower Cambrian Vanadium deposit, East Guizhou, South China: Evidences from age of tuff and carbon isotope analysis along the Bagong section
- Identification and logging evaluation of poor reservoirs in X Oilfield
- Geothermal resource potential assessment of Erdaobaihe, Changbaishan volcanic field: Constraints from geophysics
- Geochemical and petrographic characteristics of sediments along the transboundary (Kenya–Tanzania) Umba River as indicators of provenance and weathering
- Production of a homogeneous seismic catalog based on machine learning for northeast Egypt
- Analysis of transport path and source distribution of winter air pollution in Shenyang
- Triaxial creep tests of glacitectonically disturbed stiff clay – structural, strength, and slope stability aspects
- Effect of groundwater fluctuation, construction, and retaining system on slope stability of Avas Hill in Hungary
- Spatial modeling of ground subsidence susceptibility along Al-Shamal train pathway in Saudi Arabia
- Pore throat characteristics of tight reservoirs by a combined mercury method: A case study of the member 2 of Xujiahe Formation in Yingshan gasfield, North Sichuan Basin
- Geochemistry of the mudrocks and sandstones from the Bredasdorp Basin, offshore South Africa: Implications for tectonic provenance and paleoweathering
- Apriori association rule and K-means clustering algorithms for interpretation of pre-event landslide areas and landslide inventory mapping
- Lithology classification of volcanic rocks based on conventional logging data of machine learning: A case study of the eastern depression of Liaohe oil field
- Sequence stratigraphy and coal accumulation model of the Taiyuan Formation in the Tashan Mine, Datong Basin, China
- Influence of thick soft superficial layers of seabed on ground motion and its treatment suggestions for site response analysis
- Monitoring the spatiotemporal dynamics of surface water body of the Xiaolangdi Reservoir using Landsat-5/7/8 imagery and Google Earth Engine
- Research on the traditional zoning, evolution, and integrated conservation of village cultural landscapes based on “production-living-ecology spaces” – A case study of villages in Meicheng, Guangdong, China
- A prediction method for water enrichment in aquifer based on GIS and coupled AHP–entropy model
- Earthflow reactivation assessment by multichannel analysis of surface waves and electrical resistivity tomography: A case study
- Geologic structures associated with gold mineralization in the Kirk Range area in Southern Malawi
- Research on the impact of expressway on its peripheral land use in Hunan Province, China
- Concentrations of heavy metals in PM2.5 and health risk assessment around Chinese New Year in Dalian, China
- Origin of carbonate cements in deep sandstone reservoirs and its significance for hydrocarbon indication: A case of Shahejie Formation in Dongying Sag
- Coupling the K-nearest neighbors and locally weighted linear regression with ensemble Kalman filter for data-driven data assimilation
- Multihazard susceptibility assessment: A case study – Municipality of Štrpce (Southern Serbia)
- A full-view scenario model for urban waterlogging response in a big data environment
- Elemental geochemistry of the Middle Jurassic shales in the northern Qaidam Basin, northwestern China: Constraints for tectonics and paleoclimate
- Geometric similarity of the twin collapsed glaciers in the west Tibet
- Improved gas sand facies classification and enhanced reservoir description based on calibrated rock physics modelling: A case study
- Utilization of dolerite waste powder for improving geotechnical parameters of compacted clay soil
- Geochemical characterization of the source rock intervals, Beni-Suef Basin, West Nile Valley, Egypt
- Satellite-based evaluation of temporal change in cultivated land in Southern Punjab (Multan region) through dynamics of vegetation and land surface temperature
- Ground motion of the Ms7.0 Jiuzhaigou earthquake
- Shale types and sedimentary environments of the Upper Ordovician Wufeng Formation-Member 1 of the Lower Silurian Longmaxi Formation in western Hubei Province, China
- An era of Sentinels in flood management: Potential of Sentinel-1, -2, and -3 satellites for effective flood management
- Water quality assessment and spatial–temporal variation analysis in Erhai lake, southwest China
- Dynamic analysis of particulate pollution in haze in Harbin city, Northeast China
- Comparison of statistical and analytical hierarchy process methods on flood susceptibility mapping: In a case study of the Lake Tana sub-basin in northwestern Ethiopia
- Performance comparison of the wavenumber and spatial domain techniques for mapping basement reliefs from gravity data
- Spatiotemporal evolution of ecological environment quality in arid areas based on the remote sensing ecological distance index: A case study of Yuyang district in Yulin city, China
- Petrogenesis and tectonic significance of the Mengjiaping beschtauite in the southern Taihang mountains
- Review Articles
- The significance of scanning electron microscopy (SEM) analysis on the microstructure of improved clay: An overview
- A review of some nonexplosive alternative methods to conventional rock blasting
- Retrieval of digital elevation models from Sentinel-1 radar data – open applications, techniques, and limitations
- A review of genetic classification and characteristics of soil cracks
- Potential CO2 forcing and Asian summer monsoon precipitation trends during the last 2,000 years
- Erratum
- Erratum to “Calibration of the depth invariant algorithm to monitor the tidal action of Rabigh City at the Red Sea Coast, Saudi Arabia”
- Rapid Communication
- Individual tree detection using UAV-lidar and UAV-SfM data: A tutorial for beginners
- Technical Note
- Construction and application of the 3D geo-hazard monitoring and early warning platform
- Enhancing the success of new dams implantation under semi-arid climate, based on a multicriteria analysis approach: Case of Marrakech region (Central Morocco)
- TRANSFORMATION OF TRADITIONAL CULTURAL LANDSCAPES - Koper 2019
- The “changing actor” and the transformation of landscapes