Comparative application of photogrammetry, handmapping and android smartphone for geotechnical mapping and slope stability analysis
-
Jabulani Matsimbe


Abstract
With increasing awareness of geotechnical risks in civil and mining structures, taking advantage of smartphone technology to study rocky slopes can play a key role in the development of safe and economical structures for human welfare. In Malawi, there is a research gap on application of portable devices to collect geotechnical data. Geological engineers still use the unsafe tedious handmapping technique to collect geotechnical data. A road cut that experiences frequent rockfall is used as a case study to investigate if there is a role for smartphones in geotechnics by comparing set statistics of data clusters collected through photogrammetry, smartphone and clar inclinometer. Besides low cost, smartphone’ data capture speed is faster than clar inclinometer. Stereographic and kinematic analysis shows that the 75° dipping road cut is predominantly prone to wedge failure with minor planar failure. For slope stability, Q-slope suggests a new slope angle of 60–66°. An acceptable tolerance limit or error between handmapping and remote data capture systems should be less than ±15°. Set analysis on 111 comparable data points gave a maximum pole vector difference of 10.5°, with the minimum having a difference of 4.8°. For dip, the standard deviations vary from 4.9 to 9.5°, while their mean values vary from −2 to 2.75°. For dip directions, the standard deviations vary from 3.2 to 4.3°, while their mean values vary from −6 to 0.75°. Therefore, android smartphones have a role in geotechnics due to their allowable orientation errors, which show less variance in measured dip/dip direction.
1 Introduction
A good understanding of rockmass structure forms the basis of rock mass classification, which is used in the majority of geomechanics [1]. Structural and mechanical analyses of rock masses using different mapping methods provide input data required for end-use applications such as design of surface excavations or slope stability assessments [2]. A rock mass is described as an intact rock separated by discontinuities. According to ref. [3], slope stability in surface excavations is principally a function of the structural discontinuities within the rock mass, and not the strength of the intact rock, requiring a detailed knowledge of the effect of discontinuities on the rock mass. Modern measuring technologies give the means to perform tasks previously impossible with conventional methods. Their main advantages include reduced time consumption and higher measurement precision [4]. With three-dimensional (3D) laser scan surveys, a dense point cloud is generated that represents the geometry of the scanned rock face in very high detail [5]. Nowadays, the advent of new technologies has led to step-change increase in the quality of data available for the study of rock slopes, and these include new remote sensing sensors, platforms, new techniques and software for engineering rock mass analyses [6,7]. With the advancements in artificial intelligence methods and utilization of Citizen Science (CitSci), the collection and classification of geodata from big datasets have become relatively easier thereby filling the gaps in the landslide hazard assessment process [8,9]. In Malawi, smartphone technology is rarely used in geotechnical mapping despite facing a lot of slope failures in surface excavations, which affect the safety of the people and their economic well-being as the roads become inaccessible. For example, slope failures and rock falls along the Blantyre–Chikwawa road provide a challenge for road users to conduct their businesses. Little or no knowledge exists on the usage of portable devices such as smartphones for geotechnical mapping in Malawi. Most research has been toward understanding the geology and mineralization of rocks in Malawi [10]. Thus, in order to assess the possibility of using smartphones as a reliable tool for rockmass classification and slope stability analysis, this research comparatively applied photogrammetry, handmapping and android smartphone to gather input data for end-use purposes. Figure 1 gives an illustration of the geotechnical properties observed on site and the tools for collecting the geotechnical data. It is expected that the results from present study will promote the use of simple to use portable smartphones in geotechnical engineering. These gadgets are readily available and affordable to a lot of people or companies. In addition, the University curricula will be revised to incorporate smartphone technology in engineering projects.

Geotechnical mapping flow chart with different mapping tools.
Therefore, this article presents the findings on the comparative application of hand mapping, digital terrestrial photogrammetry and smartphone at a road cut, to remotely acquire discontinuity orientation data and their subsequent use in Photoscan to create a three-dimensional (3D) image, which is imported into SplitFX and Dips for kinematic analysis. In addition, the collected data are used to quantify the rockmass based on the rock mass rating (RMR), geological strength index (GSI), Q-system and Q-slope value. Close-range terrestrial digital photogrammetry is commonly used to capture faces of objects not more than 300 m away from the camera [11,12]. In addition, refs [13,14,2,15] have highlighted the accuracy and potential of photogrammetric techniques.
RMR is a geomechanical classification system for rocks, which gives an index value based on uniaxial compressive strength of rock, rock quality designation (RQD), spacing of discontinuities, condition of discontinuities, groundwater conditions and orientation of discontinuities [16]. The GSI is used for the estimation of the rock mass strength and the rock mass deformation modulus based on the rock structure and block surface conditions [17]. Q-slope is an empirical rock slope engineering method for assessing the stability of excavated rock slopes and is intended for use in reinforcement-free site access road cuts, roads or railway cuttings or individual benches in open cast mines [18]. Q-slope utilizes similar parameters to the Q-system, which has been used for over 40 years in the design of ground support for tunnels and underground excavations in the field.
2 Methodology
Figures 2 and 3 show the location of the study area along the Blantyre–Chikwawa road at Latitude −15.953781° and Longitude 34.922827°. The granitic rock face has a blocky structure with well-defined joint sets. The geology of Malawi is part of Kibaran orogeny formed through continental collision that constructed Rodinia as known in Africa [27]. Malawi is primarily composed of Archean and Paleoproterozoic (Ubendian) terrain, which is dominated by the Basement Complex rocks later overlain by Karoo sedentary rocks and intruded by basaltic/dolerite dykes and sills. The Permo–Triassic period was later followed by Upper Jurassic–Lower Cretaceous period, which saw the intrusion of syeno-granitic and nepheline syenite rocks later intruded by volcanic rocks infilled by carbonatite and alkaline dykes. As shown in Figure 4, the Southern part of Malawi is dominated by these rocks and has been grouped as Chilwa Alkaline Province. The same period saw sedimentary deposition characterized by Dinosaur Beds. The aforementioned rocks have been overlain by Tertiary–Pleistocene rocks characterized by consolidated to semiconsolidated beds grouped into Timbiri, Chiwondo, Chitimwe and Alluvial. Minor volcanic activities have been witnessed through the existence of Songwe Volcanics [27]. The study area was chosen because it experiences frequent slope failures and rock falls, which affect economic activities between Blantyre and Chikwawa. In addition, due to its unique geomorphological landscape locally known as Kamuzu View, the area is a popular picnic and entertainment centre.

Location of the study area along Blantyre–Chikwawa road near Kamuzu view.

Location of study site on a Malawi map (shown by a red star).
![Figure 4
Geology of Malawi [27].](/document/doi/10.1515/geo-2020-0213/asset/graphic/j_geo-2020-0213_fig_004.jpg)
Geology of Malawi [27].
In order to characterize the rock mass, handmapping was used first, followed by smartphone and finally photogrammetry. The various tools that allowed input data collection are outlined.
2.1 Photogrammetry
Photogrammetric technique required the use of a Nikon D100/Nikon SLR digital camera to take photographs and Agisoft Photoscan/Visual SfM software to create a 3D image point cloud. Photoscan is a photogrammetric program, which matches points between photographs to recreate a mesh in 3D. The software uses Structure from Motion (SfM) and dense multi-view 3D reconstruction algorithms to generate 3D point clouds of an object from a collection of arbitrary taken still images [15]. As most conventional photogrammetric techniques require the coordinates and orientation of the cameras or ground control points (GCPs) to be known to facilitate scene triangulation and reconstruction, the SfM method solves the camera position and scene geometry simultaneously and automatically, using a highly redundant bundle adjustment based on matching features from a set of multiple overlapping images [19,20]. Figure 5 shows an SfM workflow, and Figure 6 shows the delineated 3D image of the study area.
![Figure 5
From photograph to point cloud: SfM workflow [20].](/document/doi/10.1515/geo-2020-0213/asset/graphic/j_geo-2020-0213_fig_005.jpg)
From photograph to point cloud: SfM workflow [20].
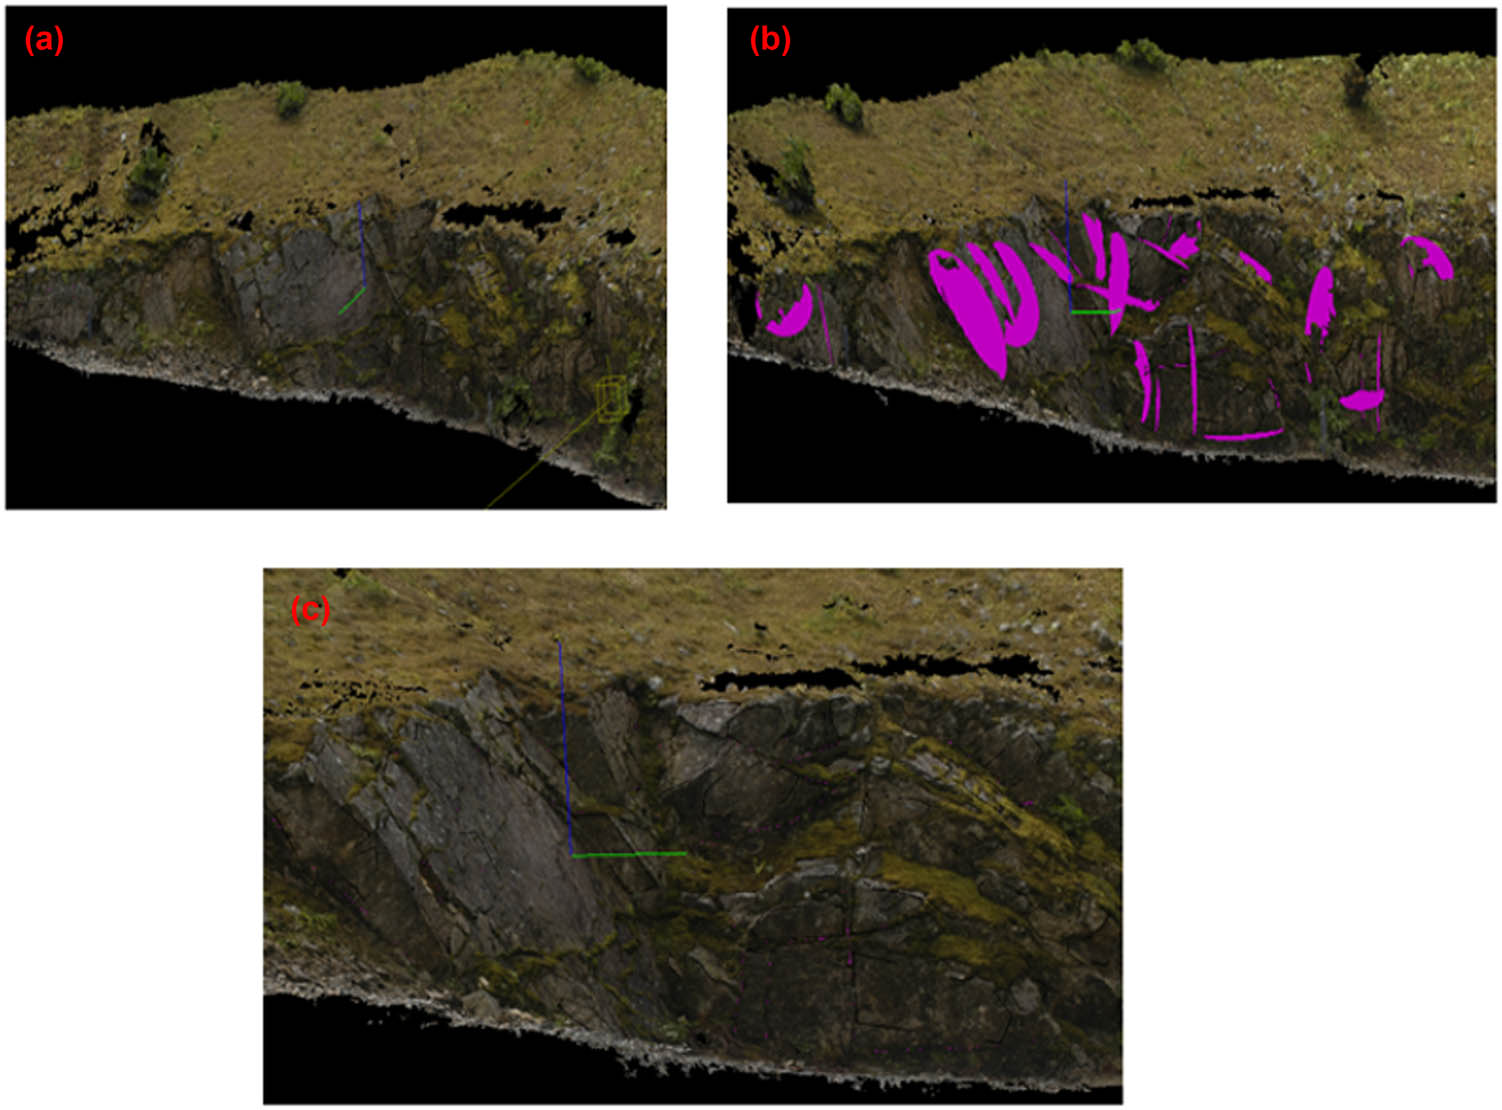
Point cloud 3D image (a) created by photoscan; and delineated in SplitFx showing traces in purple (b); and patches in black (c).
2.1.1 3D image and point cloud creation
First, 12 digital images of the rock face were captured from a distance of about 5–10 m using a Nikon camera. In the field, particular attention was taken to maximize overlap by using short camera baselines to obtain well-exposed photographs and uniform coverage of the discontinuities.
The 3D reconstruction pipeline used in Agisoft Photoscan estimates camera calibration parameters automatically utilizing Brown’s model for lens distortion removing the need for manual calibration if standard optical lenses and highly redundant image networks are used. For scale and georeferencing, GCPs were added through manual selection, i.e. by adding orientation of a feature on the rock face in each image within the photo set. The alignment process iteratively refines the external and internal camera orientations and camera locations through a least squares solution and builds a sparse 3D point cloud model. Photoscan analyses the source images by detecting stable points and generating descriptors based on the surrounding points [19].
2.1.2 SplitFx processing
The photogrammetric 3D image and point cloud are imported into SplitFx software for manual delineation of discontinuities by inserting either planes or traces (Figure 6). The computer mouse is used to select a polygon shape of discontinuities on the point cloud and the SplitFx program identifies the triangle points within the plane to calculate the dip and dip direction of the best fit plane running through the points. Plane recognition is described as a patch in SplitFx software [21]. Similarly, discontinuity traces were identified by manually selecting points along the line of the linear feature and then SplitFx uses the 3D spatial of the selected points to calculate the dip and dip direction. According to ref. [2], orientations of features taken from discontinuity traces are not as accurate as measurements taken from discontinuities represented as planes; therefore, orientations from discontinuity traces were used with care and patch recognition was mostly used to capture orientation data.
2.2 Smartphone (Samsung Galaxy S7)
Through the review of available websites and articles that have considered the use of portable geotechnics [22], several applications that are possible to use in direct or indirect way for geotechnical investigations were applied in geotechnical mapping to compare effectiveness in practice to traditional use of clar compass clinometer and photogrammetry at a road cut. In addition, rockmass classification (RMR and Q) was done using the android application in situ. This research used Samsung Galaxy S7 for application testing and reviewing.
2.2.1 Data capture
The phone’s accelerometer, gyroscope and magnetometer were utilized to collect discontinuity orientation data and create reports in situ. Accelerometer detects the orientation of the phone, while the gyroscope tracks the rotation or twist from the information supplied by the accelerometer. The magnetometer provides orientation in relation to the Earth’s magnetic field. First, the phone’s magnetometer and orientation sensor had to be calibrated by setting both the clar compass and smartphone compass to a reference plane, typically true north, i.e. laying them on a level surface until they gave a similar orientation reading. Additionally, the smartphone’s calibration was done by waving the phone in a Figure 8 pattern [23]. Two different geological compass applications (Rock Logger and Geostation) installed on the Samsung Galaxy S7 smartphone were tested.
2.2.1.1 Geostation
This geomechanical station application measures the dip, dip direction and strike of discontinuity sets using the smartphone as a compass clinometer. In addition, geomechanical classification by the RMR and the Q-system is indicated (Figure 7). The project list was empty at the start of the project, so first, a project was created using the Add New button. Then, dip/dip direction was measured, using the smartphone’s compass clinometer high fidelity sensors by placing the smartphone on the joint plane and then pressing Add Disc relocating the device for each structure along the discontinuity.

Geostation screenshot.
2.2.1.2 Rocklogger
Rocklogger is a geological/geotechnical tool for measuring the orientation of rock outcrops and plotting a stereonet. It uses the phone’s compass and orientation sensors to measure dip and dip direction, or dip and strike, in a single click. GPS and magnetic field information is also saved, along with details on the rock plane and type (Figure 8). After measuring the dip/dip direction with a clar compass clinometer, the same scanline was mapped using rocklogger to measure the dip/dip direction. Care was taken to map similar discontinuities to the clar compass to obtain a better platform for comparison of orientation data. The app took advantage of the smartphone’s compass and orientation sensors higher update speed to measure the dip/dip direction. The smartphone calculates the steepest angle for the dip and uses the direction to calculate the new dip direction.

Rocklogger screenshot.
Normal (planar) orientation mode was used instead of axial orientation mode to log and define plane types. In the planar mode, angle readings are similar whether the phone is oriented screen down or screen up. This allowed underside of rocks to be measured. Azimuth mode was used instead of Quadrant mode to ensure the consistency of orientation data and further use in Dips Rocscience software.
2.2.1.3 Geocam Ar
Geocam Ar is a powerful camera and reporting tool designed to create and preview photos supplied with geospatial information such as geographic coordinates, camera orientation and comments. This app was used to get georeferenced images and view direction (azimuth) of the mapped section, thereby keeping accurate track of mapped faces. The app took advantage of the Galaxy S7 powerful rear camera (12 megapixel) to capture road cut slope details (Figure 9).

Georeferenced image of road cut looking South West.
2.3 Handmapping
Initially, the granite rock mass was handmapped using a clar compass clinometer to get the dip/dip direction. A clean planar rock face (Figure 10) was selected that is large relative to the size and spacing of the discontinuities exposed. Intersections between discontinuities and the rock face produced linear traces, which provided an essentially 2D sample of the discontinuity network. The 25 m long scanline comprised of a measuring tape pinned to the rock face (often irregular) along its strike and line of maximum dip. The location, orientation and condition of the discontinuities along the scanline were recorded in a booking sheet. Digital photographs were also used together with hand mapping to capture common features for easy identification.

Scanline set up on the road cut face. Hammer for scale (33 cm).
3 Results
3.1 Stereographic analysis
3.1.1 Handmapping (clar compass)
During the geotechnical site investigation, 111 discontinuity measurements were made along the 25 m scanline, which took 6 h to finish. The discontinuity data were analysed using DIPS 7.0 software. The results are summarized in Table 1 and Figure 11.
Summary of joint set characteristics
| Set | Type | Dip (°) | Dip direction (°) | No. of poles | Fisher K | Average spacing (m) | Description |
|---|---|---|---|---|---|---|---|
| 1 | Joint | 80 | 321 | 28 | 50.702 | 0.31 | Rough and irregular undulating joints with moderately weathered surfaces |
| 2 | Joint | 87 | 198 | 34 | 39.392 | 0.34 | As 1 |
| 3 | Joint | 75 | 266 | 15 | 25.5619 | 0.43 | As 1, but occurring only randomly |
| 4 | Joint | 40 | 021 | 23 | 14.7797 | 0.27 | As 1, but occurring only randomly |

Lower hemisphere stereonet showing set analysis on hand mapped data.
Sets 1 and 2 are the main sets, while sets 3 and 4 are random. Joint sets 1 and 2 are characterized by steeply inclined planes with joint spacing ranging between 200 and 600 mm, while joint sets 3 and 4 are characterized by sub-vertical and sub-horizontal orientation, respectively.
Sets 1 and 2 represent a tighter cluster due to larger Fisher K values of 51 and 39, respectively, while sets 3 and 4 have a more dispersed cluster due to smaller Fisher K values of 26 and 15, respectively.
The Fisher K value describes the tightness or dispersion of an orientation cluster [24]. These K values have been estimated using probabilistic analysis for Fisher statistical distribution in Dips RocScience software.
3.1.2 Photogrammetry
Dips software was used to visualize the feature orientation identified in SplitFx. Table 2 shows the dip/dip direction and Fisher K of joint sets, and Figure 12 shows a stereonet of the joint sets for easy visualization of density concentration.
Summary of joint set characteristics
| Set | Type | Dip (°) | Dip direction (°) | No. of poles | Fisher K |
|---|---|---|---|---|---|
| 1 | Joint | 73 | 329 | 36 | 69.5 |
| 2 | Joint | 90 | 207 | 35 | 39.2 |
| 3 | Joint | 61 | 268 | 9 | 35.4 |
| 4 | Joint | 47 | 026 | 13 | 22.2 |

Lower hemisphere stereonet showing set analysis on photogrammetric captured data.
3.1.3 Smartphone
During the geotechnical site investigation, 111 discontinuity measurements were made along the 25 m scanline, which took 2 h to finish. The discontinuity data were analysed using DIPS 7.0 software. The results are summarized in Table 3 for Geostation and Table 4 for Rocklogger.
Summary of joint set characteristics
| Set | Type | Dip (°) | Dip direction (°) | No. of poles | Fisher K |
|---|---|---|---|---|---|
| 1 | Joint | 82 | 323 | 30 | 62.274 |
| 2 | Joint | 86 | 195 | 28 | 39.5258 |
| 3 | Joint | 73 | 269 | 18 | 34.423 |
| 4 | Joint | 49 | 027 | 11 | 17.195 |
Summary of joint set characteristics
| Set | Type | Dip (°) | Dip direction (°) | No. of poles | Fisher K |
|---|---|---|---|---|---|
| 1 | Joint | 81 | 322 | 29 | 60.5444 |
| 2 | Joint | 89 | 202 | 39 | 38.9822 |
| 3 | Joint | 71 | 264 | 11 | 32.2718 |
| 4 | Joint | 48 | 027 | 15 | 20.59 |
3.1.3.1 Geostation
The orientation data collected using this application were input into dips software to get joint sets (Figure 13) and set statistics (Table 3) for comparison with the other mapping techniques. Set window intervals were done in similar manner to the data from other techniques.

Lower hemisphere stereonet showing set analysis on smartphone captured data using Geostation.
Sets 1 and 2 represent a tighter cluster due to a larger Fisher K value of 62 and 40, respectively. Sets 3 and 4 have a more dispersed cluster due to smaller Fisher K values of 34 and 17, respectively.
3.1.3.2 Rocklogger
Similarly, the orientation data collected using rocklogger were input into dips software to get joint sets and set statistics.
Set 1 represents a tighter cluster due to a larger Fisher K value of 61, while set 4 has a more dispersed cluster due to a smaller Fisher K value of 21.
3.1.3.3 RMR and Q value
The Geostation app also calculates the RMR and Q value based on the input values. The obtained RMR (65) classifies the rock as a good rock (Table 5). This closely agrees with the RMR76 and GSI rating of 60 based on Q′ in Table 13. The Q value (10.3) from the app slightly varies but the rating puts the rock in the fair to good rock category, which is reasonably similar. Hence, the app can be used right in the field and for quick preliminary rock mass analysis saving the trouble of using the RMR and Q tables.
Rock mass classification of road cut
| (a) Classification parameters and ratings | ||
|---|---|---|
| Parameter | Values | Rating |
| Strength | ||
| Uniaxial compressive strength | 50–100 MPa | 7 |
| Point load strength index | 2–4 MPa | |
| Drill core Quality RQD | 50–75% | 13 |
| Discontinuities | ||
| Spacing of discontinuities | 200–600 mm | 10 |
| Discontinuity length (persistence) | 1–3 m | 4 |
| Separation (aperture) | 0.1–1.0 mm | 4 |
| Roughness | Slightly rough | 3 |
| Infilling (gouge) | None | 6 |
| Weathering | Moderately weathered | 3 |
| Groundwater | 15 | |
| Inflow per 10 m tunnel length | None | |
| Joint water pressure (major principal stress) | 0 | |
| (b) Adjustment for discontinuity orientations | ||
|---|---|---|
| Applied to: | Slopes | |
| Strike and dip orientations | Very favourable | 0 |
| Obtained RMR value | 65 | |
| (c) Rockmass classes determined | |
|---|---|
| Class number | II |
| Description | Good rock |
| Average stand-up time (tunnel face) | 1 year for 10 m span |
| Cohesion of rockmass | 300–400 kPa |
| Friction angle of rockmass | 35–45° |
| Modulus of deformation Em | 30 GPa |
3.2 Set analysis (handmapping, photogrammetry and smartphone)
Orientation data collected from handmapping are compared to the photogrammetric and smartphone data as shown in Tables 6–9. The dip and dip direction recorded by handmapping were used as the reference orientation of each identified plane, so that any differences derived by the other methods were measured as errors or variations in orientation. Four comparable joint sets were identified.
Dip/dip direction of joints measured with a clar compass and various smartphone applications (diff – difference between clar and application in red ink)
| Set | Handmapping (Clar) (Dip/dip dir) | Photogrammetry (diff) | Geostation (diff) | Rocklogger (diff) | |||
|---|---|---|---|---|---|---|---|
| 1 | 80/321 | 73/329 |
 |
82/323 |
 |
81/322 |
 |
| 2 | 87/198 | 90/207 |
 |
86/195 |
 |
89/202 |
 |
| 3 | 75/266 | 61/268 |
 |
73/269 |
 |
71/264 |
 |
| 4 | 40/021 | 47/026 |
 |
49/027 |
 |
48/027 |
 |
| Standard deviation | 9.5/3.2 | 5/4.2 | 4.9/4.3 | ||||
| Mean | 2.75/−6 | −2/−1.75 | −1.75/0.75 | ||||
Fisher K coefficient
| Set | Handmapping Fisher K | Photogrammetry Fisher K | Smartphone (geostation) Fisher K | Smartphone (rocklogger) Fisher K |
|---|---|---|---|---|
| 1 | 50.7022 (28)a | 69.5 (36) | 62.274 (30) | 60.5444 (29) |
| 2 | 39.392 (34) | 39.2 (35) | 39.5258 (28) | 38.9822 (39) |
| 3 | 25.5619 (15) | 35.4 (9) | 34.423 (18) | 32.2718 (11) |
| 4 | 14.7797 (23) | 22.2 (13) | 17.195 (11) | 20.59 (15) |
| Average | 33.61 | 41.58 | 38.35 | 38.10 |
- a
Values in bracket indicate number of poles
PVD of field orientation measurements
| Set | Handmapping Dip/DipDir (°) | Photogrammetry Dip/DipDir (°) | PVD from handmapping | Smartphone (geostation) Dip/DipDir (°) | PVD from handmapping | Smartphone (rocklogger) Dip/DipDir (°) | PVD from handmapping |
|---|---|---|---|---|---|---|---|
| 1 | 80/321 | 73/329 | 10.46 | 82/323 | 2.81 | 81/322 | 1.40 |
| 2 | 87/198 | 90/207 | 9.48 | 86/195 | 3.16 | 89/202 | 4.47 |
| 3 | 75/266 | 61/268 | 14.12 | 73/269 | 3.51 | 71/264 | 4.43 |
| 4 | 40/021 | 47/026 | 7.80 | 49/027 | 9.93 | 48/027 | 9.01 |
| Average | 10.47 | Average | 4.85 | Average | 4.83 |
Summary of failure modes by slope face dip and varying dip direction due to bending nature of the road cut
| Direction of sliding | South West | North East | East | South East | South East |
|---|---|---|---|---|---|
| Dip/dip direction | 75/021 | 75/198 | 75/266 | 75/321 | 75/330 |
| Planar (with limits) | Yes | No | No | No | No |
| Set 4 (47.8%) | |||||
| Wedge | Yes | No | No | Yes | Yes |
| Sets 1 and 4 |
 |
Sets 1 and 4 | |||
 |
 |
||||
| Toppling (flexural) | No | No | No | No | No |
3.2.1 Comparison of mean set planes
Table 6 shows that joint sets 1 and 2 are characterized by steeply inclined planes, while joint sets 3 and 4 are characterized by sub-vertical and sub-horizontal orientation, respectively.
Table 6 shows less variance in measured dip/dip directions among the three methods. For dip, the standard deviations vary from 4.9 to 9.5°, while their mean values vary from −2 to 2.75°. For dip directions, the standard deviations vary from 3.2 to 4.3°, while their mean values vary from −6 to 0.75°. An acceptable tolerance limit or error between handmapping and remote data capture systems should be below ±15° [2,26]. For this research, the field orientation measurements between the three different mapping methods of the discontinuities are acceptable since they fit within this allowable error. According to ref. [25], these errors are expected to be around 5° for dip angle and around 10° for dip direction. Photogrammetry shows slightly higher variation in dip but lower variation in dip direction as compared to smartphone. This is likely to be due to the low point density or spatial resolution of the 3D triangular mesh.
3.2.2 Comparison of Fisher K coefficient
Dips Rocscience software was used to calculate the Fisher K values for each joint set. A tight data cluster around the mean orientation was for the steeply dipping sets, one and two, as they had higher average Fisher K values. The E–W striking set had lower K values than the NE–SW striking set for each mapping technique. The lowest Fisher K values resulted from the shallowest dipping set, set 4. The average Fisher K values across each set for each mapping tool are shown in Table 7.
3.2.3 Comparison of pole vector difference (PVD)
Based on comparable orientation sets identified by handmapping, smartphone and photogrammetry, their PVDs are illustrated in Table 8. Sets 1, 2, 3 and 4 are observed in all mapping tools. Overall, handmapping vs photogrammetry gave the highest average PVD of 10.47, while handmapping vs smartphone gave the lowest PVD of 4.8°. Both smartphone applications, Geostation and Rocklogger, can be used for geotechnical mapping as they gave a lower PVD variation of 0.02 (4.85–4.83). The data in this research comprised of 100 patches and 29 traces.
3.3 Kinematic analysis
Kinematic analysis has been undertaken using DIPS 7.0 software to identify likely failure modes on the road cut. A friction angle of 35° is used based on Table 5 for rock mass classification and due to the observation that all the surfaces are rough. The lower limit of 35° is assumed to account for the possible effects of groundwater. The results of the kinematic analysis are summarized in Table 9.
Based on direct observation of the slope in the field, it was decided to report the highest relevant percentage of joints (or intersections) for the Dips analysis of each failure mode where this is 20% or more of the total and 30% or more of one set, otherwise “N” not to be considered further. The slope face has a dip of 75° and a dip direction of 330° which varies due to the bending nature of the rock face. Failure can only occur where the dip of the single plane or line of intersection of a wedge is shallower than the apparent dip of the slope in the direction of potential sliding and steeper than the effective angle of frictional resistance. The criteria in which the dip direction of the plane must be within ±20° dip of slope only apply to planar failure. Based on this primary test, only set 1 might control planar failure (Table 10) as it does satisfy the failure condition. In addition, wedge failure is likely due to sets 1, 3 and 4 whose dip is less than the slope face dip. Set 2 presents a low risk as it does not satisfy both failure criteria.
Summary of planar sliding kinematic analysis results
| Planar sliding | Critical | % | Total |
|---|---|---|---|
| All vectors | 14 | 12.61 | 111 |
| Set 4: J4 | 11 | 47.83 | 23 |
The percentage of critical intersections compared to the total number is high (set 4: 48%) and poses a risk so planar sliding is a concern for this slope orientation and friction angle.
For set 3 and 4 intersection type, the percentage of critical intersections (critical 1: 35% and critical 2: 39%) compared to the total number (345) poses a risk, so wedge sliding is a concern for this slope orientation and friction angle (Table 11). Also, sets 1 and 4 have potential to cause wedge failure as the percentage of critical intersections is slightly high compared to all poles. This shows that set 4 has a dominating influence on stability. Only sets 3 and 4 daylight hence will be used in Q-slope stability analysis.
Summary of wedge sliding results
| Intersection type | Critical 1 | % | Critical 2 | % | Total |
|---|---|---|---|---|---|
| Grid data plane intersections | 1,082 | 17.79 | 748 | 12.30 | 6,083 |
| All set planes | 574 | 15.71 | 402 | 11.00 | 3,653 |
| Set 1 vs set 2 planes | 46 | 4.83 | 86 | 9.03 | 952 |
| Set 1 vs set 3 planes | 58 | 13.81 | 25 | 5.95 | 420 |
| Set 1 vs set 4 planes | 158 | 24.53 | 205 | 31.83 | 644 |
| Set 2 vs set 3 planes | 166 | 32.55 | 0 | 0.00 | 510 |
| Set 2 vs set 4 planes | 24 | 3.07 | 50 | 6.39 | 782 |
 |
 |
 |
 |
 |
 |
| User and mean set (unweighted) plane intersections | 1 | 10.00 | 2 | 20.0 | 10 |
| User plane intersections | No results | ||||
| Mean set plane (unweighted) intersections | 0 | 0.00 | 2 | 33.33 | 6 |
As shown in Table 12, flexural toppling is not a great concern for the slope as the percentage of critical intersection is zero.
Summary of flexural toppling results
| Flexural toppling | Critical | % | Total |
|---|---|---|---|
| All vectors | 0 | 0.00 | 111 |
3.4 Rock mass classification
GSI values have been obtained by direct reading of the GSI charts, conversion from RMR (RMR76′) and Q′. The results of the GSI determination are summarized in Table 13. RQD obtained from mapping of exposures typically ranges from 50 to 75%. The mean RQD for determination of GSI is taken as 63%. Ratings for joint spacing and condition used to generate a rock mass classification are based on the most critical discontinuities (sets 3 and 4) of the road cut.
Summary of rock mass classification
| Parameter | Rating | Comments |
|---|---|---|
| Q′ | 6.3 | Q ′ ( = RQD/J n × J r/J a) |
| RQD = 63; joint set number, J n = 15; joint roughness number, J r = 1.5; joint alteration number, J a = 1 | ||
| 9logeQ′ + 44 | 61 | GSI from Q′ |
| GSI direct | 60 | Blocky/fair to good – perhaps 55 to 65 ≥ 60 |
| RMR76′ | 60 | Uniaxial compressive strength, UCS = 50 MPa ≥ 7; RQD = 63 ≥ 13; spacing: 0.3–1 m ≥ 20; condition ≥ 20 |
| Average GSI | 60 |
For obtaining a Q′ value, it was considered that there are four joint sets, leading to a joint set number Jn of 15. An alternate Jn of 12 representing three joint sets plus random produces Q′ values which are not significantly different from those produced for four joint sets.
3.4.1 Q-slope
The following Q-slope ratings were assigned to the road cut for wedge and planar failure analysis (Table 14).
Q-slope ratings
| Parameter | Rating | Comments |
|---|---|---|
| RQD | 50–75% = 63% | Fair to good rock |
| J n | 15 | Four or more joint sets, random, heavily jointed |
| J r | 1.5 | Rough and irregular undulating joints with moderately weathered surfaces |
| J a (set 4) | 1 | Unaltered joint walls, surface staining only |
| J a (set 3) | 0.75 | Tightly healed |
| O-factor (set 4) | 0.75 | Orientation adjustment for joints in rock slope. Set 4 is dominant and unfavourable |
| O-factor (set 3) | 1 | Set 3 is less dominant and quite favourable. But it will be considered due to potentially unstable wedge formation |
| Jwice | 0.6 | Wet environment, competent rock but unstable structure |
| SRFa – physical condition** | 5 | Loose blocks and susceptibility to weathering |
| SRFb – stress** | 1 | Moderate stress–strength range (σ c/σ 1: 50–200) |
| SRFc – major** discontinuity | 2 | Unfavourable |
3.4.1.1 Wedge failure analysis
Sets 3 and 4 control wedge failure. Based on the assigned ratings, Q-slope and β were estimated as follows:
Therefore, the steepest slope angle (β) not requiring reinforcement or support to prevent wedge failure is as follows:
In Figure 13, the blue cross shows that the existing slope angle (75°) is unstable but the suggested Q-slope angle of 66° (the red cross) will increase the stability of the road cut (Figures 14 and 15).

Lower hemisphere stereonet showing set analysis on smartphone captured data using Rocklogger.

Q-slope stability chart for road cut.
3.4.1.2 Planar failure analysis
Set 4 controls planar failure. Based on the assigned ratings, Q-slope and β were estimated as follows:
Thus, the steepest slope angle (β) not requiring reinforcement or support to prevent planar failure is as follows:
Similarly, Figure 16 shows that the existing slope angle of 75° is unstable (blue cross) and hence the suggested Q-slope angle of 60° needs to be used to increase slope stability (red cross).

Q-slope stability chart for road cut.
4 Discussion and conclusion
Comparative application of photogrammetry, handmapping and android smartphone for geotechnical mapping and slope stability analysis raises questions concerning the appropriate accuracy, reliability and scale of mapping needed to effectively characterize a rock mass. The author successfully applied photogrammetry, android smartphone and handmapping to collect and compare discontinuity orientation data at a road cut along Blantyre–Chikwawa, Malawi. The rock mass orientation data were further used for kinematic analysis to identify potential modes of slope failure. Access to slope face for conventional mapping was limited due to safety concerns. The results of this research showed that android-smartphone has a role in geotechnical mapping since the pole vector error and standard deviation given by smartphone orientation data as compared to handmapped data are less than ±15°. Set analysis on 111 comparable data points gave a maximum PVD of 10.5°, with the minimum having a difference of 4.8°. For dip, the standard deviations vary from 4.9 to 9.5°, while their mean values vary from −2 to 2.75°. For dip directions, the standard deviations vary from 3.2 to 4.3°, while their mean values vary from −6 to 0.75°. In the present study, the field orientation measurements between the three different mapping methods of the discontinuities provided a reasonably acceptable representation of the orientation of the fracture network on the rock mass and they fit within the allowable orientation error of ±15° although photogrammetry showed slightly higher variation in dip but lower variation in the dip direction as compared to smartphone. This is likely to be due to the low point density and spatial resolution of the 3D triangular mesh. According to ref. [25], these errors are expected to be around 5° for dip angle and around 10° for the dip direction. Overall, handmapping vs photogrammetry gave the highest average PVD of 10.47°, while handmapping vs smartphone gave the lowest PVD of 4.8°. Both smartphone applications, Geostation and Rocklogger, can be used for geotechnical mapping as they gave a lower PVD variation of 0.02 (4.85–4.83). A tight data cluster around the mean orientation was observed for the steeply dipping joint sets, 1 and 2, as they had higher average Fisher K values. The E–W striking joint set had lower Fisher K values than the NE–SW striking joint set for each mapping technique applied. The lowest Fisher K values resulted from the shallowest dipping joint set 4. Stereographic and kinematic analysis showed that the 75° dipping road cut is predominantly prone to wedge failure with minor planar failure since the percentage of critical intersections for joint sets 3 and 4 is high compared to all poles. For slope stability, Q-slope suggested a new slope angle within the range of 60–66°. The major drawback with smartphone usage is safety, as the user still needs physical contact with the rock face to collect discontinuity orientation data. In addition, magnetic fields locally affect smartphones hence the need to check with clar compass for calibration and georeferencing purposes, i.e. level and align with respect to the magnetic and true North.
The research findings of this study will assist mining companies, road authorities and civil and building contractors in carrying out geotechnical assessments for various engineering projects using a smartphone due to its portability, less survey time and lower cost as compared to a clar compass, Nikon Camera, Total Station and LIDAR. Technology is still at its infancy in Malawi such that there is a need to create University engineering programs that will stimulate the students to be innovative and creative. Therefore, the research output from the present study will also promote the use of smartphones in geotechnical engineering undergraduate programs and foster research as well as policy that has an impact on the safety of the society.
In order to address the smartphone site safety concern, it is recommended that future work should investigate the 3D image quality of reconstructed rock slopes using different android and iOS smartphones for remote data collection, delineation and slope monitoring as probably the type of smartphone camera used might influence the results obtained. Discontinuity orientation, persistence and intensity are the main inputs required for the generation of discrete fracture network models [15]. The time is fast approaching that a new ISRM Suggested Method for Remote Rock Mass Data Capture should be developed [2].
Acknowledgments
The author would like to thank University of Malawi, The Polytechnic for supporting this research.
-
Conflict of interest: The author has not declared any conflicts of interest.
References
[1] Priest SD. Determination of discontinuity size distributions from scanline data. Rock Mech Rock Eng. 2004;37(5):247–386.10.1007/s00603-004-0035-2Suche in Google Scholar
[2] Coggan JS, Wetherelt A, Gwynn XP, Flynn ZN. Comparison of hand-mapping with remote data capture systems for effective rock mass characterization. In: Sousa LR, Olalla C, Grossmann NF, eds., 11th congress of the international society for rock mechanics. Lisbon, Portugal: Taylor & Francis; 2007. p. 201–6.Suche in Google Scholar
[3] Piteau DR. Engineering geology contribution to the study of stability of slopes in rock with particular reference to De Beers Mine. Ph.D. Thesis. University of the Witwatersrand, Johannesburg, South Africa; 1970Suche in Google Scholar
[4] Sztubecki J, Bujarkiewicz A, Derejczyk K, Przytuła M. Displacement and deformation study of engineering structures with the use of modern laser technologies. Open Geosci. 2020;12:354–62. 10.1515/geo-2020-0051.Suche in Google Scholar
[5] Knapen BV, Slob S. Identification and characterisation of rock mass discontinuity sets using 3D laser scanning. The Geological Society of London; 2006 (AEG 2006 Paper number 438).Suche in Google Scholar
[6] Francioni M, Sciarra N, Ghirotti M, Borgati L, Salvini R, Calamita F. The impact of new technologies in the engineering classification of rock masses. Italian J Eng Geol Environ. 2019;2019:33–9. 10.4408/IJEGE.2019-01.S-06.Suche in Google Scholar
[7] Ozturk HS, Kocaman S, Gokceoglu C. A low-cost approach for determination of discontinuity orientation using smartphone images and application to a part of Ihlara valley (central Turkey). Eng Geol. 2019;254:63–75. 10.1016/j.enggeo.2019.04.011.Suche in Google Scholar
[8] Can R, Kocaman S, Gokceoglu C. A convolutional neural network architecture for auto-detection of landslide photographs to assess citizen science and volunteered geographic information data quality. ISPRS Int J Geo-Inf. 2019;8(7):300. 10.3390/ijgi8070300.Suche in Google Scholar
[9] Kocaman S, Gokceoglu C. A CitSci app for landslide data collection. Landslides. 2019;16(3):611–5. 10.1007/s10346-018-1101-2.Suche in Google Scholar
[10] World Bank. Mineral sector review: Source of economic growth and development, report no. 50160-MW. Washington D.C: The World Bank; 2009.Suche in Google Scholar
[11] Slama I. Manual of photogrammetry. 4th edn. Virginia, US: American Society of Photogrammetry; 1980.Suche in Google Scholar
[12] Wolf PR, Dewitt BA. Elements of photogrammetry, with applications in GIS. 3rd edn. Boston: McGraw-Hill; 2000.Suche in Google Scholar
[13] Krosley LK, Shaffner PT, Oerter E, Ortiz T. Digital ground-based photogrammetry for measuring discontinuity orientations in steep rock exposures. Proceedings: 41st US symposium on rock mechanics, Golden, Colorado, 17–21 June; 2006.Suche in Google Scholar
[14] Martin CD, Tannant DD, Lan H. Comparison of terrestrial-based, high resolution, LiDAR and digital photogrammetry surveys of a rock slope. In: Eberhardt E, Stead D, Morrison T, eds., Proceedings of the 1st Canada-U.S. Rock mechanics symposium, vancouver, 27–31 May; 2007. p. 37–44.10.1201/NOE0415444019-c5Suche in Google Scholar
[15] Sturzenegger M, Stead D. Close-range terrestrial digital photogrammetry and terrestrial laser scanning for discontinuity characterization on rock cuts. Eng Geol. 2009a;106:163–82. 10.1016/j.enggeo.2009.03.004.Suche in Google Scholar
[16] Bieniawski ZT. Engineering rock mass classifications: A complete manual for engineers and geologists in mining. Civil and Petroleum Engineering. New York, NY: Wiley; 1989.Suche in Google Scholar
[17] Hoek E. Strengths of rock and rock masses. Int Soc Rock Mech NJ. 1994;2(2):4–16.10.1201/b16978-11Suche in Google Scholar
[18] Barton NR, Bar N. Introducing the Q-slope method and its intended use within civil and mining engineering projects. In: Schubert W, ed., Future development of rock mechanics; proc. ISRM reg. symp. eurock & 64th geomechanics colloquium, Salzburg 7–10 October; 2015. OGG; p. 157–62.Suche in Google Scholar
[19] Thoeni K, Giacomini A, Murtagi RK, Kniest E. A comparison of multi-view 3D reconstruction of a rock wall using several cameras and a laser scanner. The international archives of the photogrammetry, remote sensing and spatial information sciences, vol XL-5, ISPRS technical commission V symposium, 23–25 June 2014, Riva del Garda, Italy; 2014.10.5194/isprsarchives-XL-5-573-2014Suche in Google Scholar
[20] Westoby MJ, Brasington J, Glasser NF, Hambrey MJ, Reynolds JM. Structure-from-motion. Geomorphology. 2012;179:300–14. 10.1016/j.geomorph.2012.08.021.Suche in Google Scholar
[21] Split Engineering. SplitFX user manual, beta version 1. Arizona, US: Split Engineering LLC; 2005.Suche in Google Scholar
[22] Djuric U, Dragana P, Marjanovic M, Kuzmic P. Portable geotechnics-using android smartphones and tablets for geotechnical field investigations. Geo Conf Inf Geoinf Remote Sens Bulgaria. 2013;1:513–20. 10.5593/SGEM2013/BB2.V1/S08.Suche in Google Scholar
[23] RockGecko. Rocklogger. Accessed on www.rockgecko.com; 2019.Suche in Google Scholar
[24] Fisher R. Dispersion on a sphere. Proc R Soc Lond. 1953;A217:295–305.10.1098/rspa.1953.0064Suche in Google Scholar
[25] Windsor CR, Robertson WV. Rock reinforcement practice. Rock mass formulation, vol 1; 1994.Suche in Google Scholar
[26] Gwynn XP. Assessment of remote data capture systems for the characterisation of rock fracture networks within slopes. PhD Thesis. Camborne School of Mines, University of Exeter; 2007.Suche in Google Scholar
[27] Malunga G. The geology and mineral potential of Malawi. Technical File. Mining and trade review; 2018.Suche in Google Scholar
© 2021 Jabulani Matsimbe, published by De Gruyter
This work is licensed under the Creative Commons Attribution 4.0 International License.
Artikel in diesem Heft
- Regular Articles
- Lithopetrographic and geochemical features of the Saalian tills in the Szczerców outcrop (Poland) in various deformation settings
- Spatiotemporal change of land use for deceased in Beijing since the mid-twentieth century
- Geomorphological immaturity as a factor conditioning the dynamics of channel processes in Rządza River
- Modeling of dense well block point bar architecture based on geological vector information: A case study of the third member of Quantou Formation in Songliao Basin
- Predicting the gas resource potential in reservoir C-sand interval of Lower Goru Formation, Middle Indus Basin, Pakistan
- Study on the viscoelastic–viscoplastic model of layered siltstone using creep test and RBF neural network
- Assessment of Chlorophyll-a concentration from Sentinel-3 satellite images at the Mediterranean Sea using CMEMS open source in situ data
- Spatiotemporal evolution of single sandbodies controlled by allocyclicity and autocyclicity in the shallow-water braided river delta front of an open lacustrine basin
- Research and application of seismic porosity inversion method for carbonate reservoir based on Gassmann’s equation
- Impulse noise treatment in magnetotelluric inversion
- Application of multivariate regression on magnetic data to determine further drilling site for iron exploration
- Comparative application of photogrammetry, handmapping and android smartphone for geotechnical mapping and slope stability analysis
- Geochemistry of the black rock series of lower Cambrian Qiongzhusi Formation, SW Yangtze Block, China: Reconstruction of sedimentary and tectonic environments
- The timing of Barleik Formation and its implication for the Devonian tectonic evolution of Western Junggar, NW China
- Risk assessment of geological disasters in Nyingchi, Tibet
- Effect of microbial combination with organic fertilizer on Elymus dahuricus
- An OGC web service geospatial data semantic similarity model for improving geospatial service discovery
- Subsurface structure investigation of the United Arab Emirates using gravity data
- Shallow geophysical and hydrological investigations to identify groundwater contamination in Wadi Bani Malik dam area Jeddah, Saudi Arabia
- Consideration of hyperspectral data in intraspecific variation (spectrotaxonomy) in Prosopis juliflora (Sw.) DC, Saudi Arabia
- Characteristics and evaluation of the Upper Paleozoic source rocks in the Southern North China Basin
- Geospatial assessment of wetland soils for rice production in Ajibode using geospatial techniques
- Input/output inconsistencies of daily evapotranspiration conducted empirically using remote sensing data in arid environments
- Geotechnical profiling of a surface mine waste dump using 2D Wenner–Schlumberger configuration
- Forest cover assessment using remote-sensing techniques in Crete Island, Greece
- Stability of an abandoned siderite mine: A case study in northern Spain
- Assessment of the SWAT model in simulating watersheds in arid regions: Case study of the Yarmouk River Basin (Jordan)
- The spatial distribution characteristics of Nb–Ta of mafic rocks in subduction zones
- Comparison of hydrological model ensemble forecasting based on multiple members and ensemble methods
- Extraction of fractional vegetation cover in arid desert area based on Chinese GF-6 satellite
- Detection and modeling of soil salinity variations in arid lands using remote sensing data
- Monitoring and simulating the distribution of phytoplankton in constructed wetlands based on SPOT 6 images
- Is there an equality in the spatial distribution of urban vitality: A case study of Wuhan in China
- Considering the geological significance in data preprocessing and improving the prediction accuracy of hot springs by deep learning
- Comparing LiDAR and SfM digital surface models for three land cover types
- East Asian monsoon during the past 10,000 years recorded by grain size of Yangtze River delta
- Influence of diagenetic features on petrophysical properties of fine-grained rocks of Oligocene strata in the Lower Indus Basin, Pakistan
- Impact of wall movements on the location of passive Earth thrust
- Ecological risk assessment of toxic metal pollution in the industrial zone on the northern slope of the East Tianshan Mountains in Xinjiang, NW China
- Seasonal color matching method of ornamental plants in urban landscape construction
- Influence of interbedded rock association and fracture characteristics on gas accumulation in the lower Silurian Shiniulan formation, Northern Guizhou Province
- Spatiotemporal variation in groundwater level within the Manas River Basin, Northwest China: Relative impacts of natural and human factors
- GIS and geographical analysis of the main harbors in the world
- Laboratory test and numerical simulation of composite geomembrane leakage in plain reservoir
- Structural deformation characteristics of the Lower Yangtze area in South China and its structural physical simulation experiments
- Analysis on vegetation cover changes and the driving factors in the mid-lower reaches of Hanjiang River Basin between 2001 and 2015
- Extraction of road boundary from MLS data using laser scanner ground trajectory
- Research on the improvement of single tree segmentation algorithm based on airborne LiDAR point cloud
- Research on the conservation and sustainable development strategies of modern historical heritage in the Dabie Mountains based on GIS
- Cenozoic paleostress field of tectonic evolution in Qaidam Basin, northern Tibet
- Sedimentary facies, stratigraphy, and depositional environments of the Ecca Group, Karoo Supergroup in the Eastern Cape Province of South Africa
- Water deep mapping from HJ-1B satellite data by a deep network model in the sea area of Pearl River Estuary, China
- Identifying the density of grassland fire points with kernel density estimation based on spatial distribution characteristics
- A machine learning-driven stochastic simulation of underground sulfide distribution with multiple constraints
- Origin of the low-medium temperature hot springs around Nanjing, China
- LCBRG: A lane-level road cluster mining algorithm with bidirectional region growing
- Constructing 3D geological models based on large-scale geological maps
- Crops planting structure and karst rocky desertification analysis by Sentinel-1 data
- Physical, geochemical, and clay mineralogical properties of unstable soil slopes in the Cameron Highlands
- Estimation of total groundwater reserves and delineation of weathered/fault zones for aquifer potential: A case study from the Federal District of Brazil
- Characteristic and paleoenvironment significance of microbially induced sedimentary structures (MISS) in terrestrial facies across P-T boundary in Western Henan Province, North China
- Experimental study on the behavior of MSE wall having full-height rigid facing and segmental panel-type wall facing
- Prediction of total landslide volume in watershed scale under rainfall events using a probability model
- Toward rainfall prediction by machine learning in Perfume River Basin, Thua Thien Hue Province, Vietnam
- A PLSR model to predict soil salinity using Sentinel-2 MSI data
- Compressive strength and thermal properties of sand–bentonite mixture
- Age of the lower Cambrian Vanadium deposit, East Guizhou, South China: Evidences from age of tuff and carbon isotope analysis along the Bagong section
- Identification and logging evaluation of poor reservoirs in X Oilfield
- Geothermal resource potential assessment of Erdaobaihe, Changbaishan volcanic field: Constraints from geophysics
- Geochemical and petrographic characteristics of sediments along the transboundary (Kenya–Tanzania) Umba River as indicators of provenance and weathering
- Production of a homogeneous seismic catalog based on machine learning for northeast Egypt
- Analysis of transport path and source distribution of winter air pollution in Shenyang
- Triaxial creep tests of glacitectonically disturbed stiff clay – structural, strength, and slope stability aspects
- Effect of groundwater fluctuation, construction, and retaining system on slope stability of Avas Hill in Hungary
- Spatial modeling of ground subsidence susceptibility along Al-Shamal train pathway in Saudi Arabia
- Pore throat characteristics of tight reservoirs by a combined mercury method: A case study of the member 2 of Xujiahe Formation in Yingshan gasfield, North Sichuan Basin
- Geochemistry of the mudrocks and sandstones from the Bredasdorp Basin, offshore South Africa: Implications for tectonic provenance and paleoweathering
- Apriori association rule and K-means clustering algorithms for interpretation of pre-event landslide areas and landslide inventory mapping
- Lithology classification of volcanic rocks based on conventional logging data of machine learning: A case study of the eastern depression of Liaohe oil field
- Sequence stratigraphy and coal accumulation model of the Taiyuan Formation in the Tashan Mine, Datong Basin, China
- Influence of thick soft superficial layers of seabed on ground motion and its treatment suggestions for site response analysis
- Monitoring the spatiotemporal dynamics of surface water body of the Xiaolangdi Reservoir using Landsat-5/7/8 imagery and Google Earth Engine
- Research on the traditional zoning, evolution, and integrated conservation of village cultural landscapes based on “production-living-ecology spaces” – A case study of villages in Meicheng, Guangdong, China
- A prediction method for water enrichment in aquifer based on GIS and coupled AHP–entropy model
- Earthflow reactivation assessment by multichannel analysis of surface waves and electrical resistivity tomography: A case study
- Geologic structures associated with gold mineralization in the Kirk Range area in Southern Malawi
- Research on the impact of expressway on its peripheral land use in Hunan Province, China
- Concentrations of heavy metals in PM2.5 and health risk assessment around Chinese New Year in Dalian, China
- Origin of carbonate cements in deep sandstone reservoirs and its significance for hydrocarbon indication: A case of Shahejie Formation in Dongying Sag
- Coupling the K-nearest neighbors and locally weighted linear regression with ensemble Kalman filter for data-driven data assimilation
- Multihazard susceptibility assessment: A case study – Municipality of Štrpce (Southern Serbia)
- A full-view scenario model for urban waterlogging response in a big data environment
- Elemental geochemistry of the Middle Jurassic shales in the northern Qaidam Basin, northwestern China: Constraints for tectonics and paleoclimate
- Geometric similarity of the twin collapsed glaciers in the west Tibet
- Improved gas sand facies classification and enhanced reservoir description based on calibrated rock physics modelling: A case study
- Utilization of dolerite waste powder for improving geotechnical parameters of compacted clay soil
- Geochemical characterization of the source rock intervals, Beni-Suef Basin, West Nile Valley, Egypt
- Satellite-based evaluation of temporal change in cultivated land in Southern Punjab (Multan region) through dynamics of vegetation and land surface temperature
- Ground motion of the Ms7.0 Jiuzhaigou earthquake
- Shale types and sedimentary environments of the Upper Ordovician Wufeng Formation-Member 1 of the Lower Silurian Longmaxi Formation in western Hubei Province, China
- An era of Sentinels in flood management: Potential of Sentinel-1, -2, and -3 satellites for effective flood management
- Water quality assessment and spatial–temporal variation analysis in Erhai lake, southwest China
- Dynamic analysis of particulate pollution in haze in Harbin city, Northeast China
- Comparison of statistical and analytical hierarchy process methods on flood susceptibility mapping: In a case study of the Lake Tana sub-basin in northwestern Ethiopia
- Performance comparison of the wavenumber and spatial domain techniques for mapping basement reliefs from gravity data
- Spatiotemporal evolution of ecological environment quality in arid areas based on the remote sensing ecological distance index: A case study of Yuyang district in Yulin city, China
- Petrogenesis and tectonic significance of the Mengjiaping beschtauite in the southern Taihang mountains
- Review Articles
- The significance of scanning electron microscopy (SEM) analysis on the microstructure of improved clay: An overview
- A review of some nonexplosive alternative methods to conventional rock blasting
- Retrieval of digital elevation models from Sentinel-1 radar data – open applications, techniques, and limitations
- A review of genetic classification and characteristics of soil cracks
- Potential CO2 forcing and Asian summer monsoon precipitation trends during the last 2,000 years
- Erratum
- Erratum to “Calibration of the depth invariant algorithm to monitor the tidal action of Rabigh City at the Red Sea Coast, Saudi Arabia”
- Rapid Communication
- Individual tree detection using UAV-lidar and UAV-SfM data: A tutorial for beginners
- Technical Note
- Construction and application of the 3D geo-hazard monitoring and early warning platform
- Enhancing the success of new dams implantation under semi-arid climate, based on a multicriteria analysis approach: Case of Marrakech region (Central Morocco)
- TRANSFORMATION OF TRADITIONAL CULTURAL LANDSCAPES - Koper 2019
- The “changing actor” and the transformation of landscapes