Geospatial assessment of wetland soils for rice production in Ajibode using geospatial techniques
-
Anthony Tobore
 ,
Bolarinwa Senjobi
,
Bolarinwa Senjobi

Abstract
Wetlands played an important role in human development and nature nutrient store for rice cultivation. Spatial techniques have gained importance in monitoring wetland changes. The study aimed to assess wetland soils for rice production using spatial techniques. The area was sample using stratified grid sampling. Nutrient availability and rice suitability were assessed in ArcGIS 10.6 environment. The soil was characterized into Eutric fluvaquent (Soil Survey Staff, 2010) and correlated as fluvisols in the World Reference Base system. The results of the land cover changes showed that built-up, waterbody, and farmland have increased by 39, 18, and 29%, respectively, and 13% decrease was observed in vegetation. The study concluded that soils of the studied area varied from marginally (75%), not suitable (20%), and permanently not suitable (5%) for rice production. Therefore, without proper assessment and management of these studied soils, rice production will continue to be futile.
1 Introduction
Rice (Oryza sativa) serves as an important staple food crop belonging to the Gramineae family [1]. More than half of the world population is dependent upon rice [2]. Supplying the growing human population with safe and adequate staple crops such as rice is an overwhelming challenge [3,4,5]. About 80% of rice land is cultivated on wetlands, and this accounts for 93% of world rice production (International Rice Research Institute). Optimum rice production is achieved when the land use is put into investigation. Land use and land cover (LULC) change is most important in understanding and investigating changes in wetlands [6]. Wetlands played an important role in human development and are recognized as one of the world’s most valuable natural resources [7,8]. Globally, wetlands’ benefits and values to the society have attracted great importance. However, wetland soils experience direct and indirect negative impacts through anthropogenic activities [9].
In Nigeria, wetland cultivation is now being emphasized especially for rice production [10,11,12]. Wetlands are most times being referred to as wastelands [13,14,15]. According to the Ramsar convention [16], about 64% of the world’s wetlands has disappeared. Besides, pressure from urbanization and industrialization has also contributed to the loss of wetlands. Cohen et al. [17] opined that the discharge of anthropogenic activities into wetlands decreases nutrient concentrations in crops and reduces the soil nutrients [18,19]. According to ref. [20], about 25% of Nigeria’s rice is conventionally cultivated [21].
Application of technological advances such as geographic information system (GIS) and remotely sensed (RS) data made possible to study the changes in wetland in less time, at low cost, and with better accuracy, especially when consistent and spatial data are essential [22,23,24,25,26]. GIS provided suitable platform for data analysis, update, and retrieval [27]. Integration of RS and GIS has proved to serve as indispensable tools in mapping potential suitability of wetland soils in a study [28]. Hence, this study aimed at the assessment of LULC change in wetland soils for rice production in Ajibode using an object-based analysis tool.
2 Study methods
The city of Ibadan is the largest in West Africa and it is located in South-Western Nigeria. Ibadan lies essentially in a zone of transition between the humid and sub-humid tropical climates within latitudes 7°16′ North to 7°34′ North, longitudes 3°44′ East to 4°02′ East about, 145 km North of Lagos. The 2006 census puts the total population of Ibadan at 2,550,593, while the average population density was 828 persons per kilometer [29]. The Ajibode part of Ibadan is made up of an agrarian community with man-made and natural wetlands (Figure 1). The studied area has experienced industrialization encroachment with the presence of institutions such as Federal Schools of Statistics, among others.
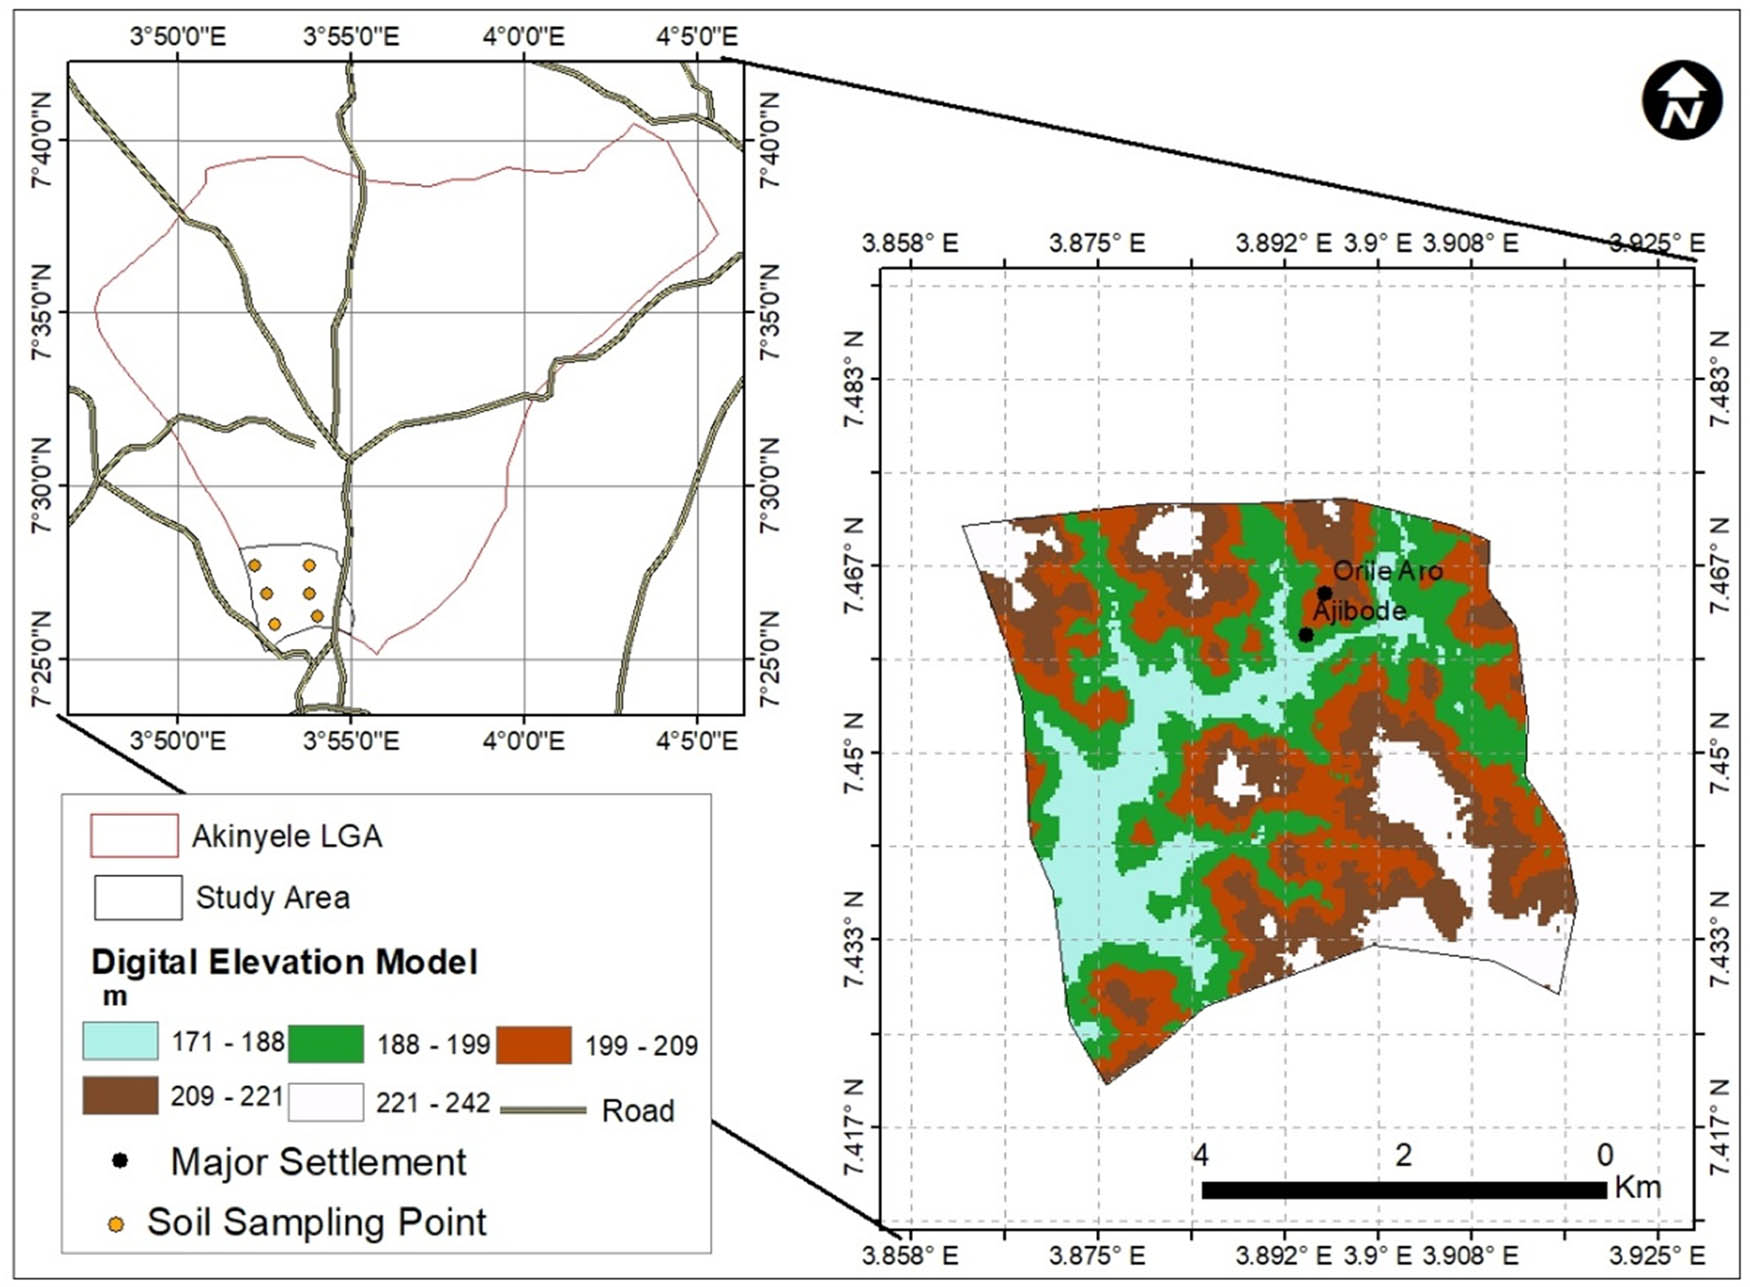
Study area.
Plains and river valley are the two major landforms that dominate the landscape. The average elevation is 230 m above the mean sea level. The area is drained by three major rivers, namely, Ogbere, Ogunpa, and Ona, with many tributaries, such as Alaro, Omi, Kudeti, etc. The combination of the plains and river valleys provides a good drainage for the studied area. The western part of the city which consists of most of the industries and more recent residential is drained by river Ona with its tributaries including Alalubosa, Alaro, Oshun, etc.; River Ogunpa drains the Eastern part of the studied area with its tributaries including river Ogbere.
The geology of Ibadan is described as a basement complex of Pre-Cambrian age with mainly granite, quartzite, and migmatite as the dominant rock types. The minor rock types include pegmatite and diorite. The soils of Ibadan are formed from the weathered materials of the underlying basement rocks especially granite gneiss, quartz–schist, schist, and biotite gneiss which are mainly metamorphic rocks and minor pegmatite. As reported by ref. [30], the identification of soil associations in Ibadan is based on parent materials.
The study assessed LULC and soil suitability using GIS and RS methods. The LULC changes were assessed using RS techniques. Interpolation of soil nutrients for rice production was assessed using GIS.
2.1 Data preparation and analysis
Multi-spectral Landsat satellite data for the years 2000 and 2016 were acquired from the United States Geological Survey (USGS) to measure the LULC change. Due to atmospheric error and avoidance of seasonal variation, the Landsat images with maximum cloud cover were already set as <10%, which made the images free from atmospheric weather condition. Landsat satellite data scene with <10% indicates no need of additional geo-rectification or image-to-image registration for image pre-processing [31]. The acquired Landsat was supported and validated with Google Earth Imagery immediately after ground truthing. The Landsat data sets were subjected to Environmental Visual software (Envi) 5.1 environment for image classification. Information of the images acquired from the USGS online data repository (including date, sensor, spatial resolution, cloud cover, and Path/Row) is shown in Table 1.
Details of the image used for the study
| Image | Acquisition date | Path and row | Band composite | No of bands | Spatial resolution |
|---|---|---|---|---|---|
| LandSat 7 | 19/05/2000 | P191, R55 | 432 | 5 | 30 m |
| LandSat 8 | 20/05/2016 | P191, R55 | 652 | 11 | 30 m |
2.2 Image classification
The images obtained from Landsat are classified into four broad LULC classes (namely, vegetation, built up, waterbody, and farmland) for the years 2000 and 2016 based on the Maximum Likelihood Supervised Classification (MLSC) techniques. The MLSC operation is carried out due to its good performance and easy classification algorithm [32,33]. Pixel signatures of the LULC class features were identified and created with a polygon for easy identification of the area of interest. The kappa statistics of the LULC were calculated for accuracy assessment [34].
2.3 Normalized difference vegetation index
Normalized difference vegetation index (NDVI) is an indicator used to identify the photosynthetic activity of land cover. In this study, NDVI was applied to detect loss of vegetation cover change which can be attributed to wetland loss [35]. Here the formula for NDVI calculation is given by ref. [35]:
where Band 3 is the near-infrared region, and Band 4 is the visible red.
2.4 Geospatial assessment of wetland
Reconnaissance survey was carried out to identify the soil types. Soil sampling coordinate point was taken with the aid of a global positioning system. The study area was sampled using stratified grid sampling and was predominantly made up of lowland topography. Soil sampling was collected at 0–15 cm for soil fertility assessment since rice is a shallow-rooted crop. Representative soil profile pits measuring 2 m by 1.5 m by 2 m were dug. A total of three soil profile pits were dug and were described based on morphology, chemical, and physical in line with the ref. [36] procedure. Soil samples were collected from the different pedogenic horizons and then processed in the laboratory after air-drying at room temperature. Land requirement and suitability ratings for rice production were shown in Table 2 [37,38,39]. The sampling coordinates were further inserted into the Microsoft excel sheet and plotted into ArcGIS 10.5 environ for production of rice suitability map.
Land requirement and suitability classes for rice production
| Land qualities | SI1 100 | SI2 95 | S2 85 | S3 60 | N1 40 | N2 25 |
|---|---|---|---|---|---|---|
| Climate (c) | ||||||
| Annual rainfall (mm) | >1,000 | 900–1,000 | 800–900 | 600–800 | 500–600 | <500 |
| Temperature (°C) | >25 | 22–25 | 20–22 | 18–20 | 16–18 | <16 |
| Topography (t) | ||||||
| Slope (%) | <2 | 3–4 | 5–6 | 7–8 | 9–10 | >10 |
| Drainage (w) | ||||||
| Wetness | WD | MWD | MD | ID | PD | PD |
| Soil physical properties (s) | ||||||
| Texture | L | LfS | LS | S | S | S |
| Structure | Cr | Cr | SAB | SAB | Col | Col |
| Coarse fragment (%) (0–45 cm) | <3 | 3–5 | 5–10 | 10–15 | >15 | — |
| Soil depth (cm) | >75 | 65–70 | 50–65 | 35–50 | 30–35 | >30 |
| Soil fertility (f) | ||||||
| pH | 5.5–6.5 | 5.0–5.5 | 4.5–5.0 | 4.0–4.5 | <4.0 | — |
| ECEC (cmol/kg) | >16 | 12–16 | 8–12 | 5–8 | <5 | — |
| Base saturation (%) | >80 | 70–80 | 50–70 | 35–50 | 25–35 | <25 |
| Organic matter (%) (0–30 cm) | >2.0 | 2.0–1.5 | 1.2–1.5 | 1.0–1.2 | 1.0 | <1.0 |
| Macro-nutrients | ||||||
| Nitrogen (%) | >2.0 | 1.5–2.0 | 1.0–1.5 | 0.5–1.0 | <0.5 | — |
| Phosphorus (mg/kg) | >22 | 13–22 | 6–13 | 3–6 | <3 | — |
| Potassium (cmol/kg) | >0.5 | 0.3–0.5 | 0.2–0.3 | 0.1–0.2 | <0.1 | |
| Micro-nutrients | ||||||
| Iron (Fe) (mg/kg) | >4.5 | 3.5–4.5 | 2.5–3.5 | 1.5–2.5 | 1.0–1.5 | <1.0 |
| Zinc (Zn) (mg/kg) | >2.0 | 1.5–2.0 | 1.0–1.5 | 0.8–1.0 | 0.6–0.8 | <0.6 |
| Manganese (Mn) (mg/kg) | >1.5 | 1.0–1.5 | 0.8–1.0 | 0.6–0.8 | 0.5–0.6 | <0.5 |
WD = well drained; MWD = moderately well drained; ID = imperfectly drained; PD = poorly drained; L = loamy; LfS = loamy fine sand; LS = loamy sand; S = sand; Cr = crumb; SAB = sub-angular blocky; ECEC = exchangeable cation exchanged capacity; Col = columnar. Source: Sys et al. (1991, 1993) and De Datta (1989).
2.5 Soil classification
The study soils were found on the basement parent rock materials in south-western Nigeria. The soils were classified based on morphological characteristics and soil laboratory data using the USDA Soil Taxonomy [40] and the World Reference Base (WRB) system of ref. [41].
2.6 Geostatistical methods
In this study, geostatistical analyses were conducted in three stages which include semi-variogram, model evaluation, and estimations. Semi-variogram is one of the most essential tools in geostatistical analyses to quantify and model the spatial variability degree of data. Semi-variogram analyses were determined and fitted with an exponential model [42,43]. Thereafter, the soil data were subject to ordinary kriging (OK) interpolation method. OK is used for prediction of the values of the unsample points by assuming the equals of the known measured value (field measured value). In order to ensure that their reliability and appropriateness, the variogram models were validated with root mean square error (RMSE). RMSE is used to describe the distance between measured and estimated values. The kriging process is calculated by the following equation [44]:
where Z *(X 0) is the predicted value at position, Z(x i ) is the known value at sampling site x i , k i is the weighting coefficient of the measured site, and n is the number of sites within the otassiumood searched for the interpolation.
2.7 Laboratory analysis
The following soil parameters were determined: nitrogen, potassium, phosphorus, hydrogen ions, soil texture, soil structure, hydraulic conductivity, bulk density (BD), and soil pH. The particle size was determined by the hydrometer method Bouyoucous described in ref. [45]. Total nitrogen was determined calorimetrically. Available phosphorus was extracted by Bray 1 method [46] and phosphorus concentration was determined using an ultraviolet spectrophotometer. Soil organic carbon was determined by dichromate oxidation procedure and organic matter was determined by carbon factor. Exchangeable bases (such as calcium, magnesium, potassium, and sodium) were extracted with neutral ammonium acetate. Calcium and magnesium were determined with atomic absorption spectrometry, while potassium and sodium were determined by flame photometer. Base saturation and effective cation exchange capacity were calculated. Soil pH was determined in a 1:2 soil to water suspension using a glass electrode pH meter. BD was determined from undisturbed core samples, which were oven-dried to constant weight at 105°C.
3 Result
3.1 Soil classification
The mapping units were identified based on established toposequence formed from basement complex soils in south-western Nigeria. The morphological properties of the studied soils varied, concerning colour, texture, structure, and boundary. In this study, three mapping units were identified: soil texture varied from sandy loam to sandy clay from the surface horizon down to the sub-horizons across the three soil profiles. The soil color varied from dark, Yellowish Red (YR) (2/1), very dark brown (7.5YR 2.5/2), dark reddish brown (5 YR 3/3), and yellowish red (5 YR 3/4) across the three soil profile. The structure varies from weak sub-angular blocky to medium sub-angular blocky with clear smooth, wavy, and medium angular blocky boundary. The area has an ustic moisture regime with a mean annual soil temperature of 22°C and classified as isohyperthermic temperature regime. The mapping units were further classified as Eutric fluvaquent and correlated as fluvisols in the WRB system.
3.2 Land use and land cover assessment
Periodical assessment characteristics and colour composite were used to specifically and comprehensively classify the LULC of the studied area [47]. Four major land cover classes were delineated using satellite data, viz., farmland, waterbody, vegetation, and built up. The statistical analysis of the multi-temporal LULC maps revealed that significant changes have taken place from the year 2000 to 2016. Three trends of change were manifested (Figure 2). First, a sudden increase in the built-up area, waterbody, and farmland, and second decrease in vegetation over the study period (Table 3). Accuracy assessment of the LULC classified maps for the years 2000 and 2016 is shown in Table 4.
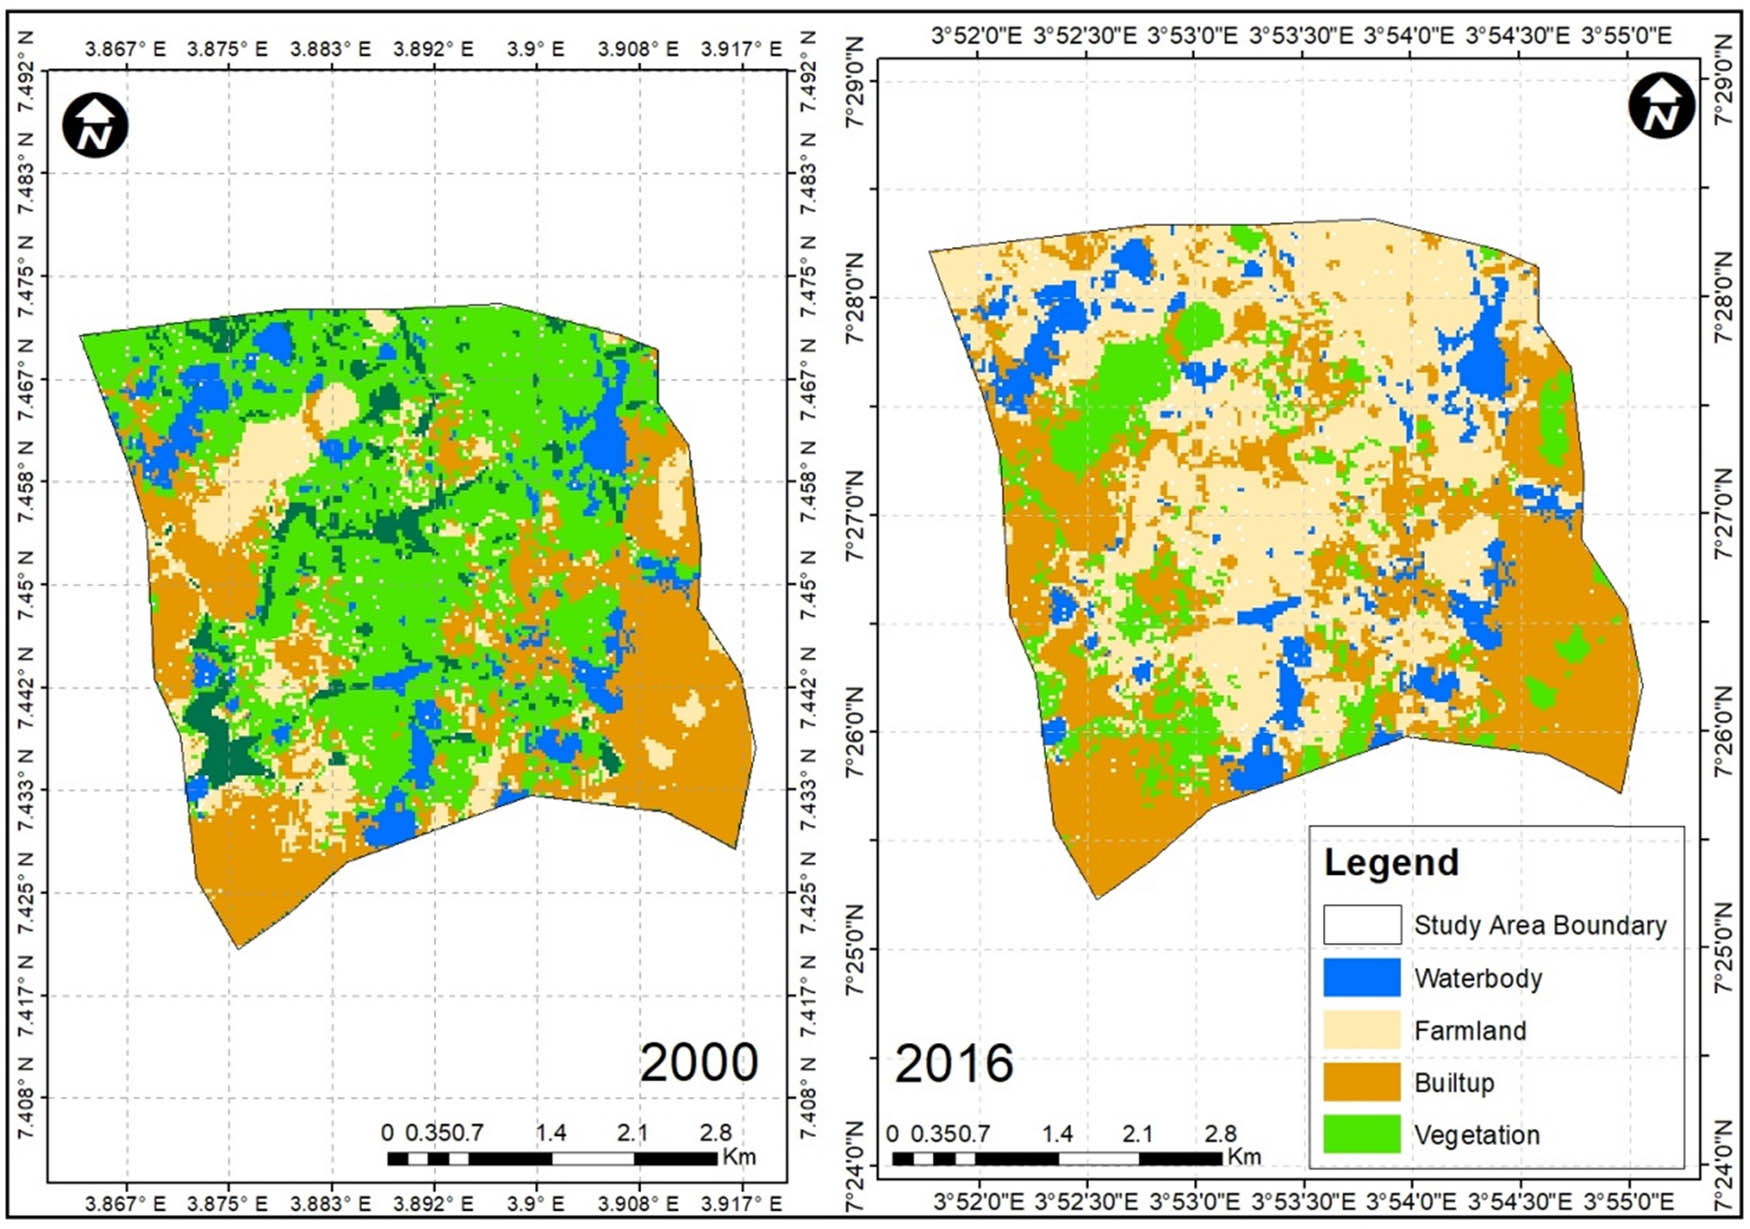
Land use and land cover.
Area and percentage of LULC changes from 2000 to 2016
| LULC class | Rate of change | |||
|---|---|---|---|---|
| Year | ||||
| 2000 | 2016 | |||
| Area (km2) | % | Area (km2) | % | |
| Waterbody | 2.87 | 14.03 | 3.69 | 18.03 |
| Built up | 4.91 | 23.99 | 7.99 | 39.05 |
| Vegetation | 9.79 | 47.85 | 2.79 | 13.64 |
| Farmland | 2.89 | 14.13 | 5.99 | 29.28 |
| Total | 20.46 | 100 | 20.46 | 100 |
Accuracy assessment of the LULC classified maps for the years 2000 and 2016
| User accuracy (%) | Producer accuracy (%) | |||||||||
|---|---|---|---|---|---|---|---|---|---|---|
| LULC | WB | BA | VG | FD | Overall classification accuracy | WB | BA | VG | FD | Overall statistic kappa |
| 2000 | 98.4 | 98.9 | 98.5 | 94.3 | 95.87% | 98.5 | 96.4 | 95.8 | 88.8 | 0.9488 |
| 2016 | 98.2 | 97.5 | 98.7 | 94.9 | 94.00% | 99.8 | 95.9 | 88.2 | 96.8 | 0.9365 |
LULC = land use and land cover; WB = waterbody; BA = built-up area; VG = vegetation; FD = farmland.
3.3 Fertility distribution of the studied soils
Soil fertility distribution of the studied soils shows that nitrogen varied from 0.6 to 1.00%, and the organic matter also varied from 1.60 to 5.37%. Soil pH (KCl) varied from 3.59 to 4.80, and soil pH (H2O) varied from 4.61 to 5.88. Exchangeable potassium in the soil varied from 0.41 to 1.00 cmol/kg. The exchangeable cation exchanged capacity (ECEC) of the soil varied between 3.33 and 8.04 cmol/kg. The calcium carbonate content of the soil ranged from 0.76 to 4.27 cmol/kg, and magnesium ranged from 0.62 to 2.56 cmol/kg. Available phosphorus ranged from 1.59 to 8.14 mg/kg. The micronutrients such as iron ranged from 100.64 to 212.32 mg/kg, zinc ranged from 1.17 to 4.20 mg/kg, and copper ranged from 1.84 to 5.97 mg/kg down the profile (Table 5).
Soil physical and chemical properties
| Depth (cm) | pH (H2O) | pH (KCl) | OM | Total | Exchangeable bases | Ex-acidity | Av.P | CEC | BS | Micro-nutrients | |||||||
|---|---|---|---|---|---|---|---|---|---|---|---|---|---|---|---|---|---|
| N | K+ | Ca2+ | Mg2+ | Na2+ | H+ | mg/kg | (cmol/kg) | (%) | Fe2+ | Zn2+ | Mn2+ | Cu2+ | |||||
| (%) | (cmol/kg) | (ppm) | |||||||||||||||
| Lowland 1 | |||||||||||||||||
| 0–11 | 5.27 | 4.33 | 2.99 | 1.4 | 0.97 | 2.74 | 0.78 | 0.40 | 0.15 | 1.98 | 5.04 | 97.9 | 212.32 | 4.20 | 77.40 | 3.11 | |
| 11–30 | 5.40 | 4.45 | 2.55 | 1.5 | 0.61 | 1.88 | 0.74 | 0.58 | 0.14 | 3.18 | 3.95 | 96.4 | 100.64 | 2.41 | 40.39 | 2.65 | |
| 30–50 | 5.21 | 4.00 | 2.06 | 1.2 | 0.68 | 0.88 | 1.02 | 0.60 | 0.12 | 3.55 | 3.33 | 95.1 | 103.45 | 1.17 | 40.09 | 3.31 | |
| 50–85 | 5.00 | 4.05 | 1.60 | 0.9 | 0.84 | 1.06 | 1.77 | 0.88 | 0.16 | 3.47 | 4.72 | 96.0 | 108.46 | 2.39 | 42.91 | 2.49 | |
| 85–110 | 4.84 | 3.59 | 1.87 | 0.8 | 0.55 | 1.18 | 1.40 | 0.60 | 0.17 | 3.44 | 3.90 | 95.1 | 101.42 | 2.28 | 30.64 | 2.88 | |
| Lowland 2 | |||||||||||||||||
| 0–9 | 5.76 | 4.61 | 3.11 | 1.8 | 1.00 | 2.14 | 1.23 | 0.43 | 0.12 | 2.34 | 4.92 | 97.3 | 208.08 | 3.64 | 89.30 | 3.20 | |
| 9–24 | 5.53 | 4.52 | 1.74 | 1.2 | 0.64 | 2.03 | 0.62 | 0.53 | 0.13 | 3.84 | 3.96 | 96.3 | 130.58 | 2.64 | 40.58 | 1.84 | |
| 24–38 | 4.61 | 4.49 | 2.13 | 1.3 | 0.56 | 0.76 | 1.14 | 0.60 | 0.18 | 2.45 | 3.24 | 94.7 | 139.88 | 2.46 | 25.44 | 2.26 | |
| 38–79 | 5.01 | 4.45 | 1.93 | 0.6 | 0.41 | 1.42 | 1.55 | 0.92 | 0.16 | 1.60 | 4.45 | 96.1 | 137.30 | 2.96 | 33.07 | 3.48 | |
| 79–112 | 4.82 | 4.29 | 1.53 | 0.7 | 0.60 | 1.09 | 1.22 | 1.57 | 0.17 | 1.59 | 4.65 | 96.3 | 140.68 | 1.70 | 31.62 | 2.90 | |
| Lowland 3 | |||||||||||||||||
| 0–4 | 5.88 | 4.51 | 5.37 | 2.6 | 0.75 | 3.34 | 1.45 | 0.38 | 0.12 | 8.14 | 6.03 | 98.1 | 161.08 | 3.81 | 58.08 | 5.97 | |
| 4–13 | 5.23 | 4.59 | 4.09 | 2.1 | 0.84 | 2.87 | 1.31 | 0.57 | 0.15 | 4.14 | 5.74 | 97.2 | 110.54 | 2.69 | 26.24 | 4.16 | |
| 13–24 | 5.85 | 4.80 | 3.37 | 1.7 | 0.94 | 3.13 | 0.89 | 0.57 | 0.12 | 5.09 | 5.66 | 97.2 | 177.91 | 3.71 | 83.83 | 2.80 | |
| 24–42 | 5.72 | 4.01 | 2.30 | 1.6 | 0.77 | 2.22 | 0.89 | 0.52 | 0.12 | 5.12 | 4.52 | 97.2 | 167.01 | 2.14 | 48.26 | 2.45 | |
| 42–90 | 5.52 | 4.01 | 2.15 | 3.1 | 0.63 | 4.27 | 2.56 | 0.45 | 0.13 | 2.03 | 8.04 | 98.3 | 142.47 | 3.79 | 109.35 | 3.56 | |
3.4 Geostatistical assessment of the studied soils
The nugget/sill ratio falls between the strong, moderate, and weak. Of the selected soil properties, pH (H2O) and pH (KCl) indicate a strong spatial correlation and nitrogen and potassium indicate moderate spatial correlation, while zinc and phosphorus indicate weak spatial correlation. The RMSE values ranged from 0.966 to 0.894, respectively, which indicates a good fit (Table 6).
Soil parameters for rice suitability
| Soil properties | Model | Spatial class | Nugget | Sill (Co + C) | Nugget/Sill | RMSE |
|---|---|---|---|---|---|---|
| pH (H2O) | Ex | Strong | 0.15 | 1.143 | 0.13 | 0.966 |
| pH (KCl) | Ex | Strong | 0.14 | 0.611 | 0.23 | 0.963 |
| Zinc | Ex | Weak | 0.73 | 1.074 | 0.68 | 0.894 |
| Nitrogen | Ex | Moderate | 0.74 | 4.092 | 0.18 | 0.966 |
| Potassium | Ex | Moderate | 0.42 | 0.956 | 0.44 | 0.932 |
| Phosphorus | Ex | Weak | 0.25 | 1.077 | 0.23 | 0.962 |
RMSE = root mean square error; Ex = exponential.
3.5 Normalized difference vegetation index
The NDVI is most often used for vegetation assessment [48]. The NDVI result for 2016 varied from 0.09 to 0.04, while NDVI for 2000 varied from 0.29 to 0.05 (Figure 3).
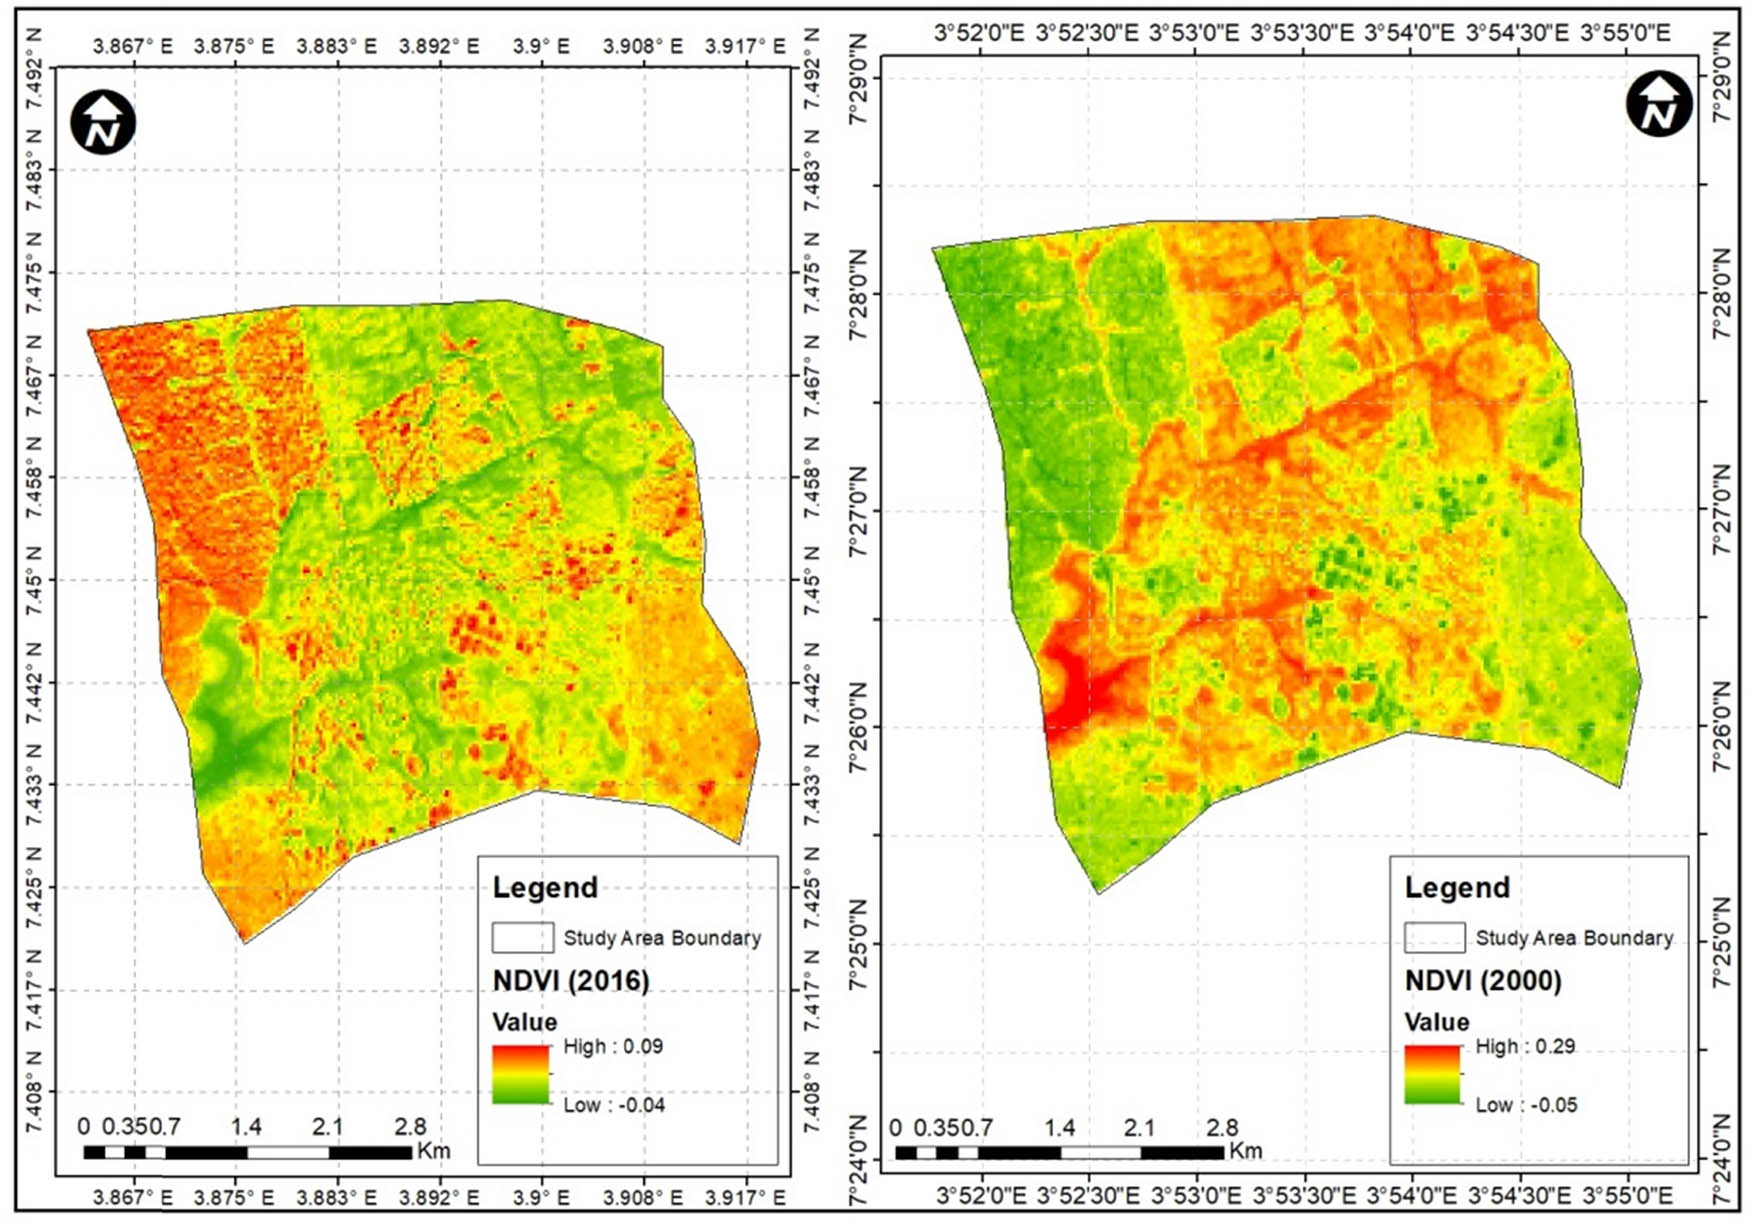
Normalized difference vegetation index.
3.6 Soil suitability assessment
Soil suitability of the study was conducted by merging the land requirement and soil suitability for rice production. The study revealed that the annual rainfall ranged from moderately to marginally suitable for rice production (800–900 mm), while the drainage is moderately drained, with 22 to 25°C temperature. The soil pH, iron, nitrogen, potassium, phosphorus, organic matter, and ECEC coupled with land qualities indicated that the studied soil is marginally suitable, covering 75% marginally suitable, 20% non-suitable, and 5% permanently not suitable (Figure 4).
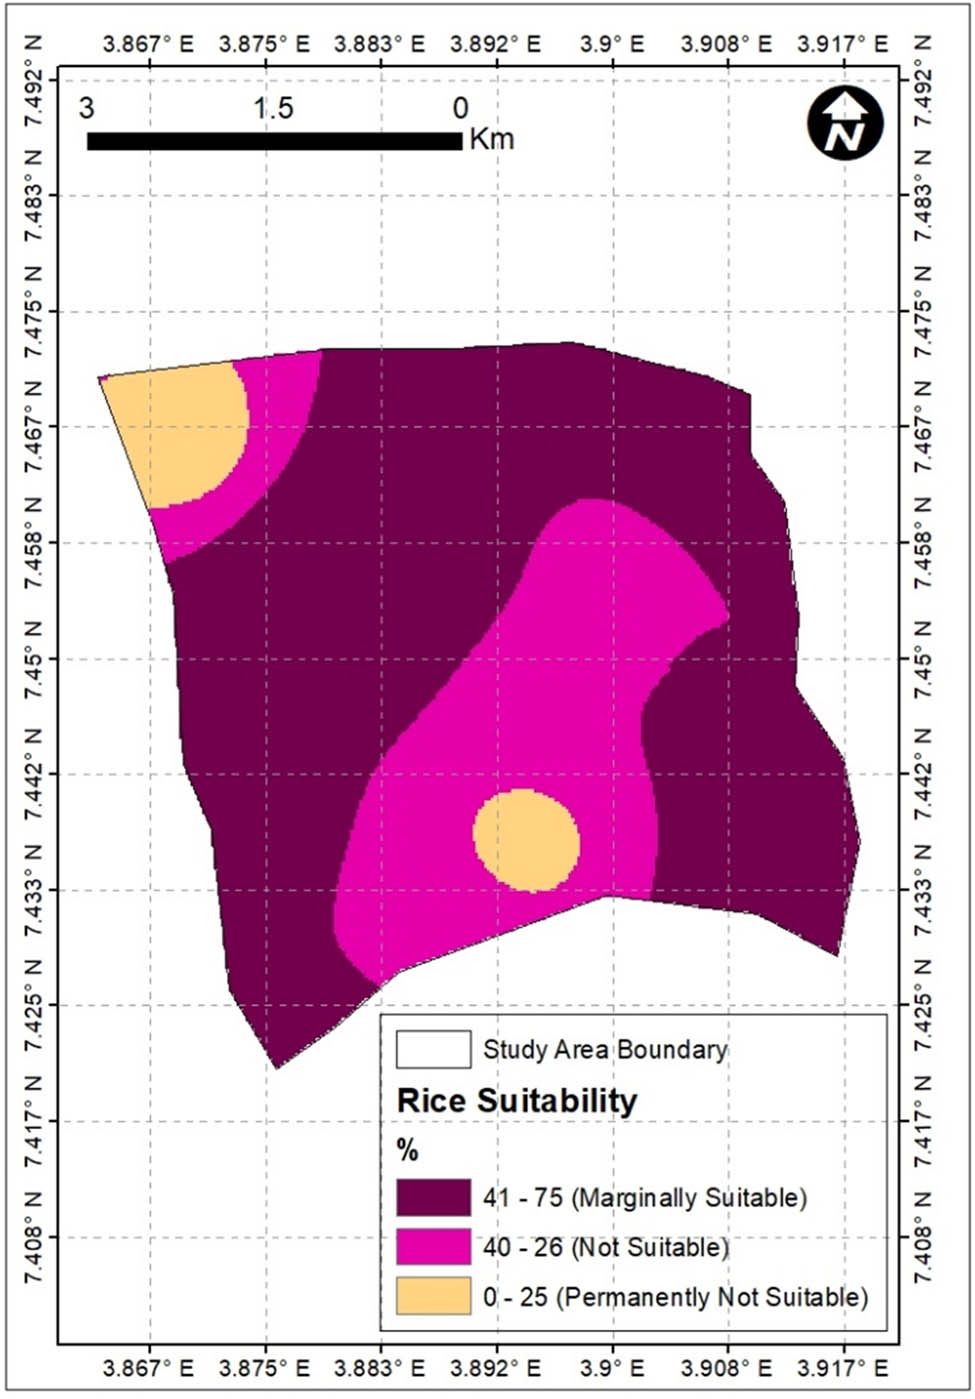
Rice suitability.
4 Discussion
The essential importance of geospatial techniques over the past decades is unavoidable. Geospatial techniques such as GIS and satellite remote sensing have been extensively applied in assessing the LULC changes of the studied wetlands. Wetlands are vital and sensitive to rice production. However, they are also faced with a lot of threats from anthropogenic activities. This study showed a better understanding of LULC assessment of wetland soils and accurate mapping of soil properties for precision farming. The soil hydraulic conductivity of the studied has no definite sequence down the profile, while the BD was decreasing with depth within the soil profile. The sandy nature of the soils could be traced to soil erosion experienced in the studied area. NDVI values in the year 2000 and 2016 can be attributed to moderate density, which is gradual loss of vegetation due to human activities such as built-up expansion and intensive farming practices [49]. The soil temperature classified as isohyperthermic in the present study agrees with the work done by ref. [50], which states that soil temperature regime in south-western Nigeria can be classified as isohyperthermic. Total nitrogen values range from medium to high and the soil pH in the studied area is acidic. The acidic nature in the studied soils can be attributed to the discharge of industrial waste and blanket use of fertilizer in the studied area. The blanket use of fertilizer and discharge of waste into the river which flows through the study area was noticed during the reconnaissance survey. The value of exchangeable potassium, available phosphorus, and ECEC obtained in this study is comparatively lower. Effect of the low available phosphorus, exchangeable potassium, and ECEC can be attributed to continuous or yearly cultivation of the study soils for rice production [51,52,53,54,55]. Geostatistic assessment of the study soil followed the order of strong (0.25) > moderate (0.25–0.75) > weak (0.75), which shows a good fit of the soil properties also in consonance with the work carried out by ref. [56]. The studied soil shows that marginally suitable area can be managed and increased by applying agricultural management techniques, while the permanently and not suitable can be planted with cover crops to improve the soil nutrients over time. Rice suitability production in the studied area has been affected through intensive farming, blanket use of fertilizer, and discharged of industrial waste materials from the communities and surrounding industries within the studied area. The present study suggested that the built-up area should not be allowed to increase at the expense of prime farmland. In addition, land use policy should be strictly followed. It is therefore recommended that the current land use pattern needs to be modified according to soil potential suitability classes. The use of geospatial techniques has offered easy assessment, proper monitoring, and potential suitability of the studied soils for rice production. RS and GIS can be potential tools for monitoring, planning, and decision making for government officials and policymakers of Ibadan and environment.
Acknowledgements
The authors are sincerely grateful to farmers (both male and female) in the study area for their understanding and allowing us to carry out this study in their farms. They are equally thankful to the US Geological Survey for assisting this research with data sets.
-
Author contributions: Tobore Anthony prepared the manuscript with contribution from all co-authors, developed original idea for this research, drafted the methodology, interpreted and analysed the data set, and finalized the impact of LULC on the study soils. Professor Senjobi provided guidelines for writing, proofread the full manuscript, gave critical review, and finalized the full manuscript. Ogundiyi Temitope suggested some analysis and language editing. Samuel Bamidele made language correction.
References
[1] Ayolagha GA, Peter KD, Ebie SJ. Effect of remediation of crude oil polluted inceptisols on maize (Zea mays) production using organic and inorganic fertilizers at Yenagoa, Bayelsa State. Int J Soil Sci. 2012;8:47–57.10.3923/ijss.2013.47.57Search in Google Scholar
[2] Jones MP. The rice plant and its environment. WARDA Training Guide 2. Bouaké: WARDA; 1995. p. 27–30.Search in Google Scholar
[3] Imolehin ED, Wada AC. Meeting the rice production and consumption demands of Nigeria with improved technologies. Int Rice Comm Newsl. 2000;49:1–56.Search in Google Scholar
[4] Mitsch WJ, Gosselink JG. Wetlands. 2nd edn. New York: Van NostrandReinho; 2000.Search in Google Scholar
[5] Zedler JB, Kercher S. Wetland resources: status, trends, ecosystem services, and restorability. Annu Rev Environ Resour. 2005;30:39–74.10.1146/annurev.energy.30.050504.144248Search in Google Scholar
[6] Turner W, Meyer B, David L. Global land use/land cover change: towards an integrated study. AMBIO. 1994;23(1):91–5.Search in Google Scholar
[7] McCartney M, Masiyandima M, HoughtonCarr H. Working wetlands: classifying wetland potentials for agriculture international water management institute (IWMI) draft research report; 2004. p. 35.Search in Google Scholar
[8] Tiner RW. Remote sensing of wetlands: applications and advances. Boca Raton, FL: CRC Press; 2015b. p. 3–18.10.1201/b18210-3Search in Google Scholar
[9] Erwin KL. Wetlands and global climate change: the role of wetland restoration in a changing world. Wetl Ecol Manag. 2009;17:71.10.1007/s11273-008-9119-1Search in Google Scholar
[10] Okusami TA, Rust RH. Occurrence, characteristics and classification of some hydromorphic soils from south Nigeria. In: Kimble JM, (ed). Characterization, classification and utilization of wet soils. Proc. VIII ISCOM. Lincoln, NE: USDA, Soil Conserv. Service, National Soil Survey Centre; 1992. p. 185–97.Search in Google Scholar
[11] Ogban PI, Babalola O. Characteristics, classification, and management of inland valley bottom soils for crop production in sub-humid southwestern Nigeria. Agro-Sci J Trop Agric, Food Environ Ext. 2009;8(1):1–13.10.4314/as.v8i1.44107Search in Google Scholar
[12] Ogban PI, Babalola O. Soil characteristics and constraints to crop production in inland valley bottoms in southwestern Nigeria. Agric Water Manag. 2003;61:13–28.10.1016/S0378-3774(02)00170-1Search in Google Scholar
[13] Clergeau P, Savard JPL, Mennechez G, Falardeau G. Bird abundance and diversity along an urban-rural gradient: a comparative study between two cities on different continents. Condor. 1998;100:413–25.10.2307/1369707Search in Google Scholar
[14] Blair RB. Birds and butterflies along an urban gradient: surrogate taxa for assessing biodiversity. Ecol Appl. 1999;9:164–70.10.1890/1051-0761(1999)009[0164:BABAAU]2.0.CO;2Search in Google Scholar
[15] McKinney ML. Urbanization, biodiversity, and conservation. Bioscience. 2002;2:883–9.10.1641/0006-3568(2002)052[0883:UBAC]2.0.CO;2Search in Google Scholar
[16] Ramsar Convention. Wetlands: a global disappearing act; 2009. Available from: https://goo.gl/GCBTT9 (accessed on November 21, 2016).Search in Google Scholar
[17] Cohen MJ, Dunne EJ, Bruland GL. Spatial variability of soil properties in cypress domes surrounded by different land uses wetlands. 2008;28(2):411–22. 10.1672/06182.1.Search in Google Scholar
[18] Kar D. Wetlands and Lakes of the World, New Delhi. India: Springer; 2013.10.1007/978-81-322-1023-8Search in Google Scholar
[19] Onweremadu EU, Peter KD. Pedogenesis of soils of two tropical microclimates in Owerri Area. South East Niger Int J Soil Sci. 2016;11(1):14–8.10.3923/ijss.2016.14.18Search in Google Scholar
[20] Singh BN, Fagade S, Ukwungwu MN, Williams C, Jagtap SS, Oladimeji O, et al. Rice growing environments and biophysical constraints in different agroecological zones of Nigeria. Met J. 1997;2(1):35–44.Search in Google Scholar
[21] Moormann FR, Juo ASR. Juo ASR, Lowe JA, eds., Africa: wetlands and rice in Sub-Saharan Africa. Ibadan: IITA; 1986. p. 191–4.Search in Google Scholar
[22] Kachhwala TS. Temporal monitoring of forest land for change detection and forest cover mapping through satellite remote sensing. Proceedings of the 6th Asian conference on remote sensing. Hyderabad; 1985. p. 77–83.Search in Google Scholar
[23] Schmidt K, Skidmore A. Spectral discrimination of vegetation types in a coastal wetland. Remote Sens Environ. 2003;85(1):92–108.10.1016/S0034-4257(02)00196-7Search in Google Scholar
[24] Brooks RP, Wardrop DH, Bishop JA. Assessing wetland condition on a watershed basis in the mid-Atlantic region using synoptic land-cover maps. Environ Monit Assess. 2004;94:9–22.10.1023/B:EMAS.0000016876.63062.3dSearch in Google Scholar
[25] Liu C, Frasier L, Kumar, Macgregor C. Catchment-wide wetland assessment and prioritization using the multi-criteria decision-making method TOPIS. Environ Manag. 2006;38(2):316–26.10.1007/s00267-005-0151-0Search in Google Scholar PubMed
[26] Kaplan G, Avdan U, Avdan Z. Estimation of wetland biomass using sentinel-2 images. IcocceCapadokia. Nevsehir, Turkey: Digital Proceeding of ICOCEE; 2007.Search in Google Scholar
[27] Chilar J. Land cover mapping of large areas from satellites: status and research priorities. Int J Remote Sens. 2000;21(67):1093–114.10.1080/014311600210092Search in Google Scholar
[28] Cowardin LM, Carter V, Golet FC, LaRoe ET. Classification of wetlands and deepwater habitats of the United States. US Fish Wildl Serv FWS/OBS. 1979;79:131.10.1002/047147844X.sw2162Search in Google Scholar
[29] National Population Commission, Nigeria. Census Report; 2006.Search in Google Scholar
[30] Smyth AJ, Mongomery RF. Soils and land use in Central Western Nigeria. Ibadan. Western Nigeria: Government Press; 1962. p. 264.Search in Google Scholar
[31] Kafy A, Faisal A, Sikdar S, Hasan M, Rahman M, Khan MD, et al. Impact of LULC changes on LST in Rajshahi district of Bangladesh: a remote sensing approach. J Geogr Stud. 2019;3(1):11–23. 10.21523/gcj5.19030102.Search in Google Scholar
[32] Liu J, Yan G, Wu Y, Wang Y, Zhang Z, Zhang M. Wetlands with greater degree of urbanization improve PM2.5 removal efficiency. Chemosphere. 2005;207:601–11.10.1016/j.chemosphere.2018.05.131Search in Google Scholar PubMed
[33] Zhang SQ, Na XD, Kong B, Wang ZM, Jiang HX, Yu H, et al. Identifying wetland change in China’s Sanjiang plain using remote sensing. 2015;1:302–13.10.1672/08-04.1Search in Google Scholar
[34] Story and Congalton RG. Accuracy assessment and validation of remotely sensed and other spatial information. Int J Wildland Fire. 1986. 10.1071/WF01031.Search in Google Scholar
[35] Huete AR. A Soil-adjusted vegetation index (SAVI). Remote Sens Environ. 1988;25:295–309.10.1016/0034-4257(88)90106-XSearch in Google Scholar
[36] FAO Rome. The State of Food Insecurity in the World. Rome: Food and Agriculture Organization of the United Nations; 2009. p. 23–41.Search in Google Scholar
[37] Sys C, Van Ranst E, Debaveye J. Land evaluation part I Principles in land evaluation and crop production calculations. General administration for development cooperation (GADC). Brussels, Belgium: Agricultural Publications No. 7; 1991.Search in Google Scholar
[38] Sys CV, Ranst E, Debaveye J. Land evaluation, Part l, principles in land evaluation and crop production calculations. International Training Centre for Post-graduate Soil Scientists. Brussels: University Ghent; 1993. www.plr.ugent.be/publicatie.htmlSearch in Google Scholar
[39] De Datta SK. Integrated Nitrogen management in irrigated rice. Adv Soil Sci. 1989;10:143–69.10.1007/978-1-4613-8847-0_4Search in Google Scholar
[40] Soil Survey Staff Keys to Soil Taxonomy. USDA natural resources conservation service, Washington D.C, USA, Comprehensive reference of the soil taxonomy classification system, used in the USA; 2010.Search in Google Scholar
[41] Goovaerts P. Geostatistics for natural resources evaluation. New York, USA: Oxford University Press; 1997.10.1093/oso/9780195115383.001.0001Search in Google Scholar
[42] Deutsch CV. Geostatistical reservoir modeling. Oxford: Oxford UP, Print; 2002.10.1093/oso/9780195138061.001.0001Search in Google Scholar
[43] FAO/IUSS Working Group. A framework for land evaluation. Rome Soils Bull. 2006;31:564, 25–42.Search in Google Scholar
[44] Beretta AN, Silbermann AV, Paladino L, Bassahun D, Musselli R, García-lamohte A. Soil texture analyses using a hydrometer: modification of the bouyoucos method. Cien Inv Agr. 2014;41(2):263–71.10.4067/S0718-16202014000200013Search in Google Scholar
[45] Flavio HGB, Gerardo R, Daniel B. Soil phosphorus extracted by bray 1 and mehlich 3 soil tests as affected by the soil/solution ratio in mollisols. Comm Soil Sci Plant Anal. 2011;42(2):220–30. 10.1080/00103624.2011.535072.Search in Google Scholar
[46] Mukherjee S. Land use maps for conservation of ecosystems. Geogr Rev India. 2010;3:23–8.Search in Google Scholar
[47] Wang BZ. Landscape ecological assessment and ecotourism development in the South Dongting lake wetland, China. J Env Sci. 1999;15:271–8.Search in Google Scholar
[48] Seto and frangias. Use of Normalized Difference Vegetation Index (NDVI) habitat models to predict breeding birds on the San Pedro River. Arizona: U.S. Geological Survey Open-File Report 2013–1100. 42 p.Search in Google Scholar
[49] Amusan AA, Ashaye TI. Granitic-gneiss derived soils in humid forest tropical southwestern Nigeria I: genesis and classification. Ife J Agric. 1991;13:1–20.Search in Google Scholar
[50] Wild A. The potassium status of soils in the savannah zone of Nigeria. Expl Agric. 1971;7:257–70.10.1017/S001447970000034XSearch in Google Scholar
[51] Xiao J, Shen Y, Ge J, Tateishi R, Tang C, Liang Y. Evaluating urban expansion and land use change in Shijiazhuang, China by using GIS and remote sensing. Lscape Urban Plan. 2006;75:69–80. 10.1016/j.landurbplan.2004.12.005.Search in Google Scholar
[52] Barber SA. Soil nutrient bioavailability; a mechanistic approach. New York: Willey; 1984.Search in Google Scholar
[53] Taiwo AA, Adetunji MT, Azeez JO. Potassium suppling capacity of some tropical alfisols in southwest Nigeria as measured by intensity, quantity and capacity factors. NutrCyclAgroecosyst. 2010;86:341–55.10.1007/s10705-009-9296-1Search in Google Scholar
[54] Ajiboye GA, Ogunwale JA. Forms and distribution of potassium in particle size reactions on talc overburden soils in Nigeria. Arch Agron Soil Sci. 2013;59:247–58.10.1080/03650340.2011.610031Search in Google Scholar
[55] Lopez-Granados F, Jurado-Exposita M, Pena-Barragan J, Garcia-Torres L. Using geostatistical and remote sensing approaches for mapping soil properties. Eur J Agron. 2005;23(3):279–89.10.1016/j.eja.2004.12.003Search in Google Scholar
[56] Al-Omran AM, Al-Wabel MI, El-Maghraby SE, Nadeem ME, Al-Sharani S. Spatial variability for some properties of the wastewater irrigated soils. J Saudi Soc Agric Sci. 2003;12(2):167–75.10.1016/j.jssas.2012.12.001Search in Google Scholar
© 2021 Anthony Tobore et al., published by De Gruyter
This work is licensed under the Creative Commons Attribution 4.0 International License.
Articles in the same Issue
- Regular Articles
- Lithopetrographic and geochemical features of the Saalian tills in the Szczerców outcrop (Poland) in various deformation settings
- Spatiotemporal change of land use for deceased in Beijing since the mid-twentieth century
- Geomorphological immaturity as a factor conditioning the dynamics of channel processes in Rządza River
- Modeling of dense well block point bar architecture based on geological vector information: A case study of the third member of Quantou Formation in Songliao Basin
- Predicting the gas resource potential in reservoir C-sand interval of Lower Goru Formation, Middle Indus Basin, Pakistan
- Study on the viscoelastic–viscoplastic model of layered siltstone using creep test and RBF neural network
- Assessment of Chlorophyll-a concentration from Sentinel-3 satellite images at the Mediterranean Sea using CMEMS open source in situ data
- Spatiotemporal evolution of single sandbodies controlled by allocyclicity and autocyclicity in the shallow-water braided river delta front of an open lacustrine basin
- Research and application of seismic porosity inversion method for carbonate reservoir based on Gassmann’s equation
- Impulse noise treatment in magnetotelluric inversion
- Application of multivariate regression on magnetic data to determine further drilling site for iron exploration
- Comparative application of photogrammetry, handmapping and android smartphone for geotechnical mapping and slope stability analysis
- Geochemistry of the black rock series of lower Cambrian Qiongzhusi Formation, SW Yangtze Block, China: Reconstruction of sedimentary and tectonic environments
- The timing of Barleik Formation and its implication for the Devonian tectonic evolution of Western Junggar, NW China
- Risk assessment of geological disasters in Nyingchi, Tibet
- Effect of microbial combination with organic fertilizer on Elymus dahuricus
- An OGC web service geospatial data semantic similarity model for improving geospatial service discovery
- Subsurface structure investigation of the United Arab Emirates using gravity data
- Shallow geophysical and hydrological investigations to identify groundwater contamination in Wadi Bani Malik dam area Jeddah, Saudi Arabia
- Consideration of hyperspectral data in intraspecific variation (spectrotaxonomy) in Prosopis juliflora (Sw.) DC, Saudi Arabia
- Characteristics and evaluation of the Upper Paleozoic source rocks in the Southern North China Basin
- Geospatial assessment of wetland soils for rice production in Ajibode using geospatial techniques
- Input/output inconsistencies of daily evapotranspiration conducted empirically using remote sensing data in arid environments
- Geotechnical profiling of a surface mine waste dump using 2D Wenner–Schlumberger configuration
- Forest cover assessment using remote-sensing techniques in Crete Island, Greece
- Stability of an abandoned siderite mine: A case study in northern Spain
- Assessment of the SWAT model in simulating watersheds in arid regions: Case study of the Yarmouk River Basin (Jordan)
- The spatial distribution characteristics of Nb–Ta of mafic rocks in subduction zones
- Comparison of hydrological model ensemble forecasting based on multiple members and ensemble methods
- Extraction of fractional vegetation cover in arid desert area based on Chinese GF-6 satellite
- Detection and modeling of soil salinity variations in arid lands using remote sensing data
- Monitoring and simulating the distribution of phytoplankton in constructed wetlands based on SPOT 6 images
- Is there an equality in the spatial distribution of urban vitality: A case study of Wuhan in China
- Considering the geological significance in data preprocessing and improving the prediction accuracy of hot springs by deep learning
- Comparing LiDAR and SfM digital surface models for three land cover types
- East Asian monsoon during the past 10,000 years recorded by grain size of Yangtze River delta
- Influence of diagenetic features on petrophysical properties of fine-grained rocks of Oligocene strata in the Lower Indus Basin, Pakistan
- Impact of wall movements on the location of passive Earth thrust
- Ecological risk assessment of toxic metal pollution in the industrial zone on the northern slope of the East Tianshan Mountains in Xinjiang, NW China
- Seasonal color matching method of ornamental plants in urban landscape construction
- Influence of interbedded rock association and fracture characteristics on gas accumulation in the lower Silurian Shiniulan formation, Northern Guizhou Province
- Spatiotemporal variation in groundwater level within the Manas River Basin, Northwest China: Relative impacts of natural and human factors
- GIS and geographical analysis of the main harbors in the world
- Laboratory test and numerical simulation of composite geomembrane leakage in plain reservoir
- Structural deformation characteristics of the Lower Yangtze area in South China and its structural physical simulation experiments
- Analysis on vegetation cover changes and the driving factors in the mid-lower reaches of Hanjiang River Basin between 2001 and 2015
- Extraction of road boundary from MLS data using laser scanner ground trajectory
- Research on the improvement of single tree segmentation algorithm based on airborne LiDAR point cloud
- Research on the conservation and sustainable development strategies of modern historical heritage in the Dabie Mountains based on GIS
- Cenozoic paleostress field of tectonic evolution in Qaidam Basin, northern Tibet
- Sedimentary facies, stratigraphy, and depositional environments of the Ecca Group, Karoo Supergroup in the Eastern Cape Province of South Africa
- Water deep mapping from HJ-1B satellite data by a deep network model in the sea area of Pearl River Estuary, China
- Identifying the density of grassland fire points with kernel density estimation based on spatial distribution characteristics
- A machine learning-driven stochastic simulation of underground sulfide distribution with multiple constraints
- Origin of the low-medium temperature hot springs around Nanjing, China
- LCBRG: A lane-level road cluster mining algorithm with bidirectional region growing
- Constructing 3D geological models based on large-scale geological maps
- Crops planting structure and karst rocky desertification analysis by Sentinel-1 data
- Physical, geochemical, and clay mineralogical properties of unstable soil slopes in the Cameron Highlands
- Estimation of total groundwater reserves and delineation of weathered/fault zones for aquifer potential: A case study from the Federal District of Brazil
- Characteristic and paleoenvironment significance of microbially induced sedimentary structures (MISS) in terrestrial facies across P-T boundary in Western Henan Province, North China
- Experimental study on the behavior of MSE wall having full-height rigid facing and segmental panel-type wall facing
- Prediction of total landslide volume in watershed scale under rainfall events using a probability model
- Toward rainfall prediction by machine learning in Perfume River Basin, Thua Thien Hue Province, Vietnam
- A PLSR model to predict soil salinity using Sentinel-2 MSI data
- Compressive strength and thermal properties of sand–bentonite mixture
- Age of the lower Cambrian Vanadium deposit, East Guizhou, South China: Evidences from age of tuff and carbon isotope analysis along the Bagong section
- Identification and logging evaluation of poor reservoirs in X Oilfield
- Geothermal resource potential assessment of Erdaobaihe, Changbaishan volcanic field: Constraints from geophysics
- Geochemical and petrographic characteristics of sediments along the transboundary (Kenya–Tanzania) Umba River as indicators of provenance and weathering
- Production of a homogeneous seismic catalog based on machine learning for northeast Egypt
- Analysis of transport path and source distribution of winter air pollution in Shenyang
- Triaxial creep tests of glacitectonically disturbed stiff clay – structural, strength, and slope stability aspects
- Effect of groundwater fluctuation, construction, and retaining system on slope stability of Avas Hill in Hungary
- Spatial modeling of ground subsidence susceptibility along Al-Shamal train pathway in Saudi Arabia
- Pore throat characteristics of tight reservoirs by a combined mercury method: A case study of the member 2 of Xujiahe Formation in Yingshan gasfield, North Sichuan Basin
- Geochemistry of the mudrocks and sandstones from the Bredasdorp Basin, offshore South Africa: Implications for tectonic provenance and paleoweathering
- Apriori association rule and K-means clustering algorithms for interpretation of pre-event landslide areas and landslide inventory mapping
- Lithology classification of volcanic rocks based on conventional logging data of machine learning: A case study of the eastern depression of Liaohe oil field
- Sequence stratigraphy and coal accumulation model of the Taiyuan Formation in the Tashan Mine, Datong Basin, China
- Influence of thick soft superficial layers of seabed on ground motion and its treatment suggestions for site response analysis
- Monitoring the spatiotemporal dynamics of surface water body of the Xiaolangdi Reservoir using Landsat-5/7/8 imagery and Google Earth Engine
- Research on the traditional zoning, evolution, and integrated conservation of village cultural landscapes based on “production-living-ecology spaces” – A case study of villages in Meicheng, Guangdong, China
- A prediction method for water enrichment in aquifer based on GIS and coupled AHP–entropy model
- Earthflow reactivation assessment by multichannel analysis of surface waves and electrical resistivity tomography: A case study
- Geologic structures associated with gold mineralization in the Kirk Range area in Southern Malawi
- Research on the impact of expressway on its peripheral land use in Hunan Province, China
- Concentrations of heavy metals in PM2.5 and health risk assessment around Chinese New Year in Dalian, China
- Origin of carbonate cements in deep sandstone reservoirs and its significance for hydrocarbon indication: A case of Shahejie Formation in Dongying Sag
- Coupling the K-nearest neighbors and locally weighted linear regression with ensemble Kalman filter for data-driven data assimilation
- Multihazard susceptibility assessment: A case study – Municipality of Štrpce (Southern Serbia)
- A full-view scenario model for urban waterlogging response in a big data environment
- Elemental geochemistry of the Middle Jurassic shales in the northern Qaidam Basin, northwestern China: Constraints for tectonics and paleoclimate
- Geometric similarity of the twin collapsed glaciers in the west Tibet
- Improved gas sand facies classification and enhanced reservoir description based on calibrated rock physics modelling: A case study
- Utilization of dolerite waste powder for improving geotechnical parameters of compacted clay soil
- Geochemical characterization of the source rock intervals, Beni-Suef Basin, West Nile Valley, Egypt
- Satellite-based evaluation of temporal change in cultivated land in Southern Punjab (Multan region) through dynamics of vegetation and land surface temperature
- Ground motion of the Ms7.0 Jiuzhaigou earthquake
- Shale types and sedimentary environments of the Upper Ordovician Wufeng Formation-Member 1 of the Lower Silurian Longmaxi Formation in western Hubei Province, China
- An era of Sentinels in flood management: Potential of Sentinel-1, -2, and -3 satellites for effective flood management
- Water quality assessment and spatial–temporal variation analysis in Erhai lake, southwest China
- Dynamic analysis of particulate pollution in haze in Harbin city, Northeast China
- Comparison of statistical and analytical hierarchy process methods on flood susceptibility mapping: In a case study of the Lake Tana sub-basin in northwestern Ethiopia
- Performance comparison of the wavenumber and spatial domain techniques for mapping basement reliefs from gravity data
- Spatiotemporal evolution of ecological environment quality in arid areas based on the remote sensing ecological distance index: A case study of Yuyang district in Yulin city, China
- Petrogenesis and tectonic significance of the Mengjiaping beschtauite in the southern Taihang mountains
- Review Articles
- The significance of scanning electron microscopy (SEM) analysis on the microstructure of improved clay: An overview
- A review of some nonexplosive alternative methods to conventional rock blasting
- Retrieval of digital elevation models from Sentinel-1 radar data – open applications, techniques, and limitations
- A review of genetic classification and characteristics of soil cracks
- Potential CO2 forcing and Asian summer monsoon precipitation trends during the last 2,000 years
- Erratum
- Erratum to “Calibration of the depth invariant algorithm to monitor the tidal action of Rabigh City at the Red Sea Coast, Saudi Arabia”
- Rapid Communication
- Individual tree detection using UAV-lidar and UAV-SfM data: A tutorial for beginners
- Technical Note
- Construction and application of the 3D geo-hazard monitoring and early warning platform
- Enhancing the success of new dams implantation under semi-arid climate, based on a multicriteria analysis approach: Case of Marrakech region (Central Morocco)
- TRANSFORMATION OF TRADITIONAL CULTURAL LANDSCAPES - Koper 2019
- The “changing actor” and the transformation of landscapes