Shallow geophysical and hydrological investigations to identify groundwater contamination in Wadi Bani Malik dam area Jeddah, Saudi Arabia
-
Faisal Rehman
 and
Helmy S. O. Abuelnaga
and
Helmy S. O. Abuelnaga

Abstract
The integration of geophysical techniques with hydrological investigation is frequently used for solving different geological and environmental problems including groundwater quality and exploration and seismic vulnerability assessment. In this research, the shallow geophysical techniques comprising of electrical resistivity profiling, vertical electrical sounding, and ground magnetic were used to identify the contaminated areas lying in the upstream and downstream of Almisk Lake in Jeddah. The chemical analyses of water samples collected from the wells located in the downstream and upstream areas were used to support these results as an increase in the total dissolved solids (TDS) shows a decrease in the resistivity value. The results of geophysical techniques and hydrochemical analyses show that the TDS values are significantly higher in the upstream area of dam than those of the downstream, which suggests that the contaminating source is lying in the upstream of the reservoir. Moreover, the dam was not completely successful to block the contamination because of improper base. The hydrochemical analysis and geophysical results clearly indicate that the groundwater is not suitable for drinking and irrigation purposes.
1 Introduction
Geophysical techniques and hydrogeological studies are the pivotal tools to detect and study the different environmental problems caused by the drinking and waste water, and the integrated geophysical methods with a hydrogeological investigation can impeccably delineate the contaminated, partly affected, and virgin area. The integration also provides insight into the future potential and venerable subsurface areas to be affected by lateral and vertically downward movement of contaminants [1,2,3,4].
Many researchers used the integration of different geophysical methods in dealing with mapping of waste disposal areas and characterization of bedrocks to delineate fractures and faults through which transportation of contaminants takes place in the subsurface and nature of contaminants. Subsurface contamination can occur in different ways like intrusion of saltwater, seepage from buried waste, and groundwater pollution of soil through the landfill or direct contamination [5,6,7,8]. Ground magnetic method is the most widely used technique to identify the major subsurface structural elements such as faults, fractures which facilitate contaminant spreading [9]. Electrical resistivity profiling (ERP) provides valuable information on resistivity of subsurface material which will be used to create 2D and 3D resistivity models. The variation in resistivity values provides probable direction of landfill leachate flow in subsurface [10,11,12,13,14].
The present research is executed by the integration of different shallow geophysical methods and chemical analysis of groundwater samples to detect the contamination in the groundwater and sources of contamination. Integrated geophysical methods including ground magnetic method, ERP, and vertical electrical sounding (VES) were carried out around the catchment area of Wadi Bani Malik dam (Al Misk Lake area Figure 1) to determine the contamination in groundwater and source of contamination The study area has been used as Jeddah’s waste disposal site and abandoned for over 10 years but leaching out contaminants is a problem [2,15,16].
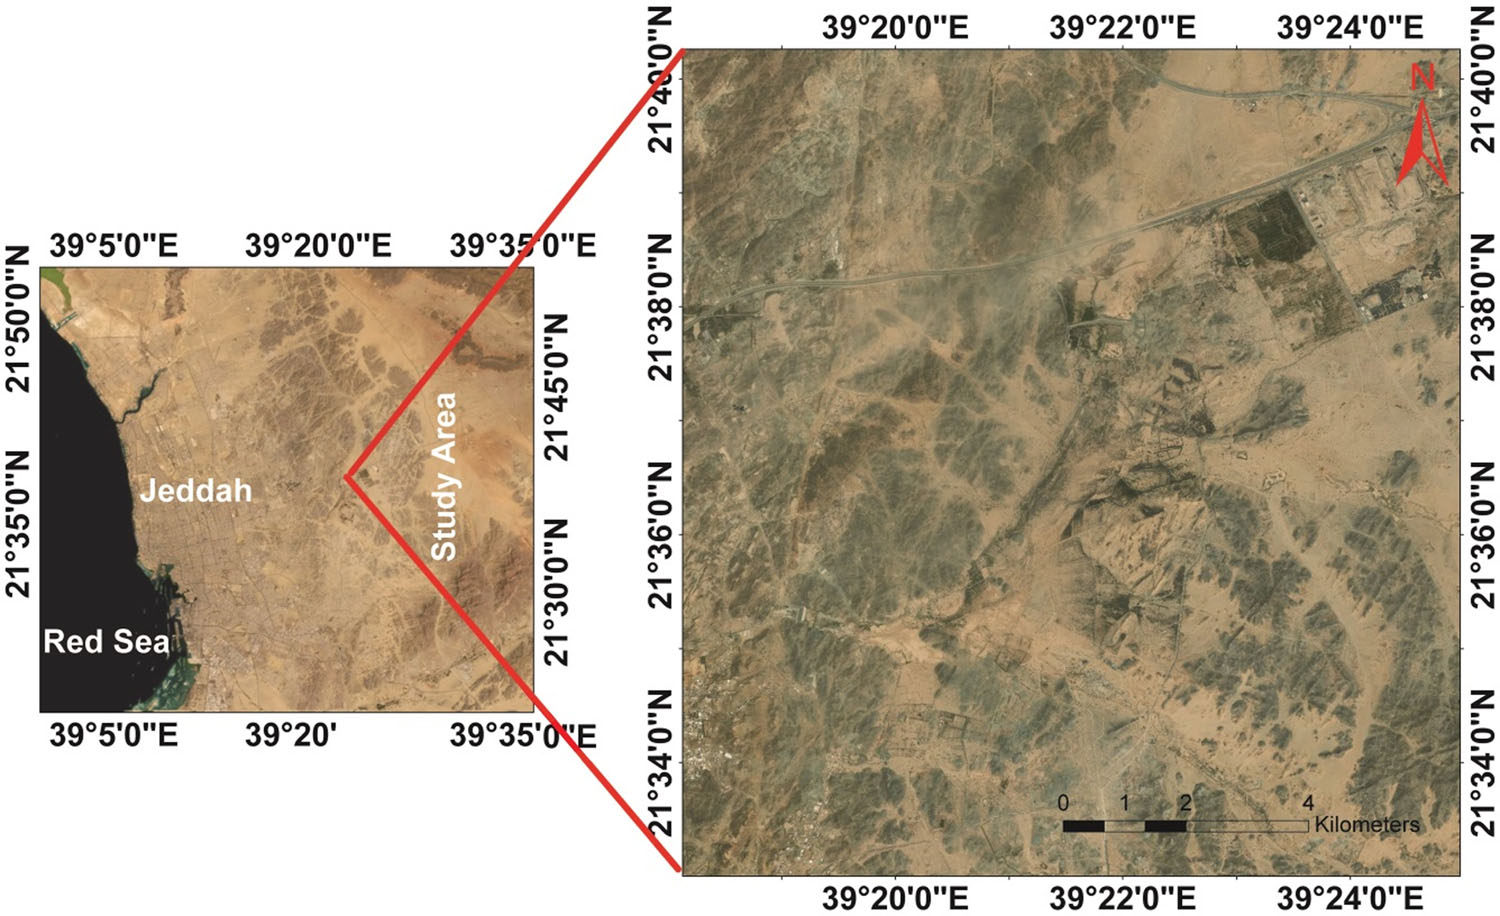
Location map of the study area.
1.1 Location and geology of the study area
The study area is located about 40 km in the east of Jeddah that is one of the major cities in Saudi Arabia (Figure 1). For more than past 10 years, wastewater has been collected in underground cesspools and then it is transported to the Wadi Bani Malik area through tankers [15,17]. Wadi Bani Malik is one of the most important structures of the area in terms of its size. It covers an area of 519 km2 with a maximum altitude of 500 m. The study area consists of alluvial aquifer with small stream branches merging into mainstream channel of the Wadi. It is an arid region with tropical type of climate. Precipitation is less than 250 mm/year while the summer temperature often reaches 48°C [18]. The drainage of the Wadi is semi-rectangular to dendritic type with its catchment area is mushroom shaped [19]. Lake Al Misk is formed in the upstream area of the Wadi and is the dumping site of the sewage of Jeddah City. Around 1,200 tankers dump the sewage water in the lake which has significantly increased in the size of the lake.
Wadi Bani Malik excellently crops out a thick sequence of volcanic, plutonic, and volcaniclastic rocks. These rocks are grouped into seven main units including Madrakah Formation, unassigned metagabbro and gabbro, Dighbij complex, Kamil diorite and quartz diorite, Hafnah complex, unassigned syenogranite and quaternary deposits, and mafic dykes (Figure 2). The study area crops out the rocks of Madrakah Formation and is characterized by basic and intermediate volcanic and related volcaniclastics which are metamorphosed to greenschist and amphibolite facies. These rocks are intruded by granite, granodiorite, and diorite [20].
![Figure 2
Geological map of Wadi Bani Malik area (Moore and Al-Rehaili 1989 [20]; Rehman et al. 2016d [21]).](/document/doi/10.1515/geo-2020-0176/asset/graphic/j_geo-2020-0176_fig_002.jpg)
2 Materials and methods
2.1 Methodology
In this work, the study area was divided into two areas (Area-1 and Area-2) depending upon the accessibility of the area (Figure 3). Area-1 covers the whole area lying along the downstream, and Area-2 includes the area located along the upstream of the lake/dam. The shallow geophysical techniques including ground magnetic, ERP, and VES were used as primary techniques to collect the data. Results of geophysical techniques were compared with the hydrogeological studies and chemical analysis of water samples collected from the wells.
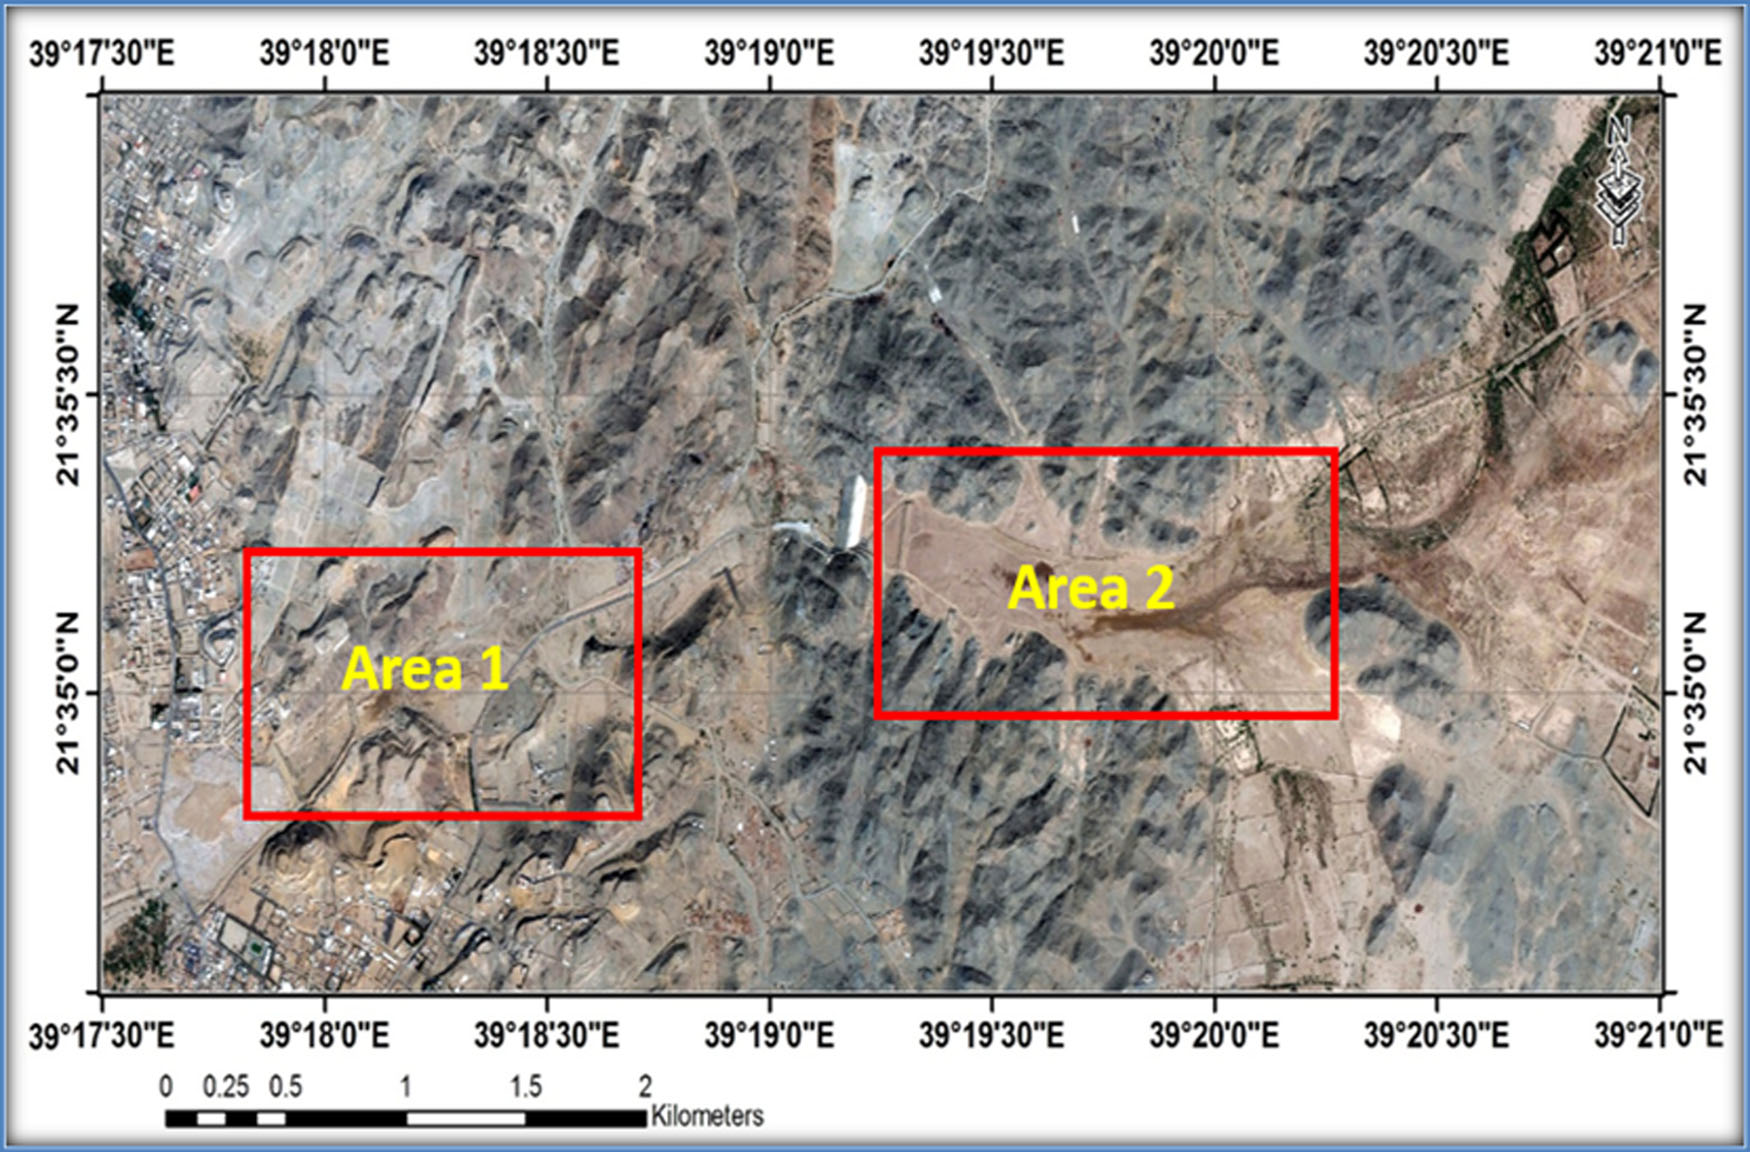
Location of upstream and downstream of the study area.
ERP data were acquired along seven profiles and named as ERP-1, ERP-2, ERP-3, ERP-4, ERP-5, ERP-6, and ERP-7 (result of ERP-1 is not used in this article). Six VES were performed in the area; VES-4, VES-5, and VES-6 were performed in Area-1 and VES-1, VES-2, and VES-3 in Area-2. In both the areas, magnetic data were acquired along North-South trending profiles having 5 m distances between stations and 20–30 m between profiles depending upon the accessibility of area (Figure 4). ERP and VES data were collected in the study area [15,16] along with ground magnetic data [1]. In situ, hydrogeological studies were made using a standard Solinst probe which includes the measurement of electrical conductivity (EC), salinity, water depth, and total dissolved solids (TDS).

Location of magnetic data (red lines), electrical resistivity profiles (blue lines), and vertical electrical soundings on both sides of the dam.
3 Results and discussion
3.1 Vertical electrical sounding
The VES data were plotted in RES1DVES software. The data were used to demarcate the different lithological layers and their thickness in the study area. VES data of the study area show the presence of four distinct lithological layers including surface layer, sandy layer, alluvial layer (mixed gravelly and sandy layer with minor clays), and basement boulder, from surface to bottom, respectively. The maximum depth of the investigation of VES is about 25 m in both Area-1 and Area-2. The thickness of interpreted layers varies significantly from point to point in the study area. The thickness of uppermost surface layer is nearly consistent in Area-1 and Area-2, and its thickness is less than 1 m. The lower sandy layer is thicker in upstream Area-2 as compared to Area-1. The thickness of sandy layer varies from 10 to 15 m in Area-2 and 4 to 11 m in Area-1. Sandy layer is underlain by alluvial layer that varies from 1.9 to 2.25 m in thickness in Area-2 and 1.9 to 13.9 m in Area-1. The lowermost gravelly layer consisting of basement boulders is thickly developed in Area-2, and its thickness ranges from 12.2 to 20 m. In upstream Area-1, the thickness of the lowermost layer varies from 7.8 to 12.2 m.
3.2 Electrical resistivity profiling
Resistivity profiling of the study area indicates pronounced variation in resistivity values of upstream and downstream areas. Resistivity variations with depth are used to develop the resistivity profiles of different aforementioned lithological layers. The minimum resistivity values of 1.6 (Ωm) were recorded in the sandy layer of VES-4 while maximum resistivity values of 10577.2 (Ωm) were calculated in the uppermost surface layer of VES-5 of Area-1.
3.3 Correlation of VES and ERP data
Among the total six VES points, five VES were acquired near or at same points of ERP except the VES-6. The VES and ERP show good mutual correlation in uppermost layers including uppermost surface layer and lower sandy layer except the VES-6. The uppermost surface layer is generally highly resistive and is mutually comparable to a great extent; however, its values are variable in Area-1 (123.1 Ωm at VES-4 to 10577.2 Ωm at VES-5) and Area-2 (243.1 Ωm at VES-3 to 3749.7 Ωm at VES-1). The lower sandy layer is generally characterized by the very low resistivity values in both Area-1 (1.5 Ωm at VES-4 to 14.3 Ωm at VES-6) and Area-2 (3.8 at VES-3 to 9.4 at VES-1). The lower sandy layer shows very low resistance and indicates filling of saline water. The third alluvial layer exhibits a very diverse resistivity (very low to low except the VES-6) and does not show good correlation. In contrary to alluvial layer, the lowermost gravelly layer is generally very resistive layer and shows good mutual correlation between VES and ER data.
3.3.1 Area-1
The VES-4 was carried out about 21 m away from the site of ERP-2 and about 113 m from the starting point of the same site. VES and ERP show a good mutual correlation in terms of thickness and variation in resistivity with depth (Figure 5). A low resistive sandy contaminated layer is marked up to 5 m depth that is followed by a thin sandy layer with relatively high resistivity values as compared to upper contaminated layer. However, no resistivity information is available below this sandy layer. Similarly, VES-5 and ERP-4 also exhibit a good mutual correlation. VES-5 was performed at the same location as of ERP-4 and about 403 m from the starting point of ERP-4. VES and ERP data of these profiles show the presence of a low resistive sandy contaminated layer below high resistive surface layer that extends to depth of 11.5 m. This contaminated layer is further underlain by a relatively high resistive layer consisting of sandy sediments.
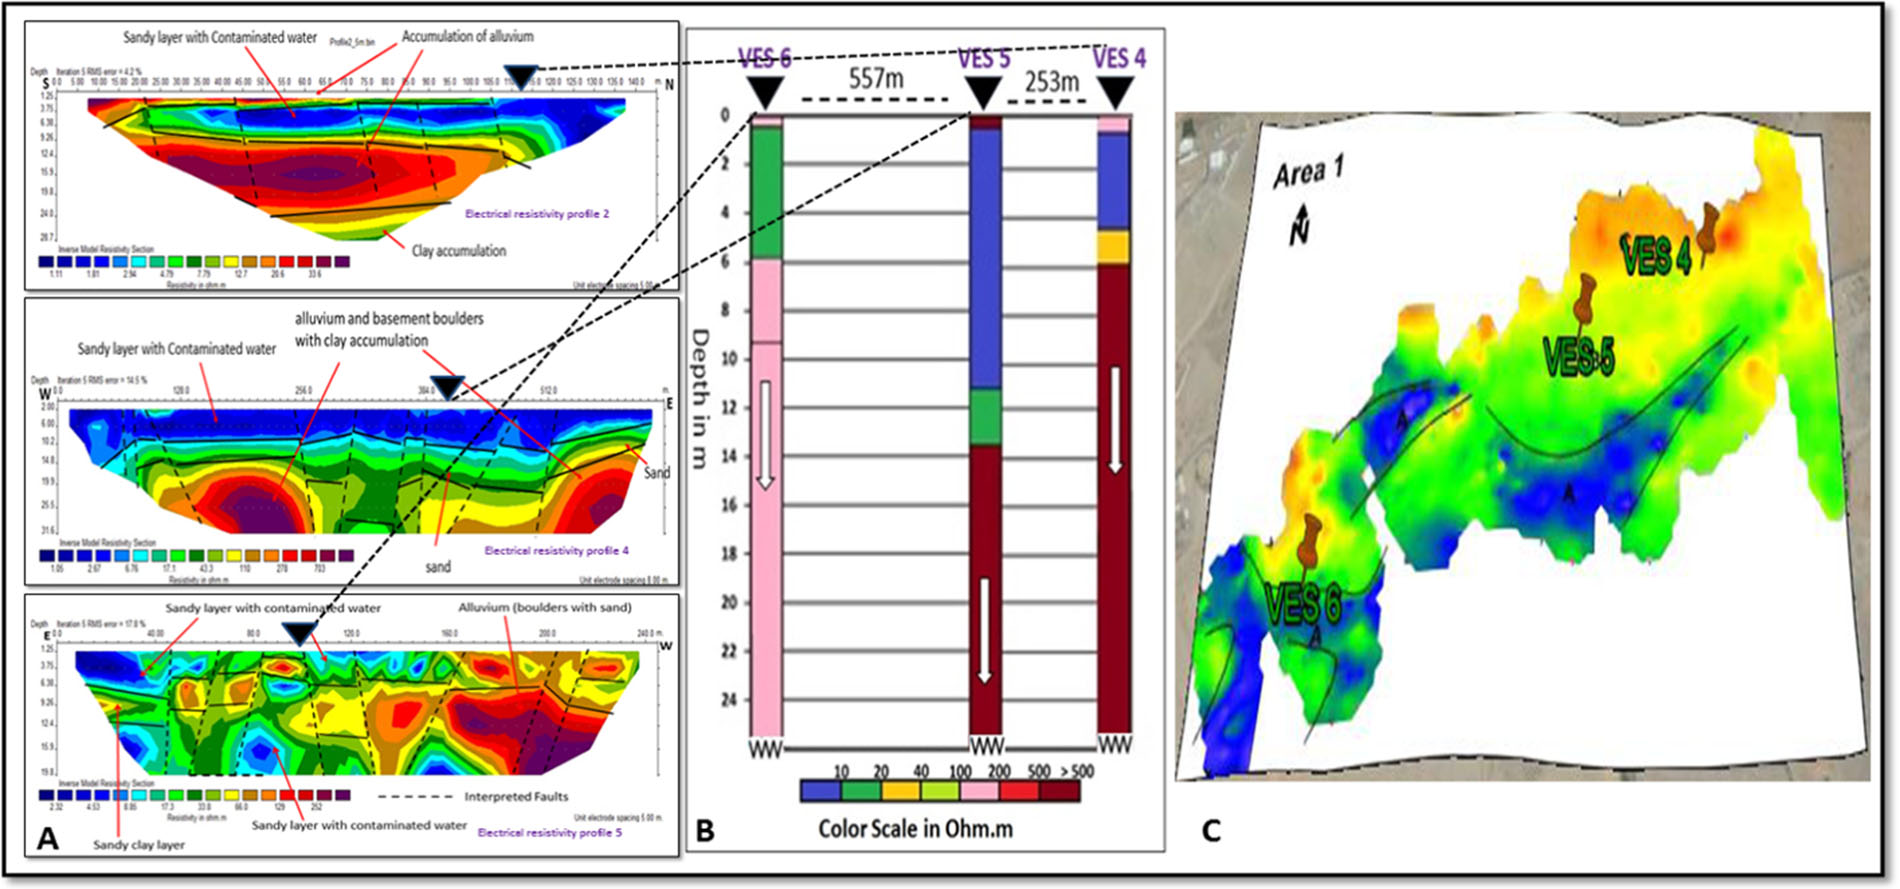
Correlation diagram of geophysical techniques on the downstream (Area-1) of the dam in Wadi Bani Malik area Jeddah, Saudi Arabia. (a) Electrical resistivity tomography, (b) vertical electrical sounding, and (c) total intensity magnetic map.
In contrary to these, the data of VES-6 were acquired 6.5 m away from the site of ERP-5 and about 100 m away in the east of starting point of aforementioned profile. In comparison with the above-mentioned profiles, VES-6 and ERP-5 are characterized by the missing low-resistivity contaminated layer below the high-resistivity surface layer. The sandy layer beneath the high resistive surface layer shows relatively high values of resistivity as compared to the other profiles of downstream and indicates low level of contamination in the water of this layer possibly because of the uplift of resistive block at this location.
3.3.2 Area-2
VES-1 was conducted 34 m away from the site of ERP-7 and about 715 m away from the starting point of ERP-7 (Figure 6). In both sections, surface high resistive layer is followed by a very low resistive sandy layer that extends up to the depth of about 16 m. The very low values of resistivity show high levels of contamination in this layer and indicate the presence of saline water. The data of VES-2 were acquired 12 m away from the location of ERP-6 profile, and it was located about 280 m away from the starting point of ERP-6. The data of VES-2 and ERP-6 indicate a very low resistive sandy layer with contaminated/saline water underneath the high resistive surface layer. It also shows a good correlation up to the lower sandy layer. This contaminated sandy layer is further replaced with a high resistive layer with increasing depth.
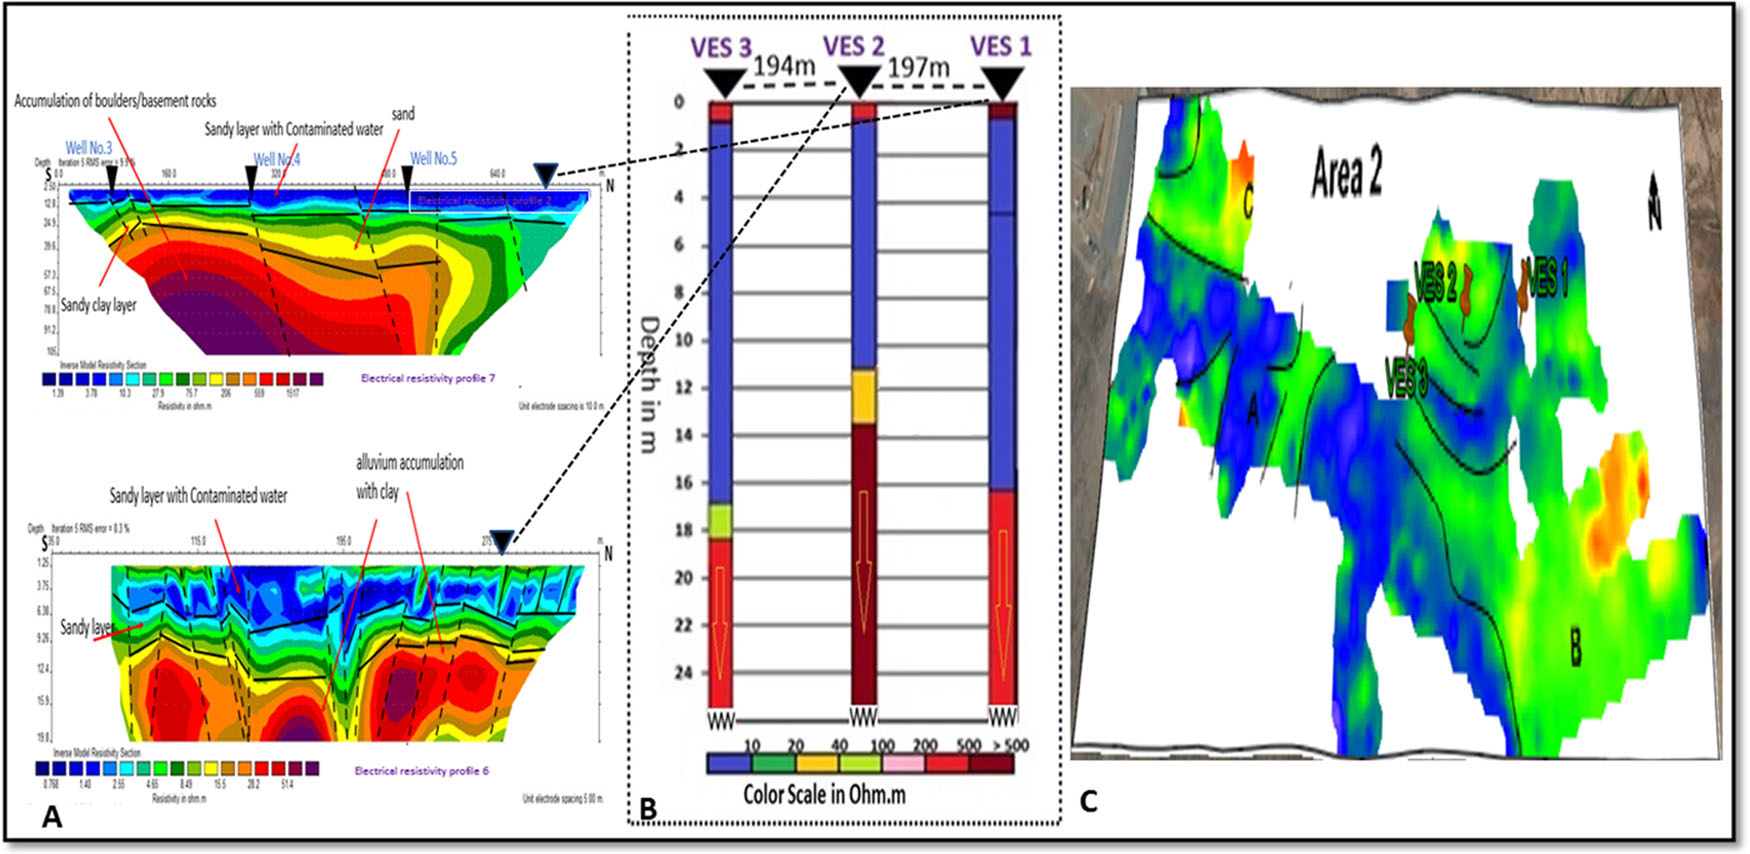
Correlation diagram of geophysical techniques on the upstream (Area-2) of the dam in Wadi Bani Malik area Jeddah, Saudi Arabia. (a) Electrical resistivity tomography, (b) vertical electrical sounding, and (c) total intensity magnetic map.
3.4 Correlation between VES results and magnetic intensity
The VES profiles acquired from the study area are located in the different magnetic areas and they show consistency and correlation with magnetic anomaly data of the study area (Figure 5).
3.4.1 Area-1
Among the three VES profiles of Area-1, the site of VES-4 is located in the high magnetic value area. High magnetic values are generally manifested by the presence of hard rocks of basement affinity in geological environments. The data of VES-4 profile are strongly consistent and identical with the magnetic intensity map of the area and show that the basement boulders/hard rocks of basement are present at very shallow depth (Figure 5).
The outcrop data collected from the vicinity of VES-4 site also confer the presence of same material as interpreted in the profile of VES-4. Remaining two VES profiles including VES-5 and VES-6 were acquired from the areas of moderate and low magnetic intensities. These profiles are also consistent with the magnetic intensities and are characterized by the presence of basement rocks/boulders at deeper levels in subsurface. Furthermore, the location of VES-6 is located along the drainage trend in Wadi which represents down thrown hanging wall of a normal fault.
3.4.2 Area-2
Among the total three VES profiles of Area-2, sites of two VES profiles including VES-1 and VES-3 are located in the low magnetic area as compared to the third profile VES-2 which lies in the high-magnetic intensity area (Figure 6). The results of VES profiles are consistent with the magnetic intensity map. The VES-2 profile clearly indicates the presence of the basement rock/boulder layer at shallow depth as compared to other profiles of Area-2.
3.5 Correlation of ERP and hydrogeological parameters
Results of electrical resistivity profiles are compared with the results of in situ hydrogeological parameters of water samples of different monitory water wells located in the downstream and upstream areas of the study area (Figure 7).
![Figure 7
Correlation between electrical resistivity tomography and groundwater analysis results [21].](/document/doi/10.1515/geo-2020-0176/asset/graphic/j_geo-2020-0176_fig_007.jpg)
Correlation between electrical resistivity tomography and groundwater analysis results [21].
Among the in situ hydrological parameters, EC and depth of water table were used for the correlation with ER profiles. Well-1 that is located in the upstream Area-2 is characterized by 25.4 mS/cm value of EC that is very low as compared to Well-2 of Area-1 where it is calculated as 45.9 mS/cm.
Furthermore, the depth of water table in both well is also variable. The water table was recorded at the depth of 3.05 m in Well-1, and the depth of water table in Well-2 is estimated about 0.8 m that is quite shallow. Water table is recorded in the sand layer lying below the surface layer in both wells. The distance between these two wells is just 125 m, but their EC values and depths of water table show significant variation in quality of water and depth of host layer. The high value of EC in Well-2 shows the higher levels of contamination in groundwater in the Al Misk lake area in the downstream of dam as compared to upstream area. Furthermore, the storage of water in upstream of dam significantly elevated the water table to shallow depth through the seepage.
The nature of contamination can be investigated by the hydrochemical analysis; however, the accelerated levels of contamination in water are caused because of the dumping of untreated sewage water of Jeddah city in the dam. In comparison with downstream area, the lower EC values and less contamination in upstream area are the results of different factors like non-continuous nature of source and attenuation processes like adsorption. As this source is non-continuous, the contaminants had to travel through the unsaturated area to reach the receptor (groundwater). Further, the attenuation processes like adsorption significantly reduced the concentration of contaminants which result in the lowering of EC values. Moreover, three wells are also present along the profile of VES-7 at distances of 75, 280, and 515 m from the aforementioned profile with water depths of about 3.27, 3.51, and 1.15 m, respectively. Geophysical results show that the top of most part of sandy layer is contaminated with salt. This layer is variable in thickness, and generally, its thickness tends to increase northward. The results of hydrogeological parameters support the geophysical results. This layer has different contaminant concentration and TDS.
4 Conclusion
The integration of the geophysical technique results along with hydrological investigations is one of the most widely used methodologies for solving any geological or environmental problems. In the current study, the integration of geophysical results and hydrological investigations provided indubitable outcomes. The geophysical techniques comprised of ground magnetic method and VES and ERP. The VES and ERP data are in good mutual correlation. The VES profiles show consistency and correlation with magnetic anomaly data of the study area. The integration of geophysical techniques helps in identifying the contaminated layers in subsurface. Moreover, groundwater samples were collected for chemical analysis. The results of chemical analyses of water samples collected from the wells located in the downstream and upstream areas also supported geophysical findings. The integration of geophysical techniques and hydrochemical analyses suggests that the contaminating source is lying in the upstream of the reservoir. The hydrochemical analysis clearly indicates that the groundwater is not suitable for drinking and irrigation purposes.
References
[1] Rehman F. Environmental hazard evaluation of Almisk lake, using integrated geophysical techniques. Jeddah, Saudi Arabia: King Abdulaziz University; 2016 (unpublished), in Geophysics Department.Search in Google Scholar
[2] Rehman F, Cheema T, Abuelnaga HS, Harbi HM, Atef AH, Lisa M. Interpretation of groundwater chemistry data using multivariate statistical techniques. Glob Nest J. 2016;18(3):665–73.10.30955/gnj.001934Search in Google Scholar
[3] Hudson E, Kulessa B, Edwards P, Williams T, Walsh R. Integrated hydrological and geophysical characterisation of surface and subsurface water contamination at abandoned metal mines. Water Air Soil Pollut. 2018;229(8):256.10.1007/s11270-018-3880-4Search in Google Scholar PubMed PubMed Central
[4] De Carlo L, Berardi M, Vurro M, Caputo MC. Geophysical and hydrological data assimilation to monitor water content dynamics in the rocky unsaturated zone. Environ Monit Assess. 2018;190(5):310.10.1007/s10661-018-6671-xSearch in Google Scholar PubMed
[5] Pellerin L. Applications of electrical and electromagnetic methods for environmental and geotechnical investigations. Surv Geophys. 2002;23(2–3):101–32.10.1023/A:1015044200567Search in Google Scholar
[6] Appiah I, Wemegah DD, Asare VDS, Danuor SK, Forson ED. Integrated geophysical characterisation of Sunyani municipal solid waste disposal site using magnetic gradiometry, magnetic susceptibility survey and electrical resistivity tomography. J Appl Geophys. 2018;153:143–53.10.1016/j.jappgeo.2018.02.007Search in Google Scholar
[7] Giang NV, Kochanek K, Vu NT, Duan NB. Landfill leachate assessment by hydrological and geophysical data: case study NamSon, Hanoi, Vietnam. J Mater Cycles Waste Manag. 2018;20(3):1648–62.10.1007/s10163-018-0732-7Search in Google Scholar
[8] McLachlan PJ, Chambers JE, Uhlemann SS, Binley A. Geophysical characterisation of the groundwater–surface water interface. Adv Water Resour. 2017;109:302–19.10.1016/j.advwatres.2017.09.016Search in Google Scholar
[9] Rehman F, Abdelazeem M, Gobashy MM, Harbi HM, Abuelnaga H. Application of magnetic method to define the structural setting controlling the contaminated area of Wadi Bani Malik, east Jeddah, Saudi Arabia. Boll Geofis Teor Appl. 2019;60:1.Search in Google Scholar
[10] Al-Sayed E, El-Qady G. Evaluation of sea water intrusion using the electrical resistivity and transient electromagnetic survey: case study at Fan of Wadi Feiran, Sinai, Egypt. in EGM 2007 international workshop; 2007.10.3997/2214-4609-pdb.166.D_PP_10Search in Google Scholar
[11] Martínez-Pagán P, Faz A, Aracil E. The use of 2D electrical tomography to assess pollution in slurry ponds of the Murcia Region, SE Spain. Near Surf Geophys. 2009;7(1):49–61.10.3997/1873-0604.2008033Search in Google Scholar
[12] Maurya PK, Rønde VK, Fiandaca G, Balbarini N, Auken E, Bjerg PL, et al. Detailed landfill leachate plume mapping using 2D and 3D electrical resistivity tomography-with correlation to ionic strength measured in screens. J Appl Geophys. 2017;138:1–8.10.1016/j.jappgeo.2017.01.019Search in Google Scholar
[13] Van Hoorde M, Hermans T, Dumont G, Nguyen F. 3D electrical resistivity tomography of karstified formations using cross-line measurements. Eng Geol. 2017;220:123–32.10.1016/j.enggeo.2017.01.028Search in Google Scholar
[14] Akingboye AS, Ogunyele AC. Insight into seismic refraction and electrical resistivity tomography techniques in subsurface investigations. Rud Geol Naft Zb. 2019;34(1):93–111.10.17794/rgn.2019.1.9Search in Google Scholar
[15] Rehman F, Abuelnaga HS, Harbi HM, Atef AH. Application of vertical electrical sounding and water analysis for study the contaminated area at Al Misk lake, Eastern Jeddah, Saudi Arabia. Nat Environ Pollut Technol. 2016;15(1):311.Search in Google Scholar
[16] Rehman F, Abuelnaga HSO, Harbi HM, Cheema T, Atef AH. Using a combined electrical resistivity imaging and induced polarization techniques with the chemical analysis in determining of groundwater pollution at Al Misk lake, Eastern Jeddah, Saudi Arabia. Arab J Geosci. 2016;9(4):286.10.1007/s12517-016-2423-9Search in Google Scholar
[17] Ewea HASA. Hydrological analysis of flooding wastewater lake in Jeddah, Saudi Arabia. Meteorol Environ Arid Land Agric Sci. 2010;21:1–144.10.4197/met.21-1.9Search in Google Scholar
[18] Almazroui M, Dambul R, Islam MN, Jones PD. Principal components‐based regionalization of the Saudi Arabian climate. Int J Climatol. 2015;35(9):2555–73.10.1002/joc.4139Search in Google Scholar
[19] Qari MH. Geomorphology of Jeddah Governate, with emphasis on drainage systems. Earth Sci. 2009;20:1.10.4197/Ear.20-1.6Search in Google Scholar
[20] Moore T, Al-Rehaili M. Geologic map of the Makkah quadrangle, sheet 21D. Kingdom of Saudi Arabia, Saudi Arabian Directorate General of Mineral Resources Geoscience Map GM-107C, scale. 1(2,50,000); 1989.Search in Google Scholar
[21] Rehman F, Abuelnaga HSO, Harbi HM, Cheema T, Atef AH. Using a combined electrical resistivity imaging and induced polarization techniques with the chemical analysis in determining of groundwater pollution at Al Misk lake, Eastern Jeddah, Saudi Arabia. Arab J Geosci. 2016;9:286.10.1007/s12517-016-2423-9Search in Google Scholar
© 2021 Faisal Rehman et al., published by De Gruyter
This work is licensed under the Creative Commons Attribution 4.0 International License.
Articles in the same Issue
- Regular Articles
- Lithopetrographic and geochemical features of the Saalian tills in the Szczerców outcrop (Poland) in various deformation settings
- Spatiotemporal change of land use for deceased in Beijing since the mid-twentieth century
- Geomorphological immaturity as a factor conditioning the dynamics of channel processes in Rządza River
- Modeling of dense well block point bar architecture based on geological vector information: A case study of the third member of Quantou Formation in Songliao Basin
- Predicting the gas resource potential in reservoir C-sand interval of Lower Goru Formation, Middle Indus Basin, Pakistan
- Study on the viscoelastic–viscoplastic model of layered siltstone using creep test and RBF neural network
- Assessment of Chlorophyll-a concentration from Sentinel-3 satellite images at the Mediterranean Sea using CMEMS open source in situ data
- Spatiotemporal evolution of single sandbodies controlled by allocyclicity and autocyclicity in the shallow-water braided river delta front of an open lacustrine basin
- Research and application of seismic porosity inversion method for carbonate reservoir based on Gassmann’s equation
- Impulse noise treatment in magnetotelluric inversion
- Application of multivariate regression on magnetic data to determine further drilling site for iron exploration
- Comparative application of photogrammetry, handmapping and android smartphone for geotechnical mapping and slope stability analysis
- Geochemistry of the black rock series of lower Cambrian Qiongzhusi Formation, SW Yangtze Block, China: Reconstruction of sedimentary and tectonic environments
- The timing of Barleik Formation and its implication for the Devonian tectonic evolution of Western Junggar, NW China
- Risk assessment of geological disasters in Nyingchi, Tibet
- Effect of microbial combination with organic fertilizer on Elymus dahuricus
- An OGC web service geospatial data semantic similarity model for improving geospatial service discovery
- Subsurface structure investigation of the United Arab Emirates using gravity data
- Shallow geophysical and hydrological investigations to identify groundwater contamination in Wadi Bani Malik dam area Jeddah, Saudi Arabia
- Consideration of hyperspectral data in intraspecific variation (spectrotaxonomy) in Prosopis juliflora (Sw.) DC, Saudi Arabia
- Characteristics and evaluation of the Upper Paleozoic source rocks in the Southern North China Basin
- Geospatial assessment of wetland soils for rice production in Ajibode using geospatial techniques
- Input/output inconsistencies of daily evapotranspiration conducted empirically using remote sensing data in arid environments
- Geotechnical profiling of a surface mine waste dump using 2D Wenner–Schlumberger configuration
- Forest cover assessment using remote-sensing techniques in Crete Island, Greece
- Stability of an abandoned siderite mine: A case study in northern Spain
- Assessment of the SWAT model in simulating watersheds in arid regions: Case study of the Yarmouk River Basin (Jordan)
- The spatial distribution characteristics of Nb–Ta of mafic rocks in subduction zones
- Comparison of hydrological model ensemble forecasting based on multiple members and ensemble methods
- Extraction of fractional vegetation cover in arid desert area based on Chinese GF-6 satellite
- Detection and modeling of soil salinity variations in arid lands using remote sensing data
- Monitoring and simulating the distribution of phytoplankton in constructed wetlands based on SPOT 6 images
- Is there an equality in the spatial distribution of urban vitality: A case study of Wuhan in China
- Considering the geological significance in data preprocessing and improving the prediction accuracy of hot springs by deep learning
- Comparing LiDAR and SfM digital surface models for three land cover types
- East Asian monsoon during the past 10,000 years recorded by grain size of Yangtze River delta
- Influence of diagenetic features on petrophysical properties of fine-grained rocks of Oligocene strata in the Lower Indus Basin, Pakistan
- Impact of wall movements on the location of passive Earth thrust
- Ecological risk assessment of toxic metal pollution in the industrial zone on the northern slope of the East Tianshan Mountains in Xinjiang, NW China
- Seasonal color matching method of ornamental plants in urban landscape construction
- Influence of interbedded rock association and fracture characteristics on gas accumulation in the lower Silurian Shiniulan formation, Northern Guizhou Province
- Spatiotemporal variation in groundwater level within the Manas River Basin, Northwest China: Relative impacts of natural and human factors
- GIS and geographical analysis of the main harbors in the world
- Laboratory test and numerical simulation of composite geomembrane leakage in plain reservoir
- Structural deformation characteristics of the Lower Yangtze area in South China and its structural physical simulation experiments
- Analysis on vegetation cover changes and the driving factors in the mid-lower reaches of Hanjiang River Basin between 2001 and 2015
- Extraction of road boundary from MLS data using laser scanner ground trajectory
- Research on the improvement of single tree segmentation algorithm based on airborne LiDAR point cloud
- Research on the conservation and sustainable development strategies of modern historical heritage in the Dabie Mountains based on GIS
- Cenozoic paleostress field of tectonic evolution in Qaidam Basin, northern Tibet
- Sedimentary facies, stratigraphy, and depositional environments of the Ecca Group, Karoo Supergroup in the Eastern Cape Province of South Africa
- Water deep mapping from HJ-1B satellite data by a deep network model in the sea area of Pearl River Estuary, China
- Identifying the density of grassland fire points with kernel density estimation based on spatial distribution characteristics
- A machine learning-driven stochastic simulation of underground sulfide distribution with multiple constraints
- Origin of the low-medium temperature hot springs around Nanjing, China
- LCBRG: A lane-level road cluster mining algorithm with bidirectional region growing
- Constructing 3D geological models based on large-scale geological maps
- Crops planting structure and karst rocky desertification analysis by Sentinel-1 data
- Physical, geochemical, and clay mineralogical properties of unstable soil slopes in the Cameron Highlands
- Estimation of total groundwater reserves and delineation of weathered/fault zones for aquifer potential: A case study from the Federal District of Brazil
- Characteristic and paleoenvironment significance of microbially induced sedimentary structures (MISS) in terrestrial facies across P-T boundary in Western Henan Province, North China
- Experimental study on the behavior of MSE wall having full-height rigid facing and segmental panel-type wall facing
- Prediction of total landslide volume in watershed scale under rainfall events using a probability model
- Toward rainfall prediction by machine learning in Perfume River Basin, Thua Thien Hue Province, Vietnam
- A PLSR model to predict soil salinity using Sentinel-2 MSI data
- Compressive strength and thermal properties of sand–bentonite mixture
- Age of the lower Cambrian Vanadium deposit, East Guizhou, South China: Evidences from age of tuff and carbon isotope analysis along the Bagong section
- Identification and logging evaluation of poor reservoirs in X Oilfield
- Geothermal resource potential assessment of Erdaobaihe, Changbaishan volcanic field: Constraints from geophysics
- Geochemical and petrographic characteristics of sediments along the transboundary (Kenya–Tanzania) Umba River as indicators of provenance and weathering
- Production of a homogeneous seismic catalog based on machine learning for northeast Egypt
- Analysis of transport path and source distribution of winter air pollution in Shenyang
- Triaxial creep tests of glacitectonically disturbed stiff clay – structural, strength, and slope stability aspects
- Effect of groundwater fluctuation, construction, and retaining system on slope stability of Avas Hill in Hungary
- Spatial modeling of ground subsidence susceptibility along Al-Shamal train pathway in Saudi Arabia
- Pore throat characteristics of tight reservoirs by a combined mercury method: A case study of the member 2 of Xujiahe Formation in Yingshan gasfield, North Sichuan Basin
- Geochemistry of the mudrocks and sandstones from the Bredasdorp Basin, offshore South Africa: Implications for tectonic provenance and paleoweathering
- Apriori association rule and K-means clustering algorithms for interpretation of pre-event landslide areas and landslide inventory mapping
- Lithology classification of volcanic rocks based on conventional logging data of machine learning: A case study of the eastern depression of Liaohe oil field
- Sequence stratigraphy and coal accumulation model of the Taiyuan Formation in the Tashan Mine, Datong Basin, China
- Influence of thick soft superficial layers of seabed on ground motion and its treatment suggestions for site response analysis
- Monitoring the spatiotemporal dynamics of surface water body of the Xiaolangdi Reservoir using Landsat-5/7/8 imagery and Google Earth Engine
- Research on the traditional zoning, evolution, and integrated conservation of village cultural landscapes based on “production-living-ecology spaces” – A case study of villages in Meicheng, Guangdong, China
- A prediction method for water enrichment in aquifer based on GIS and coupled AHP–entropy model
- Earthflow reactivation assessment by multichannel analysis of surface waves and electrical resistivity tomography: A case study
- Geologic structures associated with gold mineralization in the Kirk Range area in Southern Malawi
- Research on the impact of expressway on its peripheral land use in Hunan Province, China
- Concentrations of heavy metals in PM2.5 and health risk assessment around Chinese New Year in Dalian, China
- Origin of carbonate cements in deep sandstone reservoirs and its significance for hydrocarbon indication: A case of Shahejie Formation in Dongying Sag
- Coupling the K-nearest neighbors and locally weighted linear regression with ensemble Kalman filter for data-driven data assimilation
- Multihazard susceptibility assessment: A case study – Municipality of Štrpce (Southern Serbia)
- A full-view scenario model for urban waterlogging response in a big data environment
- Elemental geochemistry of the Middle Jurassic shales in the northern Qaidam Basin, northwestern China: Constraints for tectonics and paleoclimate
- Geometric similarity of the twin collapsed glaciers in the west Tibet
- Improved gas sand facies classification and enhanced reservoir description based on calibrated rock physics modelling: A case study
- Utilization of dolerite waste powder for improving geotechnical parameters of compacted clay soil
- Geochemical characterization of the source rock intervals, Beni-Suef Basin, West Nile Valley, Egypt
- Satellite-based evaluation of temporal change in cultivated land in Southern Punjab (Multan region) through dynamics of vegetation and land surface temperature
- Ground motion of the Ms7.0 Jiuzhaigou earthquake
- Shale types and sedimentary environments of the Upper Ordovician Wufeng Formation-Member 1 of the Lower Silurian Longmaxi Formation in western Hubei Province, China
- An era of Sentinels in flood management: Potential of Sentinel-1, -2, and -3 satellites for effective flood management
- Water quality assessment and spatial–temporal variation analysis in Erhai lake, southwest China
- Dynamic analysis of particulate pollution in haze in Harbin city, Northeast China
- Comparison of statistical and analytical hierarchy process methods on flood susceptibility mapping: In a case study of the Lake Tana sub-basin in northwestern Ethiopia
- Performance comparison of the wavenumber and spatial domain techniques for mapping basement reliefs from gravity data
- Spatiotemporal evolution of ecological environment quality in arid areas based on the remote sensing ecological distance index: A case study of Yuyang district in Yulin city, China
- Petrogenesis and tectonic significance of the Mengjiaping beschtauite in the southern Taihang mountains
- Review Articles
- The significance of scanning electron microscopy (SEM) analysis on the microstructure of improved clay: An overview
- A review of some nonexplosive alternative methods to conventional rock blasting
- Retrieval of digital elevation models from Sentinel-1 radar data – open applications, techniques, and limitations
- A review of genetic classification and characteristics of soil cracks
- Potential CO2 forcing and Asian summer monsoon precipitation trends during the last 2,000 years
- Erratum
- Erratum to “Calibration of the depth invariant algorithm to monitor the tidal action of Rabigh City at the Red Sea Coast, Saudi Arabia”
- Rapid Communication
- Individual tree detection using UAV-lidar and UAV-SfM data: A tutorial for beginners
- Technical Note
- Construction and application of the 3D geo-hazard monitoring and early warning platform
- Enhancing the success of new dams implantation under semi-arid climate, based on a multicriteria analysis approach: Case of Marrakech region (Central Morocco)
- TRANSFORMATION OF TRADITIONAL CULTURAL LANDSCAPES - Koper 2019
- The “changing actor” and the transformation of landscapes