Water quality assessment and spatial–temporal variation analysis in Erhai lake, southwest China
-
Xuekai Chen
 ,
Bogen Li
,
Bogen Li

Abstract
For the implementation of lake ecological protection, understanding the water pollution status and spatio–temporal variation of water quality has become the most important thing for water safety in the basin. To analyze the water quality in recent years, water quality data in Erhai lake from 2013 to 2017 were first collected from typical nine monitoring stations. Based on the comprehensive water quality index (WQI) method, the temporal and spatial variation characteristics of water quality in Erhai lake were analyzed, and the main factors affecting water quality in Erhai lake were explored. The results indicated that the water quality of Erhai lake was worse than its target water quality, and total nitrogen (TN) and total phosphorus (TP) exceeded the Class Ⅱ standards (TN: 0.5 mg L−1, TP: 0.025 mg L−1) of China’s Environmental Quality Standard for Surface Water (GB3838-2002). In terms of changes across seasons, the overall lake water quality in the dry season was better than that in the wet season, and TN and TP reached the peak value in September. In terms of spatial distribution, water quality of the northern area was better than that of the southern area in the dry season, whereas water quality of the southern area was better than that of the northern area in the wet season. At present, Erhai lake is at a critical turning point of water eutrophication, and its nutrition status is mainly affected by both nitrogen and phosphorus. The pollution load from the land area is the main factor affecting the deterioration of Erhai lake. Our results can provide a scientific basis for the treatment of the water environment of Erhai lake.
1 Introduction
Being one of the important resources that is closely associated with human activities, river and lake water resources play an important role in human and biological health [1,2]. Due to the increase in human activities, a large amount of tourist, industrial, and agricultural nonpoint pollution and domestic sewage flow along with surface runoff into river and lake systems, directly resulting in a sharp deterioration of the water quality of the corresponding water ecosystems [3]. To protect the water quality of river and lake systems and maintain their healthy and sustainable development, the selection of a fast and efficient water quality assessment method is important. This can enable regulatory bodies to comprehensively master the water quality of river and lake systems, identify the main factors affecting the water quality, and implement appropriate treatment measures [4,5].
Water quality assessment is a qualitative or quantitative assessment of the water quality of river and lake systems by calculating the measured data of the physical, chemical, nutrient, and biological indicators of such systems according to certain evaluation standards [6]. Among the various water quality assessment methods, the water quality index (WQI) plays an important role in aiding water resource management and has been widely applied in the water quality assessment research of the surface and ground water [7,8,9]. The use of WQI was initially proposed by Horton [10] and Brown et al. [11]. This method takes into account the degree of influence of various water quality indicators on the water environment quality and assigns weight coefficients to different water quality indicators in order to reasonably reflect the comprehensive status of the water body [12,13]. From a global perspective, many water quality assessment methods are based on the WQI method, such as the Canadian Council of Ministers of the Environment Water Quality Index [14], the British Columbia Water Quality Index [15], and the Oregon Water Quality Index [16]. These indices were established based on the US National Sanitation Foundation Water Quality Index [17]. At present, WQI is widely used in the field of water environment worldwide, for example, Lumb et al. [18], Nong et al. [19], Karunanidhi et al. [20], Ma et al. [21], and Lin et al. [22] used the WQI method to identify the main water pollution factors of different water bodies from a number of indicators, providing a direction for local water environment management and treatment. It can be observed that the WQI method is highly representative and can be promoted in the evaluation of river and lake water systems.
In recent years, on the one hand, how to quickly and accurately obtain a calculation method that better reflects water quality based on WQI has become a study hotspot [23]. It is more typical to use mathematical methods to identify key water quality parameters to establish a WQImin model, which makes it possible to reduce the cost of water quality testing and reduce environmental pollution caused by chemical reagents in the water quality evaluation process. Studies have shown that WQImin and WQI show a high degree of linear correlation, which can better reflect the changes in the WQI. This method has been widely used in China’s South-to-North Water Diversion Project [19], Taihu lake [24], and Chaohu lake [25]. On the other hand, with the development of machine learning algorithms, many scholars combine the algorithms with WQI to evaluate and analyze the water quality change characteristics. Hatvani et al. used combined cluster and discriminant analyses to study the nutritional status and driving factors of the largest shallow lake in Central Europe at different periods [26]. Granata et al. evaluated the trend of the wastewater quality indicators based on support vector regression and regression trees [27]. Oladipo et al. combined fuzzy logic and WQI to assess the water quality in a zone of Nigeria [28]. In general, water quality evaluation and analysis based on WQI is an important method for basin water environment management.
Erhai lake is the second largest freshwater lake in the Yunnan Province of China and undoubtedly has significant importance for the aerial hydrological cycle, ecosystem stability, and socioeconomic development. Research shows that the Erhai lake water quality has changed from the stable Class I–II standards of China’s Environmental Quality Standard for Surface Water (GB3838-2002) in 1980s to Class III status at present. Besides, Class IV status and even Class V status are speculated to appear locally in the lake area during the year. Thus, the Erhai lake water quality tends to decrease significantly [29]. According to the monitoring records, Erhai lake experienced large-scale outbreak of algal blooms in 1996, 2003, and 2013. Particularly, in 2013, the blooms evolved from local algal blooms in the bay to algal blooms in the whole lake, with an area of close to 60% of the whole lake [30]. Notably, being a lake in the early stage of eutrophication, it is at the critical turning point of the transformation of water eutrophication state. It would therefore be of significance to study the water quality and the main controlling factors of eutrophication in the lake area for exploring the trend of lake eutrophication [31]. Some studies have been conducted to explore and verify the water quality status of Erhai lake from a single water quality indicator [29,32]. Nevertheless, further study is still necessary for the following reasons: In the face of the rapid socioeconomic development of the Erhai lake basin, the temporal and spatial variation characteristics of the lake’s comprehensive water quality should be further studied. At the same time, the key factors affecting the fluctuation of the lake’s water quality should be further clarified.
Based on the water quality monitoring data of Erhai lake, this study has the following objectives: (i) It seeks to understand the variation characteristics of the water quality at different temporal and spatial scales, and reveal the variation law of the water quality in Erhai lake. (ii) We have attempted to find the important factors affecting the development of lake eutrophication. (iii) The variation of water quality in Erhai lake has been explained from two perspectives: the variation characteristics of pollution load into the lake and the variation characteristics of lake hydrodynamics.
2 Materials and methods
2.1 Study area
The Erhai lake basin is located in Dali City and Eryuan County, Yunnan Province of China and belongs to the Lancang River Basin (Figure 1). It has an area of 2,565 km2 and a population of 400 per km2 and is situated on an altitude of 1,960–4,040 m. At the normal water level of 1,974 m (Yellow Sea elevation), the lake has an area of 249.8 km2, average water depth of 10.5 m, and storage capacity of 28.8 × 10⁸ m3. The meteorological conditions of the basin include an annual average temperature of 16.4°C, the annual average precipitation and evaporation are 928.7 and 1099.3 mm, respectively, and the annual sunshine percentage is 48.80% [33]. In terms of the hydrological conditions, there are 28 main rivers flowing into the lake: Miju, Yongan, and Luoshi in the north; 18 creeks of Cangshan in the west; Fengweijing, Yulong, Nancun, and Xiahejing in the east; and Boluo and Baitai in the south of the basin [34].
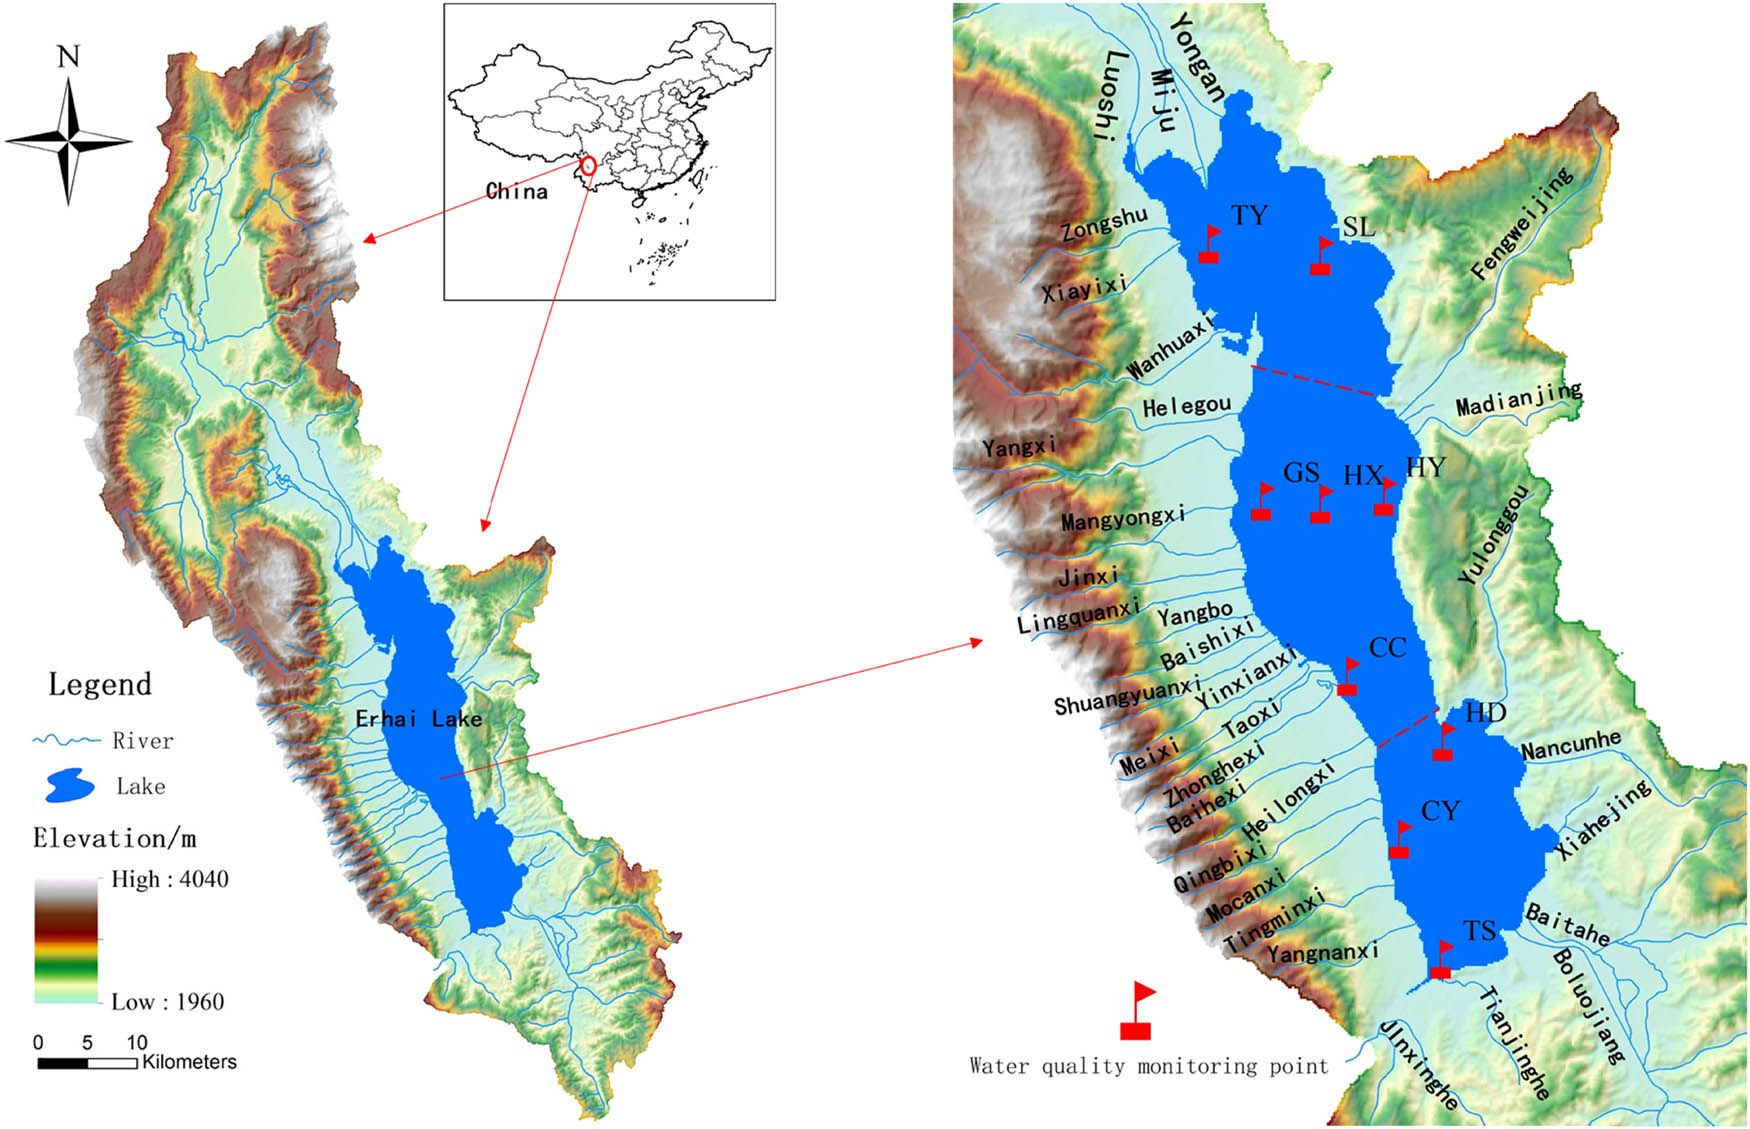
Geographical location and water quality monitoring points of Erhai lake.
2.2 Sample collection and laboratory analysis
Considering the integrity of water quality monitoring data of the lake area, TY and SL in the northern part of Erhai lake, GS, HX, HY, and CC in the middle, and HD, CY, and TS in the south were selected, and their spatial distribution is shown in Figure 1. The research was conducted from 2013 to 2017, and water samples were collected in February, April, August, and October that represent the water quality of winter, spring, summer, and autumn, respectively. Water temperature (WT), pH, dissolved oxygen (DO), Secchi depth (SD), total nitrogen (TN), total phosphorus (TP), chemical oxygen demand (CODMn), and chlorophyll a (Chla) were selected as the parameters to evaluate the water environment in the lake area.
Water samples were collected in sunny or cloudy weather conditions to minimize the impact of rainfall on the water quality. YSI EXO2 (USA) was used to monitor WT, pH, DO, and SD in situ. According to the water quality sampling technical regulations (SL 187–96), water samples of 50 cm under water were collected in plastic buckets flushed with water samples and washed with acid. During collection and transportation, water samples were stored at 2–5°C. Based on the specifications of HJ636-2012, GB/T11893-1989, and HJ897-2017 standards, TN, TP, CODMn, and Chla were analyzed.
2.3 Calculation of WQI
The WQI was deduced as follows: Initially, each water quality parameter was given a different absolute weight (w i ). The absolute weights were set at levels 1–4, representing low-to-high categories, indicating the impact of a certain water quality parameter on the water quality in the study area. Weight level 4 is assigned to the most sensitive water quality parameter that can characterize the water quality of the lake [35]. In this study, the highest absolute weight 4 was assigned to TN and TP. The main reasons are as follows: First, for plateau inland lakes, nitrogen and phosphorus nutrients are important factors affecting the nutritional status of lakes; second, for Erhai lake, TN and TP are over-standard items relative to the target water quality. CODMn was assigned the absolute weight of 3, mainly considering the impact of the different forms of nitrogen on the algae and the impact of organic matter content on the water quality. The DO level of Erhai lake is always at a high level, so it was given an absolute weight of 2. Relative weight (W i ) indicates the importance of water quality parameters relative to other indicators and is calculated as shown by equation (1).
where W i is the relative weight, w i is the absolute weight of each water quality parameter, and n is the total number of water quality parameters.
q i is defined as the quality rating of each water quality parameter, whose essence is the ratio between the measured concentration value and the corresponding standard limit value of the water quality parameter in the surface water quality standard (GB3838-2002). It is calculated from equation (2).
where C i is the concentration (mg L−1) of a certain water quality parameter monitored at each water quality sampling point and S i is the limits for water quality concentration in lakes. Erhai lake is the Cangshan-Erhai National Nature Reserve according to the water function zoning of Dali Prefecture, and its water quality target is Class II. The corresponding standard limits of water quality parameters are presented in Table 1 as the China Environmental Quality Standard for Surface Water (GB3838-2002).
Target standard limits of surface water quality (Class II)
| WQI | TN (mg L−1) | TP (mg L−1) | CODMn (mg L−1) | DO (mg L−1) |
|---|---|---|---|---|
| Target standard limits | 0.5 | 0.025 | 4 | 6 |
In order to calculate WQI, SC i was defined as the sub-score of each water quality parameter, and then SC i and WQI were calculated from equations (3) and (4).
The calculated WQI was divided into three levels [17]: WQI <0.7, good water quality; 0.7 ≤WQI <0.8, moderate water pollution; and WQI ≥0.8, high water pollution.
MS Excel 2016 was used to process the water quality monitoring data and SPSS 17.0 for Pearson correlation analysis [36]. In addition, in this study, based on the water quality data of the monitoring points, the Kriging interpolation method [37] in ArcGIS 10.2 was used to realize the conversion of point data to surface data. Based on the research objectives, the research framework of this study is shown in Figure 2.

Study framework.
3 Results
3.1 Time variation law
The change in the WT within the year showed an initial increase and a subsequent decrease (Figure 3(a)). The average WT within a year was 17.9°C, the highest value in August was 23.6°C, and the lowest value appeared in February to be 11.1°C. The annual average WT difference was 12.5°C. WT is suitable for algal growth, whether it is the fluctuation range of WT during the year or the average temperature difference during the year.
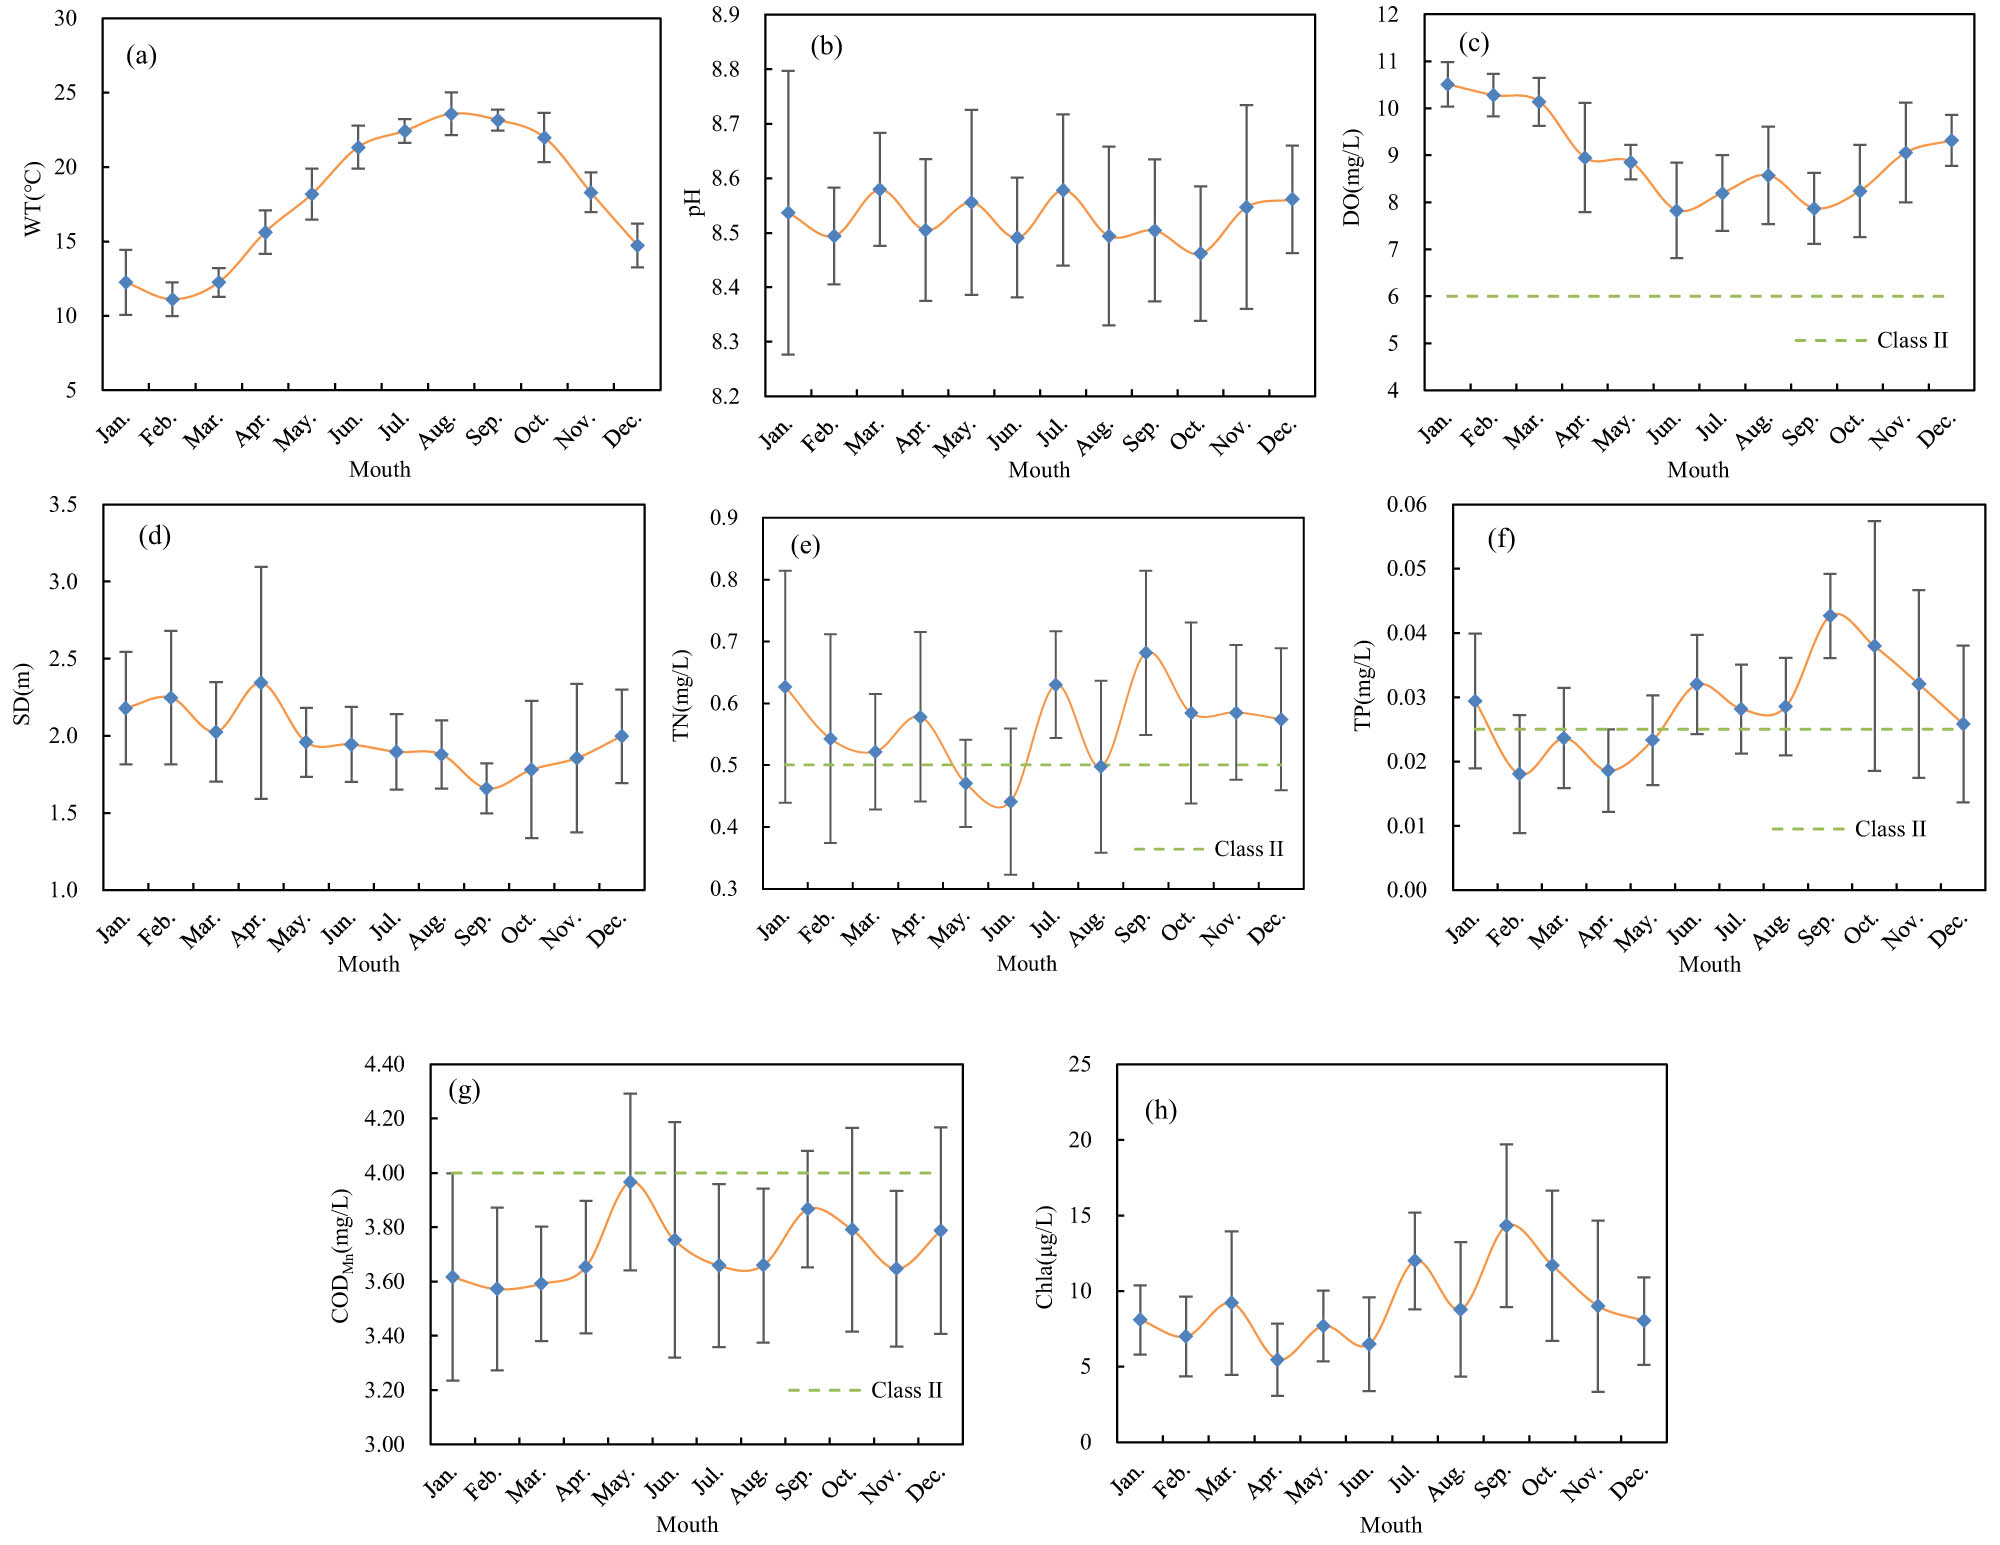
Trend of WT (a), pH (b), DO (c), SD (d), TN (e), TP (f), COD (g) and Chla (h) of Erhai lake during the year. Each point represents the average value of the water quality monitoring data of all stations in the lake, and the error bars represent the maximum, minimum, and average values of the monitoring data.
The pH value ranged between 8.46 and 8.58 in the course of the study (Figure 3(b)). With the period of January–July, the pH value change was relatively stable. Within August–October, the pH value decreased slightly, and an increase in the pH value was seen in November–December. This was mainly affected by the algal respiration in the lake area and the water from the basin. In August–October, the WT in the lake area was relatively high. A large number of nitrogen and phosphorus pollutants brought by the basin runoff provided nutrients for algal growth, and the HCO3 formed by CO2 during the algae respiration caused a reduction in the pH value of the lake water. In addition, August–October coincided with the wet season in the Erhai lake basin, and the inflow of water from the land area played a role in diluting the pH of the lake water body.
DO showed a trend of an initial decrease, followed by a subsequent increase, which was relatively high in the dry season and less in the wet season (Figure 3(c)). The minimum appeared in June at 7.83 mg L−1, and the maximum appeared in January at 10.5 mg L−1. The reason for this phenomenon is that during the wet season, as the inflow of water increases, the pollutants carried by the river also increase, and so does the oxygen consumption of the water. The DO minimum values were observed in June and September. In the dry season, the pollution load of the lake from the basin was smaller, and the oxygen consumption of the water in the lake area also decreased, so the water DO in the lake area was correspondingly higher coupled with the disturbance of the wind field.
The SD change in the year was divided into three stages (Figure 3(d)). In the first stage, during January–April, SD showed an upward trend, which was mainly due to the lower pollution load in the lake, low algal abundance in the lake area, relatively low wind speed in the lake area, and a smaller disturbance to the bottom sediments. The maximum SD was observed in April, being 2.34 m. The second stage was in the period of May–September. During this period, the basin water increased gradually and correspondingly the quantity of sediment and pollutants into the lake. Besides, the large quantity of output of nitrogen, phosphorus, and other nutrients also improved the abundance of algae. All these factors contributed to the decrease in the lake SD, and the annual minimum SD was observed in September, which was 1.66 m. The third stage was in the period October–December. With a decrease in the base precipitation, the sediment and pollution load into the lake also decreased, and the decrease of temperature led to the decrease in the algal activity intensity, thereby leading to a rise in the SD. The average value of Erhai lake water transparency for many years was 1.98 m, which is already in the state of lake eutrophication.
The TN change in the year showed an initial decreasing trend, followed by an increasing trend and then being stable (Figure 3(e)). Specifically, in the first stage of January–May, TN showed a downward trend, and a small peak appeared in April. In this period, the maximum value of TN appeared in January, whereas the minimum value appeared in May, with a value between 0.47 and 0.63 mg L−1. The second stage was in the period July–September, wherein TN showed an upward trend, and the double peak value appeared in July and September. In this period, the maximum value of TN appeared in September, whereas the minimum value appeared in June, with a value between 0.44 and 0.68 mg L−1. The third stage was in the period October–December when TN changed the trends to be stable, and the maximum value of TN appeared in November, whereas the minimum value appeared in December, with a value between 0.57 and 0.59 mg L−1. Considering the TN alone, the concentration of TN in months except for May and June did not reach the Class II water standard, which indicated that the TN load in the lake exceeded the standard seriously. Generally, in January–June, there is less basin pollution, less active aquatic biological activities due to lower temperature, and smaller disturbance of wind field to sediment, which together cause the decrease of the TN concentration in Erhai lake water. Notably, middle to end of March and the first 20 days of April are the time for crop harvesting, crop planting, and large area application of base fertilizers in the Erhai lake basin. Although the volume of the basin water is relatively low, the pollution load into the lake is relatively large, which resulted in a small peak of TN concentration in the lake water in April. With the advent of the rainy season, the pollution from the basin gradually increased, and the increase of temperature led to the strengthening of nitrogen fixation and ammoniation of aquatic plants, which resulted in the increasing trend of TN concentration in this period. In October–December, the TN concentration of this period was always at a high level due to the decomposition of algae and resuspension of sediment disturbed by the wind field.
TP change in the year showed a trend of an initial increase and a subsequent decrease, and the concentration fluctuated within 0.018–0.043 mg L−1 (Figure 3(f)). The first peak was observed in September, 0.43 mg L−1, the second peak in June, 0.032 mg L−1, and the third peak in March, 0.024 mg L−1. In March, due to the loosening of farmland soil caused by crop harvesting, microorganisms in the soil release a lot of nutrients from the decomposition of crop residues. Although the precipitation was less in this period, the deposition of farmland soil close to both sides of the river was larger, and the decomposition of algal residues released a large amount of phosphorus. In June, the precipitation increased, and phosphorus pollutants carried by the basin water went into the lake water, resulting in a higher concentration of TP. In September, a large amount of nutrients is needed for algal growth, forming a “pumping” effect on the sediment, and thus a large amount of phosphorus in the sediment was released.
The concentration of CODMn varied between 3.97 and 3.57 mg L−1 (Figure 3(g)). The first peak was observed in May, 3.97 mg L−1, and the second peak in September, 3.87 mg L−1. The concentration change of CODMn was mainly affected by the organic matter and algal abundance in the lake area. May is the peak period of agricultural planting and fertilization in the Erhai lake basin, and the short period of rainfall flushed the fertilizer residues on the surface of the soil into Erhai lake. With the increase of organic matter into the lake and algal biomass in July, the CODMn showed a rapid increasing trend. After October, organic pollutants entering the lake and algal biomass decreased, and the CODMn decreased accordingly. The decomposition of aquatic plant residues in December increased the content of organic pollutants, and the CODMn increased slightly.
The annual average value of Chla was 8.98 μg L−1. In January–June, the Chla concentration fluctuated with no significant difference between months (P > 0.01). In July–September, the Chla concentration showed a significant upward trend. The main peak value of Chla concentration was observed in September, 14.33 μg L−1, and the second peak value was observed in July, 12.10 μg L−1. In October–December, the Chla concentration showed a downward trend. The time change process is shown in Figure 3(h).
3.2 Spatial characteristics
In February (winter), the spatial distribution of WT followed the sequence northern area > central area > southern area. In April (spring), the spatial distribution of WT followed the sequence central area > northern area > southern area. In August (summer), the spatial distribution of WT followed the sequence northern area > central area > southern area. In October (autumn), the spatial distribution of WT followed the sequence northern area > central area > southern area. Generally, there was no significant difference in the WT among different areas of Erhai lake, and the relatively high-temperature area was concentrated in the northern and central areas, which was mainly affected by the water from the basin and the disturbance of dynamic conditions of the lake water. In the northern area, human activities are concentrated and there is huge amount of water entering the lake, which exhibited a greater impact on WT. Affected by the wind field in the southern region, the circulation phenomenon is obvious, and the lake water body is more disturbed, resulting in relatively low WT. See Supplementary Material A for the spatial distribution of WT in different seasons.
In February (winter), the spatial distribution of pH followed the sequence central area > northern area > southern area. In April (spring), the spatial distribution of pH followed the sequence northern area > central area > southern area. In August (summer), the spatial distribution of pH followed the sequence northern area > southern area > central area. In October (autumn), the spatial distribution of pH followed the sequence northern area > southern area > central area. Besides, the pH value of water in the northern part of the Erhai lake is relatively high, which could be affected by the water from the basin. The pH value of water in the central part is relatively low, which is mainly due to the spatial distribution of the aquatic plants. Emergent and submerged plants are concentrated in the western part of Erhai lake. See Supplementary Material A for the spatial distribution of pH in different seasons.
In February (winter), the spatial distribution of DO followed the sequence southern area > northern area > central area. In April (spring), the spatial distribution of DO follows the sequence central area > southern area > northern area. In August (summer), the spatial distribution of DO followed the sequence northern area > central area > southern area. In October (autumn), the spatial distribution of DO followed the sequence northern area > southern area > central area. Generally, DO was mainly affected by the pollution from the basin and the hydrodynamic conditions of the lake. In the dry season (February, April), due to the relatively large inflow of water in the north area of the basin, the pollution load into the lake increased significantly, and the oxygen consumption of pollutants resulted in a relatively low DO content in the north area of the lake. In the wet season (August, October), there was an increase in the pollution load into the lake. In the western part of basin, pollutants accumulated in the river flow into the water body along with the surface runoff, and the DO concentration in the water body was relatively low in the southern part, where the lake outlet was located. In addition, due to the algal growth in the central part of the lake and the influence of the southwest dominant wind direction, a large quantity of phytoplankton accumulates in the west bank of the lake, resulting in a relatively low DO content in the central part of the lake. See Supplementary Material A for the spatial distribution of DO in different seasons.
In February (winter), the spatial distribution of SD followed the sequence southern area > central area > northern area. In April (spring), the spatial distribution of SD followed the sequence central area > northern area > southern area. In August (summer), the spatial distribution of SD followed the sequence northern area > central area > southern area. In October (autumn), the spatial distribution of SD followed the sequence southern area > central area > northern area. Generally, in February, SD in the north part of the lake area was mainly affected by the nutrients such as nitrogen and phosphorus and sediment from the watershed. In April, the south of the lake area was disturbed by the wind field, and the water transparency was low. In August, under the influence of hydrodynamic conditions of the lake, phytoplankton was concentrated in the middle and south of the lake area, resulting in low SD. In October, with the decrease of basin precipitation, the pollution load in the northern part of the basin was gradually highlighted. Meanwhile, the decomposition of the submerged plants also aggravated the lower SD in the northern part of the lake. See Supplementary Material A for the spatial distribution of SD in different seasons.
In February (winter), the spatial distribution of TN followed the sequence southern area > central area > northern area. In April (spring), the spatial distribution of TN followed the sequence southern area > northern area > central area. In August (summer), the spatial distribution of TN followed the sequence northern area > central area > southern area. In October (autumn), the spatial distribution of TN followed the sequence northern area > central area > southern area. Generally, in the wet season (August, October), the northern part and the central part of Erhai lake consists of a high concentration of TN. In the dry season (February, April), the southern area of Erhai lake possessed a high concentration area of TN. Two factors contribute to this phenomenon. One is that in the dry season, the southern part of Erhai lake was greatly affected by the wind field. The disturbance of water body promoted the sediment resuspension, and a large amount of dissolved nitrogen was diffused into the water body. During this period, because of the relatively small amount of pollution from the basin, the endogenous release had a greater influence on the change of the TN concentration in the lake water. Second, in the wet season, the amount of pollution from the basin increased gradually, along with the concentration of TN in the north and middle of the lake. In this period, the input of basin pollution load greatly affected the change of TN concentration in the lake. Generally, the annual high concentration area of TN in Erhai lake shifted from the south to the north. See Supplementary Material A for the spatial distribution of TN in different seasons.
Like the spatial distribution of TN, in February (winter), the spatial distribution of TP followed the sequence southern area > central area > northern area. In April (spring), the spatial distribution of TP followed the sequence southern area > central area > northern area. In August (summer), the spatial distribution of TP followed the sequence northern area > central area > southern area. In October (autumn), the spatial distribution of TP followed the sequence northern area > central area > southern area. Generally, in the dry sea (February, April), the southern area of the Erhai lake consisted of a high concentration area of TP, and in the wet season (August, October), the northern area of Erhai lake consisted of a high concentration of TP. Two factors contribute to this phenomenon. First, in the dry season, due to the influence of the wind field, the water disturbance in the southern area resulted in the release of phosphorus from the sediments. Second, in the wet season, with the increase of pollution load from the north bank of the basin, the “pumping” effect of huge algal growth on sediment gradually increased, resulting in the relatively high concentration of TP in the northern area of the lake. Generally, the annual high concentration area of TP shifted from the south to the north. See Supplementary Material A for the spatial distribution of TP in different seasons.
In February (winter), the spatial distribution of CODMn followed the sequence southern area > central area > northern area. In April (spring), the spatial distribution of CODMn followed the sequence southern area > northern area > central area. In August (summer), the spatial distribution of CODMn followed the sequence northern area > southern area > central area. In October (autumn), the spatial distribution of CODMn followed the sequence northern area > southern area > central area. The high value area of CODMn concentration in Erhai lake was similar to that of TN and TP concentration in different seasons. Generally, the annual high value area of CODMn concentration in the Erhai lake gradually moved from the south to the north. See Supplementary Material A for the spatial distribution of CODMn in different seasons.
In February (winter), the spatial distribution of Chla followed the sequence northern area > central area > southern area. In April (spring), the spatial distribution of Chla followed the sequence central area > northern area > southern area. In August (summer), the spatial distribution of Chla followed the sequence southern area > central area > northern area. In October (autumn), the spatial distribution of Chla followed the sequence southern area > central area > northern area. Generally, the annual high value area of Chla concentration gradually shifted from the northern area to the southern area, which was mainly because the growth of algae was not only affected by the nutrient concentration but also closely related to the hydrodynamic conditions of the lake. See Supplementary Material A for the spatial distribution of Chla in different seasons.
3.3 Comprehensive evaluation of lake water quality
3.3.1 Characteristics of monthly variation
From equations (1)–(4), the average WQI of Erhai lake in each month was calculated. The monthly variation characteristics are shown in Figure 4. As observed, in February and April, the Erhai lake water quality was in good status; in March, May, June, and August, the Erhai lake water quality was moderately polluted; in January, July and September–December, the Erhai lake water quality was highly polluted. Generally, there was a good correspondence between the comprehensive water quality and the variation characteristics of Chla concentration in the lake area, which shows that the change of nitrogen and phosphorus and other nutrients affected the water quality by changing the algal abundance. However, transformation of nutrients by algae, release of nutrients in the sediment, and decomposition of algae in turn affected the concentration of nitrogen and phosphorus in the lake. The overall water quality of Erhai lake is determined by this two-way influence mechanism.

Monthly WQI values of Erhai lake water quality.
3.3.2 Identification of factors affecting lake eutrophication
The results of correlation analysis between Chla and WQI in Erhai lake in different seasons are shown in Table 2. It was observed that in February (winter), the algal activities were less active, and there was a significant positive correlation between the Chla, NH3–N, and pH values, which was due to the fact that algal growth mainly occurs from the NH4 +–N in the water. In April (spring), there was a significant positive correlation between Chla and TP, which indicates that during this period, the TP was the limiting factor of algal growth. In August (summer), there was a significant positive correlation between the Chla and TN, which indicates that TN was the limiting factor of algal growth in this period. In October (autumn), Chla was significantly positively correlated with the WT, and negatively correlated with the transparency, which indicates that temperature and light were the key factors affecting the algal growth during this period.
Correlation analysis of Chla and different WQIs of Erhai lake
| TN | TP | NH3–N | CODMn | WT | pH | DO | SD | |
|---|---|---|---|---|---|---|---|---|
| February | −0.37 | 0.42 | 0.53* | 0.36 | 0.21 | 0.53* | 0.06 | −0.03 |
| April | 0.18 | 0.61** | −0.13 | 0.63** | −0.18 | −0.19 | −0.04 | −0.37 |
| August | 0.57** | 0.12 | 0.11 | −0.12 | −0.05 | 0.04 | −0.04 | −0.12 |
| October | 0.23 | −0.15 | 0.31 | 0.38 | −0.48* | 0.15 | 0.10 | −0.58** |
Note: *, **, and *** represent the significance level exceeds α = 0.05, α = 0.01 and α = 0.001, respectively.
4 Discussion
Wind is the main driving force for the lake current of lake Erhai. The pollutants to the lake participate in the material circulation and exchange of the whole lake under the joint impact of the wind-driven current and the throughput current. The characteristics of the migration and transformation of pollution in the lake and the temporal and spatial distribution of water quality are not only closely related to the temporal and spatial distribution of pollutants to the lake but are also affected and controlled by the lake current.
4.1 The influence of pollutants to the lake on the water quality
The nitrogen, phosphorus, and organic pollutants of Erhai lake mainly come from agricultural nonpoint source pollution discharged into the lake through rivers and ditches. Figure 5 shows the variation characteristics of COD, TN, and TP of Erhai lake in 2017 (normal flow year). The pollution load into the lake during the rainy season (June–October) accounted for about 59.22–74.99%, and the nonrainy season only accounted for 25.01–40.78%. In terms of spatial distribution characteristics, the pollution load into the lake in the north accounts for about 61.72–77.32%, the pollution load into the lake in the west accounts for about 15.09–30.63%, and the pollution load into the lake in the south and east accounts for about 7.59–9.36%. Therefore, the concentration of a large amount of pollution load from the north and west into the lake along with precipitation runoff is a key environmental factor in recent years that the water quality of lake Erhai has exceeded the water quality standard, and it is also a decisive factor affecting the distribution of the water quality of the Erhai lake area during the year. Zheng et al.’s [38] research results showed that agricultural nonpoint source pollution was the main factor affecting water quality in the northern part of the lake whereas in the southern part of the lake, economic development, accelerated urbanization, and tourism were the main factors affecting water quality. Sun and Liu [39]. established the correlation between changes in the water quality of the West lake and tourism, and the study found that human activities are the main reason for the deterioration of the water quality of the West lake. Shang et al. [40] used the soil water assessment tool (SWAT) model to establish the response relationship between pollution source input and river water quality, and found 37% of the watershed area contributed 56% of the TN pollution load. Furthermore, most of these critical source areas were concentrated in the north and west of the watershed.

The distribution process of the pollution load into the lake during 2017. East, South, West, and North represent the rivers entering the lake in different areas of the Erhai lake basin. The pollution load into the lake is calculated by multiplying the flow and the concentration. The flow and concentration are derived from the actual observation values of the river entering the lake. (a) COD, (b) TN, and (c) TP.
The total amount of pollutants entering the lake and its distribution process within the year are key factors that affect whether the water quality of lake Erhai meets the water quality standard. At the same time, the spatial distribution characteristics of pollutants entering the lake will also have an important impact on the spatial distribution of water quality in the lake. Figure 6 shows the comparison of the water quality concentration of the northern, western, and southern areas of lake Erhai in 2017. The results show that the COD concentration in the north and south is higher than that in the west. However, the concentration of TN and TP in the west and south are worse than that in the north, which is closely related to the relatively short degradation distance and passage through large agricultural areas before entering the lake in the west and south. Yurista et al. [41] used towed electronic instrumentation to analyze water quality changes and influencing factors in the lake Michigan nearshore, and the research results showed agricultural land was a key factor affecting coastal water quality. Nielsen et al. [42] established the correlation between the water quality of 414 Danish lakes and the land use of the watershed. The results of the study found that lake water quality agreed better with the proportion of agricultural land use in the entire watershed. By integrating InVEST models and socioeconomic data, Li et al. [43] performed a comprehensive temporal and spatial assessment of the impact of land use change on lake Erhai ecosystem. The results showed that the nitrogen and soil exports caused by tourism development and changes in land use types were impairing water quality in Erhai lake and causing severe environmental problems.

The distribution process of the water quality into the lake during 2017. South, West, and North represent the rivers entering the lake in different areas of the Erhai lake basin. The pollution concentrations are derived from the actual observation values of the river entering the lake. (a) COD, (b) TN, and (c) TP.
4.2 The influence of lake hydrodynamics on the water quality
According to Chen’s research results [44], driven by the dominant wind field, that is, the southwest wind, the wind-driven current of Erhai lake formed six circulations from north to south (Figure 7a). Under calm winds, the throughput current of the lake flows from north to south overall due to the influence of the topography of the valley (Figure 7b). There is a large angle between the wind-driven current and the throughput current of lake Erhai. Affected by the wind field, the lake Erhai current forms relatively independently in the north, middle and south lake areas. A weak current area is formed at the narrowest part of the east and west banks of the lake, which is very unfavorable to the transportation and diffusion of pollutants from north to south. This reveals that the water quality in the northern lake area is the worst, followed by the southern lake area and the middle lake area has relatively good water quality.

Hydrodynamic characteristics of lake Erhai. Wind-driven current in Erhai Lake dominated by southwest wind (a) and gravity current in Erhai Lake influenced by lake topography (b).
The north lake bay is an area with relatively large nutrient input, relatively poor water quality, and relatively static hydrodynamics. The rich nutrient and static lake hydrodynamic provide a material basis and dynamic environment for the growth of algae. At the same time, under the influence of the wind-driven current, planktonic algae gradually accumulate in the north lake bay. Therefore, a large amount of nutrient input and relatively unfavorable static hydrodynamic environment are important driving factors for algal accumulation in the north lake bay of lake Erhai. Like lake Erhai, lake Egirdir in Turkey and lake Fuxian in China also belong to the narrow and long lake types. Kaçıkoç and Beyhan [45] and Zhao et al. [46] found that the hydrodynamic factors were very important for the spatial distribution of water quality in the lake area.
5 Conclusion
This work demonstrates the spatial-temporal variation characteristics of Erhai lLake water quality based on WQI and the identification of the influencing factors of water quality. The main conclusions are as follows:
Currently, the water quality of Erhai lake is generally Class III standard, and TN and TP were found to exceed the standard limits.
In terms of change with time, the water quality in the dry season was better than that in the wet season. In terms of spatial distribution, the water quality in the north was better than that in the south in the dry season. In contrast, during the wet season, the water quality in the south was better than that in the north. This phenomenon is mainly affected by the watershed precipitation runoff and lake hydrodynamic conditions.
It is worth noting that during the period of high risk of algal bloom outbreak (July–October), TN, TP, WT, pH, DO, and SD of the water in the lake area were higher, which provided the necessary nutrient basis and the physical and chemical environment for an algal bloom outbreak.
With the accumulation of nutrients in the lake and degradation of aquatic ecosystem, Erhai lake has become a double-control lake for nitrogen and phosphorus, and there is an urgent necessity to address the issue of the eutrophication treatment of Erhai lake, considering increased human activity.
Overall, the physical and chemical parameters of each water body are considered to be definite values. However, in reality, subjective factors such as sampling errors, measurement errors, environmental factor errors, and methodological errors introduce uncertainty. For objective factors such as the spatial heterogeneity of parameter indicators, the parameter value is actually a range rather than a fixed value. Therefore, more extensive monitoring is needed to make up for the uncertainty caused by monitoring.
Acknowledgements
The authors would like to thank the valuable comments and suggestions of the anonymous reviewers.
-
Funding information: This work was supported by the Beijing Natural Science Foundation (No. 8214064), National Key R&D Program of China (No. 2019YFC0409204), National Natural Science Foundation of China (No. 51809288), Joint Open Research Fund Program of State key Laboratory of Hydroscience and Engineering and Tsinghua – Ningxia Yinchuan Joint Institute of Internet of Waters on Digital Water Governance (No. sklhse-2019-Iow07), and the basic Research Project of IWHR (No. WR0145B012021, No. WE0145B562016)
-
Author contributions: For this research article, Xiaobo Liu designed the project and Xuekai Chen processed the data, developed the methodology, performed the research, and wrote the manuscript. Xiaobo Liu, Bogen Li, and Wenqi Peng provided overall guidance; and Fei Dong, Aiping Huang, Weijie Wang and Feng Cao collected the data and contributed discussions and scientific advice. All authors have reviewed the manuscript. All authors have read and agreed to the published version of the manuscript.
-
Conflict of interest: We declare no conflict of interest.
References
[1] Carpenter SR, Caraco NF, Correll DL, Howarth RW, Sharpley AN, Smith VH. Nonpoint pollution of surface waters with phosphorus and nitrogen. Ecol Appl. 1998;8(3):559–68.10.1890/1051-0761(1998)008[0559:NPOSWW]2.0.CO;2Search in Google Scholar
[2] Guiamel IA, Lee HS. Watershed modelling of the mindanao river basin in the Philippines using the SWAT for water resource management. Civ Eng J. 2020;6(4):626–48. 10.28991/cej-2020-03091496.Search in Google Scholar
[3] Hatvani IG, Kirschner AKT, Farnleitner AH, Tanos P, Herzig A. Hotspots and main drivers of fecal pollution in Neusiedler see, a large shallow lake in central Europe. Environ Sci Pollut Res. 2018;25:28884–98. 10.1007/s11356-018-2783-7.Search in Google Scholar
[4] Romero E, Gendre RL, Garnier J, Billen G, Fisson C, Silvestre M, et al. Long-term water quality in the lower Seine: lessons learned over 4 decades of monitoring. Environ Sci Policy. 2016;58:141–54. 10.1016/j.envsci.2016.01.016.Search in Google Scholar
[5] Kavianpour M, Seyedabadi M, Moazami S, Yamini OA. Copula based spatial analysis of drought return period in southwest of Iran. Period Polytech Civ Eng. 2020;64(4):1051–63. 10.3311/ppci.16301.Search in Google Scholar
[6] Fang YH, Zheng XL, Peng H, Wang H, Xin J. A new method of the relative membership degree calculation in variable fuzzy sets for water quality assessment. Ecol Indic. 2019;98(3):515–22. 10.1016/j.ecolind.2018.11.032.Search in Google Scholar
[7] Mohebbi MR, Saeedi R, Montazeri A, Vaghefi KA, Labbafi S, Oktaie S, et al. Assessment of water quality in groundwater resources of Iran using a modified drinking water quality index (DWQI). Ecol Indic. 2013;30(6):28–34. 10.1016/j.ecolind.2013.02.008.Search in Google Scholar
[8] Kansoh R, Abd-El-Mooty M, Abd-El-Baky R. Computing the water budget components for lakes by using meteorological data. Civ Eng J. 2020;6(7):1255–65. 10.28991/cej-2020-03091545.Search in Google Scholar
[9] Sutadian AD, Muttil N, Yilmaz AG, Perera BJC. Development of river water quality indices–a review. Environ Monit Assess. 2016;188(1):58.1–58.29. 10.1007/s10661-015-5050-0.Search in Google Scholar
[10] Horton RK. An index number system for rating water quality. J Water Pollut Control Fed. 1965;37(3):300–6.Search in Google Scholar
[11] Brown RM, Mcclelland NI, Deininger RA, Tozer RG. A water quality index–do we dare? Water Sew Work. 1970;117(10):339–43.Search in Google Scholar
[12] Bordalo AA, Teixeira R, Wiebe WJ. A water quality index applied to an international shared river basin: the case of the Douro river. Environ Manag. 2006;38(6):910–20. 10.1007/s00267-004-0037-6.Search in Google Scholar
[13] Sánchez E, Colmenarejo MF, Vicente J, Rubio A, Garia MG, Travieso L, et al. Use of the water quality index and dissolved oxygen deficit as simple indicators of watersheds pollution. Ecol Indic. 2007;7(2):315–28. 10.1016/j.ecolind.2006.02.005.Search in Google Scholar
[14] Mahagamage M, Manage M. Water quality index (CCME-WQI) based assessment study of water quality in Kelani river basin, Sri Lanka. J Environ Nat Resour. 2014;1:199–204.Search in Google Scholar
[15] Debels P, Figueroa R, Urrutia R, Barra R, Niell X. Evaluation of water quality in the Chillán river (central Chile) using physicochemical parameters and a modified water quality index. Environ Monit Assess. 2005;110:301–22. 10.1007/s10661-005-8064-1.Search in Google Scholar PubMed
[16] Kannel PR, Lee S, Lee YS, Kanel SR, Khan SP. Application of water quality indices and dissolved oxygen as indicators for river water classification and urban impact assessment. Environ Monit Assess. 2007;132:93–110. 10.1007/s10661-006-9505-1.Search in Google Scholar PubMed
[17] Sener S, Sener E, Davraz A. Evaluation of water quality using water quality index (WQI) method and GIS in Aksu River (SW-Turkey). Sci Total Environ. 2017;584–585(15):131–44. 10.1016/j.scitotenv.2017.01.102.Search in Google Scholar PubMed
[18] Lumb A, Sharma TC, Bibeault JF. A review of genesis and evolution of water quality index (WQI) and some future directions. Water Quality Exposure Health. 2011;3(1):11–24. 10.1007/s12403-011-0040-0.Search in Google Scholar
[19] Nong XZ, Shao DG, Zhong H, Liang JK. Evaluation of water quality in the South-to-North water diversion project of China using the water quality index (WQI) method. Water Res. 2020;178:115781. 10.1016/j.watres.2020.115781.Search in Google Scholar PubMed
[20] Karunanidhi D, Aravinthasamy P, Subramani T, Muthusankar G. Revealing drinking water quality issues and possible health risks based on water quality index (WQI) method in the Shanmuganadhi river basin of South India. Env Geochem Health. 2021;43:931–48. 10.1007/s10653-020-00613-3.Search in Google Scholar PubMed
[21] Ma Z, Li HX, Ye ZY, Wen JP, Hu Y, Liu Y. Application of modified water quality index (WQI) in the assessment of coastal water quality in main aquaculture areas of Dalian, China. Mar Pollut Bull. 2020;157(1–2):111285. 10.1016/j.marpolbul.2020.111285.Search in Google Scholar PubMed
[22] Lin SS, Shen SL, Zhou AN, Lyu HM. Assessment and management of lake eutrophication: a case study in Lake Erhai, China. Sci Total Environ. 2020;751(1):141618. 10.1016/j.scitotenv.2020.141618.Search in Google Scholar PubMed
[23] Dash S, Kalamdhad AS. Science mapping approach to critical reviewing of published literature on water quality indexing. Ecol Indic. 2021;128:107862. 10.1016/j.ecolind.2021.107862.Search in Google Scholar
[24] Wu ZS, Wang XL, Chen YW, Cai YJ, Deng JC. Assessing river water quality using water quality index in lake Taihu basin, China. Sci Total Environ. 2018;612:914–22. 10.1016/j.scitotenv.2017.08.293.Search in Google Scholar PubMed
[25] Wu ZS, Lai XJ, Li KY. Water quality assessment of rivers in lake Chaohu basin (China) using water quality index. Ecol Indic. 2021;121:107021. 10.1016/j.ecolind.2020.107021.Search in Google Scholar
[26] Hatvani IG, Barros VDB, Tanos P, Kovács J, Kovács IS, Clement A. Spatiotemporal changes and drivers of trophic status over three decades in the largest shallow lake in central Europe, lake Balaton. Ecol Eng. 2020;151:105861. 10.1016/j.ecoleng.2020.105861.Search in Google Scholar
[27] Granata F, Papirio S, Esposito G, Gargano R, Marinis GD. Machine learning algorithms for the forecasting of wastewater quality indicators. Water. 2017;9:105. 10.3390/w9020105.Search in Google Scholar
[28] Oladipo JO, Akinwumiju AS, Aboyeji OS, Adelodun AA. Comparison between fuzzy logic and water quality index methods: a case of water quality assessment in Ikare community, southwestern Nigeria. Environ Chall. 2021;3:100038. 10.1016/j.envc.2021.100038.Search in Google Scholar
[29] Lu SY, Zhang WT, Xing Y, Qu JT, Li K, Zhang Q, et al. Spatial distribution of water quality parameters of rivers around Erhai lake during the dry and rainy seasons. Environ Earth Sci. 2015;74(11):7423–30. 10.1007/s12665-015-4725-8.Search in Google Scholar
[30] Hu YN, Peng J, Liu YX, Tian L. Integrating ecosystem services trade-offs with paddy land-to-dry land decisions: a scenario approach in Erhai lake basin, southwest China. Sci Total Environ. 2018;625(1):849–60. 10.1016/j.scitotenv.2017.12.340.Search in Google Scholar PubMed
[31] Wang SR, Zhang L, Ni L, Zhao HC, Jiao LX, Yang SW, et al. Ecological degeneration of the Erhai lake and prevention measures. Environ Earth Sci. 2015;74(5):3839–47. 10.1007/s12665-015-4433-4.Search in Google Scholar
[32] Liu JL, Xu JJ, Chen J, Hong XF, Zhou MY. Spatio–temporal distribution characteristics of water quality in Miju river and Erhai lake. J Coast Res. 2019;93:31. 10.2112/si93-005.1.Search in Google Scholar
[33] Ni ZK, Wang SR. Historical accumulation and environmental risk of nitrogen and phosphorus in sediments of Erhai lake, Southwest China. Ecol Eng. 2015;79:42–53. 10.1016/j.ecoleng.2015.03.005.Search in Google Scholar
[34] Fukushima T, Ozaki N, Kaminishi H, Harasawa H, Matsushige K. Forecasting the changes in lake water quality in response to climate changes, using past relationships between meteorological conditions and water quality. Hydrol Process. 2015;14(3):593–604. 10.1002/(sici)1099-1085(20000228)14:3<593:aid-hyp956>3.0.co;2-o.Search in Google Scholar
[35] Hurley T, Sadiq R, Mazumder A. Adaptation and evaluation of the Canadian council of ministers of the environment water quality index (CCME WQI) for use as an effective tool to characterize drinking source water quality. Water Res. 2012;46(11):3544–52. 10.1016/j.watres.2012.03.061.Search in Google Scholar
[36] Wu YG, Yang G, Tian LJ, Gu XC, Li XL, He XL, et al. Spatiotemporal variation in groundwater level within the Manas river basin, Northwest China: relative impacts of natural and human factors. Open Geosci. 2021;13(1):626–38. 10.1515/geo-2020-0258.Search in Google Scholar
[37] Webster R, Oliver MA. Statistical methods in soil and land resource survey. New York: Oxford University Press; 1990.Search in Google Scholar
[38] Zheng L, An ZY, Chen XL, Liu H. Changes in water environment in Erhai lake and its influencing factors. Water. 2021;13(10):1362. 10.3390/w13101362.Search in Google Scholar
[39] Sun QO, Liu Z. Impact of tourism activities on water pollution in the West Lake Basin (Hangzhou, China). Open Geosci. 2020;12(1):1302–8. 10.1515/geo-2020-0119.Search in Google Scholar
[40] Shang X, Wang XZ, Zhang DL, Chen WD, Chen XC, Kong HN. An improved SWAT-based computational framework for identifying critical source areas for agricultural pollution at the lake basin scale. Ecol Model. 2012;226:1–10. 10.1016/j.ecolmodel.2011.11.030.Search in Google Scholar
[41] Yurista PM, Kelly JR, Cotter AM, Miller SE, Alstine JDV. Lake michigan: nearshore variability and a nearshore–offshore distinction in water quality. J Gt Lakes Res. 2015;41(1):111–22. 10.1016/j.jglr.2014.12.010.Search in Google Scholar
[42] Nielsen A, Trolle D, Søndergaard M, Lauridsen TL, Bjerring R, Olesen JE, et al. Watershed land use effects on lake water quality in Denmark. Ecol Appl. 2012;22(4):1187–200. 10.1890/11-1831.1.Search in Google Scholar
[43] Li JH, Bai Y, Alatalo JM. Impacts of rural tourism-driven land use change on ecosystems services provision in Erhai lake basin, China. Ecosyst Serv. 2020;42:101081. 10.1016/j.ecoser.2020.101081.Search in Google Scholar
[44] Chen XK. Refined simulation of non-point-source pollution and identifying multilevel priority management areas at the watershed scale: a case study of Lake Erhai. Beijing, China: China Institute of Water Resources and Hydropower Research; 2019.Search in Google Scholar
[45] Kacikoc M, Beyhan M. Hydrodynamic and water quality modeling of lake Egirdir. Clean – Soil, Air, Water. 2014;42(11):1573–82. 10.1002/clen.201300455.Search in Google Scholar
[46] Zhao L, Zhang XL, Liu Y, He B, Zhu X, Zou R, et al. Three-dimensional hydrodynamic and water quality model for TMDL development of lake Fuxian, China. J Environ Sci. 2012;24(8):1355–63. 10.1016/s1001-0742(11)60967-4.Search in Google Scholar
© 2021 Xuekai Chen et al., published by De Gruyter
This work is licensed under the Creative Commons Attribution 4.0 International License.
Articles in the same Issue
- Regular Articles
- Lithopetrographic and geochemical features of the Saalian tills in the Szczerców outcrop (Poland) in various deformation settings
- Spatiotemporal change of land use for deceased in Beijing since the mid-twentieth century
- Geomorphological immaturity as a factor conditioning the dynamics of channel processes in Rządza River
- Modeling of dense well block point bar architecture based on geological vector information: A case study of the third member of Quantou Formation in Songliao Basin
- Predicting the gas resource potential in reservoir C-sand interval of Lower Goru Formation, Middle Indus Basin, Pakistan
- Study on the viscoelastic–viscoplastic model of layered siltstone using creep test and RBF neural network
- Assessment of Chlorophyll-a concentration from Sentinel-3 satellite images at the Mediterranean Sea using CMEMS open source in situ data
- Spatiotemporal evolution of single sandbodies controlled by allocyclicity and autocyclicity in the shallow-water braided river delta front of an open lacustrine basin
- Research and application of seismic porosity inversion method for carbonate reservoir based on Gassmann’s equation
- Impulse noise treatment in magnetotelluric inversion
- Application of multivariate regression on magnetic data to determine further drilling site for iron exploration
- Comparative application of photogrammetry, handmapping and android smartphone for geotechnical mapping and slope stability analysis
- Geochemistry of the black rock series of lower Cambrian Qiongzhusi Formation, SW Yangtze Block, China: Reconstruction of sedimentary and tectonic environments
- The timing of Barleik Formation and its implication for the Devonian tectonic evolution of Western Junggar, NW China
- Risk assessment of geological disasters in Nyingchi, Tibet
- Effect of microbial combination with organic fertilizer on Elymus dahuricus
- An OGC web service geospatial data semantic similarity model for improving geospatial service discovery
- Subsurface structure investigation of the United Arab Emirates using gravity data
- Shallow geophysical and hydrological investigations to identify groundwater contamination in Wadi Bani Malik dam area Jeddah, Saudi Arabia
- Consideration of hyperspectral data in intraspecific variation (spectrotaxonomy) in Prosopis juliflora (Sw.) DC, Saudi Arabia
- Characteristics and evaluation of the Upper Paleozoic source rocks in the Southern North China Basin
- Geospatial assessment of wetland soils for rice production in Ajibode using geospatial techniques
- Input/output inconsistencies of daily evapotranspiration conducted empirically using remote sensing data in arid environments
- Geotechnical profiling of a surface mine waste dump using 2D Wenner–Schlumberger configuration
- Forest cover assessment using remote-sensing techniques in Crete Island, Greece
- Stability of an abandoned siderite mine: A case study in northern Spain
- Assessment of the SWAT model in simulating watersheds in arid regions: Case study of the Yarmouk River Basin (Jordan)
- The spatial distribution characteristics of Nb–Ta of mafic rocks in subduction zones
- Comparison of hydrological model ensemble forecasting based on multiple members and ensemble methods
- Extraction of fractional vegetation cover in arid desert area based on Chinese GF-6 satellite
- Detection and modeling of soil salinity variations in arid lands using remote sensing data
- Monitoring and simulating the distribution of phytoplankton in constructed wetlands based on SPOT 6 images
- Is there an equality in the spatial distribution of urban vitality: A case study of Wuhan in China
- Considering the geological significance in data preprocessing and improving the prediction accuracy of hot springs by deep learning
- Comparing LiDAR and SfM digital surface models for three land cover types
- East Asian monsoon during the past 10,000 years recorded by grain size of Yangtze River delta
- Influence of diagenetic features on petrophysical properties of fine-grained rocks of Oligocene strata in the Lower Indus Basin, Pakistan
- Impact of wall movements on the location of passive Earth thrust
- Ecological risk assessment of toxic metal pollution in the industrial zone on the northern slope of the East Tianshan Mountains in Xinjiang, NW China
- Seasonal color matching method of ornamental plants in urban landscape construction
- Influence of interbedded rock association and fracture characteristics on gas accumulation in the lower Silurian Shiniulan formation, Northern Guizhou Province
- Spatiotemporal variation in groundwater level within the Manas River Basin, Northwest China: Relative impacts of natural and human factors
- GIS and geographical analysis of the main harbors in the world
- Laboratory test and numerical simulation of composite geomembrane leakage in plain reservoir
- Structural deformation characteristics of the Lower Yangtze area in South China and its structural physical simulation experiments
- Analysis on vegetation cover changes and the driving factors in the mid-lower reaches of Hanjiang River Basin between 2001 and 2015
- Extraction of road boundary from MLS data using laser scanner ground trajectory
- Research on the improvement of single tree segmentation algorithm based on airborne LiDAR point cloud
- Research on the conservation and sustainable development strategies of modern historical heritage in the Dabie Mountains based on GIS
- Cenozoic paleostress field of tectonic evolution in Qaidam Basin, northern Tibet
- Sedimentary facies, stratigraphy, and depositional environments of the Ecca Group, Karoo Supergroup in the Eastern Cape Province of South Africa
- Water deep mapping from HJ-1B satellite data by a deep network model in the sea area of Pearl River Estuary, China
- Identifying the density of grassland fire points with kernel density estimation based on spatial distribution characteristics
- A machine learning-driven stochastic simulation of underground sulfide distribution with multiple constraints
- Origin of the low-medium temperature hot springs around Nanjing, China
- LCBRG: A lane-level road cluster mining algorithm with bidirectional region growing
- Constructing 3D geological models based on large-scale geological maps
- Crops planting structure and karst rocky desertification analysis by Sentinel-1 data
- Physical, geochemical, and clay mineralogical properties of unstable soil slopes in the Cameron Highlands
- Estimation of total groundwater reserves and delineation of weathered/fault zones for aquifer potential: A case study from the Federal District of Brazil
- Characteristic and paleoenvironment significance of microbially induced sedimentary structures (MISS) in terrestrial facies across P-T boundary in Western Henan Province, North China
- Experimental study on the behavior of MSE wall having full-height rigid facing and segmental panel-type wall facing
- Prediction of total landslide volume in watershed scale under rainfall events using a probability model
- Toward rainfall prediction by machine learning in Perfume River Basin, Thua Thien Hue Province, Vietnam
- A PLSR model to predict soil salinity using Sentinel-2 MSI data
- Compressive strength and thermal properties of sand–bentonite mixture
- Age of the lower Cambrian Vanadium deposit, East Guizhou, South China: Evidences from age of tuff and carbon isotope analysis along the Bagong section
- Identification and logging evaluation of poor reservoirs in X Oilfield
- Geothermal resource potential assessment of Erdaobaihe, Changbaishan volcanic field: Constraints from geophysics
- Geochemical and petrographic characteristics of sediments along the transboundary (Kenya–Tanzania) Umba River as indicators of provenance and weathering
- Production of a homogeneous seismic catalog based on machine learning for northeast Egypt
- Analysis of transport path and source distribution of winter air pollution in Shenyang
- Triaxial creep tests of glacitectonically disturbed stiff clay – structural, strength, and slope stability aspects
- Effect of groundwater fluctuation, construction, and retaining system on slope stability of Avas Hill in Hungary
- Spatial modeling of ground subsidence susceptibility along Al-Shamal train pathway in Saudi Arabia
- Pore throat characteristics of tight reservoirs by a combined mercury method: A case study of the member 2 of Xujiahe Formation in Yingshan gasfield, North Sichuan Basin
- Geochemistry of the mudrocks and sandstones from the Bredasdorp Basin, offshore South Africa: Implications for tectonic provenance and paleoweathering
- Apriori association rule and K-means clustering algorithms for interpretation of pre-event landslide areas and landslide inventory mapping
- Lithology classification of volcanic rocks based on conventional logging data of machine learning: A case study of the eastern depression of Liaohe oil field
- Sequence stratigraphy and coal accumulation model of the Taiyuan Formation in the Tashan Mine, Datong Basin, China
- Influence of thick soft superficial layers of seabed on ground motion and its treatment suggestions for site response analysis
- Monitoring the spatiotemporal dynamics of surface water body of the Xiaolangdi Reservoir using Landsat-5/7/8 imagery and Google Earth Engine
- Research on the traditional zoning, evolution, and integrated conservation of village cultural landscapes based on “production-living-ecology spaces” – A case study of villages in Meicheng, Guangdong, China
- A prediction method for water enrichment in aquifer based on GIS and coupled AHP–entropy model
- Earthflow reactivation assessment by multichannel analysis of surface waves and electrical resistivity tomography: A case study
- Geologic structures associated with gold mineralization in the Kirk Range area in Southern Malawi
- Research on the impact of expressway on its peripheral land use in Hunan Province, China
- Concentrations of heavy metals in PM2.5 and health risk assessment around Chinese New Year in Dalian, China
- Origin of carbonate cements in deep sandstone reservoirs and its significance for hydrocarbon indication: A case of Shahejie Formation in Dongying Sag
- Coupling the K-nearest neighbors and locally weighted linear regression with ensemble Kalman filter for data-driven data assimilation
- Multihazard susceptibility assessment: A case study – Municipality of Štrpce (Southern Serbia)
- A full-view scenario model for urban waterlogging response in a big data environment
- Elemental geochemistry of the Middle Jurassic shales in the northern Qaidam Basin, northwestern China: Constraints for tectonics and paleoclimate
- Geometric similarity of the twin collapsed glaciers in the west Tibet
- Improved gas sand facies classification and enhanced reservoir description based on calibrated rock physics modelling: A case study
- Utilization of dolerite waste powder for improving geotechnical parameters of compacted clay soil
- Geochemical characterization of the source rock intervals, Beni-Suef Basin, West Nile Valley, Egypt
- Satellite-based evaluation of temporal change in cultivated land in Southern Punjab (Multan region) through dynamics of vegetation and land surface temperature
- Ground motion of the Ms7.0 Jiuzhaigou earthquake
- Shale types and sedimentary environments of the Upper Ordovician Wufeng Formation-Member 1 of the Lower Silurian Longmaxi Formation in western Hubei Province, China
- An era of Sentinels in flood management: Potential of Sentinel-1, -2, and -3 satellites for effective flood management
- Water quality assessment and spatial–temporal variation analysis in Erhai lake, southwest China
- Dynamic analysis of particulate pollution in haze in Harbin city, Northeast China
- Comparison of statistical and analytical hierarchy process methods on flood susceptibility mapping: In a case study of the Lake Tana sub-basin in northwestern Ethiopia
- Performance comparison of the wavenumber and spatial domain techniques for mapping basement reliefs from gravity data
- Spatiotemporal evolution of ecological environment quality in arid areas based on the remote sensing ecological distance index: A case study of Yuyang district in Yulin city, China
- Petrogenesis and tectonic significance of the Mengjiaping beschtauite in the southern Taihang mountains
- Review Articles
- The significance of scanning electron microscopy (SEM) analysis on the microstructure of improved clay: An overview
- A review of some nonexplosive alternative methods to conventional rock blasting
- Retrieval of digital elevation models from Sentinel-1 radar data – open applications, techniques, and limitations
- A review of genetic classification and characteristics of soil cracks
- Potential CO2 forcing and Asian summer monsoon precipitation trends during the last 2,000 years
- Erratum
- Erratum to “Calibration of the depth invariant algorithm to monitor the tidal action of Rabigh City at the Red Sea Coast, Saudi Arabia”
- Rapid Communication
- Individual tree detection using UAV-lidar and UAV-SfM data: A tutorial for beginners
- Technical Note
- Construction and application of the 3D geo-hazard monitoring and early warning platform
- Enhancing the success of new dams implantation under semi-arid climate, based on a multicriteria analysis approach: Case of Marrakech region (Central Morocco)
- TRANSFORMATION OF TRADITIONAL CULTURAL LANDSCAPES - Koper 2019
- The “changing actor” and the transformation of landscapes