Modeling of dense well block point bar architecture based on geological vector information: A case study of the third member of Quantou Formation in Songliao Basin
-
Chao Luo
 ,
Ailin Jia
,
Ailin Jia

Abstract
Although stochastic modeling methods can achieve multiple implementations of sedimentary microfacies model in dense well blocks, it is difficult to realize continuous convergence of well spacing. Taking the small high-sinuosity meandering river sediments of the third member of Quantou Formation in Songliao Basin as an example, a deterministic modeling method based on geological vector information was explored in this article. Quantitative geological characteristics of point bar sediments were analyzed by field outcrops, modern sediments, and dense well block anatomy. The lateral extension distance, length, and spacing parameters of the point bar were used to quantitatively characterize the thickness, dip angle, and frequency of the lateral layer. In addition, the three-dimensional architecture modeling of the point bar was carried out in the study. The established three-dimensional architecture model of well X24-1 had continuous convergence near all wells, which conformed to the geological knowledge of small high-sinuosity meandering river, and verified the reliability of this method in the process of geological modeling in dense well blocks.
1 Introduction
Reservoir architecture refers to the geometric shape, scale, direction, and superimposition of different levels of architecture units [1,2]. In recent years, with the deepening of reservoir descriptions, reservoir architecture has gradually become an important research content [3,4]. Different kinds of reservoir architectures are recognizable over a broad range of scales, commonly in a hierarchically nested fashion [5,6,7], and the distribution of these reservoirs triggers off a wide range of scales of sedimentary heterogeneity from basin-fill scale [8,9], to sandstone-conglomerate scale [10], to sets of inclined strata scale [11], to lithofacies scale [12], and to microscopic pore-throat scale [13]. Geologists and engineers have greatly improved the methods for building geologic and petrophysical reservoir models by applying the concepts of stratigraphy, sedimentary basin analysis, facies models, and geostatistics [14,15,16,17,18]. A considerable number of scholars have conducted architecture analysis of different types of reservoirs and have achieved abundant results, but these achievements are mainly concentrated on outcrops and modern sedimentary structures [19,20,21]. How to accurately characterize the findings of reservoir description in three dimension and establish a reservoir architecture model becomes the core and difficulty of reservoir modeling.
For high-sinuosity meandering river, the establishment of three-dimensional geological model in sedimentary microfacies is becoming more and more mature [22,23,24]. There have been numerous studies and methods that build geologic models of various scales of heterogeneities within meandering river reservoirs, including process-based [25,26,27], stochastic [28,29], deterministic [30], and combined stochastic-deterministic models [31,32]. Many of these studies explore depositional system and sandbody connectivity on a field scale [33,34]. Others address the potential effect of lithological and petrophysical heterogeneity on fluid flow [35]. Seismically based geomorphic characterizations of channel systems [36] are also greatly improving reservoir modeling to fill interwell gaps. However, modeling of architecture units including lateral deposits and lateral layers in dense well blocks still requires extensive research. The application of pixel-based methods (such as sequential indicator simulation) can hardly meet the requirements. Although many models can be achieved, these methods often result in difficult to match dense wellbore data [37,38].
Geological information is usually very clear due to the abundant data of dense well blocks. Therefore, with the consideration of the matching between dense well block data and geological database, a high-precision deterministic modeling method was explored in this article, which was especially suitable for dense well block modeling with rich data in East China. Taking the third member of the Lower Cretaceous Quantou Formation in the Songliao Basin as the research object, a deterministic architecture modeling method based on geological vector information was proposed. Outcrops and modern sediments with similar sedimentary conditions are selected for dissection. A comprehensive analysis of the geological characteristics was carried out in dense well block, and geological vector information of the modeled object was obtained, including the architecture unit ratio, the spatial structure of architecture unit, and its size. The model was quantitatively characterized by the information of thickness, dip angle, and frequency of lateral layer. Finally, a point bar model was established in a typical well area of the study area.
2 Regional geological setting
The study area is located in the southern part of Daqing Placanticline in Songliao Basin (Figure 1), which is multihigh dome anticline [39]. A series of typical small meandering river deposits with a thickness of about 150 m were developed in the third member of Quantou Formation through long-term filling of the underlying Denglouku Formation [40]. Many scholars have investigated the paleoclimate and sedimentary environment of the small meandering river and estimated the curvature of the meandering river (equation 1) by using the relationship between the mean bank-full channel depth and the mean bank-full channel width [41,42]. Mathematical models between the meander-belt width and annual discharge have also been studied by many geologists [43,44]. In the third member of the Quantou Formation, the curvature of the ancient river is calculated between 2.48 and 2.65 with a flow rate about 115.51–274.57 m3/s (equation 2). In a typical humid environment, it is a small high-sinuosity meandering river, with a horizontally oblique feature for the lateral layer of the point bar [45]. The average well spacing is less than 50 m in the study area. This means that dense well block data make architecture analysis possible.

Stratigraphic column and location in the southern Songliao Basin. (a) Structural sketch map of the southern Songliao Basin; (b) summary diagram showing the stratigraphy and basin evolution of the Songliao Basin.
3 Methods
Previous studies have shown that the lateral layer is obliquely draped in space as a result of lateral accretion in the point bar [46]. The plane geometry of the lateral layer is in the shape of an arc, and the cross-sectional shape is an oblique-inserted mud wedge. The main parameters characterizing the spatial distribution of a single lateral formation are the inclination, dip angle, and extension range, while the distance between multiple lateral deposits can be expressed by the lateral spacing. Constrained by the statistical information of lateral deposits, a three-dimensional architecture model can be established based on the idea of point bar geological vector information (Figure 2).
The first step is to define the architecture elements through the space vector method. In a small high-sinuosity meandering river, the direction of abandoned channel should be clearly defined. The basic model vector of the abandoned channel is represented by the talweg path along the line of the river, and the spatial shape of abandoned channel can be calculated via simulating the talweg at different positions. The volume of space delineated on each surface is the three-dimensional geometry of the abandoned channel, while the point bar is an elliptical cylinder shaped like a wafer, defined by the inner edge of the abandoned channel. The length, width, and morphological characteristics of the point bar are established, and the structure model of the point bar can be constructed. What’s more, the model defines the spatial architecture combination relationship between the point bar and the abandoned channel.
In describing the profile shape of lateral deposit, the lateral layer direction is set to be nearly perpendicular to the lateral extension of the point bar. The curve model (equation 3) restrains the shapes of lateral deposit surface, thereby achieving the characteristic with a gentle top–bottom dip and a steep intermediate dip of the lateral surface [47]. For an individual lateral layer, the inclination trend can be used to control the extension angle of the lateral surface.
(3)In the actual simulation process, the coordinate translation or rotation method can be employed to generate the lateral layer with different shapes. Figure 2b is a section delineated by the translation of a retroflexion curve, defining the lateral layer. Two intersecting arcs are defined to control the profile of the lateral layer plane. The distance of the center of two circular arcs c1 and c2 is equal to the thickness of the lateral layer. The extension distance is controlled by a1a2 and a2a3. The distribution functions of a1a2 and a2a3 are given during the simulation to control the lateral extension distance and the extension mode of the lateral layer. The volume of space delineated by moving two curves along the defined arc is the space distribution volume of the lateral layers.
According to the coordinate information and the thickness parameter of the lateral layer, the 3D spatial model of the lateral layer is generated by using the thickness characteristic constraint and local correction. The lateral layer is embedded in the point bar architecture model and an architecture model containing lateral layer information can be produced.
In this step, it is necessary to set parameters such as the form and scale of the architecture elements including the lateral layer, and the abandoned channel. Constrained by the proportion of architecture units, the lateral layer model is established based on the geological vector information of point bars. This process requires manual participation, optimization, and later modification in order to best reflect the morphological characteristics and spatial combinations of architecture elements in the point bar (Figure 3).
![Figure 2
The mathematical characterization of the planar shape of the lateral accretion layer [47]. (a) Theoretical retroflexion curve; (b) cross-section delineated by translation of retroflexion curve; (c) internal characteristic of point bar; (d) morphological parameters of lateral layer.](/document/doi/10.1515/geo-2020-0222/asset/graphic/j_geo-2020-0222_fig_002.jpg)
The mathematical characterization of the planar shape of the lateral accretion layer [47]. (a) Theoretical retroflexion curve; (b) cross-section delineated by translation of retroflexion curve; (c) internal characteristic of point bar; (d) morphological parameters of lateral layer.

Modeling of the lateral accretion layer in point bars. (a) Point bar; (b) top and bottom lateral layer; (c) dip angle of lateral layer; (d) 3-D architecture model.
4 Acquisition of geological vector information of the point bar
4.1 Outcrop description
The outcrop analogy is an important means of attaining reservoir architecture information [48]. The prototype outcrop is selected from the Permian sedimentary strata of Palougou (Figure 4), heading in the E–W direction, which reflect relatively humid climate environment [49]. The bottom of the section is a typical river erosion surface, while the right side is mud plug formed by the river abandonment and filled with fine particles. The measured results show that there are seven stages of lateral deposits on the profile, which migrate eastward in turn. The thickness and width of the single-stage lateral deposits are 1–2 and 30–50 m, with an average width of about 40 m. The change in the inclination of the seven-stage lateral deposits is small. The lateral layer is also inclined to the west, mainly gray mudstone and silty mudstone. The dip angle is about 2.5–5.5° (the upper and lower dip angles are relatively small, and the middle dip angle is relatively large), the lateral deposits are discontinuous, and some of the lateral deposits are not preserved intact. In the vicinity of the scour surface, the lateral layers are not developed, and the multistage lateral sediment is interconnected in the middle and lower parts of the point bars.
![Figure 4
Outcrop anatomy of the Permian of the Palougou profile, Baode county, Shanxi province (edited from [49]).](/document/doi/10.1515/geo-2020-0222/asset/graphic/j_geo-2020-0222_fig_004.jpg)
Outcrop anatomy of the Permian of the Palougou profile, Baode county, Shanxi province (edited from [49]).
4.2 Modern sedimentary analysis
The Murray River in Southern Australia is far from the city, and its discharge is not large, with an annual average discharge 190 m3/s. The scale and climatic conditions are similar to those of the lower Cretaceous in Songliao Basin, which can be used as a high-precision geological prototype of similar analogy. It can be found that a typical point bar may be developed in a high-sinuosity meandering river like the Murray River. Based on Google Earth, quantitative data for several typical point bars are measured.
For instance, the curvatures of point bars 1 and 2 are corresponding to the value of 2.41 and 2.67, and the lateral widths are 492.2 and 340.6 m (Figure 5). Through the plane measurement, 16 and 13 lateral deposits are separately found in point bars 1 and 2. In addition, the curvatures are 3.91 and 3.95 for the point bars 3 and 4, and the lateral widths are 402.8 and 705.6 m, with 8 and 18 lateral deposits. The average spacing of single lateral deposits are 67.1 and 47.0 m, which are correspondingly larger than 35.2 and 30.9 m of the point bars 1 and 2. However, it can be concluded that average spacing of single lateral deposits is generally less than 50 m.

Point bar deposit (scroll bar) of modern meandering river in Australia. (a) Point bar 1; (b) point bar 2; (c) point bar 3; (d) point bar 4.
4.3 Point bar anatomy in dense well block
The dissection of point bars in the dense well block mainly relies on the core, logging, and dynamic data to verify the architecture unit model and scale characteristics. Core observations show that the lithology of the lateral layer developed in the point bar is mainly silty mudstone and mudstone. The core of Well J11 indicates that the thickness of the lateral layer is generally between 10 and 50 cm, and the dip angle is small, most of which is 2.5–5° (Figure 6). Statistical data suggest that the thickness of a single lateral deposits preserved in many coring wells is generally 1–5 m, with an average of about 2.5 m. Based on the relationship between the spacing of adjacent lateral layer and the thickness of lateral deposits, it can be inferred that the spacing of each lateral layer is mainly between 25 and 65 m.
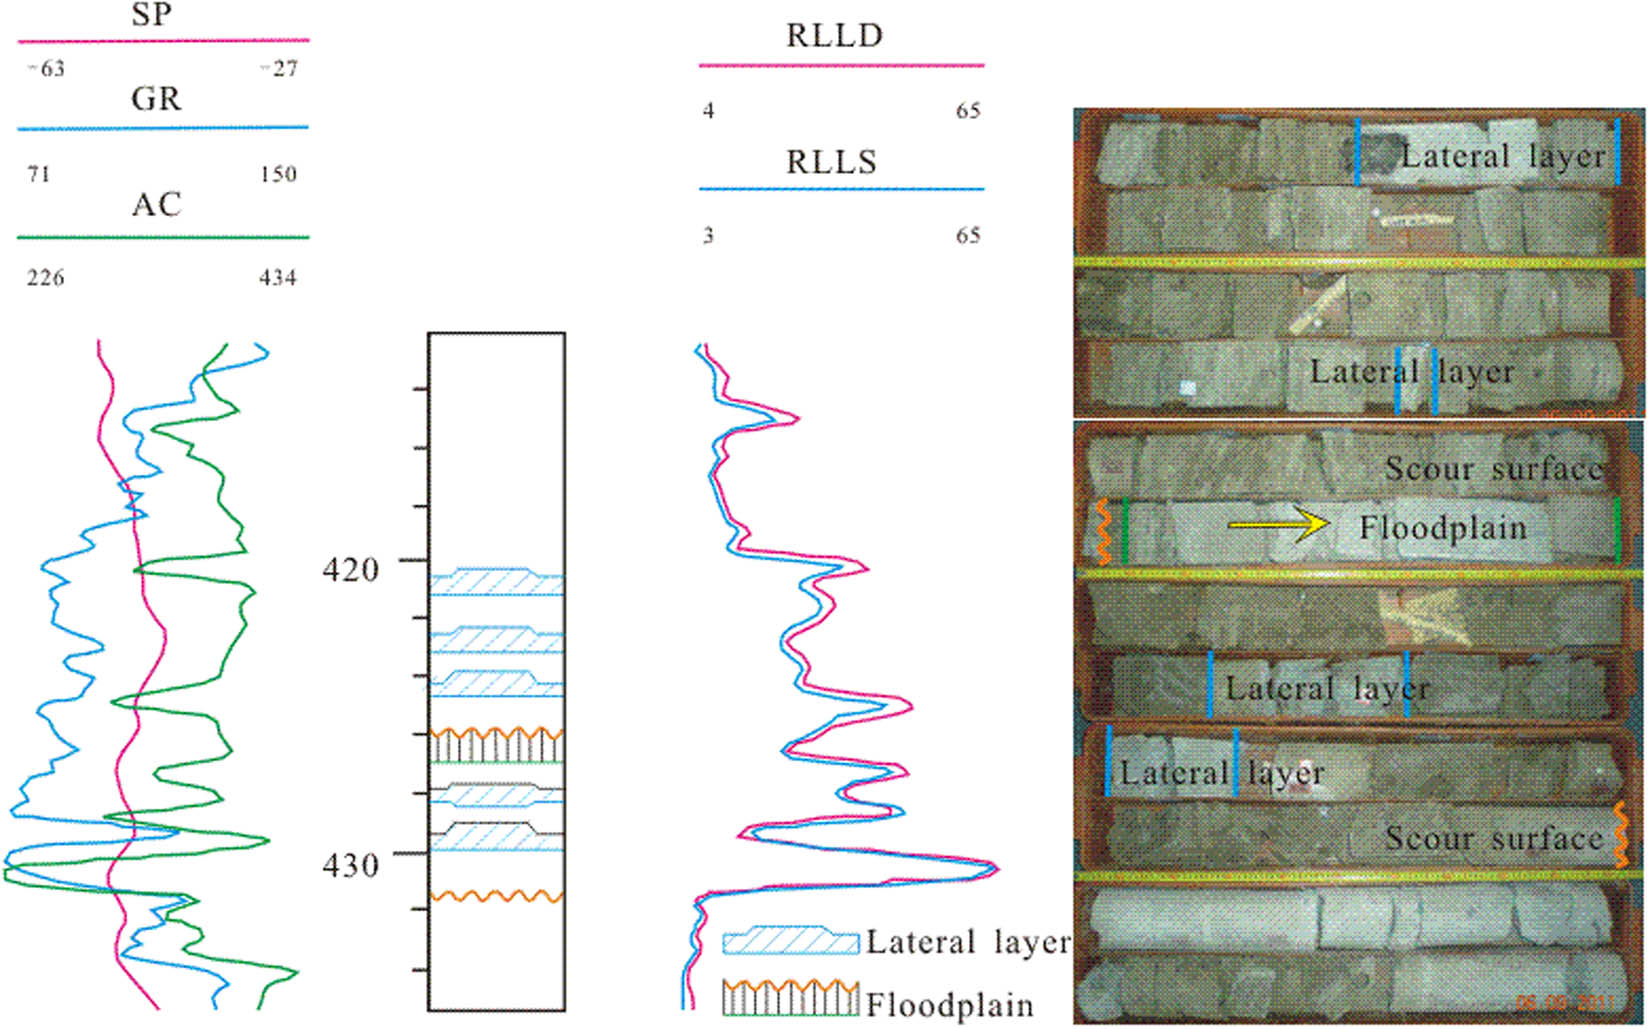
Characteristics of lateral accretion layer of Jll coring well.
The abundant logging and dynamic data, combing with the geological information acquired by the core, are conducive to the dissection of the architecture characteristics in the dense well block. Taking the point bar of X15-17.4 dense well block as an example, six lateral deposits are developed in the AC direction (Figure 7a). Abandoned channels are developed at the location of the X17-017.4 well. It can be seen from the section AB that although the well X15-17.4 and the well X15-6.4 are at the same point bar, the No.4 lateral deposit of the well X15-7.4 is not connected with the upper perforated section of the well X15-16.4. The upper part of the well X15-16.4 is ineffective in the process of the water injection development. The water injected in the well X15-16.3 is more affected by gravity and is pushed along the lower part of the sand body in the point bar, and the corresponding perforation section in the lower part of the well X15-16.4 is effective. In the section AC, the perforation interval of the well X17-17.2 is affected by the injection wells in the direction of X15-17.4. Therefore, it can be inferred that the lateral deposit No. 2 of the well X17-17.2 is an extension of the No. 4 lateral deposit in the upper part of the X15-17.4 well.
![Figure 7
Point bar architecture anatomy in the dense well area of X15-17.4. (a) Well location map in well area of X15-17.4; (b) lateral deposits in the AB direction; (c) lateral deposits in the AC direction (edited from [45]). A TIF file at 600 dots per inch will exceed 100 megabytes.](/document/doi/10.1515/geo-2020-0222/asset/graphic/j_geo-2020-0222_fig_007.jpg)
Point bar architecture anatomy in the dense well area of X15-17.4. (a) Well location map in well area of X15-17.4; (b) lateral deposits in the AB direction; (c) lateral deposits in the AC direction (edited from [45]). A TIF file at 600 dots per inch will exceed 100 megabytes.
By examining the well-logging data encrypted later between X15-17.4 and X17-17.2, it can be confirmed that the fourth lateral deposits of the well X15-17.4 and the third lateral deposits of the well X15-18.4 are connected with the No. 2 lateral deposit of X17-17.2. Flattening the marker layer at the top of the strata indicates that the elevation difference in the lateral layer between the well X15-17.4 and the well X15-18.4 is 1 m, and the calculated dip angle of the lateral layer is 2.5°, which is consistent with the coring data. Further calculation of the spacing of the lateral layer in the well area is 35–55 m, verifying the accuracy of the estimation results.
A total of 315 wells of 24 point bars are selected for statistics. The statistical findings show that the number of lateral layers identified by single well is 1–3, and the thickness of lateral layers is mainly near 0.3 m. The average density of lateral layers is 0.125, and the frequency of lateral layers is 0.19 layer/m. What’s more, 8 coring wells and 24 pairs of twin wells with spacing of less than 30 m suggest that the dip angle of the lateral layer is 2.3–5.6°, the average dip angle is 3°, and the horizontal spacing of lateral layers is approximately 45 m.
5 Results and discussion
Existing geological researches have shown that a single point bar is formed near the well X24-1. The lateral extension direction of the point bar is 268°. The deterministic three-dimensional model has a grid I/J/K resolution of 20 × 20 × 0.5 m. The point bar consists of 11 lateral layers and 12 lateral deposits. The lateral deposit inclination angle is 2.5–5°, and the lateral extension and the length of the point bar are 435 and 467 m, respectively. The lateral deposits have a spacing of 25–45 m and an average spacing is 37 m.
The direction of the lateral layer is set to be almost perpendicular to the lateral extension direction of the point bar. The retroflexion curve model of the top and bottom coordinates of the lateral layer at the crossing point restricts the shape of the lateral layer. In the next step, the thickness model of lateral layer will be automatically generated in the range of the lateral surface. In the model embedding process, the local encrypted grid with 2 × 2 × 0.1 m resolution is used to approximately express the lateral layer with a thickness of 0.3–0.8 m. This process ensures the need for a valid volume and the number of grid nodes and, finally, embeds the lateral layer into the point bar grid model.
The three-dimensional characterization of the reservoir architecture in the point bars is successfully realized, and the geometric shape, contact relationship, and spatial distribution of lateral deposits and lateral layer have been reproduced. The conditionalization of each well location can be achieved. The distribution of cross-well architecture units can also be effectively predicted. The 12-stage lateral deposits developed inside the point bar are separated by the muddy lateral layers in the middle and upper parts of the point bar (Figure 8). The shape, scale, and location of each stage lateral deposits and lateral layers show a successive gradual change in law. The deterministic modeling results not only conform to the pattern of architecture combination on the plane but also reflect the geological knowledge well. In addition, the scale characteristics of point bar, internal structure information, and heterogeneity parameters can be reproduced for the numerical simulation and remaining oil distribution research.

3D architecture model of X24-1 well area. (a) Deterministic modeling stereogram; (b) deterministic modeling grid-like diagram.
Reservoir architecture modeling based on geological vector information requires geologists to define the architecture elements in the model. The spatial morphology and the relative position relationship are described by the morphological parameters and mathematical relations of architecture elements. For dense well blocks, the well spacing can meet the requirements of single well identification for various types of architecture element and can also achieve the purpose of judging the relative position relationship between architecture elements.
It should be pointed out that in the geological modeling process of the underground thin-well network, the density of the well net does not reach the requirement of controlling the spatial distribution of the geological body. Using the modeling method based on geological vector information, the established model is difficult to conform to geological reality. More logging combined with seismic data are needed in the modeling process to describe the spatial distribution of reservoirs. Besides, when the shape of the sand body of the point bar is irregular or the distribution of the point bar is serious, the effectiveness of the above method will be reduced.
6 Conclusions
A deterministic architecture modeling method based on geological vector information was proposed to build point bar model in dense well block. Geological vector information was obtained by the means of outcrop description, modern sedimentary, and point bar anatomy in dense well block. The shape, scale, and location of lateral deposits and lateral layers can be well presented in the model, which provide internal structure information and heterogeneity characteristics in high-sinuosity meandering river reservoir.
For other sedimentary facies, it is suggested to strengthen comprehensive geological analysis, such as increasing the research of sediment physical simulation and ground penetrating radar to obtain accurate quality vector information, so as to improve the accuracy and practicability of modeling.
Nomenclature
- D
-
bank-full channel depth, m
- W c
-
bank-full channel width, m
- W m
-
meander-belt width, m
- S
-
channel sinuosity
- Q
-
annual discharge, m3/s
Acknowledgments
This study was financially supported by the National Science Technology Major Project (No. 2016ZX05015), PetroChina Innovation Foundation (No. 2019D-5007-0210), National Natural Science Foundation of China (No. 51904050 and 41902153), the Chongqing Natural Science Foundation Project (No. cstc2019jcyj-msxmX0725) and the Science and Technology Research Program of Chongqing Municipal Education Commission (Grant No. KJQN201901531).
References
[1] Miall AD. Architectural-element analysis: a new method of facies analysis applied to fluvial deposits. Earth Sci Rev. 1985;22:261–308.10.2110/scn.85.19.0033Search in Google Scholar
[2] Kjemperud VA, Schomacker RE, Cross AT. Architecture and stratigraphy of alluvial deposits, Morrison formation (Upper Jurassic), Utah. AAPG Bull. 2008;92(8):1055–76.10.1306/03250807115Search in Google Scholar
[3] Wang M, Yang Z, Shui C, Yu Z, Wang Z, Cheng Y. Diagenesis and its influence on reservoir quality and oil-water relative permeability: a case study in the Yanchang formation Chang 8 tight sandstone oil reservoir, Ordos basin, China. Open Geosci. 2019;11:37–47.10.1515/geo-2019-0004Search in Google Scholar
[4] Seyyedhossein H, Abdolrahim J, Majid AP, Hossein K. Two-point versus multiple-point geostatistics: the ability of geostatistical methods to capture complex geobodies and their facies associations – an application to a channelized carbonate reservoir, southwest Iran. J Geophys Eng. 2014;6:065002.10.1088/1742-2132/11/6/065002Search in Google Scholar
[5] Tye RS, Hickey JJ. Permeability characterization of distributary mouth bar sandstones in Prudhoe Bay field, Alaska: how horizontal cores reduce risk in developing deltaic reservoirs. AAPG Bull. 2001;85(3):459–75.10.1306/8626C91F-173B-11D7-8645000102C1865DSearch in Google Scholar
[6] Wang DY, Li ZW, Li ZW, Ma WM, Nie XD, Yi YJ. Point bars retained particulate organic carbon within a meandering river corridor in Zoige basin of the Tibetan Plateau. J Hydrol. 2020;588:125112.10.1016/j.jhydrol.2020.125112Search in Google Scholar
[7] Wright LD. Sediment transport at river mouths: a synthesis. Geol Soc Am Bull. 1977;88:857–68.10.1130/0016-7606(1977)88<857:STADAR>2.0.CO;2Search in Google Scholar
[8] Tye RS. Geomorphology: an approach to determining subsurface reservoir dimensions. AAPG Bull. 2004;88:1123–47.10.1306/02090403100Search in Google Scholar
[9] Gibling MR. Width and thickness of fluvial channel bodies and valley fills in the geological record: a literature compilation and classification. J Sediment Res. 2006;76:731–70.10.2110/jsr.2006.060Search in Google Scholar
[10] Dalrymple M. Fluvial reservoir architecture in the Stratfjord formation (northern North Sea) augmented by outcrop analog statistics. Pet Geosci. 2001;7:115–22.10.1144/petgeo.7.2.115Search in Google Scholar
[11] Colombera L, Mountney NP, McCaffrey WD. A relational database for the digitization of fluvial architecture: concepts and example applications. Pet Geosci. 2012;18:129–40.10.1144/1354-079311-021Search in Google Scholar
[12] Zhang P, Zhang J, Wang J, Li M, Liang J, Wu Y. Flow units classification for geostatisitical three-dimensional modeling of a non-marine sandstone reservoir: a case study from the paleocene funing formation of the Gaoji oilfield, east China. Open Geosci. 2018;10:113–20.10.1515/geo-2018-0009Search in Google Scholar
[13] Wang JK, Zhang JL, Xie J. Analysis of the factors that influence diagenesis in the terminal fan reservoir of fuyu oil layer in the southern Songliao basin, northeast China. Open Geosci. 2018;10:866–81.10.1515/geo-2018-0068Search in Google Scholar
[14] Caers J. Geostatistical reservoir modeling using statistical pattern recognition. J Pet Sci Eng. 2001;29:177–88.10.1016/S0920-4105(01)00088-2Search in Google Scholar
[15] Liu Y. Using the Snesim program for multiple-point statistical simulation. Comput Geosci. 2006;32:1544–63.10.1016/j.cageo.2006.02.008Search in Google Scholar
[16] Maharaja A. Tigenerator: object-based training image generator. Comput Geosci. 2008;34:1753–61.10.1016/j.cageo.2007.08.012Search in Google Scholar
[17] Strebelle S. Conditional simulation of complex geological structures using multiple-point statistics. Math Geol. 2002;34:1–21.10.1023/A:1014009426274Search in Google Scholar
[18] Hashemi S, Javaherian A, Ataee-Pour M, Tahmasebi P, Khoshdel H. Channel characterization using multiple-point geostatistics, neural network, and modern analogy: a case study from a carbonate reservoir, southwest Iran. J Appl Geophys. 2014;111:47–58.10.1016/j.jappgeo.2014.09.015Search in Google Scholar
[19] Ghazi S, Mountney PN. Facies and architectural element analysis of a meandering fluvial succession: The Permian Warchha Sandstone, Salt Range, Pakistan. Sediment Geol. 2009;221:99–126.10.1016/j.sedgeo.2009.08.002Search in Google Scholar
[20] Lorenz JC, Heinze DM, Clark JA. Determination of widths of meander-belt sandstone reservoirs from vertical downhole data, Mesaverde Group, Piceance Creek basin, Colorado. AAPG Bull. 1985;69(5):710–21.10.1306/AD4627EF-16F7-11D7-8645000102C1865DSearch in Google Scholar
[21] Constantine JA, Dunne T. Meander cutoff and the controls on the production of oxbow lakes. Geology. 2008;36(1):23–6.10.1130/G24130A.1Search in Google Scholar
[22] Deutsch CV, Tran TT. Fluvsim: a program for object-based stochastic modeling of fluvial depositional systems. Comput Geosci. 2002;28(4):525–35.10.1016/S0098-3004(01)00075-9Search in Google Scholar
[23] Deutsch CV, Wang LB. Hierarchical object-based stochastic modeling of fluvial reservoirs. Math Geol. 1996;28(7):857–80.10.1007/BF02066005Search in Google Scholar
[24] Holden L, Hauge R, Skare A. Modeling of fluvial reservoirs with object models. Math Geol. 1998;30(5):473–96.10.1023/A:1021769526425Search in Google Scholar
[25] Allen JRL. Studies in fluviatile sedimentation: an exploratory quantitative model for the architecture of avulsion-controlled alluvial suites. Sediment Geol. 1978;21:129–47.10.1016/0037-0738(78)90002-7Search in Google Scholar
[26] Leeder MR. A quantitative stratigraphic model for alluvium, with special reference to channel deposit density and interconnectedness. in: Miall AD, ed., Fluvial sedimentology. Canadian Society of Petroleum Geologists Memoir 5. Tulsa, USA: The American Association of Petroleum Geologists; 1978, p. 587–96.Search in Google Scholar
[27] Mackey SD, Bridge JS. Three-dimensional model of alluvial stratigraphy: theory and application. J Sediment Res. 1995;65(1):7–31.10.1306/D42681D5-2B26-11D7-8648000102C1865DSearch in Google Scholar
[28] Tyler K, Henriquez A, Svanes T. Modeling heterogeneities in fluvial domains: a review of the influence on production profiles. in: Yarus JM, Chambers RL, eds., Stochastic modeling and geostatistics: principles, methods, and case studies. AAPG Computer Applications in Geology 3. Tulsa, USA: The American Association of Petroleum Geologists; 1994, p. 77–89.Search in Google Scholar
[29] Dalrymple M. Fluvial reservoir architecture in the Statfjord formation (northern North Sea) augmented by outcrop analogue statistics. Pet Geosci. 2001;7:115–22.10.1144/petgeo.7.2.115Search in Google Scholar
[30] Stephen KD, Dalrymple M. Reservoir simulations developed from an outcrop of incised valley fill strata. AAPG Bull. 2003;86(5):797–822.10.1306/61EEDBA2-173E-11D7-8645000102C1865DSearch in Google Scholar
[31] Novakovic D, White CD, Corbeanu RM, Hammon WS, Bhattacharya JP, McMechan GA. Hydraulic effects of shales in fluvial-deltaic deposits: ground-penetrating radar, outcrop observations, geostatistics, and three-dimensional flow modeling for the Ferron Sandstone, Utah. Math Geol. 2002;34(7):857–93.10.1023/A:1020980711937Search in Google Scholar
[32] Patterson PE, Jones TA, Donofrio CJ, Donovan AD, Ottmann JD. Geologic modeling of external and internal reservoir architecture of fluvial depositional systems. in: Armstrong M, Bettini C, Champigny N, Galli A, eds., Geostatistics Rio 2000, proceedings of the geostatistics sessions of the 31st international geological congress, Rio de Janeiro, Brazil. Dordrecht, The Netherlands: Kluwer Academic Publishers; 2002. p. 41–52.10.1007/978-94-017-1701-4_4Search in Google Scholar
[33] Richardson JG, Harris DG, Rossen RH, Hee GV. The effect of small, discontinuous shales on oil recovery. J Pet Technol. 1978;20:1531–7.10.2118/6700-PASearch in Google Scholar
[34] Robinson JR, McCabe PJ. Sandstone-body and shale body dimensions in a braided fluvial system: Salt Wash sandstone member (Morrison formation), Garfield county, Utah. AAPG Bull. 1997;81:1267–91.Search in Google Scholar
[35] Weber KJ. Influence of common sedimentary structures on fluid flow in reservoir models. J Pet Technol. 1982;34:665–72.10.2118/9247-PASearch in Google Scholar
[36] Caers J, Zhang T. Multiple-point geostatistics: a quantitative vehicle for integrating geologic analogs into multiple reservoir models. AAPG Mem. 2004;80:383–94.10.1306/M80924C18Search in Google Scholar
[37] Seifert D, Jensen JL. Object and pixel-based reservoir modeling of a braided fluvial reservoir. Math Geol. 2000;32(5):581–603.10.1023/A:1007562221431Search in Google Scholar
[38] Deutsch CV. A sequential indicator simulation program for categorical variables with point and block data: BlockSIS. Comput Geosci. 2006;32(10):1669–81.10.1016/j.cageo.2006.03.005Search in Google Scholar
[39] Zhang L, Bao ZD, Lin YB, Chen YM, Lin XH, Dou LX. Genetic types and sedimentary model of sandbodies in a shallow-water delta: a case study of the first member of Cretaceous Yaojia formation in Qian’an area, south of Songliao basin, NE China. Pet Explor Dev. 2017;44(5):727–36.10.1016/S1876-3804(17)30087-3Search in Google Scholar
[40] Luo C, Jia AL, Luo SL. Facies differentiation within the sequence straigraphic framework of Q4 formation in eastern Fuxin uplift zone. J China Univ Min Technol. 2016;45(2):357–70.Search in Google Scholar
[41] Donselaar EM, Overeem I. Connectivity of fluvial point-bar deposits: an example from the Miocene Huesca fluvial fan, Ebro Basin, Spain. AAPG Bull. 2008;92(9):1109–29.10.1306/04180807079Search in Google Scholar
[42] Williams GP. River meanders and channel size. J Hydrol. 1986;88:14–164.10.1016/0022-1694(86)90202-7Search in Google Scholar
[43] Ghinassi M, Nemec W, Aldinucci M, Nehyba S, Ozaksoy V, Fidolini F. Plan-form evolution of ancient meandering rivers reconstructed from longitudinal outcrop sections. Sedimentology. 2014;41:952–77.10.1111/sed.12081Search in Google Scholar
[44] Collinson JD. Alluvial sediments. in: Reading HG, ed., Sedimentary environments and facies. Oxford: Blackwell Scientific Publications; 1978, p. 15–60.Search in Google Scholar
[45] Luo C, Luo SL, Jia AL. Architecture differences of subsurface reservoir in Quan 3 formation of eastern Fuxin uplifting. J Cent South Univ (Sci Technol). 2016;47(5):1637–48.Search in Google Scholar
[46] Le Clair SF, Bridge JS. Quantitative interpretation of sedimentary structures formed by river dunes. J Sediment Res. 2001;71:713–6.10.1306/2DC40962-0E47-11D7-8643000102C1865DSearch in Google Scholar
[47] Li YP, Wu SH, Geng LH. Spatial-vector-based reservoir architecture modeling of point-bar sand. Acta Pet Sin. 2013;34(1):133–9.Search in Google Scholar
[48] Bridge SJ, Tye SR. Interpreting the dimensions of ancient fluvial channel bars, channels, and channel belts from wireline-logs and cores. AAPG Bull. 2000;84(8):1205–28.10.1306/A9673C84-1738-11D7-8645000102C1865DSearch in Google Scholar
[49] Wang Y, Chen SY. Meandering river sand body architecture and heterogeneity: a case study of Permian meandering river outcrop in Palougou, Baode, Shanxi province. Pet Explor Dev. 2016;43(2):209–18.10.1016/S1876-3804(16)30026-XSearch in Google Scholar
© 2021 Chao Luo et al., published by De Gruyter
This work is licensed under the Creative Commons Attribution 4.0 International License.
Articles in the same Issue
- Regular Articles
- Lithopetrographic and geochemical features of the Saalian tills in the Szczerców outcrop (Poland) in various deformation settings
- Spatiotemporal change of land use for deceased in Beijing since the mid-twentieth century
- Geomorphological immaturity as a factor conditioning the dynamics of channel processes in Rządza River
- Modeling of dense well block point bar architecture based on geological vector information: A case study of the third member of Quantou Formation in Songliao Basin
- Predicting the gas resource potential in reservoir C-sand interval of Lower Goru Formation, Middle Indus Basin, Pakistan
- Study on the viscoelastic–viscoplastic model of layered siltstone using creep test and RBF neural network
- Assessment of Chlorophyll-a concentration from Sentinel-3 satellite images at the Mediterranean Sea using CMEMS open source in situ data
- Spatiotemporal evolution of single sandbodies controlled by allocyclicity and autocyclicity in the shallow-water braided river delta front of an open lacustrine basin
- Research and application of seismic porosity inversion method for carbonate reservoir based on Gassmann’s equation
- Impulse noise treatment in magnetotelluric inversion
- Application of multivariate regression on magnetic data to determine further drilling site for iron exploration
- Comparative application of photogrammetry, handmapping and android smartphone for geotechnical mapping and slope stability analysis
- Geochemistry of the black rock series of lower Cambrian Qiongzhusi Formation, SW Yangtze Block, China: Reconstruction of sedimentary and tectonic environments
- The timing of Barleik Formation and its implication for the Devonian tectonic evolution of Western Junggar, NW China
- Risk assessment of geological disasters in Nyingchi, Tibet
- Effect of microbial combination with organic fertilizer on Elymus dahuricus
- An OGC web service geospatial data semantic similarity model for improving geospatial service discovery
- Subsurface structure investigation of the United Arab Emirates using gravity data
- Shallow geophysical and hydrological investigations to identify groundwater contamination in Wadi Bani Malik dam area Jeddah, Saudi Arabia
- Consideration of hyperspectral data in intraspecific variation (spectrotaxonomy) in Prosopis juliflora (Sw.) DC, Saudi Arabia
- Characteristics and evaluation of the Upper Paleozoic source rocks in the Southern North China Basin
- Geospatial assessment of wetland soils for rice production in Ajibode using geospatial techniques
- Input/output inconsistencies of daily evapotranspiration conducted empirically using remote sensing data in arid environments
- Geotechnical profiling of a surface mine waste dump using 2D Wenner–Schlumberger configuration
- Forest cover assessment using remote-sensing techniques in Crete Island, Greece
- Stability of an abandoned siderite mine: A case study in northern Spain
- Assessment of the SWAT model in simulating watersheds in arid regions: Case study of the Yarmouk River Basin (Jordan)
- The spatial distribution characteristics of Nb–Ta of mafic rocks in subduction zones
- Comparison of hydrological model ensemble forecasting based on multiple members and ensemble methods
- Extraction of fractional vegetation cover in arid desert area based on Chinese GF-6 satellite
- Detection and modeling of soil salinity variations in arid lands using remote sensing data
- Monitoring and simulating the distribution of phytoplankton in constructed wetlands based on SPOT 6 images
- Is there an equality in the spatial distribution of urban vitality: A case study of Wuhan in China
- Considering the geological significance in data preprocessing and improving the prediction accuracy of hot springs by deep learning
- Comparing LiDAR and SfM digital surface models for three land cover types
- East Asian monsoon during the past 10,000 years recorded by grain size of Yangtze River delta
- Influence of diagenetic features on petrophysical properties of fine-grained rocks of Oligocene strata in the Lower Indus Basin, Pakistan
- Impact of wall movements on the location of passive Earth thrust
- Ecological risk assessment of toxic metal pollution in the industrial zone on the northern slope of the East Tianshan Mountains in Xinjiang, NW China
- Seasonal color matching method of ornamental plants in urban landscape construction
- Influence of interbedded rock association and fracture characteristics on gas accumulation in the lower Silurian Shiniulan formation, Northern Guizhou Province
- Spatiotemporal variation in groundwater level within the Manas River Basin, Northwest China: Relative impacts of natural and human factors
- GIS and geographical analysis of the main harbors in the world
- Laboratory test and numerical simulation of composite geomembrane leakage in plain reservoir
- Structural deformation characteristics of the Lower Yangtze area in South China and its structural physical simulation experiments
- Analysis on vegetation cover changes and the driving factors in the mid-lower reaches of Hanjiang River Basin between 2001 and 2015
- Extraction of road boundary from MLS data using laser scanner ground trajectory
- Research on the improvement of single tree segmentation algorithm based on airborne LiDAR point cloud
- Research on the conservation and sustainable development strategies of modern historical heritage in the Dabie Mountains based on GIS
- Cenozoic paleostress field of tectonic evolution in Qaidam Basin, northern Tibet
- Sedimentary facies, stratigraphy, and depositional environments of the Ecca Group, Karoo Supergroup in the Eastern Cape Province of South Africa
- Water deep mapping from HJ-1B satellite data by a deep network model in the sea area of Pearl River Estuary, China
- Identifying the density of grassland fire points with kernel density estimation based on spatial distribution characteristics
- A machine learning-driven stochastic simulation of underground sulfide distribution with multiple constraints
- Origin of the low-medium temperature hot springs around Nanjing, China
- LCBRG: A lane-level road cluster mining algorithm with bidirectional region growing
- Constructing 3D geological models based on large-scale geological maps
- Crops planting structure and karst rocky desertification analysis by Sentinel-1 data
- Physical, geochemical, and clay mineralogical properties of unstable soil slopes in the Cameron Highlands
- Estimation of total groundwater reserves and delineation of weathered/fault zones for aquifer potential: A case study from the Federal District of Brazil
- Characteristic and paleoenvironment significance of microbially induced sedimentary structures (MISS) in terrestrial facies across P-T boundary in Western Henan Province, North China
- Experimental study on the behavior of MSE wall having full-height rigid facing and segmental panel-type wall facing
- Prediction of total landslide volume in watershed scale under rainfall events using a probability model
- Toward rainfall prediction by machine learning in Perfume River Basin, Thua Thien Hue Province, Vietnam
- A PLSR model to predict soil salinity using Sentinel-2 MSI data
- Compressive strength and thermal properties of sand–bentonite mixture
- Age of the lower Cambrian Vanadium deposit, East Guizhou, South China: Evidences from age of tuff and carbon isotope analysis along the Bagong section
- Identification and logging evaluation of poor reservoirs in X Oilfield
- Geothermal resource potential assessment of Erdaobaihe, Changbaishan volcanic field: Constraints from geophysics
- Geochemical and petrographic characteristics of sediments along the transboundary (Kenya–Tanzania) Umba River as indicators of provenance and weathering
- Production of a homogeneous seismic catalog based on machine learning for northeast Egypt
- Analysis of transport path and source distribution of winter air pollution in Shenyang
- Triaxial creep tests of glacitectonically disturbed stiff clay – structural, strength, and slope stability aspects
- Effect of groundwater fluctuation, construction, and retaining system on slope stability of Avas Hill in Hungary
- Spatial modeling of ground subsidence susceptibility along Al-Shamal train pathway in Saudi Arabia
- Pore throat characteristics of tight reservoirs by a combined mercury method: A case study of the member 2 of Xujiahe Formation in Yingshan gasfield, North Sichuan Basin
- Geochemistry of the mudrocks and sandstones from the Bredasdorp Basin, offshore South Africa: Implications for tectonic provenance and paleoweathering
- Apriori association rule and K-means clustering algorithms for interpretation of pre-event landslide areas and landslide inventory mapping
- Lithology classification of volcanic rocks based on conventional logging data of machine learning: A case study of the eastern depression of Liaohe oil field
- Sequence stratigraphy and coal accumulation model of the Taiyuan Formation in the Tashan Mine, Datong Basin, China
- Influence of thick soft superficial layers of seabed on ground motion and its treatment suggestions for site response analysis
- Monitoring the spatiotemporal dynamics of surface water body of the Xiaolangdi Reservoir using Landsat-5/7/8 imagery and Google Earth Engine
- Research on the traditional zoning, evolution, and integrated conservation of village cultural landscapes based on “production-living-ecology spaces” – A case study of villages in Meicheng, Guangdong, China
- A prediction method for water enrichment in aquifer based on GIS and coupled AHP–entropy model
- Earthflow reactivation assessment by multichannel analysis of surface waves and electrical resistivity tomography: A case study
- Geologic structures associated with gold mineralization in the Kirk Range area in Southern Malawi
- Research on the impact of expressway on its peripheral land use in Hunan Province, China
- Concentrations of heavy metals in PM2.5 and health risk assessment around Chinese New Year in Dalian, China
- Origin of carbonate cements in deep sandstone reservoirs and its significance for hydrocarbon indication: A case of Shahejie Formation in Dongying Sag
- Coupling the K-nearest neighbors and locally weighted linear regression with ensemble Kalman filter for data-driven data assimilation
- Multihazard susceptibility assessment: A case study – Municipality of Štrpce (Southern Serbia)
- A full-view scenario model for urban waterlogging response in a big data environment
- Elemental geochemistry of the Middle Jurassic shales in the northern Qaidam Basin, northwestern China: Constraints for tectonics and paleoclimate
- Geometric similarity of the twin collapsed glaciers in the west Tibet
- Improved gas sand facies classification and enhanced reservoir description based on calibrated rock physics modelling: A case study
- Utilization of dolerite waste powder for improving geotechnical parameters of compacted clay soil
- Geochemical characterization of the source rock intervals, Beni-Suef Basin, West Nile Valley, Egypt
- Satellite-based evaluation of temporal change in cultivated land in Southern Punjab (Multan region) through dynamics of vegetation and land surface temperature
- Ground motion of the Ms7.0 Jiuzhaigou earthquake
- Shale types and sedimentary environments of the Upper Ordovician Wufeng Formation-Member 1 of the Lower Silurian Longmaxi Formation in western Hubei Province, China
- An era of Sentinels in flood management: Potential of Sentinel-1, -2, and -3 satellites for effective flood management
- Water quality assessment and spatial–temporal variation analysis in Erhai lake, southwest China
- Dynamic analysis of particulate pollution in haze in Harbin city, Northeast China
- Comparison of statistical and analytical hierarchy process methods on flood susceptibility mapping: In a case study of the Lake Tana sub-basin in northwestern Ethiopia
- Performance comparison of the wavenumber and spatial domain techniques for mapping basement reliefs from gravity data
- Spatiotemporal evolution of ecological environment quality in arid areas based on the remote sensing ecological distance index: A case study of Yuyang district in Yulin city, China
- Petrogenesis and tectonic significance of the Mengjiaping beschtauite in the southern Taihang mountains
- Review Articles
- The significance of scanning electron microscopy (SEM) analysis on the microstructure of improved clay: An overview
- A review of some nonexplosive alternative methods to conventional rock blasting
- Retrieval of digital elevation models from Sentinel-1 radar data – open applications, techniques, and limitations
- A review of genetic classification and characteristics of soil cracks
- Potential CO2 forcing and Asian summer monsoon precipitation trends during the last 2,000 years
- Erratum
- Erratum to “Calibration of the depth invariant algorithm to monitor the tidal action of Rabigh City at the Red Sea Coast, Saudi Arabia”
- Rapid Communication
- Individual tree detection using UAV-lidar and UAV-SfM data: A tutorial for beginners
- Technical Note
- Construction and application of the 3D geo-hazard monitoring and early warning platform
- Enhancing the success of new dams implantation under semi-arid climate, based on a multicriteria analysis approach: Case of Marrakech region (Central Morocco)
- TRANSFORMATION OF TRADITIONAL CULTURAL LANDSCAPES - Koper 2019
- The “changing actor” and the transformation of landscapes