Typical fault prediction method for wind turbines based on an improved stacked autoencoder network
-
Zhiyuan Ma
 ,
Yi Deng
,
Yi Deng

Abstract
Timely prediction of wind turbine states is valuable for reduction of potential significant losses resulting from deterioration of health condition. To enhance the accuracy of fault diagnosis and early warning, data collected from supervisory control and data acquisition (SCADA) system of wind turbines is graphically processed and used as input for a deep learning mode, which effectively reflects the correlation between the faults of different components of wind turbines and the multi-state information in SCADA data. An improved stacked autoencoder (ISAE) framework is proposed to address the issue of ineffective fault identification due to the scarcity of labeled samples for certain fault types. In the data augmentation module, synthetic samples are generated using SAE to enhance the training data. Another SAE model is trained using the augmented dataset in the data prediction module for future trend prediction. The attribute correlation information is embedded to compensate for the shortcomings of SAE in learning attribute relationships, and the optimal factor parameters are searched using the particle swarm optimization (PSO) algorithm. Finally, the state of wind turbines is predicted using a CNN-based fault diagnosis module. Experimental results demonstrate that the proposed method can effectively predict faults and identify fault types in advance, which is helpful for wind farms to take proactive measures and schedule maintenance plans to avoid significant losses.
1 Introduction
In recent years, as a highly promising clean and renewable energy source, wind energy has become an essential component in solving the world’s energy problems (Ahuja and Kumar 2019). The global installation capacity of wind turbines has been increasing year by year. However, wind turbines (WT) inevitably experience faults during long-term operation, and sudden shutdowns caused by WT faults can result in significant economic losses and have a significant impact on stable operation of power grid. Therefore, to ensure that the WTs operate reliably and efficiently, and to reduce the operation and maintenance costs of power systems, accurate and reliable fault warning and maintenance based on the actual situation is a critical issue needs to be urgently solved (Leahy et al. 2019).
Traditional maintenance strategies for WTs mainly adopt two standard maintenance approaches, corrective maintenance and preventive maintenance (Yürüşen et al. 2020). Corrective maintenance is performed when the turbine experiences a fault, or when a fault is detected or diagnosed in any of its components. At this point, the fault or even a major accident has already occurred, requiring immediate overhaul or replacement of the components, resulting in unplanned downtime and maintenance costs (Nachimuthu, Zuo, and Ding 2019). On the other hand, the goal of preventive maintenance is to repair or replace components before failures, by performing regular inspections and small maintenance operations, and replacing components based on operating time. Therefore, this approach is also known as periodic maintenance (Zheng, Zhou, and Zhang 2020). Although this strategy can reduce the frequency of faults to some extent, it comes with the cost of more frequent maintenance tasks and early replacement of components that may not have reached the end of their useful life, resulting in significant losses of human and material resources. Condition monitoring technology continuously monitors the operating status of each subsystem and component of the turbine by collecting sensor information, detects potential early faults, and timely plans and arranges appropriate maintenance measures before serious faults occur, to prevent secondary damage to components or even catastrophic accidents (Badihi et al. 2022).
Wind farms have been seeking an efficient, accurate, and cost-effective way to perform intelligent maintenance on wind turbines. In order to achieve status monitoring and maintenance of WTs, Supervisory Control and Data Acquisition (SCADA) system has gradually been applied, which can record all data during the operation of wind turbines (Pliatsios et al. 2020). The characteristics of SCADA system are real-time monitoring, data logging, remote access and control, fault alarms & notifications, data visualization & analytics, redundancy and reliability. Currently, wind farms often use fixed threshold methods to start fault warnings based on the SCADA system for maintenance and other operations on WTs. Although some breakthroughs have been made, this method fails to fully consider the relationships between components in WTs and the importance of each component to the turbine, and therefore cannot provide a comprehensive and sufficient analysis and evaluation of the turbine’s status, resulting in a relatively weak awareness of early warning (He et al. 2020). Therefore, it is crucial to effectively evaluate the operating status of wind turbines, anticipate potential threats, and take measures to avoid faults by fully utilizing the characteristics of SCADA system data. This can help reduce the operation and maintenance costs of wind farms, and is currently the most pressing issue in the wind power industry, which requires further research.
Previous research on evaluation of WT operating status has mainly relied on SCADA system data, combined with methods such as neural networks and Support Vector Machines (SVM) to identify the status of each component in WTs, and combined with fuzzy comprehensive evaluation and principal component analysis to achieve status monitoring of WTs. Tautz-Weinert and Watson (2017) utilized SCADA data to detect faults and monitor the status of WTs from five aspects: data trends, clustering methods, normal behavior modeling, damage modeling, and expert system evaluation. Ding et al. (Ding et al. 2013) first obtained a monitoring model that is not affected by output power and ambient temperature factors using linear regression, and judged whether the generator is faulty by the change of the residual. Du et al. (2016) used the self-organizing map method to transform high-dimensional SCADA system data into a two-dimensional mapping, and combined the Euclidean distance and contribution proportion function to detect anomalies in WTs. Pandit and Infield (2018) determined the anomaly of WTs based on the impact of faults on active power, combined with the monitoring method of Gaussian process and the residual value of the actual active power and power characteristic curve of the WT. Lebranchu et al. (2019) proposed a multi-level strategy that combines single WT and multiple WTs to create fault indicators that are less affected by external factors, improving the performance of fault detection.
As system data becomes increasingly complex and the dimension of data increases, single data-driven methods are no longer applicable, and various techniques that combine or improve on existing methods have gradually emerged. Ouyang, Kusiak, and He (2017) proposed a SVM method based on data partitioning, data mining centers, and three kernel functions to establish a power curve model. By fitting the normal distribution curve to analyze the deviation between the actual model and the normal model, fault prediction was achieved. Abdusamad, Gao, and Muljadi (2013) established a multivariate linear regression model, using parameters in WTs other than generator-related temperature parameters as inputs and the generator-end temperature parameters as outputs, to build a state evaluation system and analyze the status and faults of WTs. Zhu et al. (2019) proposed an improved fuzzy comprehensive method for assessing the gearbox status of WTs. Dynamic thresholds and variable weights obtained through sample data filtering and statistical analysis were used to evaluate the gearbox status, which had higher prediction accuracy than traditional methods. Ren et al. (2019) proposed a WT gearbox fault diagnosis method that combines variational mode decomposition (VMD), multiscale permutation entropy (MPE), and feature transfer learning (FTL). Variational Mode Decomposition (VMD) is a signal processing technique used to decompose a signal into a set of narrowband components called modes. It adjusts the frequency range and bandwidth of each mode to capture different components in the signal effectively. Multiscale Permutation Entropy (MPE) is a technique used to analyze the complexity and irregularity of time series data at multiple scales. It is based on the concept of permutation entropy, which measures the uncertainty or disorder in the order of values in a time series. Feature Transfer Learning (FTL) is a technique used in machine learning to transfer knowledge learned from one domain to another. It leverages pre-trained models on a source domain and adapts them to perform well on a target domain, even when the source and target domains are different. The introduction of the covariance of fault features increases the accuracy of the diagnosis. Sun et al. (2016) trained a prediction model using different types of sample data and proposed a generalized model for WT anomaly identification based on rotor speed, output power, and component temperature. In addition, an anomaly level index was used to quantify the anomaly level of WT parameters and combined fuzzy comprehensive evaluation methods to detect anomalies.
To obtain more sufficient fault warning time and higher fault prediction accuracy, it is necessary to fully explore the fault feature information contained in SCADA data. In recent years, artificial intelligence technology has become a research hotspot, among which neural networks are widely used in WT state prediction due to their high adaptability, nonlinear and function approximation capabilities. Ma et al. (2021) used convolutional neural networks (CNN) to monitor the state and diagnose faults of WT gearbox bearings. Fu et al. (2019) proposed a WT gearbox belt fracture fault prediction method based on long short-term memory (LSTM) network, and results showed that fault diagnosis method based on deep learning performed better than traditional methods. Lei, Liu, and Jiang (2019) proposed an end-to-end LSTM fault diagnosis framework for time-series signals and used simulated SCADA data to identify actuator and sensor faults. Liu et al. (2019) proposed a fault detection model that combines deep autoencoders (DAE) and ensemble learning based on SCADA data, which can adaptively extract fault features and effectively detect faults.
SCADA systems can monitor various operational parameters of WTs. However, previous research has analyzed a single data dimension or monitored multiple parameters without considering variable correlations. As a result, multidimensional data coupling information cannot be fully utilized. To address this issue, a WT fault prediction model based on improved Stacked AutoEncoder(ISAE) framework was proposed. The advantages of ISAE are effective feature extraction, hierarchy of representation, dimensionality reduction, transfer learning, improved generalization, fault diagnosis & prognosis, and real-time prediction. In the proposed framework, data is firstly preprocessed using grayscale imaging. To address the issue of sparse data samples for certain fault types, a double-layer Stacked AutoEncoder (SAE) architecture is proposed. A state prediction model based on SAE is built to predict multiple WT component failures. The particle swarm optimization (PSO) algorithm is used to find the optimal factor parameters to compensate for attribute correlation information. Finally, CNN fault classifier is designed to determine the state and achieve precise fault warning and identification for WTs.
2 Preliminaries
2.1 Normalization of SCADA grayscale images
SCADA system collects and stores various state data of WTs, which can not only monitor the operation of wind power generation systems, but also detect abnormalities and stop the machine in time to avoid faults. The long-term collection and storage of operating state data also facilitates the analysis and prediction of wind turbine failures. Long-term data gathering and storage in wind turbine operations provide valuable insights by enabling historical analysis, identifying failure trends, conducting root cause analysis, detecting early warning signs, developing forecasting models, optimizing performance, supporting decision-making, and advancing research and development.
Due to the wide operating range of wind turbines, the safety thresholds set for each monitored parameter in SCADA system have a high margin. When SCADA system issues an alarm, the WT failure is already severe and cannot prevent the early failure from deteriorating further. The Wind Turbine (WT) may fail to prevent early failure from deteriorating further due to reasons such as lack of early detection, limited monitoring, insufficient maintenance, delayed response, cumulative effects, unexpected failures, complex fault interactions, and aging and wear. To address this, effective fault detection, regular maintenance, timely responses, and predictive maintenance strategies are crucial to enhance the WT’s reliability and prevent further deterioration. Therefore, it is necessary to establish a comprehensive WT fault prediction model that reflects the dynamic characteristics of WTs to achieve early detection and prediction of faults. Monitoring the dynamic characteristics of wind turbines, such as vibration, acoustic emission, power curve, pitch angle, rotor speed, temperature, wind speed, and SCADA data, enables early detection and prediction of faults.
The correlation between different component failures in WTs and the multi-state information in SCADA data exhibit strong coupling. Wind turbine (WT) component failures include isolated faults, but multi-state information in SCADA data indicates continuous and dynamic operating states. Repair or replacement of components is required, whereas multi-state information optimizes performance and eliminates unexpected failures, providing dependable and efficient WT operation. To this point, the SCADA data is graphically processed and input into neural networks as a whole to reflect correlations and couplings among multidimensional information, thereby improving the accuracy of fault warning. The min-max normalization method is not suitable for grayscale image processing on SCADA data. Grayscale image processing involves different techniques like histogram equalization and contrast stretching, while SCADA data requires specific normalization techniques based on its characteristics. First, the min-max normalization method (Perez et al. 2018) is used to perform grayscale imaging processing on the SCADA data. Min-max normalization, also known as range normalization, is a linear transformation of the original data that maps the resulting values to the range [0,1]. It efficiently scales grayscale images derived from SCADA data to the [0, 1] range. It enhances image contrast, ensures compatibility with machine learning algorithms, and aids in numerical stability during training. Normalizing the images allows for easier interpretability and visualization of pixel intensities. The transformation function is defined as follows:
where x is sample data value before normalization, x max represents the maximum value of sample data, and x min represents the minimum value of sample data. Hence, the original data is mapped to the range of [0, 255], forming image data. 255 is the number of gray levels in the grayscale image under standard format. To transform original data into picture data, mapping it to the range [0, 255] involves rescaling the data to [0, 1] using min-max scaling and then multiplying by 255 to represent grayscale pixel intensities. Normalizing an image from 0 to 255 involves dividing the pixel values by 255 to scale them to the range [0, 1], improving numerical stability for tasks like deep learning. Data processed by grayscale normalization is more suitable for neural networks that perform image processing, which can accelerate convergence and improve training speed.
2.2 SAE
AE is a neural network model that learns a set of effective features from a group of data through unsupervised learning. Unsupervised learning is a type of machine learning where the algorithm is trained on unlabeled data without any explicit supervision or guidance. In contrast to supervised learning, where the algorithm learns from labeled data with known input-output pairs, unsupervised learning seeks to find patterns, structures, or relationships within the data on its own. The AE network structure can be divided into two parts: an encoder network and a decoder network, as shown in Figure 1. The encoder network compresses the input data into a lower-dimensional latent space, capturing essential features, while the decoder network reconstructs the original data from the encoded representation, aiming to minimize the reconstruction error.
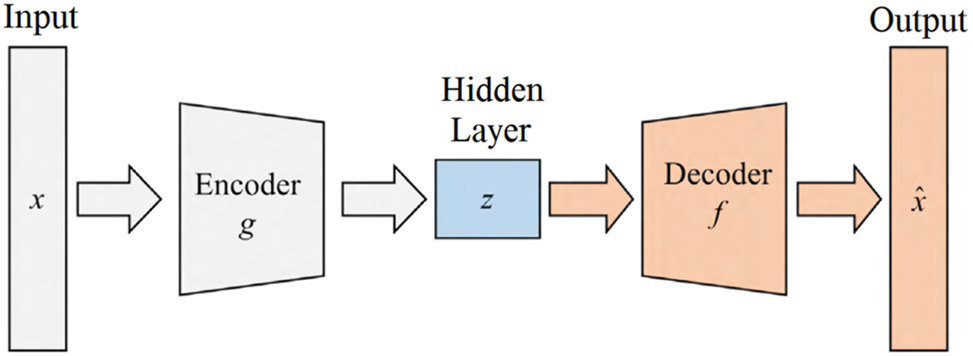
Structure of AE network.
g learns the valid feature of original data x to generate latent variable z, and f attempts to reconstruct the original data from z. The learning objective, also known as the loss function or cost function, defines the goal that the neural network aims to achieve during training. It quantifies how well the network is performing on a specific task or problem. The optimization objective, also known as the optimization algorithm or optimizer, determines how the neural network’s parameters (weights and biases) are updated during the training process. The learning objective is to minimize the reconstruction error, and optimization objective of the network parameters can be described as:
SAE is composed of two or more independent AEs. Each AE consists of an encoder to compress data and a decoder to reconstruct it. The AEs are trained independently in a layer-wise manner during pretraining and then fine-tuned together for the specific task. The SAE learns hierarchical and abstract representations of the input data, allowing it to perform complex tasks effectively. It increases the number of hidden layers and learns various expressions of the original data layer by layer, to better learn abstract feature vectors with different dimensions and hierarchies from complex high-dimensional input data. Therefore, SAE can reduce the dimensionality of input data and has strong ability to extract input feature values through learning. The main differences lie in their architecture, where the ISAE has a deeper stacked structure compared to the SAE’s simpler structure. As a result, the ISAE can learn more complex and hierarchical features, making it more suitable for challenging feature learning tasks with intricate patterns in the data.
3 Fault prediction framework based in ISAE
3.1 ISAE model
The proposed ISAE consists of two SAE models, including a data augmentation module and a data prediction module, as shown in Figure 2. The data augmentation module is a component commonly used in machine learning and deep learning pipelines to increase the size and diversity of the training dataset. It applies various transformations and modifications to the existing data to create new instances that retain the original label or target information. The data prediction module is a component designed to predict missing or future data points based on the information available in the existing dataset. This module is often employed in time series forecasting, sequence modeling, and data imputation tasks. The Stacked Autoencoder (SAE) is employed in the data prediction module to extract relevant features from the enhanced dataset. The SAE, an unsupervised learning algorithm, learns compressed and abstract representations of the data during training. The extracted features are then used in data prediction tasks, leading to improved performance compared to using raw data directly. In the data augmentation module, SAE is used to generate simulated samples to address the problem of insufficient sample sets. The data augmentation module aims to increase the dataset size and diversify data by applying transformations to the original data. While, the data prediction module based on SAE models utilizes learned features from the SAE to make predictions on new data. SAE can address the issue of inadequate sample sets by using data augmentation. The SAE is trained unsupervised on the available data, and then it encodes the original samples into a latent space. Random noise is added to the encoded data to generate simulated samples, which are then decoded back to the original data space. Since the decoding process of SAE is a reconstruction process of an input sample, the reconstructed data can be used to supplement the insufficient sample set. SAE efficiently address the problem of insufficient sample sets through unsupervised pretraining. They learn meaningful representations from unlabeled data using layer-wise pretraining. Each layer reconstructs the input data, helping the SAE discover relevant patterns and hierarchies of features. When dealing with an inadequate sample set, one approach to supplementing the data is through data reconstruction using techniques like the Stacked Autoencoder (SAE) model. The process of rebuilt data can be utilized as unsupervised learning, feature extraction, data augmentation, supplementing the sample set, improving generalization and handling class imbalance. In the data prediction module, SAE is used again to extract features from the enhanced dataset. The first SAE model is used to generate simulated data from SCADA normalized grayscale images, with 1,200, 600, 200, and 100 neurons in each layer. The second SAE model is used to extract features from fault samples and predict samples, with network fine-tuning using the back propagation (BP) algorithm (Jiao et al. 2018). The benefits of backpropagation (BP) are efficient training, flexibility, gradient-based optimization, non-linear learning, automatic feature learning, universal approximation, parallelizable, transfer learning, adaptability, and robustness. The simulated data generated by the first SAE and the original samples are used as inputs to this model, with 1,200, 600, 200, and 100 neurons in each layer. Finally, a CNN classifier is used as a fault diagnostic tool to identify fault types. Convolutional Neural Network (CNN) classifiers are highly effective in identifying fault types due to their ability to automatically learn features, translation invariance, support for large datasets, depth and complexity, and potential for real-time detection.
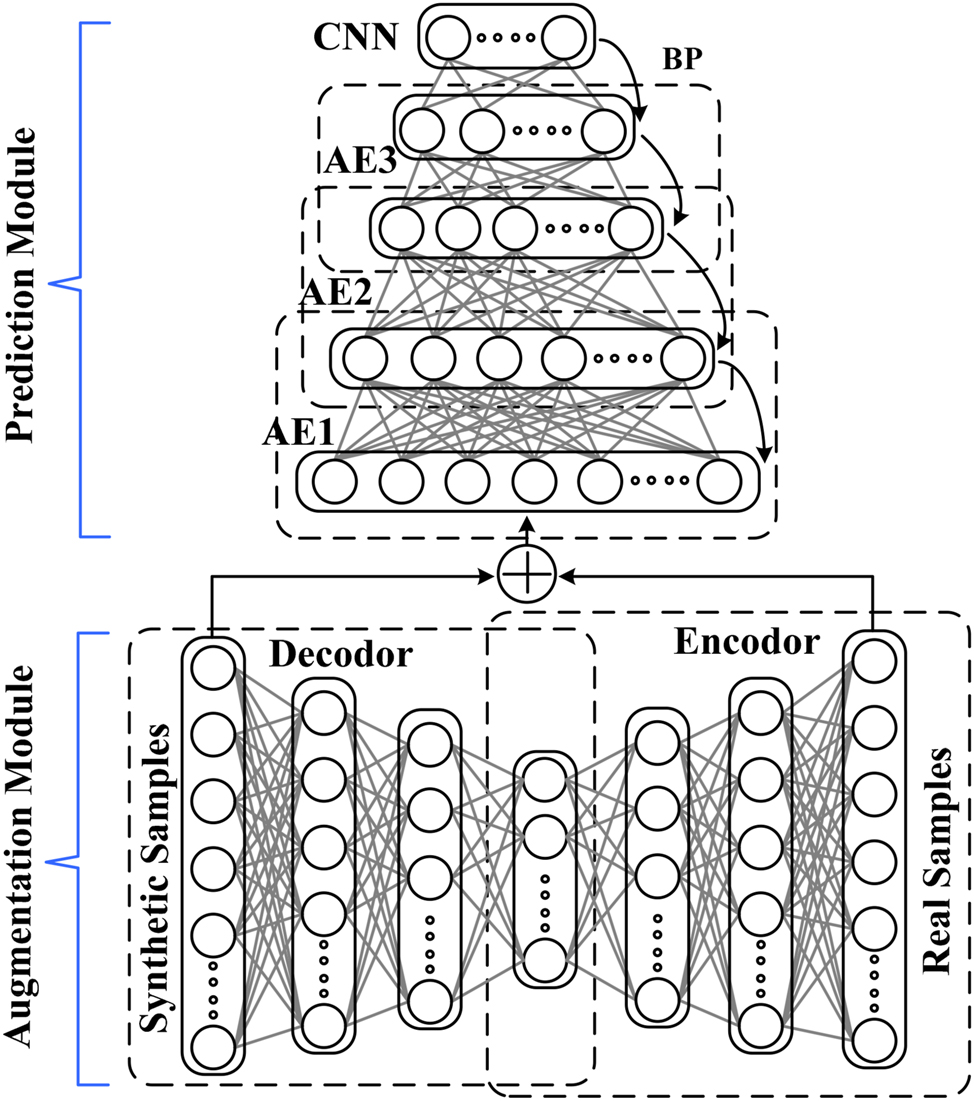
Network structure of the proposed ISAE.
3.2 SAE model based on semantic encoding
In the SAE model, the input layer is the basic feature vector space. The input layer in the SAE model serves as the basic feature vector space, representing the raw data and encoding essential features. It allows the network to learn hierarchical feature representations in subsequent layers, leading to improved data compression, reconstruction, and generalization capabilities. By using the hidden layer as a semantic layer, the input layer feature vector space can be compressed, encoded and decoded, and the output layer is the feature vector space restored after processing by the hidden layer. During the encoding and decoding process, additional constraints are imposed on the encoder and decoder using the original data, so that the encoded data can be restored to the original data as much as possible.
Given a feature set X, the attribute layer has H shared attributes represented by Ψ = (a 1, a 2, …, a H ), the training category is Y = (y 1, y 2, …, y K ), and the testing category is Z = (z 1, z 2, …, z L ), where K and L represent the number of samples in the training and testing sets, respectively. Let the mapping matrix from the input layer to the hidden layer be W, and the mapping matrix from the hidden layer to the output layer be W′, W is the transpose matrix of W′. Let S be the attribute vector corresponding to the data feature X, WX = S, then the objective function of SAE can be expressed as:
where κ > 0 is a weight coefficient.
By learning the attribute knowledge from the training samples (X, Y), a mapping from low-level features to attribute values is achieved. The low-level features used as the SAE’s input are the raw or preprocessed data attributes that directly represent the characteristics of the input data. These low-level features are the initial representations of the data that are fed into the SAE for learning and feature extraction. The attribute sharing mechanism is used to transfer the learned knowledge to sparse categories. The attributed sharing mechanism is an effective approach for transferring learned knowledge from a source domain to sparse categories in machine learning tasks. It leverages shared features and knowledge among different categories to improve model performance when data is limited or imbalanced in the sparse categories. When using SAE for prediction, the middle layer of SAE represents the score values of the relative attributes of the training images. The mapping matrix W from visual low-level features to the semantic shared attribute layer is obtained using SAE. During the testing process, the trained mapping matrix W is used to map the low-level features of the testing images to relative attribute score values, and the testing samples are predicted accordingly.
3.3 Attribute correlation
The proposed method quantitatively calculates the correlation of WT monitoring data. The proposed method computes the correlation of Wind Turbine (WT) monitoring data quantitatively using statistical measures such as Pearson correlation coefficient or Spearman rank correlation coefficient. It performs pairwise comparisons of different variables in the dataset and calculates correlation coefficients to understand their relationships. The statistical analysis includes properties such as wind speed, gearbox speed, power, nacelle vibration, main bearing temperature, and power factor. There is a certain semantic correlation between the attributes in the shared attribute layer. Combining these related attributes or introducing correlation information can have a positive effect on prediction. The positive effect of correlation information on prediction is that it can significantly improve the accuracy and reliability of predictions. Correlation refers to the statistical relationship between two or more variables, indicating how they are related or influence each other.
Assuming that there are N training samples in the data, a ni represents the ith attribute value of the nth sample. If we use R ij to represent the correlation between attributes a i and a j , the calculation formula can be expressed as:
where
3.4 Parameter optimization based on PSO
Let K and L be the number of samples in the training and testing sets, respectively, so the total number of samples is K + L. Let there be H relative attributes for each sample, and the attribute matrix of the sample is represented as H × (K + L), denoted as Ψ ∈ R H×(K+L). The correlation matrix of the attribute relationship H × H is represented as RL ∈ R H×H . Based on the original attributes, and to introduce attribute correlation while maintaining the original attribute dimensions, new attributes are defined as:
where λ and μ are two weight coefficients, and λ is a multiplicative factor used to adjust the attribute correlation information, while μ is an additive factor used to preserve the original attribute information. Then, the values of λ and μ is calculated to compensate for attribute correlation and improve classification accuracy. Since each set of weights determines a Ψ ′ which has an impact on ranking of attribute values for the image attribute descriptions for each category, it affects the process of using the new attribute values as the training sample output to solve the mapping matrix of SAE (Leke et al. 2017). Attribute correlation information is vital in data analysis and machine learning tasks. It helps with feature selection and engineering, data preprocessing, outlier detection, and model building. Correlation analysis aids in identifying relationships between attributes, guiding data visualization, and understanding variable importance. The goal of this study is to find a reasonable weight allocation that maximizes compensation for attribute information, allowing SAE to better solve the mapping matrix.
The fitness function of PSO is calculated as:
The low-level features are used as the input to SAE, and the updated attribute values after each parameter update are used as the output of SAE. The objective function of SAE is used as the fitness function in PSO, and the parameters λ and μ are used to find W that minimizes the objective function of SAE.
3.5 Fault diagnostic module
A fault diagnostic module is constructed on top of the predicted SAE model to diagnose the predicted samples and predict fault types and severity, providing decision-making information for fault handlers. The fault diagnostic module offers numerous advantages, including early fault detection, improved system reliability, reduced downtime, cost savings, data-driven decision making, adaptability to complex systems, continuous monitoring, predictive maintenance, enhanced safety, and scalability. The fault diagnostic tool in this study uses a two-layer CNN structure, with each layer being a one-dimensional CNN model. The first layer of the model is used to classify fault types, and the second layer constructs different CNN classification models for each type of fault to obtain more accurate classification results. The working logic of the one-dimensional CNN is as follows: the fault signal is directly input into the convolutional layer, and the convolutional layer 1 slides the convolution kernel over the entire input sequence to generate feature maps. Then, pooling layer 1 compresses each generated feature map to obtain significant features. This process is repeated 5 times with convolutional layers and pooling layers, and the output feature maps are connected to the fully connected layer. After activation by the activation function, the output is input to the Softmax layer.
The purpose of the fault classification layer is to construct a CNN model to determine the fault type of each predicted sample. The CNN model learns hierarchical features from the input data through convolutional and pooling layers. The flattened features are passed through fully connected layers, and a softmax activation function is used to output probabilities for each fault class. During training, the model minimizes a loss function to improve accuracy. First, a new CNN1 is constructed and the training parameters are initialized, which can be described as:
where
Then, based on the dataset, CNN1 is trained by minimizing the loss function to obtain the network parameters
Finally, the trained CNN1 is used for fault classification. The test sample
where m = 1, 2, …, M and b = 1, 2, …, n represent the fault types of the samples. Type(m) represents the type label of the mth test sample.
For a certain fault type classified in step 1, further determine the fault severity. For each type of fault, a CNN is constructed, forming a set of CNN2, where CNN2,b represents the network constructed for fault type b.
4 Experiment and analysis
4.1 Dataset
In this study, the SCADA data and fault logs of a wind farm in a southern province of China were chosen to construct the experiment dataset. The wind farm is equipped with 25 units of 3 MW doubly-fed WTs, and the sampling interval of the SCADA system is 10 min. The monitoring data of the WTs include 68 dimensions, which record discrete information such as the operating status of the units, the external environmental status, and the operating time. Among them, there are 52 dimensions that record the operating status of the wind turbines, including information such as the power generation, power, current, voltage, and information about various components of the units, such as gearboxes, bearings, and hubs. There are also 12 dimensions that record the external environmental status, including information such as wind speed, wind direction, and temperature. The date and time of the collection of the 68 dimensions are also recorded synchronously.
The SCADA data of the wind farm in 2017 were used for training. Table 1 shows the fault frequency statistics during the two years of operation of the wind farm. From Table 1, it can be seen that the frequency converter system failure frequency is relatively high during the operation of the wind farm, and the data is also sufficient. For comparison, gearbox failure with a relatively small number of samples is also selected as the fault warning object in this study. Therefore, we select these two types of failures as the fault warning objects in this study.
Fault statistics of WTs.
| Fault type | Occurrence # | Fault type | Occurrence # |
|---|---|---|---|
| Converter system | 499 | Hydraulic system | 25 |
| Yaw system | 623 | Water cooling system | 35 |
| Lubrication system | 288 | Gearbox | 38 |
| Generator | 48 | Safety chain | 3 |
| Encoder | 155 | Monitor | 28 |
4.2 Evaluation metrics
As the accuracy of the prediction models cannot be directly compared, evaluation metrics are introduced to specifically evaluate the accuracy and stability of prediction results. Common evaluation metrics include: maximum absolute error, mean absolute error (MAE), mean squared error (MSE), root mean squared error (RMSE), mean absolute percentage error (MAPE), and median error (Tsai et al. 2017). In this study, the sum of squares error (SSE) is used to represent the size of the model error, the MSE is used to represent the dispersion, the mean absolute error (MAE) is used to measure the overall average level, and the mean absolute percentage error (MAPE) is used to represent the model’s volatility. The expressions for each evaluation metric are:
where y
i
is the actual sample value,
4.3 Experimental results
In order to intuitively analyze the correlation between attributes, a correlation diagram is used to visually represent the strength of the correlation between attributes. Taking the generator front bearing temperature as an example, SCADA parameters related to it were analyzed, and selected attributes included wind speed, power, environmental temperature, nacelle temperature, main bearing temperature, generator stator winding temperature, generator speed, and gear oil pump pressure. The results are shown in Figure 3. It can be seen that the proposed method embeds correlation into the attributes and can effectively compensate for the information of the original dataset attributes.
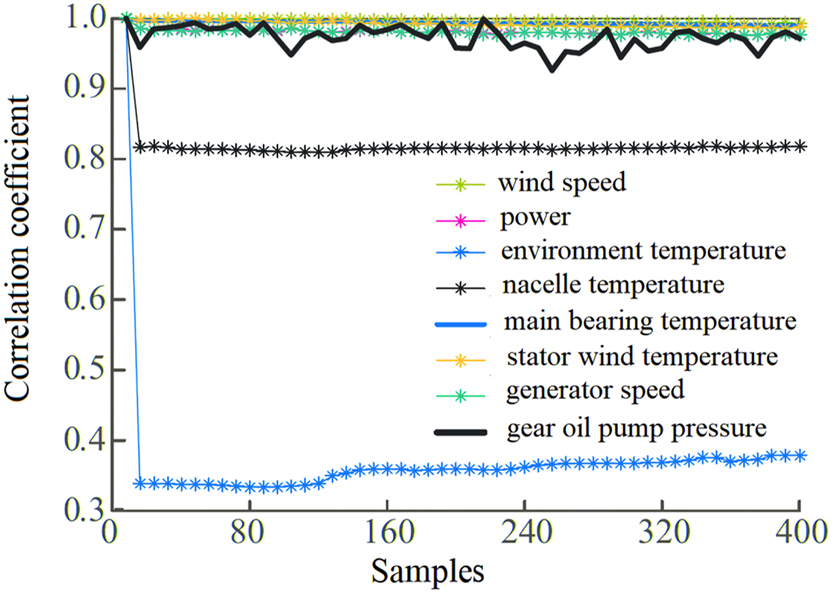
Illustration of correlation coefficients.
A frequency converter fault occurred on the 12th unit of the wind farm on November 12, 2017, and the SCADA system reported a A501 cabinet grid voltage filter fuse open/damage fault at 11:25. The SCADA data was imported into the proposed model for prediction, and the probability of the unit’s state is shown in Figure 4, where Normal indicates that the unit is in a non-fault state, and sampling frequency of data point is 10 min. The time of the frequency converter fault selected in this study is the first time the frequency converter fault alarm was issued in the SCADA data fault log. The SCADA reported fault position is about the 630-th data point, and it can be seen that after about the 270-th data point, the probability of the unit being healthy drops sharply, and at the same time, the probabilities of the three types of faults all increase. SAE model efficiently diagnoses frequency converter faults by performing unsupervised feature learning and supervised fine-tuning. It learns meaningful representations from raw data, enabling accurate fault detection without manual feature engineering. At this time, it can be judged that the unit is about to be in a fault state, but it is unclear which type of fault it belongs to. After 350-th data point, the probability of the frequency converter fault is in the leading position, and it can be considered that the unit will have a frequency converter fault. The model in this study was used for frequency converter fault diagnosis, predicting the occurrence of faults about 60 h in advance, and accurately determining the type of fault about 46 h in advance.
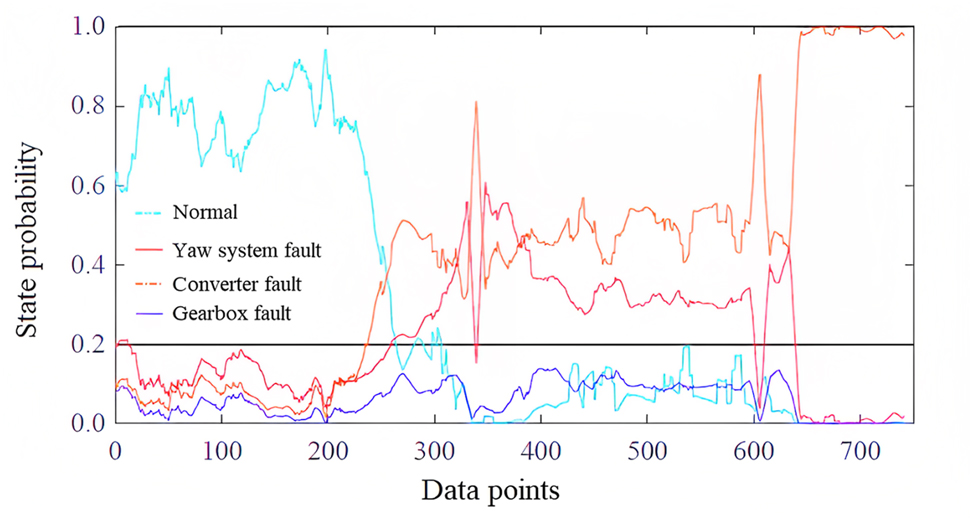
Example of converter fault prediction and identification.
Gearbox alarms occurred multiple times in the SCADA system of the 8-th unit of the wind farm on May 22, 2017. The first warning time of the system was selected to be the time when the high temperature of the gearbox bearing exceeded the limit value. The SCADA data was imported into the model for prediction, and the probability of the unit’s state is shown in Figure 5. It can be witnessed that the model can judge that the unit has a fault at about the 100-th data point, and at about 670-th data point, the probability of gearbox failure surpasses the other two types of faults. Although the probability of yaw system failure slightly increases from 490-th to 600-th data points, the probability of gearbox failure is the highest at about 690-th data point, effectively determining the type of fault. It can be seen that even for cases with extremely few fault samples, the data expanded by the proposed SAE model effectively improves the misjudgment problem of gearbox faults and improves the accuracy of the model. SAE model improves the misjudgment problem of gearbox faults by leveraging its unsupervised feature learning capabilities. It automatically extracts fault-related patterns from raw sensor data, reducing dimensionality, and learning non-linear representations. The SAE’s transfer learning approach enhances fault diagnosis accuracy, provides early fault detection, and increases robustness to noisy data.
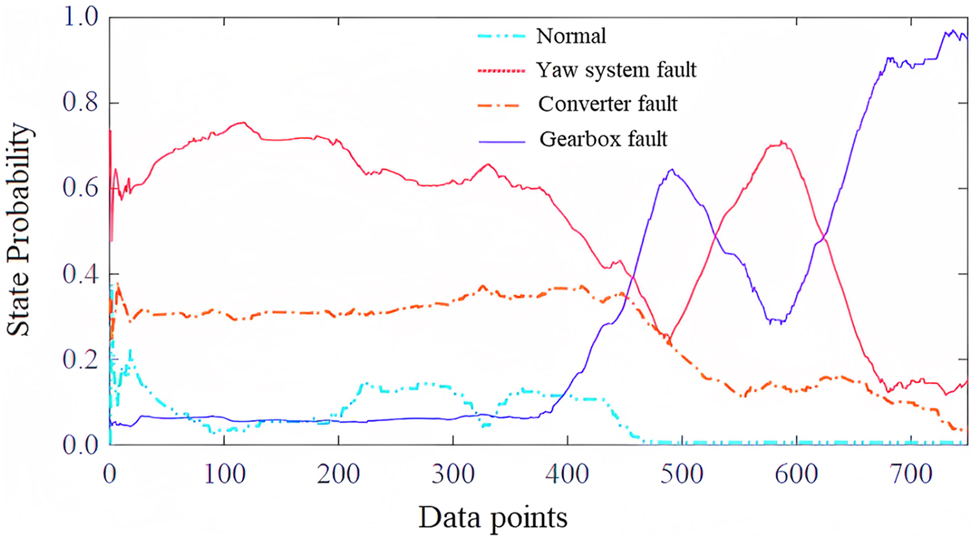
Example of gearbox fault prediction and identification.
The proposed method optimizes the attribute parameters using PSO based on the established attribute correlation. The specific parameter settings of PSO are as follows: the population size is 250, the number of generations is 20, and the velocity range of the parameter λ is [−2, 2], while the position range is [−10, 10]. The velocity range of parameter μ is [−1, 1], and the position range is [−5, 5]. Figure 6 shows the distribution of particles in the first and last generation of the PSO algorithm in the experimental dataset. Initially, 250 groups of particles were evenly distributed within the set position range. As the number of iterations increased, the particles’ positions under the final fitness value converged and did not appear at the set range boundary. The particle distribution can be well-converged with increasing generations, demonstrating that the overall parameter setting of PSO is reasonable.
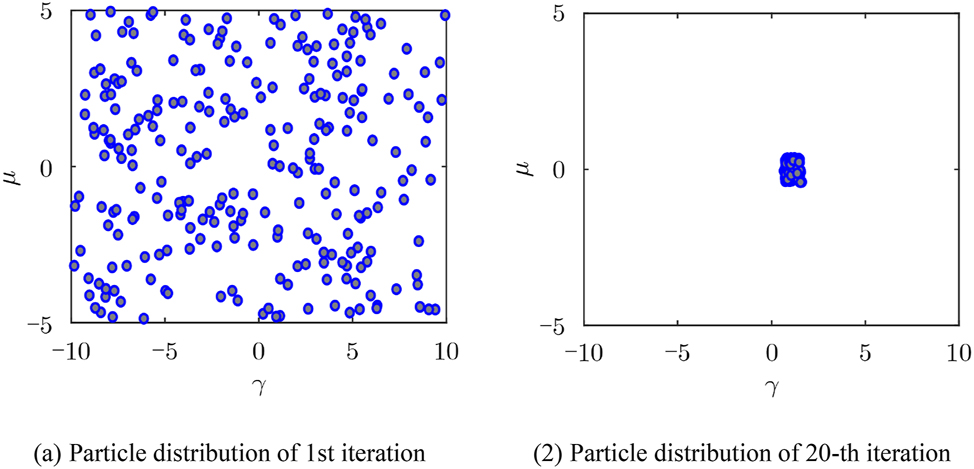
Particle distribution illustration.
For analysis of the effectiveness of the fault prediction algorithm, 25 sets of data were selected for each of the frequency converter, gearbox, and yaw system faults (a total of 75 sets), and the proposed method was compared with the methods in (Lebranchu et al. 2019; Lei, Liu, and Jiang 2019; Liu et al. 2019; Sun et al. 2016). The results are shown in Table 2. From the results, it can be found that the model in (Lebranchu et al. 2019) has large errors, indicating that single data-driven methods have limited performance as the dimensionality of WTs fault prediction data increases. The method in (Sun et al. 2016) uses a fuzzy comprehensive evaluation method, which improves performance to some extent. Compared with the first two methods, the methods in (Lei, Liu, and Jiang 2019; Liu et al. 2019), and the proposed method are all deep learning methods, and all indicators have been greatly improved. (Lei, Liu, and Jiang 2019) uses the LSTM model, which can capture the time series characteristics of the signal well, but does not consider the correlation between different attributes. (Liu et al. 2019) uses AE as the basis for fault prediction but cannot solve the problem of extremely imbalanced data, that is, the frequency of some fault types is extremely small. The proposed method considers the correlation between variables and utilizes multi-dimensional data coupling information. The double-layer Stacked Autoencoder (SAE) addresses sparse data samples by performing unsupervised pretraining and feature learning. It learns compact and meaningful representations of the input data in an encoding layer, capturing essential patterns and reducing the impact of sparsity. The double-layer SAE is used to solve the problem of sparse data samples, and the PSO optimization is used to compensate for the correlation information of attributes, achieving the best performance. This proves that the proposed method can achieve accurate warning and identification of WT faults.
Performance comparison of different models.
| Model | SSE | MSE | MAE | MAPE (×10−5) |
|---|---|---|---|---|
| Lebranchu et al. (2019) | 45.7435 | 0.1577 | 0.3582 | 9.7210 |
| Sun et al. (2016) | 30.0501 | 0.2388 | 0.2174 | 7.0442 |
| Lei, Liu, and Jiang (2019) | 18.7665 | 0.0833 | 0.2082 | 1.7897 |
| Liu et al. (2019) | 16.4571 | 0.0628 | 0.1971 | 1.6258 |
| Proposed method | 10.5811 | 0.0452 | 0.1276 | 1.1743 |
5 Conclusions
A deep learning framework for wind turbine fault prediction is proposed. Based on the SAE framework, the first SAE is used to generate simulated signals to enhance the training data and then the enhanced dataset is combined with the original dataset to input into the second SAE for data prediction and fault classification. The PSO is introduced to enhance classification performance by incorporating optimal attribute correlation information. Analysis of the real SCADA data collected from different wind turbines in a wind farm demonstrates that the proposed algorithm can effectively predict faults in advance and identify the fault types, which is beneficial for wind farms to handle the faults in advance and arrange maintenance plans to avoid significant losses. The proposed method is highly effective in predicting faults in major components of wind turbines, but there is room for improvement in predicting faults in their internal sub-components. The next step will be to conduct targeted research in this area.
-
Research ethics: Ethics approval was not required for this research compliance with ethical standards.
-
Author contributions: All authors have contributed to the design and methodology of this study, the assessment of the outcomes and the writing of the manuscript.
-
Competing interests: Authors do not have any conflicts.
-
Research funding: Authors did not receive any funding.
-
Data availability: No datasets were generated or analyzed during the current study.
References
Abdusamad, K. B., D. W. Gao, and E. Muljadi. 2013. “A Condition Monitoring System for Wind Turbine Generator Temperature by Applying Multiple Linear Regression model.” In 2013 North American Power Symposium (NAPS), 1–8. IEEE.10.1109/NAPS.2013.6666910Search in Google Scholar
Ahuja, H., and P. Kumar. 2019. “A Novel Approach for Coordinated Operation of Variable Speed Wind Energy Conversion in Smart Grid Applications.” Computers and Electrical Engineering 77: 72–87. https://doi.org/10.1016/j.compeleceng.2019.05.004.Search in Google Scholar
Badihi, H., Y. Zhang, B. Jiang, P. Pillay, and S. Rakheja. 2022. “A Comprehensive Review on Signal-Based and Model-Based Condition Monitoring of Wind Turbines: Fault Diagnosis and Lifetime Prognosis.” Proceedings of the IEEE 110 (6): 754–806, https://doi.org/10.1109/jproc.2022.3171691.Search in Google Scholar
Ding, N., Z. Lu, Y. Qiao, and Y. Min. 2013. “Simplified Equivalent Models of Large-Scale Wind Power and Their Application on Small-Signal Stability.” Journal of Modern Power Systems and Clean Energy 1 (1): 58–64. https://doi.org/10.1007/s40565-013-0005-3.Search in Google Scholar
Du, M., L. B. Tjernberg, S. Ma, Q. He, L. Cheng, and J. Guo. 2016. “A SOM Based Anomaly Detection Method for Wind Turbines Health Management through SCADA Data.” International Journal of Prognostics and Health Management 7 (4), https://doi.org/10.36001/ijphm.2016.v7i4.2464.Search in Google Scholar
Fu, J., J. Chu, P. Guo, and Z. Chen. 2019. “Condition Monitoring of Wind Turbine Gearbox Bearing Based on Deep Learning Model.” IEEE Access 7: 57078–87. https://doi.org/10.1109/access.2019.2912621.Search in Google Scholar
He, Q., Y. Pang, G. Jiang, and P. Xie. 2020. “A Spatio-Temporal Multiscale Neural Network Approach for Wind Turbine Fault Diagnosis with Imbalanced SCADA Data.” IEEE Transactions on Industrial Informatics 17 (10): 6875–84. https://doi.org/10.1109/tii.2020.3041114.Search in Google Scholar
Jiao, R., X. Huang, X. Ma, L. Han, and W. Tian. 2018. “A Model Combining Stacked Auto Encoder and Back Propagation Algorithm for Short-Term Wind Power Forecasting.” IEEE Access 6: 17851–8. https://doi.org/10.1109/access.2018.2818108.Search in Google Scholar
Leahy, K., C. Gallagher, P. O’Donovan, and D. T. J. O’Sullivan. 2019. “Issues with Data Quality for Wind Turbine Condition Monitoring and Reliability Analyses.” Energies 12 (2): 201. https://doi.org/10.3390/en12020201.Search in Google Scholar
Lebranchu, A., S. Charbonnier, C. Bérenguer, and F. Prévost. 2019. “A Combined Mono-And Multi-Turbine Approach for Fault Indicator Synthesis and Wind Turbine Monitoring Using SCADA Data.” ISA Transactions 87: 272–81. https://doi.org/10.1016/j.isatra.2018.11.041.Search in Google Scholar PubMed
Lei, J., C. Liu, and D. Jiang. 2019. “Fault Diagnosis of Wind Turbine Based on Long Short-Term Memory Networks.” Renewable Energy 133: 422–32. https://doi.org/10.1016/j.renene.2018.10.031.Search in Google Scholar
Leke, C., A. R. Ndjiongue, B. Twala, and T. Marwala. 2017. “A Deep Learning-Cuckoo Search Method for Missing Data Estimation in High-Dimensional Datasets.” In Advances in Swarm Intelligence: 8th International Conference, ICSI 2017, Fukuoka, Japan, July 27–August 1, 2017, Proceedings, Part I 8, 561–72. Springer International Publishing.10.1007/978-3-319-61824-1_61Search in Google Scholar
Liu, Y., H. Cheng, X. Kong, Q. Wang, and H. Cui. 2019. “Intelligent Wind Turbine Blade Icing Detection Using Supervisory Control and Data Acquisition Data and Ensemble Deep Learning.” Energy Science and Engineering 7 (6): 2633–45. https://doi.org/10.1002/ese3.449.Search in Google Scholar
Ma, B., W. Cai, Y. Han, and G. Yu. 2021. “A Novel Probability Confidence CNN Model and its Application in Mechanical Fault Diagnosis.” IEEE Transactions on Instrumentation and Measurement 70: 1–11. https://doi.org/10.1109/tim.2021.3077965.Search in Google Scholar
Nachimuthu, S., M. J. Zuo, and Y. Ding. 2019. “A Decision-Making Model for Corrective Maintenance of Offshore Wind Turbines Considering Uncertainties.” Energies 12 (8): 1408. https://doi.org/10.3390/en12081408.Search in Google Scholar
Ouyang, T., A. Kusiak, and Y. He. 2017. “Modeling Wind-Turbine Power Curve: A Data Partitioning and Mining Approach.” Renewable Energy 102: 1–8. https://doi.org/10.1016/j.renene.2016.10.032.Search in Google Scholar
Perez, R. L., F. Adamsky, R. Soua, and T. Engel. 2018. “Machine Learning for Reliable Network Attack Detection in SCADA Systems.” In 2018 17th IEEE International Conference on Trust, Security and Privacy in Computing and Communications/12th IEEE International Conference on Big Data Science and Engineering (TrustCom/BigDataSE), 633–8. IEEE.Search in Google Scholar
Pliatsios, D., P. Sarigiannidis, T. Lagkas, and A. G. Sarigiannidis. 2020. “A Survey on SCADA Systems: Secure Protocols, Incidents, Threats and Tactics.” IEEE Communications Surveys and Tutorials 22 (3): 1942–76. https://doi.org/10.1109/comst.2020.2987688.Search in Google Scholar
Pandit, R. K., and D. Infield. 2018. “SCADA-Based Wind Turbine Anomaly Detection Using Gaussian Process Models for Wind Turbine Condition Monitoring Purposes.” IET Renewable Power Generation 12 (11): 1249–55. https://doi.org/10.1049/iet-rpg.2018.0156.Search in Google Scholar
Ren, H., W. Liu, M. Shan, and X. Wang. 2019. “A New Wind Turbine Health Condition Monitoring Method Based on VMD-MPE and Feature-Based Transfer Learning.” Measurement 148: 106906. https://doi.org/10.1016/j.measurement.2019.106906.Search in Google Scholar
Sun, P., J. Li, C. Wang, and X. Lei. 2016. “A Generalized Model for Wind Turbine Anomaly Identification Based on SCADA Data.” Applied Energy 168: 550–67. https://doi.org/10.1016/j.apenergy.2016.01.133.Search in Google Scholar
Tautz-Weinert, J., and S. J. Watson. 2017. “Using SCADA Data for Wind Turbine Condition Monitoring–A Review.” IET Renewable Power Generation 11 (4): 382–94. https://doi.org/10.1049/iet-rpg.2016.0248.Search in Google Scholar
Tsai, S. B., Y. Xue, J. Zhang, Q. Chen, Y. Liu, J. Zhou, and W. Dong. 2017. “Models for Forecasting Growth Trends in Renewable Energy.” Renewable and Sustainable Energy Reviews 77: 1169–78. https://doi.org/10.1016/j.rser.2016.06.001.Search in Google Scholar
Yürüşen, N. Y., P. N. Rowley, S. J. Watson, and J. J. Melero. 2020. “Automated Wind Turbine Maintenance Scheduling.” Reliability Engineering and System Safety 200: 106965.10.1016/j.ress.2020.106965Search in Google Scholar
Zheng, R., Y. Zhou, and Y. Zhang. 2020. “Optimal Preventive Maintenance for Wind Turbines Considering the Effects of Wind Speed.” Wind Energy 23 (11): 1987–2003. https://doi.org/10.1002/we.2541.Search in Google Scholar
Zhu, Y., C. Zhu, C. Song, Y. Li, X. Chen, and B. Yong. 2019. “Improvement of Reliability and Wind Power Generation Based on Wind Turbine Real-Time Condition Assessment.” International Journal of Electrical Power and Energy Systems 113: 344–54. https://doi.org/10.1016/j.ijepes.2019.05.027.Search in Google Scholar
© 2024 the author(s), published by De Gruyter, Berlin/Boston
This work is licensed under the Creative Commons Attribution 4.0 International License.
Articles in the same Issue
- Solar photovoltaic-integrated energy storage system with a power electronic interface for operating a brushless DC drive-coupled agricultural load
- Analysis of 1-year energy data of a 5 kW and a 122 kW rooftop photovoltaic installation in Dhaka
- Reviews
- Real yields and PVSYST simulations: comparative analysis based on four photovoltaic installations at Ibn Tofail University
- A comprehensive approach of evolving electric vehicles (EVs) to attribute “green self-generation” – a review
- Exploring the piezoelectric porous polymers for energy harvesting: a review
- A strategic review: the role of commercially available tools for planning, modelling, optimization, and performance measurement of photovoltaic systems
- Comparative assessment of high gain boost converters for renewable energy sources and electrical vehicle applications
- A review of green hydrogen production based on solar energy; techniques and methods
- A review of green hydrogen production by renewable resources
- A review of hydrogen production from bio-energy, technologies and assessments
- A systematic review of recent developments in IoT-based demand side management for PV power generation
- Research Articles
- Hybrid optimization strategy for water cooling system: enhancement of photovoltaic panels performance
- Solar energy harvesting-based built-in backpack charger
- A power source for E-devices based on green energy
- Theoretical and experimental investigation of electricity generation through footstep tiles
- Experimental investigations on heat transfer enhancement in a double pipe heat exchanger using hybrid nanofluids
- Comparative energy and exergy analysis of a CPV/T system based on linear Fresnel reflectors
- Investigating the effect of green composite back sheet materials on solar panel output voltage harvesting for better sustainable energy performance
- Electrical and thermal modeling of battery cell grouping for analyzing battery pack efficiency and temperature
- Intelligent techno-economical optimization with demand side management in microgrid using improved sandpiper optimization algorithm
- Investigation of KAPTON–PDMS triboelectric nanogenerator considering the edge-effect capacitor
- Design of a novel hybrid soft computing model for passive components selection in multiple load Zeta converter topologies of solar PV energy system
- A novel mechatronic absorber of vibration energy in the chimney
- An IoT-based intelligent smart energy monitoring system for solar PV power generation
- Large-scale green hydrogen production using alkaline water electrolysis based on seasonal solar radiation
- Evaluation of performances in DI Diesel engine with different split injection timings
- Optimized power flow management based on Harris Hawks optimization for an islanded DC microgrid
- Experimental investigation of heat transfer characteristics for a shell and tube heat exchanger
- Fuzzy induced controller for optimal power quality improvement with PVA connected UPQC
- Impact of using a predictive neural network of multi-term zenith angle function on energy management of solar-harvesting sensor nodes
- An analytical study of wireless power transmission system with metamaterials
- Hydrogen energy horizon: balancing opportunities and challenges
- Development of renewable energy-based power system for the irrigation support: case studies
- Maximum power point tracking techniques using improved incremental conductance and particle swarm optimizer for solar power generation systems
- Experimental and numerical study on energy harvesting performance thermoelectric generator applied to a screw compressor
- Study on the effectiveness of a solar cell with a holographic concentrator
- Non-transient optimum design of nonlinear electromagnetic vibration-based energy harvester using homotopy perturbation method
- Industrial gas turbine performance prediction and improvement – a case study
- An electric-field high energy harvester from medium or high voltage power line with parallel line
- FPGA based telecommand system for balloon-borne scientific payloads
- Improved design of advanced controller for a step up converter used in photovoltaic system
- Techno-economic assessment of battery storage with photovoltaics for maximum self-consumption
- Analysis of 1-year energy data of a 5 kW and a 122 kW rooftop photovoltaic installation in Dhaka
- Shading impact on the electricity generated by a photovoltaic installation using “Solar Shadow-Mask”
- Investigations on the performance of bottle blade overshot water wheel in very low head resources for pico hydropower
- Solar photovoltaic-integrated energy storage system with a power electronic interface for operating a brushless DC drive-coupled agricultural load
- Numerical investigation of smart material-based structures for vibration energy-harvesting applications
- A system-level study of indoor light energy harvesting integrating commercially available power management circuitry
- Enhancing the wireless power transfer system performance and output voltage of electric scooters
- Harvesting energy from a soldier's gait using the piezoelectric effect
- Study of technical means for heat generation, its application, flow control, and conversion of other types of energy into thermal energy
- Theoretical analysis of piezoceramic ultrasonic energy harvester applicable in biomedical implanted devices
- Corrigendum
- Corrigendum to: A numerical investigation of optimum angles for solar energy receivers in the eastern part of Algeria
- Special Issue: Recent Trends in Renewable Energy Conversion and Storage Materials for Hybrid Transportation Systems
- Typical fault prediction method for wind turbines based on an improved stacked autoencoder network
- Power data integrity verification method based on chameleon authentication tree algorithm and missing tendency value
- Fault diagnosis of automobile drive based on a novel deep neural network
- Research on the development and intelligent application of power environmental protection platform based on big data
- Diffusion induced thermal effect and stress in layered Li(Ni0.6Mn0.2Co0.2)O2 cathode materials for button lithium-ion battery electrode plates
- Improving power plant technology to increase energy efficiency of autonomous consumers using geothermal sources
- Energy-saving analysis of desalination equipment based on a machine-learning sequence modeling