An IoT-based intelligent smart energy monitoring system for solar PV power generation
-
Challa Krishna Rao

 ,
Sarat Kumar Sahoo
and
Franco Fernando Yanine
,
Sarat Kumar Sahoo
and
Franco Fernando Yanine

Abstract
As the world’s attention turns to cleaner, more dependable, and sustainable resources, the renewable energy sector is rising quickly. The decline in world energy use and climate change are the two most significant factors nowadays. PV forecasting was essential to enhancing the efficiency of the real-time control system and preventing any undesirable effects. The smart energy management systems of distributed energy resources, the forecasting model of irradiation received from the sun, and therefore PV energy production might mitigate the impact of uncertainty on PV energy generation, improve system dependability, and increase the incursion level of solar power generation. Smart sensors and Internet of Things technologies are essential for monitoring and controlling applications in a broad range of fields. As a result, solar power generation forecasting was essential for microgrid stability and security, as well as solar photovoltaic integration in a strategic approach. This paper examines how to use IoT, a solar photovoltaic system being monitored, and shows the proposed monitoring system is a potentially viable option for smart remote and in-person monitoring of a solar PV system.
1 Introduction
The Internet of Things is a vast network of connected devices, people, and other items that allows data to be sent over the network without having to directly interact with either humans or machines. Physical objects are no longer cut off from the outside world and can be remotely controlled by Internet access (Bhujbal and Unde 2022). The International Energy Agency predicts that renewable energy, primarily wind and solar photovoltaic energy will increase the fastest over the next several years (Rao, Sahoo, and Yanine 2022b). But the world’s demand for energy keeps growing. One of the most innovative methods to decrease the influence on the environment is to use technology for renewable energy. According to the most current IEA Medium-Term Renewable Market Report, renewable energy will expand by around 13 % more than it did in 2014 between 2015 and 2021. By 2021, approximately 28 % of total electricity will come from renewable sources, up from over 23 % in 2015 (Lokesh Babu et al. 2018). Everywhere in the globe has access to solar energy, which can reduce dependency on transmitted energy (Zanella et al. 2014) (Tables 1 and 2).
Time of usage and connected load (Rao, Sahoo, and Yanine 2022b).
| Load | Number of units connected | Time of usage |
|---|---|---|
| CFL | 20 | 6 am–8 am |
| 6 pm–11 pm | ||
| Ceiling fan | 8 | 10 am–4 pm |
| 7 pm–8 am | ||
| Desktop PC | 1 | 10 am–1 pm |
| 2 pm–5 pm | ||
| Television | 1 | 8 am–10 am |
| 7 pm–11 pm | ||
| Mixer grinder | 1 | 6 am–7 am |
| 6 pm–7 pm | ||
| Air conditioner | 1 | Full day |
| Refrigerator | 1 | Full day |
| Laptop | 1 | 9 am–12 pm |
| 4 pm–6 pm | ||
| 10 pm–11 pm | ||
| Water pump | 1 | 6 pm–7 pm |
| Washing machine | 1 | 7 pm–8 pm |
| Vacuum cleaner | 1 | 7 am–8 am |
| Iron | 1 | 7 am–8 am |
Our country is currently experiencing serious energy problems, which are made worse by transmission failures caused by outdated facilities, electricity theft, and a lack of hydropower. The global energy crisis is growing as a result of the inability of energy production to keep up with the country’s rising energy demand. Utility firms thus adhere to the trend or practice of load-shedding in situations where demand exceeds total generation to prevent system failure or significant breakdown. Many renewable energy sources are being employed to address the energy crisis. They provide a significant contribution to the energy management strategies. From an energy management perspective, it is challenging to link renewable energy sources to the primary electric utility. Electric utilities must manage renewable energy resources (Lokesh Babu et al. 2018). The topic of energy management is extremely important and complicated. It entails choosing from a variety of sources that may provide electricity for loads while cutting down on expenses and distribution area losses (Rohit et al. 2017).
The world receives enough solar radiation every 90 min to meet its entire annual energy needs. Solar photovoltaic systems do not produce any greenhouse gases or other pollutants while they are in use (Priharti, Rosmawati, and Wibawa 2019). Solar PV will grow its percentage of the world’s renewable energy capacity to about 40 % during the upcoming years (Rohit et al. 2017). Lastly, by assessing the growth of sectors that use energy and electricity, it looks into the incredible potential impact that solar energy might have on our energy system in the long-term future. Solar Street lights, solar cities, smart villages, microgrids, and ground-mounted solar are some of the applications for the monitoring system (Chine et al. 2014). When the weather is good, solar-powered houses and communities may maximize their energy output and consumption by monitoring the energy forecast (Adhya et al. 2016).
The five major portions of the paper are as follows: In Section 1, we provide an overview of the introduction. In Section 2, a review of the literature is given. The proposed work is discussed in Section 3. Results and Discussions are discussed in Section 4 and 5. A list of the sources utilized to produce this work is included in Section 6 in conclusion.
2 Literature survey
2.1 Generalized mathematical model
The system model takes into account a single family with various loads. It has communication capabilities with the utility and has access to the electricity rate. An optimization problem is used to represent the DR problem. The simulation framework needs the load model, tariff, and scheduling algorithm. A chronology must first be established before the mathematical model can be developed.
2.2 The timeline
There are |Z| time slots in a day, hence a vector Z is selected to represent the timeline model. Depending on the chosen interval’s length, |Z| takes on different values. For example, |Z| = 96 if the interval lasts 15 min, and |Z| = 48 if the interval lasts 30 min. Since |Z| = 24 and the first interval runs from 12 am to 1 am, it is presumed that the interval is 1 h in this case. The next interval is the hour from one to two in the morning, and so on. Moreover, any time between 12 am and 1 am counts towards the first period. In Figure 3, the chronology for an hour is displayed.
2.3 Load model
Critical loads and controlled or flexible loads are the two categories into which residential loads may be divided. Critical loads are must-run devices that are turned on for a set amount of time and cannot be turned off. They include electrical loads like a fan, TV, computer, and lighting. The consumer should have the option to turn these sorts of loads ON and OFF as he pleases. Controllable loads may be activated at any point within the allotted period. If necessary, their surgery may be postponed or stopped. They include dishwashing machines, water heaters, heating, ventilation, and air conditioning (HVAC) systems, plug-in electric automobiles, and battery chargers for consumer devices, among other things. Atomic and non-atomic loads are additional categories for controllable loads. Atomic loads are non-interruptible loads; once turned on, they will stay that way for the allotted time. Non-atomic loads can be switched ON and OFF several times during the given period since they are interruptible loads.
2.4 Basic load model
It is assumed that the consumer has a total of m flexible and nonflexible loads, where N is the set of all household loads and m = |N|. The atomic nature of the flexible loads is assumed. A 4-tuple represented by, models each load, n € N.
where the periods for the beginning and conclusion of the load’s activity are sj and fj, respectively. lj is the length of time that the load is ON. In kW, rj represents the rated load power. In other words, dj = (8, 15, 5, 6) says that a load with a 6 kW power rating has to be turned on every 8 and 15 min for 5 h. Flexible loads can be activated at any moment throughout the authorized period, but once activated; they stay active for lj hours. So, the challenge is to determine the ideal time windows, subject to various limitations, for turning on the load.
2.5 Load model considering consumer comfort
The presumption that flexible loads are atomic is loosened in this situation. The loads can be non-atomic, which means that they are more adaptable than atomic loads and can be switched OFF more often throughout the allowable interval while still meeting the overall ON period duration of lj hours. The same load model for atomic loads that was described in the preceding section may also be used to represent non-atomic loads.
To meet the numerous limits, the goal is to reduce the consumer’s overall daily energy expenditure. As a consequence, the loads are scheduled during periods when the price of power is low. With some loads, this scheduling may make the customer uncomfortable. To run a variable load at a reduced cost, such as a fabric washer, the ON time can be postponed. The consumer has some difficulty or pain as a result of the delay. The load model includes a parameter called udc to account for the level of discomfort. Now, a 5-tuple indicated by, models each load, j € J.
Choose a low value for UDC if the customer is prepared to endure a delay. A high number for UDC suggests that consumers cannot tolerate delays, which harms energy costs. Rules for selecting a UDC are created (Lokesh Babu et al. 2018). The IEMS algorithm was developed for regulating appliances with growing electrical demands. The overall consumption of electrical load appliances is kept within set criteria for the control of residential loads by algorithms in line with their distinct priorities (Rohit et al. 2017). Energy management is a method for cutting down on the amount of power that electronic systems use by only shutting off priority systems when essential (Adhya et al. 2016).
Many studies and diverse commercial products, such as wind power and solar electricity, play key roles in the dissemination of environmentally friendly technologies. As the smart grid’s effects are predicted to become more pervasive, the power market will enlarge and the steady expansion of renewable energy sources will quicken. The Smart Grid has the potential to significantly increase the benefits of sustainable development and renewable energy. Furthermore, since electricity produced by renewable energy sources is essentially limitless, it is expected that this problem will persist. Thus, an intelligent system is needed to monitor these needs and enhance the performance of renewable energy sources. Furthermore offers the proper management services (Priharti, Rosmawati, and Wibawa 2019).
The monitoring system is based on readings of each renewable energy source’s voltage and current. The sensor circuits that have been created to measure the absolute values are processed by a microcontroller (Rao, Sahoo, and Yanine 2021). The parameters are processed and then delivered via USB to a PC where online monitoring plus a control system for distributed renewable energy is they may be stored in a database and utilized to quickly monitor the system (Mungkin et al. 2020). The collected data is managed via the designed visual interface of the monitoring software so that each measurement of daily, weekly, and monthly values may be independently examined. This method uses the Wi-Fi interface on an Android smartphone or tablet, and a PC to connect with the digital hardware of a power conditioning unit (Li et al. 2017). The development and use of an integrated solution for maintaining and remotely monitoring electricity plants (Khadka et al. 2020). The systems features include enhanced user interfaces that make use of information plus communication technologies, like web technology and the combination of control and remote monitoring functions into a single system (IRENA 2017). The primary objective was to create a cost-effective data-gathering system that could continually show performance indicators and remote energy yields (Okere and Iqbal 2020). The output gives instant access to the energy generated at the remote location through the use of wireless sensor modules and short messaging delivery over the data connection (Rao et al. 2020). The effectiveness of non-traditional energy systems in isolated rural locations may be monitored effectively and inexpensively, according to initial experimental data.
Timely power requirements, weather conditions, and battery storage status are the factors we need to consider to increase the effectiveness of our energy management systems. It is challenging to predict high SEMS efficiency since these characteristics are not taken into account by the solutions that are currently on the market. So, these techniques need to be purchased or monitored to increase a system’s efficiency and ensure effective energy management.
3 Proposed methodology
In this study, we suggested a smart energy management and monitoring system for utility sources and solar power systems based on Arduino and ZigBee. We then tested its performance by utilizing a utility source and a solar system to see how effectively it controls energy. SEMS has become an efficient method for energy conservation as technology has advanced. To maximize system efficiency and save costs, this is critical. The major goals of this research are to design and develop SEMS to improve system efficiency.
Developing and implementing an effective Smart Energy Management System algorithm on an FPGA.
To increase SEMS effectiveness and provide appropriate power management services.
The SEMS’s architectural design.
Hardware for the Energy Management System.
The basic objective of the proposed work is to monitor the system’s power usage by utilizing data from the Arduino, current, and voltage sensors. The solar energy system monitor shows power and energy consumption.
3.1 Solar power monitoring system model
Design of solar monitoring system for remote access to all energy parameters and records, we have to take into consideration various points like component selection and specification, circuit model, and all equipment required for the development of the work. Microcontroller selection and its specification, as sensors for collecting the values of voltage, current, and other parameters for power calculations are discussed.
The proposed system uses IoT to monitor solar energy has in Figure 1. The battery’s ability to back up energy was aided by the solar panel. The energy in batteries is important for electrical devices (Rao, Sahoo, and Yanine 2022b). A microcontroller called Arduino is used to read the sensor data. The Arduino is connected to a voltage divider and current sensor through a USB wire, Arduino is linked to the thingspeak and is used as a server (Bhujbal and Unde 2022). As seen in Figure 1, the data from the Arduino is displayed on a website using a thingspeak. The monitoring data was transferred to the cloud using a thingspeak.

The proposed solar power monitoring system (Rao, Sahoo, and Yanine 2021a).
SEMS for effective electrical load control is covered in (Rao, Sahoo, and Yanine 2021a). The energy management center (EMC), which has a graphical user interface, is the first part (GUI). With electrical load control, EMC maintains data logging and shows runtime statistics. The results of load scheduling are displayed using the THINK SPEAK cloud server. The implemented hardware model uses a PIC18F4520 microcontroller, Zigbee, and human-machine interface (HMI).
3.2 Arduino Uno
The ATmega328P chips are the brains of the Arduino Uno microcontroller board. 14 digital input/output pins, six of which may be utilized as PWM outputs, a 16 MHz ceramic resonator, a USB connector, a power connection, an ICSP header, and a restart button are all provided. The microcontroller has been supported by everything necessary; all that is needed to get started is the insertion of a USB cable, an AC-to-DC converter, or a battery (Figure 2).

ATmega328P (Rao et al. 2021b).
3.3 Current sensor
It was a sensor that detected the electric current that was flowing through each element and produced signals that were identical to the electric current. This signal is frequently either analog or digital. Current is measured by an ammeter using the current signals (Figure 3).

Current sensor (Rao et al. 2020).
3.4 Voltage sensor
It was a component that changed the physical signal from the form of the voltage to the voltage in an external circuit. This physical signal aids in determining the difference in voltage levels between two places. PV panel output voltage is measured using a voltage sensor module. The voltage sensor is a straightforward voltage divider with resistances of 10 kohm and 100 kohm that works on the voltage divider concept. Because the Arduino Uno microcontroller’s maximum analog input voltage is 5 V, it was used to lower the input voltage up to 5 V to the original value. As indicated in Figure 4, the voltage sensor module will be installed in parallel with the PV panel load the digital value (V out) representing the sensor reading ranges from 0 to 1023 (Figure 5).

Voltage sensor (Rao et al. 2020).

LM35 temperature sensor (Rao et al. 2020).
3.5 LM35 sensor
This sensor was further linked to the associated Arduino analog pin. This sensor allows knowing the approximate temperature of the PV panel. This temperature was useful when combined with alternative information such as possible seasons, weather conditions, and the most common consumption temperature and also the dynamic rating of electricity.
3.6 NodeMCU
A microcontroller is required with the Wi-Fi module to perform an IoT operation. The microcontroller sends information to a predefined net server sacrificial Wi-Fi connection. NodeMCU is a development chart that combines the practice that gets each I/O port, such as a microcontroller connection board. It depends on the Wi-Fi module. This has been programmed with the Arduino Uno environment. The microcontroller can perform every one calculation requiring all calculations, but it provides communications with Wi-Fi. The NodeMCU diagram is shown in Figure 6.
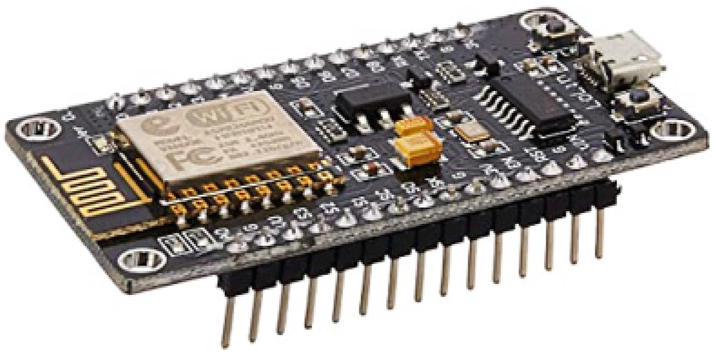
NodeMCU (Rao et al. 2021b).
4 Implementation
The proposed system method, as seen in Figure 3, moves from the load to the monitoring system. The technique for the solar energy monitoring system is outlined in the stages that follow (Figure 7).

Flowchart of IoT-based PV monitoring system (Rao, Sahoo, and Yanine 2021).
The SEMS hardware architecture is shown in Figure 8. Current sensors, voltage sensors, analog to digital converters, load transfer switches, ZigBee, and the control unit are all included. The control unit is positioned in the center of the structure. Following consumption, the SEMS may measure the amount of power used, transfer load to utility sources and solar power systems, and transmit data to EMC through ZigBee (Figure 9).
The Current and voltage sensors are employed by the system to calculate the quantity of power consumed. The energy metering block translates the analog value that the Current and voltage sensors measure into a digital value that the control device can use. The SEMS can determine how much electricity the loads use. The control unit’s registers then store this power usage figure. When a monitoring value changes, SEMS shifts the load to utility sources and solar power systems in line with use.

Laboratory experimental setup.

Flow diagram of Arduino Uno program.
IoT was provided to enable quick and simple interaction by everyday devices like computers, mobile phones, sensors, and actuators through the internet using devices in microchips, Controls, transceivers, data, and communication protocols. Therefore, the system that communicates with the IoT can monitor and control the photovoltaic system in a large and isolated field better than human inspection operation. The system described in the paper was developed to monitor the voltage, current, temperature, and sunlight intensity received by solar cells as well as the photovoltaic PV cells’ values for each of these parameters. The NodeMCU wireless communication transceiver was used to upload all of the data that the Arduino had recorded in Thingspeak. Think to Speak, an open-source IoT cloud platform is used to compile all the data taken from the sensor and represent it as a graphical form so that the user, if there is an internet connection, may review the data with both a smartphone app and the Think Speak online portal are available for screening. Figure 6 displays an illustration of the system block diagram. The application can retrieve and store information received by the sensor over the Internet using Hypertext Transfer Protocol. The information taken by the sensor has been uploaded from the Arduino linked to the Wi-Fi device to the cloud. It updates all information records made from the sensors and provides the status app to the user. The use this feature, the customer needs to create a specific account or IP address, which contains various channels to monitor various, network parameters. This platform allows customers to view the information in the form of images. The monitoring is internet-based; the information is easily accessible via an online interface. The advantage of the system is that the output data of the solar cells could be simply monitored anywhere with an internet connection provided.
4.1 Hardware experimental setup
Figure 8 depicts the hardware configuration of the proposed approach. Solar panels are used to generate electric power and are stored in batteries. The breadboard is used to connect all components presented in Figure 4.
Arduino uses analog pins to measure current and voltage. These numbers are used by Arduino programming to determine power and energy.
4.2 Software setup
The system uploads code to the board using the open-source and free Arduino Integrated Development Environment. To communicate with the sensor circuit and sense current and voltage, the Arduino is attached to them and creates the C code for power and energy detection and calculation. Using the Arduino IDE software, the program design for the solar panel performance monitoring system is carried out. The system uses a NodeMCU module linked to software that can be read from a distance to transfer sensor measurements over a long distance. The data transmission from measurement results takes place in real time under the measurement conditions. The basic program of each sensor is combined with a customized display in the program design flow, as shown in Figure 7. The Thingspeak web applications program presentation changes to the IoT Platform system.
4.3 Arduino Uno program
The primary objective of Arduino programming is to read the sensor by the system operation, after which it is communicated through the TX pin to the NodeMCU wireless module.
4.4 Cloud setup
The open-source Thingspeak application and API store use the HTTP protocol to retrieve data from devices through the Internet or a Local Area Network (Rao et al. 2021b). Applications for location tracking, sensor logging, and a social network of items with status updates may be created with Thingspeak.
The thingspeak account was created by the user and it has distinct channels for various tasks (Pereira et al. 2017). In the monitoring system, the channel includes fields with varying values for various parameters. The system uploads the values to the parameter after assigning it. There are built-in methods in the cloud that display the values as graphs.
5 Results and discussions
The Energy Management Center is a graphical user interface that is essentially straightforward to use for logging data about voltage and current in solar systems and utilities. It has voltmeters, ammeters, and power meters for solar power systems as well as for the indication and measurement of utilities. On these meters, voltage, current, and power data are shown. To record voltage and currents, data are updated once per second in a table. For the transfer of loads between a utility source and a solar power system.
At a specific field location, readings from this system are gathered over a day. The readings that were taken in the morning, afternoon, and late in the evening and shown below, visually (Figure 10).

Flowchart of the cloud setup.
5.1 In the morning
Figure 11a–e show the voltage, current, power, light intensity, and temperature measurements that were made at a certain time in the morning. The voltage values recorded between 8.21 and 8.28 in the morning and, the current sensor on a particular day are shown in Figure 11a. Solar photovoltaic panels may produce voltages as high as 2.50 V and as low as 2.430 V.

The variation of different solar parameters in the morning. (a) Voltage b/w date/time. (b) Current b/w date/time. (c) Power b/w date/time. (d) Light intensity b/w date/time. (e) Temperature b/w date/time.
Figure 11b shows the current reading through the load, which was represented by shunt resistance, the same as that it was seen by the current sensor between the hours of on a certain day, 8.21 and 8.28 in the morning. A period’s maximum and minimum current values are around 1 mA and 0.5 mA, respectively.
The voltage plus current was measured using a current sensor between the hours of 8.21 and 8.28 on a particular day to create the power curve shown in Figure 11c. The lowest power at this time was around 01.5 mW, while the greatest power was 02.5 mW.
The measured light intensity on solar PV panels is shown in Figure 11d using an LDR sensor between the hours of 8.21 and 8.28 in the morning on a day. The max light intensity at that time is close to 840 Cd, while the minimum value is close to 802 cd. We recorded the temperature on the solar panels’ surface using the sensor at a specified hour in the morning on a particular day. The temperature range on a given day between 8.21 am and 8.28 am is shown in Figure 11e. Within that particular occurrence, the temperature ranges from 22.5 °C to 22.9 °C.
5.2 In afternoon
Figure 12a–e display the measurements of the voltage, current, power, light intensity, and temperature taken at particular times in the afternoon. The voltage measurement of the built-in system is shown in Figure 6e on a day between 3.32 and 3.42 p.m. The maximum voltage we could create is about 3.28 V, which is greater than the figure in the morning because that is when the solar PV panel gets the most light.

The variation of different solar parameters in the afternoon. (a) Bus voltage b/w date/time. (b) Current b/w date/time. (c) Power b/w date/time. (d) Light intensity b/w date/time. (e) Temperature b/w date/time.
Figure 12b displays the value of the afternoon reading that was taken on a day between 3.32 and 3.42 p.m. The max current during that time is around 1.1 mA, while the smallest current is roughly 0.5 mA. The data gathered by the current sensor in the afternoon is shown by the power curves in Figure 12c. Due to the extreme light levels, the greatest value recorded between 3.32 and 3.42 pm on a workday was 3.59 mW, which was higher than the value measured in the morning for that particular daylight.
The amounts of light rays shown by the curve in Figure 12d were present on a day between the hours of 3.32 and 3.42 p.m. The curve shows that the level of light is constantly at 1024 cd, which is its max value. The temperature change on the solar panels’ surface between 3.32 and 3.43 pm on a particular day is shown in Figure. In this graph, the highest temperature registered at 31.2 °C, while the lowest was 29.0 °C.
5.3 During the evening
Figure 13a–e shows voltage, current, power, light intensity, and temperature measurements that were made at various points throughout the night. The voltage value produced by using solar PV cells on a particular daytime between 11.22 pm and 11.32 pm is shown in Figure 13a. The greatest generated voltage during this time was around 0.19 V, while the minimum generated voltage was 0.170 V due to the low night-time light intensity.

The variation of different solar parameters in the evening. (a) Bus voltage b/w date/time. (b) Current b/w date/time. (c) Power b/w date/time. (d) Light intensity b/w date/time. (e) Temperature b/w date/time.
Figure 13b shows the produced current across the load on a particular daytime between 11.22 pm and 11.32 pm. In this instance, the Current sensor can detect a maximum generated current of around 1.2 mA and a produced current that is at least 0.6 mA. The graph in Figure 13c displays the amount of electricity generated on a certain day between 11.22 p.m. and 11.32 p.m. The greatest production of solar PV panels was 0.23 mW, which was incredibly low compared to the afternoon and morning. This is because the solar PV panels’ exposure to light is at its lowest at night. The smallest quantity of power produced is around 0.11 mW.
Figure 13d shows light intensity hitting solar PV panels on a day from 11.21 p.m. to 11.34 p.m. The maximum and minimum light intensities during this time were 330 cd and 325 cd, respectively. In comparison to morning and afternoon, nighttime light intensity variations are less. Figure 13e shows the temperature on the solar panels’ surface between 11.22 and 11.32 p.m. on a certain day. It is clear that throughout that period, the temperature varies between 24.5 °C and 25.2 °C.
6 Conclusions
In this paper, a microcontroller, a PV panel, sensors, a battery charger module, and a system for monitoring real-time solar power were all successfully built. The system was able to collect real-time information from locations remote from the control center and use a GUI to continuously track the voltage, current, temperature, and light output of PV panels, among other environmental factors. Real-time data may be continually watched and captured with IoT. This data can then be analyzed to anticipate and estimate future power generation possibilities, revenue production, and other factors. The implementation of this IoT-based system would consequently facilitate and improve recorded data analysis, decrease intervention and monitoring time, streamline network administration, and do away with the requirement for routine PV system maintenance. Since the solar radiation range is not constant and can change with place and time. To make the most effective use of the largest quantity of solar radiation and get the highest output, we may manage the PV panel by setting up a Solar Power Tracking System. If any component of the system develops a defect, the Solar Power Monitoring system will also be advantageous.
Acknowledgments
Specific supports that must normally be acknowledged in manuscript include. Funding, sponsorship, or fellowship, including the name of the funding agency and award or grant number, and a statement of whether the funder was involved in the study and reporting (some journals and conferences). People, institutions, or organizations that gave access to facilities or equipment. Study participants (e.g., interviewees, patients, staff of an institution). Providers of technical assistance or services and practical set up. Source and permission to use specific datasets, or copyright permission to reproduce or adapt illustrations or other material. Collected data, transcribed or translated interviews, or performed data entry, coding, or statistical analysis. Discussed, critiqued, or advised on an earlier draft. Helped with language (e.g., translation, editing, proofreading) or work during paper preparation.
-
Research ethics: The manuscript in part or in full has not been submitted or published anywhere. In other words, the authors should ensure that the manuscript is not a duplicate publication.
-
Author contributions: First author (Corresponding author): Challa Krishna Rao: Data curation, Writing- Original draft preparation, Software, Validation, and Writing. Second author: Sarat Kumar Sahoo: Conceptualization, Methodology, Software, Supervision. Third author: Franco Fernando Yanine: Visualization, Investigation, Reviewing and Editing.
-
Competing interests: No Conflict for publication.
-
Research funding: None declared.
-
Data availability: The manuscript in part or in full has not been submitted or published anywhere. In other words, the authors should ensure that the manuscript is not a duplicate publication. Data sharing is not applicable to this article as no new data were created or analyzed in this study. The data that support the findings of this study are available from the corresponding author, upon reasonable request. The data that support the findings of this study are available on request from the corresponding author. The data are not publicly available due to [restrictions e.g. their containing information that could compromise the privacy of research participants]. The authors confirm that the data supporting the findings of this study are available within the article [and/or] its supplementary materials.
References
Adhya, S., D. Saha, A. Das, J. Jana, and H. Saha. 2016. “An IoT Based Smart Solar Photovoltaic Remote Monitoring and Control Unit.” In IEEE International Conference on Control, Instrumentation, Energy & Communication (CIEC), 432–6.10.1109/CIEC.2016.7513793Search in Google Scholar
Bhujbal, M. D., and M. G. Unde. 2022. “Real-Time Monitoring and Security of Solar Power Plant Using IoT.” In 2022 IEEE India Council International Subsections Conference (INDISCON).10.1109/INDISCON54605.2022.9862817Search in Google Scholar
Chine, W., A. Mellit, A. M. Pavan, and S. A. Kalogirou. 2014. “Fault Detection Method for Grid-Connected Photovoltaic Plants.” Renewable Energy 66: 99–110.10.1016/j.renene.2013.11.073Search in Google Scholar
IRENA. 2017. Renewable Energy Prospects: Indonesia, A REmap Analysis. Abu Dhabi: International Renewable Energy Agency (IRENA). www.irena.org/remap.Search in Google Scholar
Khadka, N., A. Bista, B. Adhikari, A. Shrestha, D. Bista, and B. Adhikary. 2020. “Current Practices of Solar Photovoltaic Panel Cleaning System and Future Prospects of Machine Learning Implementation.” IEEE Access 8: 135948–62.10.1109/ACCESS.2020.3011553Search in Google Scholar
Li, Y. F., P. J. Lin, H. F. Zhou, Z. C. Chen, L. J. Wu, and S. Y. Cheng. 2017. “On-line Monitoring System of PV Array Based on Internet of Things Technology.” IOP Conference Series: Earth and Environmental Science 93: 012078.10.1088/1755-1315/93/1/012078Search in Google Scholar
Lokesh Babu, L.R.R., D. Rambabu, A. R. Naidu, D. Prasad, and P. Gopi Krishna. 2018. “IoT Enabled Solar Power Monitoring System.” International Journal of Engineering & Technology 7 (3): 526–12.10.14419/ijet.v7i3.12.16172Search in Google Scholar
Mungkin, M., H. Satria, J. Yanti, G. B. A. Turnip, and S. Suwarno. 2020. “Perancangan Sistem Pemantauan Panel Surya Pollycristalline Menggunakan Teknologi Web Firebase Berbasis IoT.” INTECOMS: Journal of Information Technology and Computer Science 3 (2): 319–27.10.31539/intecoms.v3i2.1861Search in Google Scholar
Okere, A., and M. T. Iqbal. 2020. “A Review of Conventional Fault Detection Techniques in Solar PV Systems and a Proposal for Long Range (LoRa) Wireless Sensor Network for Module Level Monitoring and Fault Diagnosis in Large Solar PV Farms.” European Journal of Electrical Engineering and Computer Scienc 4 (6).10.24018/ejece.2020.4.6.267Search in Google Scholar
Pereira, R. I. S., I. M. Dupont, P. C. M. Carvalho, and S. C. S. Juca. 2017. “IoT Embedded Linux System Based on Raspberry Pi Applied to Real-Time Cloud Monitoring of a Decentralized Photovoltaic Plant.” International Journal of measurement Elsevier 2: 1–18.Search in Google Scholar
Priharti, W., A. F. K. Rosmawati, and I. P. D. Wibawa. 2019. “IoT-Based Photovoltaic Monitoring System Application.” Journal of Physics: Conference Series 1367 (1): 012069.10.1088/1742-6596/1367/1/012069Search in Google Scholar
Rao, C. K., S. K. Sahoo, M. Balamurugan, S. R. Satapathy, and A. Patnaik. 2020. “Applications of Sensors in Solar Energy Systems.” In 2020 International Conference on Renewable Energy Integration into Smart Grids: A Multidisciplinary Approach to Technology Modelling and Simulation (ICREISG). IEEE.10.1109/ICREISG49226.2020.9174190Search in Google Scholar
Rao, C. K., S. K. Sahoo, and F. F. Yanine. 2021a. “Demand Response for Renewable Generation in an IoT-Based Intelligent Smart Energy Management System.” In 2021 Innovations in Power and Advanced Computing Technologies (i-PACT). IEEE.10.1109/i-PACT52855.2021.9696781Search in Google Scholar
Rao, C. K, S. K. Sahoo, M. Balamurugan, and F. F. Yanine. 2021b. “Design of Smart Socket for Monitoring of IoT-Based Intelligent Smart Energy Management System.” In Lecture Notes in Electrical Engineering, 503–18. Singapore: Springer.10.1007/978-981-15-8439-8_41Search in Google Scholar
Rao, C. K., S. K. Sahoo, and F. F. Yanine. 2022a. “Demand Side Energy Management Algorithms Integrated with the IoT Framework in the PV Smart Grid System.” In Advanced Frequency Regulation Strategies in Renewable-Dominated Power Systems, 255–77. Amsterdam: Elsevier.10.1016/B978-0-323-95054-1.00007-XSearch in Google Scholar
Rao, C. K., S. K. Sahoo, and F. F. Yanine. 2022b. “Forecasting Electric Power Generation in Photovoltaic Power Systems for Smart Energy Management.” In 2022 International Conference on Intelligent Controller and Computing for Smart Power (ICICCSP). 10.1109/ICICCSP53532.2022.9862396Search in Google Scholar
Rohit, A. K., Tomar, A., Kumar, A., and Rangnekar, S. 2017. “Virtual Lab Based Real-time Data Acquisition, Measurement and Monitoring Platform for Solar Photovoltaic Module.” Resource-Efficient Technologies 3 (4): 446–51.10.1016/j.reffit.2017.04.006Search in Google Scholar
Zanella, A., N. Bui, A. Castellani, L. Vangelista, and M. Zorzi. 2014. “Internet of Things for Smart Cities.” IEEE Internet of Things Journal 1 (1): 22–32.10.1109/JIOT.2014.2306328Search in Google Scholar
© 2024 the author(s), published by De Gruyter, Berlin/Boston
This work is licensed under the Creative Commons Attribution 4.0 International License.
Articles in the same Issue
- Solar photovoltaic-integrated energy storage system with a power electronic interface for operating a brushless DC drive-coupled agricultural load
- Analysis of 1-year energy data of a 5 kW and a 122 kW rooftop photovoltaic installation in Dhaka
- Reviews
- Real yields and PVSYST simulations: comparative analysis based on four photovoltaic installations at Ibn Tofail University
- A comprehensive approach of evolving electric vehicles (EVs) to attribute “green self-generation” – a review
- Exploring the piezoelectric porous polymers for energy harvesting: a review
- A strategic review: the role of commercially available tools for planning, modelling, optimization, and performance measurement of photovoltaic systems
- Comparative assessment of high gain boost converters for renewable energy sources and electrical vehicle applications
- A review of green hydrogen production based on solar energy; techniques and methods
- A review of green hydrogen production by renewable resources
- A review of hydrogen production from bio-energy, technologies and assessments
- A systematic review of recent developments in IoT-based demand side management for PV power generation
- Research Articles
- Hybrid optimization strategy for water cooling system: enhancement of photovoltaic panels performance
- Solar energy harvesting-based built-in backpack charger
- A power source for E-devices based on green energy
- Theoretical and experimental investigation of electricity generation through footstep tiles
- Experimental investigations on heat transfer enhancement in a double pipe heat exchanger using hybrid nanofluids
- Comparative energy and exergy analysis of a CPV/T system based on linear Fresnel reflectors
- Investigating the effect of green composite back sheet materials on solar panel output voltage harvesting for better sustainable energy performance
- Electrical and thermal modeling of battery cell grouping for analyzing battery pack efficiency and temperature
- Intelligent techno-economical optimization with demand side management in microgrid using improved sandpiper optimization algorithm
- Investigation of KAPTON–PDMS triboelectric nanogenerator considering the edge-effect capacitor
- Design of a novel hybrid soft computing model for passive components selection in multiple load Zeta converter topologies of solar PV energy system
- A novel mechatronic absorber of vibration energy in the chimney
- An IoT-based intelligent smart energy monitoring system for solar PV power generation
- Large-scale green hydrogen production using alkaline water electrolysis based on seasonal solar radiation
- Evaluation of performances in DI Diesel engine with different split injection timings
- Optimized power flow management based on Harris Hawks optimization for an islanded DC microgrid
- Experimental investigation of heat transfer characteristics for a shell and tube heat exchanger
- Fuzzy induced controller for optimal power quality improvement with PVA connected UPQC
- Impact of using a predictive neural network of multi-term zenith angle function on energy management of solar-harvesting sensor nodes
- An analytical study of wireless power transmission system with metamaterials
- Hydrogen energy horizon: balancing opportunities and challenges
- Development of renewable energy-based power system for the irrigation support: case studies
- Maximum power point tracking techniques using improved incremental conductance and particle swarm optimizer for solar power generation systems
- Experimental and numerical study on energy harvesting performance thermoelectric generator applied to a screw compressor
- Study on the effectiveness of a solar cell with a holographic concentrator
- Non-transient optimum design of nonlinear electromagnetic vibration-based energy harvester using homotopy perturbation method
- Industrial gas turbine performance prediction and improvement – a case study
- An electric-field high energy harvester from medium or high voltage power line with parallel line
- FPGA based telecommand system for balloon-borne scientific payloads
- Improved design of advanced controller for a step up converter used in photovoltaic system
- Techno-economic assessment of battery storage with photovoltaics for maximum self-consumption
- Analysis of 1-year energy data of a 5 kW and a 122 kW rooftop photovoltaic installation in Dhaka
- Shading impact on the electricity generated by a photovoltaic installation using “Solar Shadow-Mask”
- Investigations on the performance of bottle blade overshot water wheel in very low head resources for pico hydropower
- Solar photovoltaic-integrated energy storage system with a power electronic interface for operating a brushless DC drive-coupled agricultural load
- Numerical investigation of smart material-based structures for vibration energy-harvesting applications
- A system-level study of indoor light energy harvesting integrating commercially available power management circuitry
- Enhancing the wireless power transfer system performance and output voltage of electric scooters
- Harvesting energy from a soldier's gait using the piezoelectric effect
- Study of technical means for heat generation, its application, flow control, and conversion of other types of energy into thermal energy
- Theoretical analysis of piezoceramic ultrasonic energy harvester applicable in biomedical implanted devices
- Corrigendum
- Corrigendum to: A numerical investigation of optimum angles for solar energy receivers in the eastern part of Algeria
- Special Issue: Recent Trends in Renewable Energy Conversion and Storage Materials for Hybrid Transportation Systems
- Typical fault prediction method for wind turbines based on an improved stacked autoencoder network
- Power data integrity verification method based on chameleon authentication tree algorithm and missing tendency value
- Fault diagnosis of automobile drive based on a novel deep neural network
- Research on the development and intelligent application of power environmental protection platform based on big data
- Diffusion induced thermal effect and stress in layered Li(Ni0.6Mn0.2Co0.2)O2 cathode materials for button lithium-ion battery electrode plates
- Improving power plant technology to increase energy efficiency of autonomous consumers using geothermal sources
- Energy-saving analysis of desalination equipment based on a machine-learning sequence modeling