Analysis of 1-year energy data of a 5 kW and a 122 kW rooftop photovoltaic installation in Dhaka
-
Mohammad Abul Hossion


Abstract
Since 2010, rooftop photovoltaic (PV) systems have been extensively used in Bangladesh. This PV system contributes 2–3% to the country's energy demand. In recent years (2020–2024), at least ten large-scale 20–100 MW PV power plants are coming into operation. However, the growth rate of the new PV system is limited by a few factors, such as sustainable energy output over a long time, financial return on investment, and reliability of the energy. To maintain a steady growth of the electrical energy produced from the PV system, research on the performance of the older installations is required. This study analyzes the various data (generated dc power from sunlight, transmitted ac power to the grid) of a 5 kW (March 2021–February 2022) and a 122.4 kW (January 2022–December 2022) rooftop grid-connected solar installation for 12 months. The polycrystalline silicon PV systems are 8 and 4 years old, respectively. The yearly average performance ratio of the 5 and 122.4 kW systems is 17% and 79%, respectively. The results of the study will encourage the investors and community to achieve a 10% share in the national energy demand in the context of Bangladesh.
1 Introduction
The renewable and clean energy resources are competing with the conventional energy resources. This has become possible because of the global awareness against fossil fuel-related pollution. In recent years, with post-COVID-19 and global economic uncertainties, the supply of fossil fuels such as oil and coal has become unpredictable. To maintain energy security, many countries are now emphasizing toward increasing the proportion of renewable energy share in the national energy mix. Figure 1 shows the renewable energy mix for the national electrical energy generation of 62 countries with a maximum share of 87% to a minimum of 3% (Renewable Energy by Country 2023). Renewable energy resources, such as wind, solar, hydro, ocean wave, tidal current, etc., are the main source of large-scale electricity generation. Among these renewable resources, 12% of the global electricity is produced from photovoltaic (PV) and wind (Wiatros-Motyka 2023).

Renewable energy mix to the national electrical energy generation of 62 countries with a maximum share of 87% to lowest 3%.
Bangladesh is no exception, with its abundance of sunlight and wind energy. However, resources are not being used to their limit, especially in Bangladesh, where there is a 3-month monsoon season. The recent global economic hardship and post-COVID-19 placed Bangladesh in a difficult situation with regard to the fuel for its large-scale electrical power plants, which rely on coal and oil. This has reminded us to increase the investment in renewable resources, mainly in PV and wind, which are the two most promising renewable energy sources for Bangladesh (Tachev 2022). The long coastline of the Bay of Bengal (BoB) is ideal for wind energy generation. The country’s coastal regions have an average wind speed of 5–8 m/s. This falls into the lower end of the ideal range for wind turbines. Bangladesh has 20,000 km2 of viable land with a potential wind generation capacity of 30,000 MW (Babu et al. 2022). However, BoB is a cyclone-prone area where flash flood and ghastly wind is a yearly phenomenon. Thus, the growth of wind plants is limited. Bangladesh receives an average of 4–6.5 kW h/m2 of solar energy per day, which is sufficient to generate the required portion of electricity for the national grid (Abdullah-Al-Mahbub and Islam 2023). The Power Development Board of Bangladesh maintains an up-to-date record of all current and upcoming renewable energy power plants through the Sustainable Renewable Energy Development Authority (SREDA, National Database of Renewable Energy 2023) (RE Generation mix, 2023). At present, the PV provides 80% (PV 960 MW, hydro 230 MW, and wind 2.9 MW) of the total 1,193 MW renewable energy share to the national electrical energy installed capacity of 24,263 MW. Considering the growth, Figure 2 plots the PV and wind power plants that are operational, under construction, and in planning using the data from SREDA. It shows 438.6 MW of PV and 62 MW of wind power plants, which are under construction. These power plants are scheduled to be active in 1–2 years. Under the planning phase, there are 1,311 MW of PV and 295 MW of wind power plants, which are expected to be active in 3–4 years’ time. At this rate, renewable energy resources will contribute 6–8% to the national electrical energy demand in 3–5 years.

Installed capacities versus PV and wind power plants bar chart, which are active, under construction, and under planning by the Ministry of Power, Energy and Mineral Resources, Bangladesh.
It appears that the growth of PV power generation will exceed all other renewable resources in Bangladesh (Talut et al. 2022). Hence, it will be crucial to maintain and use the PV systems with maximum capacity. In recent times, performance evaluation, degradation (Hossion 2020), and aging have become significant regarding the electrical energy contribution from the PV installation (Hossion et al. 2023). This is used to forecast the actual return on investment period (Abas et al. 2022, Alashqar et al. 2022), reliability (Sun et al. 2019), and energy cost per unit (Aziz et al. 2023) using suitable software tools (Khan and Minai 2023) which in turn attracts more investment from the private sector. In the context of Bangladesh, there are two kinds of PV systems that are widely available in the field; one is 5–20 kW capacity installations, which are suitable for home, office, irrigation, and rural community spaces. The other PV systems are 100 kW and above, which are suitable for industrial rooftop as cluster systems capable of producing 1–4 MW electrical power (Joshi et al. 2021). This study acquires energy data of a 5 kW (March 2021–February 2022) and a 122.4 kW (January 2022–December 2022) rooftop grid-connected solar installation for 12 months. The energy data are processed to evaluate the performance of the PV system in terms of indexes such as specific yields (Schardt and te Heesen 2021), electrical degradation (Al Mansur et al. 2023, Pascual et al. 2021), overall system efficiency (Anang et al. 2021), performance ratio (PR) (Yadav and Bajpai 2020), potential induced degradation (Dhimish and Tyrrell 2022), and payback period (Alazazmeh et al. 2022). This study analyzed the 1-year energy data from the two PV systems for the calculation of PR (Syahindra et al. 2021) using a generalized method (Navothna and Thotakura 2022), which will be useful for the field-level study.
2 Experimental sites and setup
The two polycrystalline silicon PV installations were considered as the experimental sites. The installed capacity of the PV system in site 1 is 5 kW and in site 2 is 122.4 kW. Both the PV systems use polycrystalline silicon PV modules facing south. The PV system in site 1 is mounted on a metal frame with an angle of 22 degrees to the roof surface on the rooftop of a commercial building. The ground clearance was maintained between 2 and 5 ft. The PV modules in site 2 are installed on the export processing zone industrial building fitted with the curved industrial tin roof with no ground clearance. Hence, the modules are fitted at a variable inclination ranging from 5 degrees to 19 degrees along the roof to maintain the slope. The details of the sites are given in Table 1.
PV installation sites and system details data
| PV array | Site-1 Thirty-three modules in each string, 3 strings are connected in one inverter. | Site-2 Seventeen modules in each string, 4 strings in each inverter, 5 inverters. |
| Location | Section-12, Mirpur, Dhaka, Bangladesh | EPZ, Savar, Dhaka, Bangladesh |
| Latitude 23.82720168664972, longitude 90.36371646641032 | Latitude 23.94700099969477, longitude 90.27506736317311 | |
| Installed capacity | 4,950 W | 122,400 W |
| PV modules | Ninety-nine modules, each 50 W | Three hundred forty modules, each 360 W |
| PV modules type | Poly-crystalline silicon | Poly-crystalline silicon |
| Installation year | 2014 | 2018 |
| Type of installation | On-grid | On-grid |
| Capacity-to-area ratio | 112.5 W/m2 | 180 W/m2 |
The PV modules and their technology are of utmost importance to the performance of the system. The PV modules in sites 1 and 2 are each 50 and 360 W, respectively. The 50 W modules are 14.53% efficient, and 360 W modules are 18.15% efficient. The array designed for the 5 kW PV system uses one string with 33 modules in series. The three strings are connected to the inverter in parallel, which gives a maximum DC voltage of 570.9 V, a current of 8.82, and a power of 5 kW. The array designed for the 122-kW PV system uses one string with 17 modules in series. The four strings are connected in parallel to one inverter, which gives a maximum DC voltage of 673.2 V, a current of 36.4 A, and a power of 24.5 kW. Thus, five inverters give 122 kW power. The nameplate data of each type of PV modules are given in Table 2.
PV module characteristics (nameplate) data
| PV module parameters | Poly silicon 50 W | Poly silicon 360 W |
|---|---|---|
| Maximum power (P max) (Wp) | 50 | 360 |
| Open circuit voltage (V oc) (V) | 21.6 | 47.0 |
| Short circuit current (I sc) (A) | 3.29 | 9.67 |
| Voltage at maximum power (V mpp) (V) | 17.3 | 39.6 |
| Current at maximum power (I mpp) (A) | 2.94 | 9.10 |
| Fill factor (FF) (%) | 71.6 | 79.28 |
| Efficiency (E ff) (%) | 14.53 | 18.15 |
| Nominal operational cell temperature (°C) | (−)40 to +85 | (−)40 to +85 |
| Cell area (cm2) | 6.4 × 15.4 | 15.67 × 7.838 |
| Cell number | 36 | (6 × 24) = 144 |
| Module area (cm2) | 66 × 67 | 200 × 100 |
| Total solar installation area (m2) | (66 × 67 × 99 × 10−4) = 44 | (200 × 100 × 340 × 10−4) = 680 |
| Series resistance (ohm) | 1.46 | 0.81 |
| Shunt resistance (ohm) | 49.42 | 69.47 |
The inverters are an integral part of a PV installation. These inverters have multiple roles, such as DC to AC conversion, battery charger, maximum power point tracker for optimum performance, intelligent grid connectivity, frequency matching, etc. The inverter also acts as a communication and data acquisition device. The inverters are fitted with communication ports such as serial and ethernet connectors. The connectors can be used to link the inverter to a network using a computer. The data such as DC voltage, current, power, AC voltage, current, power, working duration, and inverter temperature can be recorded using suitable software and a computer. The detailed specifications of the inverters are given in Table 3.
Grid-connected inverter (nameplate) data
| Inverter details | Kaco-5500 | Sunny Tripower, SMA Solar Tech. |
|---|---|---|
| PC interface | RS232 | RJ 45 Ethernet |
| Max input voltage (d.c) | 800 V | 1,000 V |
| Max input current (d.c) | 15.2 A | 36.2 A |
| Max input power (d.c) | 6,000 W | 25,000 W |
| Rated frequency (a.c) | 50 Hz | 50 Hz |
3 Data acquisition procedure
The daily energy production data are acquired from the PV systems using specific software provided by the inverter. The data are recorded every 1 min for the day duration. The schematics of the data acquisition process from sites 1 and 2 are shown in Figures 3 and 4, respectively. The photographic image of the PV modules on the rooftop is given in Figure 5 for sites 1 and 2.

Schematics of electrical connection and data acquisition process for 5 kW PV installation in site-1.

Schematics of electrical connection and data acquisition process for 122.4 kW PV installation in site-2.

Image of the 5 kW PV installation on a metal frame with ground clearance at an angle of 22 degrees (left). Image of the 122.4 kW PV installation on the roof at 5–19 degree slope facing south (right).
4 Results and discussion
4.1 Yearly data analysis
Yearly data of a PV system provide insights regarding the performance and productivity (Jamil et al. 2023). The output of a PV system is electrical energy in kilo-watt-hour (kW h). The energy data can be extracted from the inverter in real-time and stored for further analysis. Table 4 shows the 1-year electrical energy data of the two PV systems used in this study where the capacity of site 1 is 5 kW and site 2 is 122.4 kW. The data from site 1 are recorded for the months of March 2021–February 2022. The data from site 2 are recorded for the months of January 2022–December 2022. The data are tabulated according to the three seasons of Bangladesh for over 365 days and total 4,350 working hours. The annual average energy output from 5 and 122.4 kW system is 3.23 and 369.36 kW h/day, respectively. The maximum productive month is March and minimum is December.
Total electrical energy data of 1 year for 5 kW and 122.4 kW PV system
| Season | Month | Days (A) | Working duration (hours/month) | Monthly PV energy output to the grid (5 kW system) (kW h/month) (B) | Average PV energy output to the grid (5 kW system) (kW h)/day (B/A) | Monthly PV energy output to the grid (122.4 kW system) (kW h/month) (C) | Average PV energy output to the grid (122.4 kW system) (kW h)/day (C/A) |
|---|---|---|---|---|---|---|---|
| Summer | March | 31 | 365 | 136 | 4.4 | 12983.5 | 418.82 |
| April | 30 | 380 | 144 | 4.8 | 12462.99 | 415.43 | |
| May | 31 | 406 | 126 | 4.0 | 11424.3 | 368.52 | |
| June | 30 | 380 | 81 | 2.7 | 11020.27 | 367.34 | |
| Monsoon | July | 31 | 403 | 91 | 2.9 | 12660.69 | 408.40 |
| August | 31 | 379 | 84 | 2.7 | 12557.35 | 405.07 | |
| September | 30 | 360 | 94 | 3.1 | 10126.12 | 337.53 | |
| October | 31 | 353 | 106 | 3.4 | 11753.92 | 379.15 | |
| Winter | November | 30 | 327 | 85 | 2.8 | 10737.43 | 357.91 |
| December | 31 | 327 | 64 | 2.0 | 9113.83 | 293.99 | |
| January | 31 | 334 | 70 | 2.3 | 9206.7 | 296.99 | |
| February | 28 | 336 | 98 | 3.5 | 10,772 | 384.72 | |
| 365 | 4,350 | 1,179 | 3.23 | 134819.4 | 369.36 |
4.2 Daily data analysis
The inverter provides electrical voltage and current data, which is used to calculate the total electrical energy generation over a day. For analysis, the daily data are presented in Figure 6 for March 2021 of the 5 kW PV system installed in site 1. Figure 6 is a bar chart that shows the 31 days of total electrical energy (red) and total working hours (blue). The PV system was active for an average of 12 h daily over March 2021. The maximum and minimum electricity generations were 6.9 kW h on 14 March 2021 and 2.1 kW h on 9 March 2021, respectively. For further analysis, Figures 7 and 8 show the voltage and power data of the days 9 March 2021 and 14 March 2021, respectively. These two days are chosen as the minimum and maximum productive days of the month, respectively. The data plot in Figure 7 shows the PV system voltage and power from morning 6 am to afternoon 6 pm on 9 March 2021. The rise in PV system voltage shows that the energy is being produced but not transmitted to the grid. After sunrise, the voltage increases gradually and reaches a peak of 500 V at around 8 am. At this point, the voltage decreases to 350 V, and power is transferred to the grid. The plot shows many spikes in voltage for which the power becomes zero. Hence, the system is not transmitting the energy to the grid. These voltage spikes are caused by a sudden fall in the generated current and grid failure. The sudden fall in the generated current may be due to cloud shading. The grid failure can be caused by frequency fluctuation between the grid and the inverter. The mains electricity cut is also a reason for the grid failure. For each spike in the voltage, the inverter takes at least 3 min to restore the power to the main grid. Figure 7 shows at least six spikes, some of which are 1 h long. Besides the interruptions, the series resistances of 50 W PV modules have increased, and shunt resistance has decreased over the aging period of 8 years. The measured series and shunt resistance of 50 W PV module are 2.01 ohm and 42.60 ohm, respectively (Hossion 2020). This shows an increase in the series resistance and a decrease in the shunt resistance value shown in Table 2 as nameplate data. The open circuit voltage for the 5 kW system is 21.6 V × 33 modules = 712 V, as calculated from Table 2. From Figures 7 and 8, the open circuit voltage (V oc) is 540 V, which is 24% less than the name plate value. The reduction in V oc causes the series resistance to increase and the decrease in the maximum current of the system.
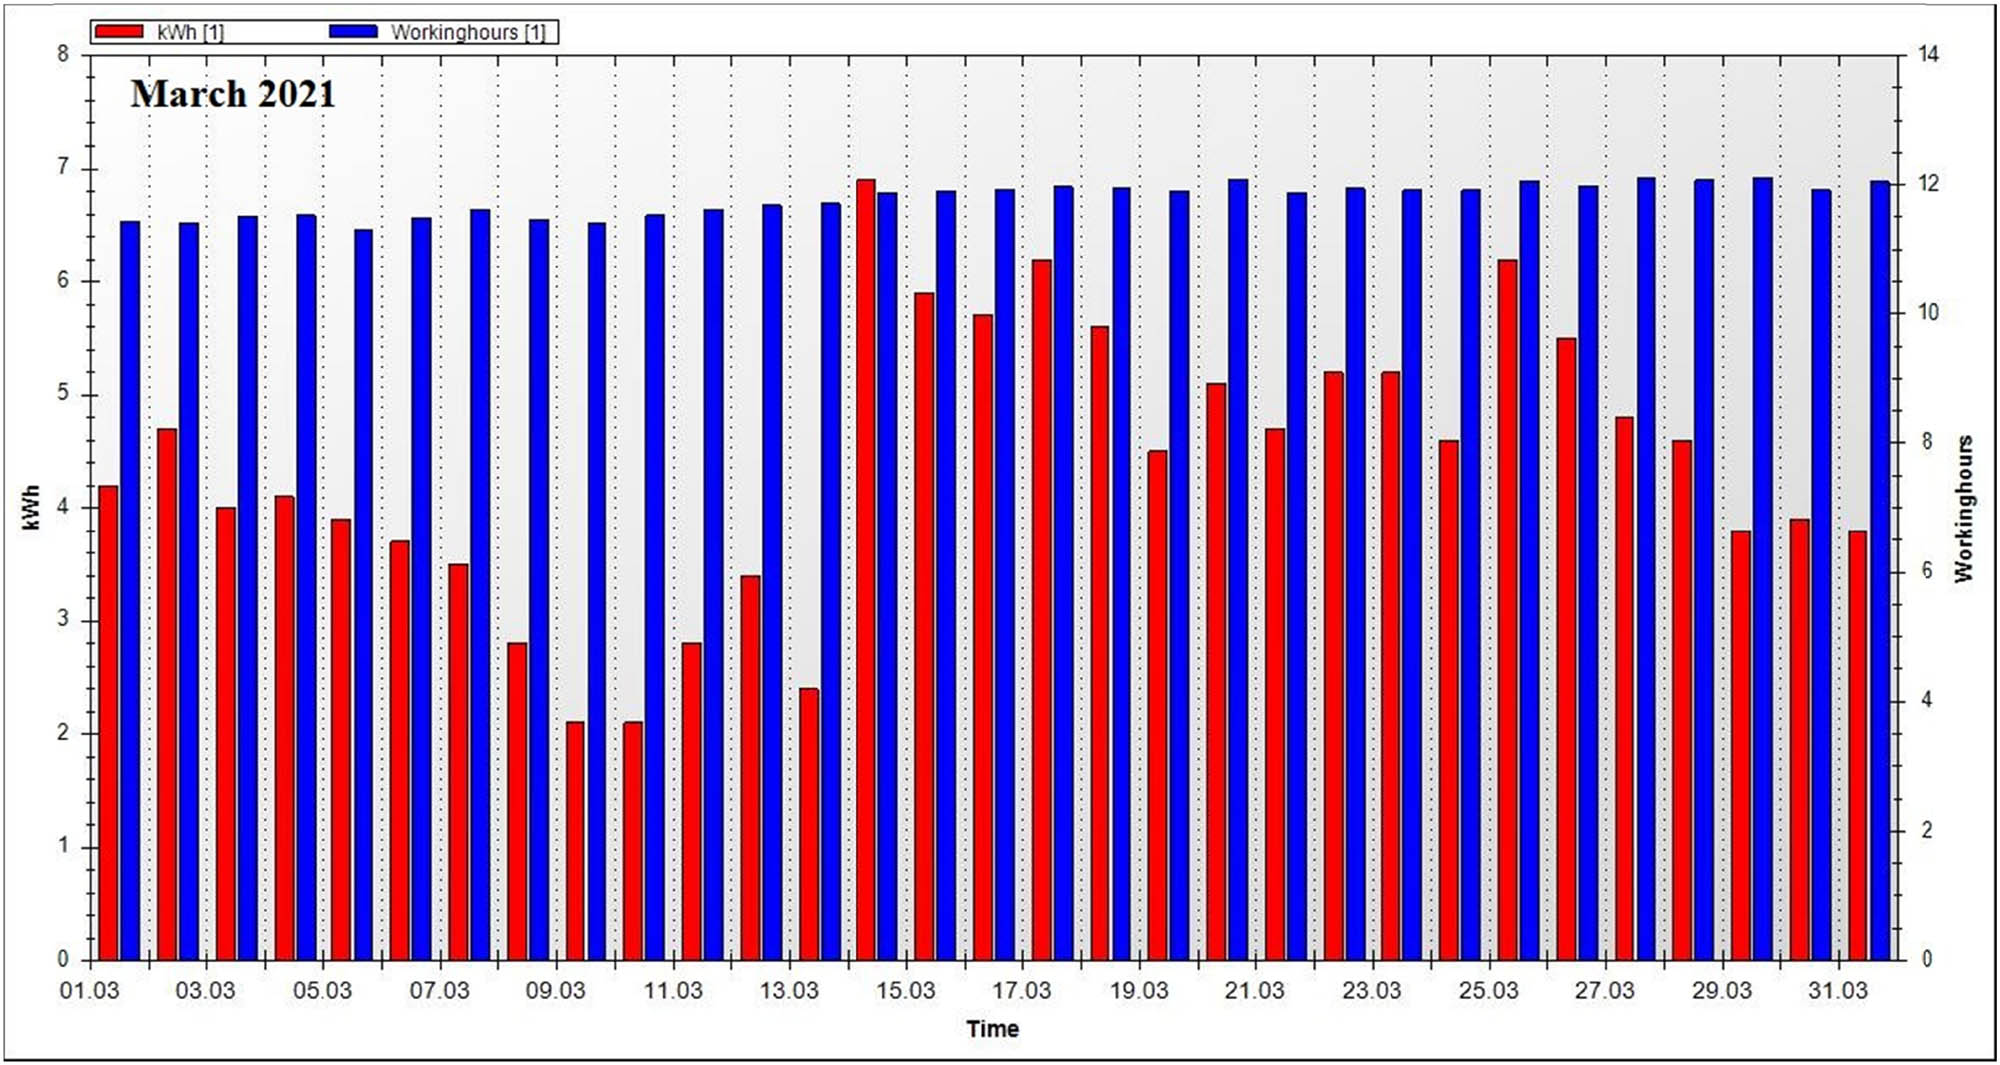
Energy and working hours versus day duration bar chart of the 5 kW rooftop PV system installed in Dhaka, Bangladesh.

DC voltage and DC power versus day duration plot of the 5 kW PV system in site 1 using the electrical data dated 9 March 2021.
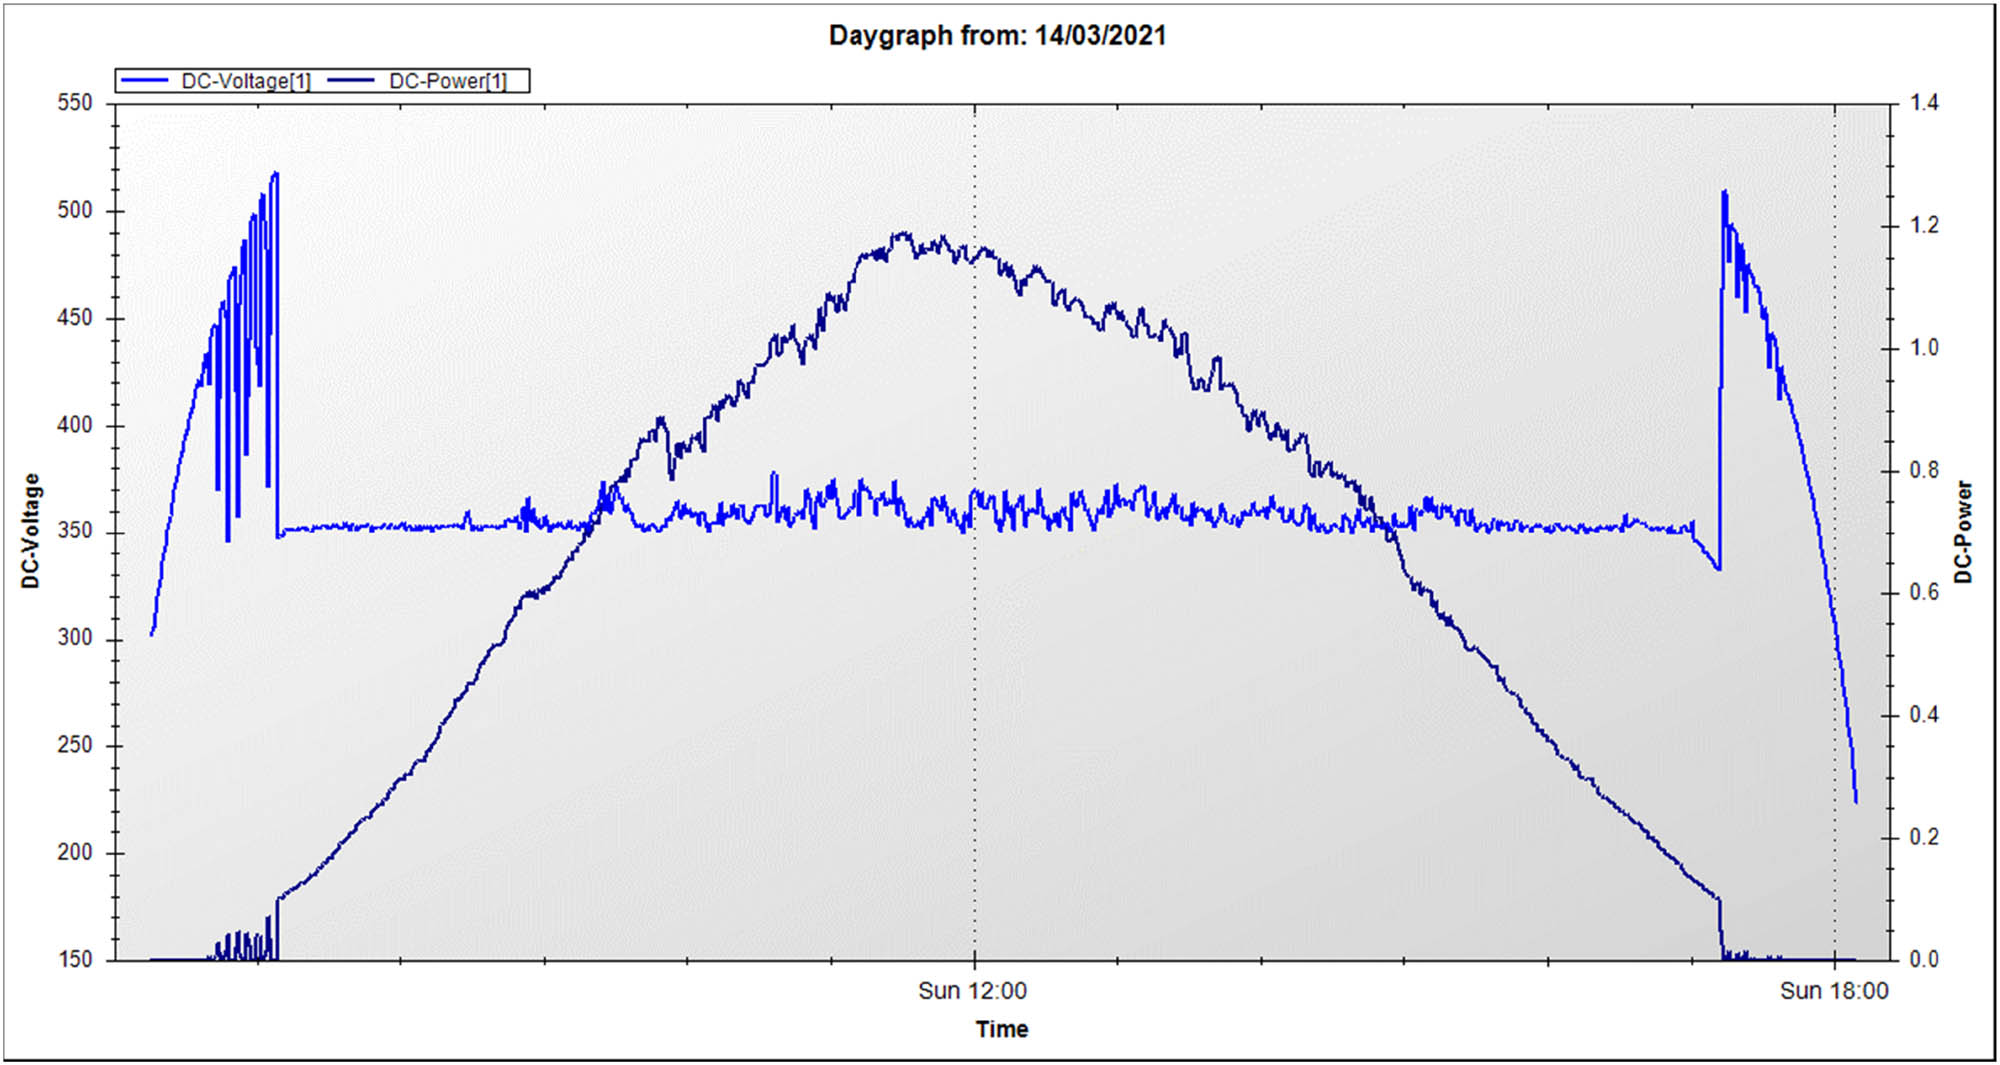
DC voltage and DC power versus day duration plot of 5 kW PV system in site 1 using the electrical data dated 14 March 2021.
The data plot in Figure 8 shows the PV system voltage and power from morning 6 am to afternoon 6 pm on 14 March 2021. The plot shows that the peak sunlight hour is 10 am to 3 pm, which is 5 h. The plot shows a uniform PV system voltage over the day duration 7 am–5 pm. Thus, the system transferred the electrical energy to the grid uninterrupted over the day without any grid failure. The feature of the power curve shows a gradual rise in the power with the sun’s inclination, which becomes maximum at 11:30 am. This has caused a maximum generation of electrical energy from sunlight in a day by the 5 kW PV system.
4.3 Performance data analysis
Since the time PV plants became operational, evaluating and predicting their actual performance has been of great interest to researchers, scientists, PV manufacturers, and PV plant developers. The PR of a PV plant is one of the most important parameters used by the industry today to evaluate the performance of PV plants (Jed et al. 2021). PR is a globally accepted PV plant performance parameter in evaluating different technologies through simulated feasibility studies and economic analysis (Singh et al. 2022) even before the implementation stage (Jamil et al. 2017). The PR represents the actual energy generated by the PV plant to its expected energy with reference to its nameplate rating. In other words, the PR is an indicator of losses resulting from invertor problems, wiring, shading, cell mismatch, reflection, outages, module temperatures, etc. The PR of the plant is usually independent of the site location and system size but it has strong dependence upon weather variability. The performance of a PV system can be quantified using the following equation (Khalid et al. 2016):
This study evaluates the PR of the two PV systems of capacity 5 and 122.4 kW. Table 5 shows the brief calculation and results of the PR estimated using equation (1). The nominal solar irradiation to the useful solar irradiation is taken according to the PV technology and location given in columns A and B (Global Solar Atlas 2023). The simulated energy output from the 5 kW system is 6,993 kW h/year, and from the 122.4 kW system is 171,364 kW h/year as estimated by the National Renewable Energy Laboratory (NREL), given in column C (PVWatts Calculator 2023). The measured electrical energy produced from both the PV system in sites 1 and 2 is given in columns D and E. Column F shows the calculated PR for 5 and 122.4 kW systems, which is 10 and 58%/m2 year, respectively. The installed capacity to the area ratio is 112.5 and 180 W/m2 for sites 1 and 2, respectively. Thus, the PV systems were not designed to utilize the space efficiently. Column G shows the PR for 5 and 122.4 kW systems, which is (17 and 79)%/year, respectively. The lower PR value for the 5 kW system can be explained as (i) the system is 8 years old with no cleaning and maintenance in this period. It is the seasonal rain and regular wind that keeps the system working; (ii) the system uses 33 50 W PV modules connected in series; thus, the increased series resistance in the bus bar and the solder-bond for each module contributes to the loss in electrical energy (Asadpour et al. 2022) to thermal energy; (iii) the increased series resistance causes a decrease in the shunt resistance and in turn the short circuit current is reduced; (iv) the PV modules operate at high operating temperature (55–60°C); and (v) the PV system has 24% lower V oc as compared to the nameplate data. To understand the lower PR value for 5 kW system, the single-day PR is also calculated. The calculated PR for data presented in Figure 7 (minimum) and 8 (maximum) is 11 and 36%, respectively. The average PR calculated in other literature using real-time data ranges from 77 to 87%, where the global standard is 80% (Khalid et al. 2016). Yearly average PR calculated for PV systems such as a 98.1 kW monocrystalline PV system with a 327 W module in Seoul, Korea is found 83–87% (Singh et al. 2023), 11.2 kW polycrystalline silicon with a 280 W module is found 78% in India (Sharma and Goel 2017), and for 5 kW PV system, it is 77% in India (Yadav and Bajpai 2018).
Polycrystalline silicon PV installations PR data as calculated in this study in comparison with the articles published in literature
| PV system/location/age | Nominal solar irradiance (kW h/m2 year) By NREL, USA. (A) | Useful solar irradiance to electricity (kW h/m2 year) (B) | Estimated output energy from the PV system by NREL, USA (C) | Measured output energy from the PV system (D) | Calculated output energy from the PV system (kW h/m2 year) (E) = D/Area | PR (%/m2.year) (F) = E/B | PR (%/year) (G) = D/C | Remarks |
|---|---|---|---|---|---|---|---|---|
| 5 kWp (50 Wp module) poly c-Si, 44 m2 area Dhaka, Bangladesh Eight (8) years aged | 1,887 | 283@15% of A | 6,993 kW h/year | 1,179 kW h/year |
|
= 27/283 | 17 | Yearly average (Mar-2021–Feb-2022) |
| 19 kW h/day | 6.9 kW h/day | = 10 | 36 | 14 March 2021 | ||||
| 2.1 kW h/day | 11 | 9 March 2021 | ||||||
| 122.4 kWp (360 Wp module) poly c-Si, 680 m2 Savar EPZ, Dhaka, Bangladesh Four (4) years aged | 340@18% of A | 171,364 kW h/year | 134,819 kW h/year |
|
= 198.3/340 | 79 | Yearly average (2022) | |
| 469.5 kW h/day | = 58 |
5 Conclusion
The PR of two PV systems installed in Dhaka, Bangladesh, over 12-month period is estimated. From the yearly analysis, the PR of the 5 kW PV system in site 1 is 17%, and the 122.4 kW system in site 2 is 79%. The yearly PR per square meter is 10% in site 1 and 58% in site 2. The capacity-to-area ratio in site 1 is 112.5 W/m2 and in site 2 is 180 W/m2. The PR is estimated by taking the NREL database as standard for the nominal solar radiation, useful electrical energy, and estimated output of the particular PV systems. Thus, this study shows a simplified procedure to evaluate the expected PR to the measured PR, which, in turn effective for the long-term monitoring and using the system efficiently. This will also reduce the gap between the installed capacities and to production of electrical energy from PV systems. It appears that for Bangladesh to achieve the SDG-7 and increase renewable energy share in the national electrical energy mix, large-scale cluster PV systems on the rooftop are more feasible in terms of maintenance, monitoring, and productivity.
Acknowledgments
The author would like to thank the Post Graduate Research Management and Technology Transfer Center, Bangabandhu Sheikh Mujibur Rahman Maritime University, Dhaka, Bangladesh, for the research facility.
-
Funding information: None declared.
-
Author contributions: The author contributed in the conceptualization, designing methodology, data collection, analysis, interpretation and editing. The author has also prepared all the figures, tables and images.
-
Conflict of interest: The author states no conflict of interest.
-
Research ethics: Not applicable.
-
Data availability statement: The raw data can be obtained on request from the corresponding author.
References
Abas N., Rauf S., Saleem M. S., Irfan M., and Hameed S. A. (2022). “Techno-economic feasibility analysis of 100 MW solar photovoltaic power plant in Pakistan,” Technol. Econ. Smart Grids Sustain. Energy, vol. 7, no. 1, p. 16. 10.1007/s40866-022-00139-w.Search in Google Scholar
Abdullah-Al-Mahbub Md. and Islam A. R. M. T. (2023). “Current status of running renewable energy in Bangladesh and future prospect: A global comparison,” Heliyon, vol. 9, no. 3, p. e14308. 10.1016/j.heliyon.2023.e14308.Search in Google Scholar PubMed PubMed Central
Al Mansur A., Amin M. R., Imamul Islam M. D., and Shihavuddin A. S. M. (2023). “Electrical data of 10 W, 40 W, 80 W, and 250 W photovoltaic modules under the aging condition: Tested by a solar manufacturer company in Bangladesh,” Data Brief., vol. 47, no. April, p. 108989. 10.1016/j.dib.2023.108989.Search in Google Scholar PubMed PubMed Central
Alashqar M., Xue Y., Yang C., and Zhang X.-P. (2022). “Comprehensive economic analysis of PV farm -A case study of Alkarsaah PV farm in Qatar,” Front. Energy Res., vol. 10, pp. 1–17. 10.3389/fenrg.2022.987773.Search in Google Scholar
Alazazmeh A., Ahmed A., Siddiqui M., and Asif M. (2022). “Real-time data-based performance analysis of a large-scale building applied PV system,” Energy Rep., vol. 8, no. November, pp. 15408–15420. 10.1016/j.egyr.2022.11.057.Search in Google Scholar
Anang N., Syd Nur Azman S. N. A., Muda W. M. W., Dagang A. N., and Daud M. Z. (2021). “Performance analysis of a grid-connected rooftop solar PV system in Kuala Terengganu, Malaysia,” Energy Build., vol. 248, no. October, p. 111182. 10.1016/j.enbuild.2021.111182.Search in Google Scholar
Asadpour R., Patel M. T., Clark S., Bosco N., Silverman T. J., and Alam M. A. (2022). “Worldwide physics-based lifetime prediction of c-Si modules due to solder-bond failure,” IEEE J. Photovolt., vol. 12, no. 2, pp. 533–539. 10.1109/JPHOTOV.2021.3136164.Search in Google Scholar
Aziz Y., Janjua A. K., Hassan M., Anwar M., Kanwal S., and Yousif M. (2023). “Techno-economic analysis of PV systems installed by using innovative strategies for smart sustainable agriculture farms,” Environ Dev. Sustain, vol. 26, pp. 5003–5024. 10.1007/s10668-023-02919-5.Search in Google Scholar PubMed PubMed Central
Babu Md. T., Nei H., and Kowser Md. A. (2022). “Prospects and necessity of wind energy in Bangladesh for the forthcoming future,” J. Inst. Eng. (India): Ser. C., vol. 103, no. 4, pp. 913–929. 10.1007/s40032-022-00834-8.Search in Google Scholar
Dhimish M. and Tyrrell A. M. (2022). “Power loss and hotspot analysis for photovoltaic modules affected by potential induced degradation,” NPJ Mater. Degrad., vol. 6, no. 1, pp. 1–8. 10.1038/s41529-022-00221-9.Search in Google Scholar
Global Solar Atlas. (2023). Accessed July 21, 2023. https://globalsolaratlas.info/global-pv-potential-study.Search in Google Scholar
Hossion A., Kumar N. M., Bajaj M., Alrashed M. M., Elnaggar M. F., and Kamel S. (2023). “Analysis of various degradations of five years aged mono C-Si, Poly c-Si, and thin-film photovoltaic modules from rooftop solar installations in Dhaka’s tropical wet and dry climate conditions,” Front. Energy Res., vol. 11, pp. 1–9. 10.3389/fenrg.2023.996176.Search in Google Scholar
Hossion M. A. (2020). “Visual and electrical degradation data of five years aged rooftop photovoltaic modules,” Data Brief., vol. 31, no. August, p. 105762. 10.1016/j.dib.2020.105762.Search in Google Scholar PubMed PubMed Central
Jamil I., Lucheng H., Habib S., Aurangzeb M., Ahmed E. M., and Jamil R. (2023). “Performance evaluation of solar power plants for excess energy based on energy production,” Energy Rep., vol. 9, no. December, pp. 1501–1534. 10.1016/j.egyr.2022.12.081.Search in Google Scholar
Jamil I., Zhao J., Zhang L., Jamil R., and Rafique S. F. (2017). “Evaluation of energy production and energy yield assessment based on feasibility, design, and execution of 3 × 50 MW grid-connected solar PV pilot project in Nooriabad,” Int. J. Photoenergy, vol. 2017, no. November, p. e6429581. 10.1155/2017/6429581.Search in Google Scholar
Jed M. E. H., Logerais P.-O., Malye C., Riou O., Delaleux F., and El Bah M. (2021). “Analysis of the performance of the photovoltaic power plant of Sourdun (France),” Int. J. Sustain. Eng., vol. 14, no. 6, pp. 1756–1768. 10.1080/19397038.2021.1971321.Search in Google Scholar
Joshi S., Mittal S., Holloway P., Shukla P. R., Gallachóir B. Ó., and Glynn J. (2021). “High resolution global spatiotemporal assessment of rooftop solar photovoltaics potential for renewable electricity generation,” Nat. Commun., vol. 12, no. 1, p. 5738. 10.1038/s41467-021-25720-2.Search in Google Scholar PubMed PubMed Central
Khalid A. M., Mitra I., Warmuth W., and Schacht V. (2016). “Performance ratio – Crucial parameter for grid connected PV Plants,” Renew. Sustain. Energy Rev., vol. 65, no. November, pp. 1139–1158. 10.1016/j.rser.2016.07.066.Search in Google Scholar
Khan A. A. and Minai A. F. (2023). “A strategic review: The role of commercially available tools for planning, modelling, optimization, and performance measurement of photovoltaic systems,” Energy Harvesting Syst, vol. 11, no. 1, p. 20220157. 10.1515/ehs-2022-0157.Search in Google Scholar
Navothna B. and Thotakura S. (2022). “Analysis on large-scale solar PV plant energy performance–loss–degradation in coastal climates of India,” Front. Energy Res., vol. 10, pp. 1–9. 10.3389/fenrg.2022.857948.Search in Google Scholar
Pascual J., Martinez-Moreno F., García M., Marcos J., Marroyo L., and Lorenzo E. (2021). “Long-term degradation rate of crystalline silicon PV modules at commercial PV plants: An 82-MWp assessment over 10 years,” Prog. Photovoltaics: Res. Appl., vol. 29, no. 12, pp. 1294–1302. 10.1002/pip.3456.Search in Google Scholar
PVWatts Calculator. (2023). Accessed July 21, 2023. https://pvwatts.nrel.gov/pvwatts.php.Search in Google Scholar
RE Generation Mix|National Database of Renewable Energy. (2023). 2023. http://www.renewableenergy.gov.bd/index.php.Search in Google Scholar
Renewable Energy by Country 2023. (n.d.). Wisevoter. 2023. Accessed July 19, 2023. https://wisevoter.com/country-rankings/renewable-energy-by-country/.Search in Google Scholar
Schardt J. and te Heesen H. (2021). “Performance of roof-top PV systems in selected European countries from 2012 to 2019,” Sol. Energy, vol. 217, no. March, pp. 235–244. 10.1016/j.solener.2021.02.001.Search in Google Scholar
Sharma R. and Goel S. (2017). “Performance analysis of a 11.2 KWp roof top grid-connected PV system in Eastern India,” Energy Rep., vol. 3, no. November, pp. 76–84. 10.1016/j.egyr.2017.05.001.Search in Google Scholar
Singh R., Young Nam A., Park J. J., and Kim Y. I. (2023). “Analysis of in situ performance of rooftop PV system in Seoul, South Korea,” Int. J. Air-Cond. Refrig., vol. 31, no. 1, p. 10. 10.1007/s44189-023-00026-8.Search in Google Scholar
Singh S., Alharthi M., Anand A., Shukla A., Sharma A., and Panchal H. (2022). “Performance evaluation and financial viability analysis of grid associated 10 MWP solar photovoltaic power plant at UP India,” Sci. Rep., vol. 12, no. 1, p. 22380. 10.1038/s41598-022-26817-4.Search in Google Scholar PubMed PubMed Central
Sun X., Chavali R. V. K., and Alam M. A. (2019). “Real-time monitoring and diagnosis of photovoltaic system degradation only using maximum power point—the Suns-Vmp method,” Prog. Photovoltaics: Res. Appl., vol. 27, no. 1, pp. 55–66. 10.1002/pip.3043.Search in Google Scholar
Syahindra, K. D., Ma’arif, S., Widayat, A. A., Fauzi, A. F., Setiawan, E. A. (2021). Solar PV system performance ratio evaluation for electric vehicles charging stations in transit oriented development (TOD) areas, in E3S Web of Conferences, Malik, O. P., editor, vol. 231, p. 02002. 10.1051/e3sconf/202123102002.Search in Google Scholar
Tachev V. (2022). “Solar and wind power potential in Bangladesh 2022,” Energy Tracker Asia (blog), May 12, 2022. https://energytracker.asia/solar-and-wind-power-potential-in-bangladesh/.Search in Google Scholar
Talut M., Bahaj A. S., and James P. (2022). “Solar power potential from industrial buildings and impact on electricity supply in Bangladesh,” Energies, vol. 15, no. 11, p. 4037. 10.3390/en15114037.Search in Google Scholar
Wiatros-Motyka M. (2023). Global electricity review 2023. Ember. 2023. April 11, 2023. https://ember-climate.org/insights/research/global-electricity-review-2023/.Search in Google Scholar
Yadav S. K. and Bajpai U. (2018). “Performance evaluation of a rooftop solar photovoltaic power plant in Northern India,” Energy Sustain. Dev., vol. 43, no. April, pp. 130–138. 10.1016/j.esd.2018.01.006.Search in Google Scholar
Yadav S. K. and Bajpai U. (2020). “Energy, economic and environmental performance of a solar rooftop photovoltaic system in India,” Int. J. Sustain. Energy, vol. 39, no. 1, pp. 51–66. 10.1080/14786451.2019.1641499.Search in Google Scholar
© 2024 the author(s), published by De Gruyter
This work is licensed under the Creative Commons Attribution 4.0 International License.
Articles in the same Issue
- Solar photovoltaic-integrated energy storage system with a power electronic interface for operating a brushless DC drive-coupled agricultural load
- Analysis of 1-year energy data of a 5 kW and a 122 kW rooftop photovoltaic installation in Dhaka
- Reviews
- Real yields and PVSYST simulations: comparative analysis based on four photovoltaic installations at Ibn Tofail University
- A comprehensive approach of evolving electric vehicles (EVs) to attribute “green self-generation” – a review
- Exploring the piezoelectric porous polymers for energy harvesting: a review
- A strategic review: the role of commercially available tools for planning, modelling, optimization, and performance measurement of photovoltaic systems
- Comparative assessment of high gain boost converters for renewable energy sources and electrical vehicle applications
- A review of green hydrogen production based on solar energy; techniques and methods
- A review of green hydrogen production by renewable resources
- A review of hydrogen production from bio-energy, technologies and assessments
- A systematic review of recent developments in IoT-based demand side management for PV power generation
- Research Articles
- Hybrid optimization strategy for water cooling system: enhancement of photovoltaic panels performance
- Solar energy harvesting-based built-in backpack charger
- A power source for E-devices based on green energy
- Theoretical and experimental investigation of electricity generation through footstep tiles
- Experimental investigations on heat transfer enhancement in a double pipe heat exchanger using hybrid nanofluids
- Comparative energy and exergy analysis of a CPV/T system based on linear Fresnel reflectors
- Investigating the effect of green composite back sheet materials on solar panel output voltage harvesting for better sustainable energy performance
- Electrical and thermal modeling of battery cell grouping for analyzing battery pack efficiency and temperature
- Intelligent techno-economical optimization with demand side management in microgrid using improved sandpiper optimization algorithm
- Investigation of KAPTON–PDMS triboelectric nanogenerator considering the edge-effect capacitor
- Design of a novel hybrid soft computing model for passive components selection in multiple load Zeta converter topologies of solar PV energy system
- A novel mechatronic absorber of vibration energy in the chimney
- An IoT-based intelligent smart energy monitoring system for solar PV power generation
- Large-scale green hydrogen production using alkaline water electrolysis based on seasonal solar radiation
- Evaluation of performances in DI Diesel engine with different split injection timings
- Optimized power flow management based on Harris Hawks optimization for an islanded DC microgrid
- Experimental investigation of heat transfer characteristics for a shell and tube heat exchanger
- Fuzzy induced controller for optimal power quality improvement with PVA connected UPQC
- Impact of using a predictive neural network of multi-term zenith angle function on energy management of solar-harvesting sensor nodes
- An analytical study of wireless power transmission system with metamaterials
- Hydrogen energy horizon: balancing opportunities and challenges
- Development of renewable energy-based power system for the irrigation support: case studies
- Maximum power point tracking techniques using improved incremental conductance and particle swarm optimizer for solar power generation systems
- Experimental and numerical study on energy harvesting performance thermoelectric generator applied to a screw compressor
- Study on the effectiveness of a solar cell with a holographic concentrator
- Non-transient optimum design of nonlinear electromagnetic vibration-based energy harvester using homotopy perturbation method
- Industrial gas turbine performance prediction and improvement – a case study
- An electric-field high energy harvester from medium or high voltage power line with parallel line
- FPGA based telecommand system for balloon-borne scientific payloads
- Improved design of advanced controller for a step up converter used in photovoltaic system
- Techno-economic assessment of battery storage with photovoltaics for maximum self-consumption
- Analysis of 1-year energy data of a 5 kW and a 122 kW rooftop photovoltaic installation in Dhaka
- Shading impact on the electricity generated by a photovoltaic installation using “Solar Shadow-Mask”
- Investigations on the performance of bottle blade overshot water wheel in very low head resources for pico hydropower
- Solar photovoltaic-integrated energy storage system with a power electronic interface for operating a brushless DC drive-coupled agricultural load
- Numerical investigation of smart material-based structures for vibration energy-harvesting applications
- A system-level study of indoor light energy harvesting integrating commercially available power management circuitry
- Enhancing the wireless power transfer system performance and output voltage of electric scooters
- Harvesting energy from a soldier's gait using the piezoelectric effect
- Study of technical means for heat generation, its application, flow control, and conversion of other types of energy into thermal energy
- Theoretical analysis of piezoceramic ultrasonic energy harvester applicable in biomedical implanted devices
- Corrigendum
- Corrigendum to: A numerical investigation of optimum angles for solar energy receivers in the eastern part of Algeria
- Special Issue: Recent Trends in Renewable Energy Conversion and Storage Materials for Hybrid Transportation Systems
- Typical fault prediction method for wind turbines based on an improved stacked autoencoder network
- Power data integrity verification method based on chameleon authentication tree algorithm and missing tendency value
- Fault diagnosis of automobile drive based on a novel deep neural network
- Research on the development and intelligent application of power environmental protection platform based on big data
- Diffusion induced thermal effect and stress in layered Li(Ni0.6Mn0.2Co0.2)O2 cathode materials for button lithium-ion battery electrode plates
- Improving power plant technology to increase energy efficiency of autonomous consumers using geothermal sources
- Energy-saving analysis of desalination equipment based on a machine-learning sequence modeling