Research on the development and intelligent application of power environmental protection platform based on big data
-
Dan Shao


Abstract
In order to improve the practical effect of the power environmental protection platform, this paper combines the big data technology to develop and design the power environmental protection platform. In this paper, a power factor correction (PFC) and resonant half-bridge joint controller is used to combine the traditional two-level topology into one-level topology. Moreover, this paper adopts a fixed frequency half-bridge LLC resonant converter with a simple control circuit to obtain a stable resonant half-bridge controller with a fixed output voltage. The choice of this overall power topology architecture can not only meet the design requirements, save costs and simplify the control of the circuit, but also improve the efficiency of the whole machine and the performance of the power environmental protection platform. The experimental research shows that the power environmental protection platform based on big data proposed in this paper can effectively improve the effectiveness of power environmental protection strategies.
1 Introduction
Big data analysis is a new method worthy of exploration and practice by mining historical data to find the relatively optimal data under specific working conditions, and comparing real-time working conditions to provide reference for operation. The Distributed Control System (DCS) system and Metal-Insulator-Semiconductor (MIS)/Semiconductor-Insulator-Semi-conductor (SIS/MIS) system of thermal power plants have accumulated a large amount of historical data, which provides conditions for the application of big data analysis. The power environmental protection big data platform focuses on the operation and management of thermal power plant environmental protection facilities, and tries to solve problems such as operation optimization, fault diagnosis, online retrieval and question answering of business knowledge through big data analysis technology (Alavi et al. 2018).
When developing the power and environmental protection big data platform, in order to ensure the comprehensiveness of the data, it is necessary to establish a special database, and use information technology to complete the automatic collection and classification of data, so as to provide information for subsequent data use work, basic guarantee. A specialized database is important because it centralizes data storage, improves data quality, facilitates data analysis, enhances data security, and increases efficiency. It helps organizations make informed decisions based on accurate and complete information, leading to improved business outcomes. In the development and construction of the database platform, it is necessary to increase the investment in capital and technology, and introduce professional system software (Alghamdi and Cañizares 2020). Remote data acquisition and monitoring system is a relatively common data collection system. In the specific development work, technicians need to build a complete data source for the big data platform from multiple links such as information collection, information storage, and information classification, which is the basic premise to ensure the orderly operation of power environmental protection work (Ananduta et al. 2020).
The development of a big data platform needs to be constructed from multiple links such as server selection, management structure layer construction, data storage, and transmission process. First of all, technicians need to master the basic process of power generation in thermal power plants, and analyze from the use of coal resources, energy conversion, gas pollution in the combustion process, power consumption and wear in equipment operation, etc. Clarify the development goals of electric power environmental protection work (Daneshvar et al. 2020). Generally speaking, the distributed computing environment consists of the hadoop platform; the intelligent analysis application system consists of a series of application function modules. The actual use functions of different modules are different, and the processing methods and precautions in the development process will also be different. This is the attention of the platform development work, which has high requirements on the technical personnel’s operation ability and work quality. Based on this, thermal power plants should also actively carry out quality education and training of professional knowledge and skills in the actual process of platform optimization construction (Du and Li 2019). Thermal power plants utilize information technology to improve efficiency by implementing automated workflows and intelligent control of equipment. Intelligent control involves using advanced technologies like AI and machine learning to optimize equipment performance in real-time, leading to cost savings and greater energy efficiency. By using data analytics and other technologies, thermal power plants can identify opportunities for further optimization and improvement, resulting in increased efficiency and cost savings.
The purpose of developing the big data platform is to comprehensively analyze the real data information, formulate scientific and reasonable electric power environmental protection work plans, solve the existing actual pollution problems, and promote the sustainable development of thermal power plants. This is also the urban environmental protection construction work in the new era. basic needs (Khan et al. 2019).
Most of the power plants take economic benefits as the basic work goal, and this involves the reasonable conversion of electric energy. Most power plants arrange economic benefits to maximize profits or minimize expenditures. To involve the reasonable conversion of electric energy, power plants can increase efficiency through technologies such as combined cycle power plants and high-voltage direct current (HVDC) transmission systems. Renewable energy sources like solar and wind power can also be harnessed and converted with relatively high efficiency. Energy storage systems like batteries can further facilitate efficient utilization. By implementing these measures, power plants can achieve their economic goals while reducing environmental impact and promoting sustainability. Thermal power plants generate electricity by burning coal. How to fully convert the heat generated by the combustion of coal resources into electricity to achieve the basic goal of power supply is the primary problem that technicians need to solve. When using the power and environmental protection big data platform to carry out analysis work, technicians can analyze the conversion efficiency of different coal resources. The market price of these coal resources should be compared, and the coal with the quality that meets the conversion needs and the economic cost is relatively low should be selected for power generation (Li, Wang, and Yang 2021).
The pollution problem is mainly due to the diffusion of soot particles from coal combustion into the air. Usually, thermal power plants will set up desulfurization and denitration equipment in their internal power generation devices. Because this work flow is relatively complicated and cumbersome, the work difficulty is relatively high. Therefore, thermal power plants realize the application advantages of information technology, and begin to study how to complete the intelligent control of equipment by setting automated workflow. When using the big data platform to carry out desulfurization work, it is necessary to synthesize the data of the sulfur dioxide gas generated in the past power generation links to analyze the source of the polluted gas. Then sum up the work experience and study the key methods of scientifically controlling the gas production (Lin et al. 2019).
The application advantage of information technology is that it can reduce the management pressure of staff and reduce the difficulty of equipment operation. Due to the large demand for electricity in cities, thermal power plants usually require uninterrupted operation when generating electricity. How to ensure the stable operation of equipment and avoid potential safety hazards is the basic problem that thermal power plants need to pay attention to. This involves the application of the power environmental protection big data platform. From the perspective of equipment operation, induction devices should be installed, and information technology means should be used to collect and count operational data in a timely manner (Liu et al. 2021). Analyzing whether the use function of the equipment meets the basic needs of power generation work and doing a good job in safe operation management are the key links in the intelligent use of big data platforms to carry out power environmental protection work. At the same time, security management also includes the management of platform data information. This involves establishing a platform security management mechanism, setting up a defense system and other aspects to comprehensively ensure the smooth development of various tasks (Mardani et al. 2018).
The main cause of power generation pollution is the smoke and dust generated by coal combustion. To solve this problem, the heat conversion efficiency of different coal resources should be actively collected and sorted in the database. Determine the practical application value of different types of coal, and then study the feasible methods of desulfurization and denitrification from the perspective of equipment optimization, so as to achieve the ultimate goal of pollution control. In this process, thermal power plants need to pay attention to the actual operation of the equipment and the security management of information, so as to give full play to the basic application value of the big data platform (Pippia, Sijs, and De Schutter 2019).
The power environmental protection big data platform is a multi-functional integrated platform, which is mainly composed of three parts, including the data acquisition system, the artificial intelligence analysis application system and the distributed computer environment (Shan et al. 2019).
The power environmental protection big data platform has corresponding uniformity. Through the corresponding standardized processing and cleaning of all collected data, the uniformity of the collected environmental protection data is further realized, so as to ensure the high reliability of the data and provide the future power The development of environmental protection big data platform provides an effective guarantee and forms a once and for all situation. The power and environmental protection big data platform has high availability. The development of the power and environmental protection big data platform further provides guarantees for different service groups in terms of composition structure, multiple structures and high-availability software, ensuring that the platform can run uninterruptedly. The failure of any computing node will not affect the operation of the overall platform, and no matter which storage device in the platform is damaged during the operation, it will not cause the loss of user data (Shuai et al. 2018). The power and environmental protection big data platform has strong scalability. Nowadays, with the in-depth development of the information age, the business scale is also expanding. The big data cluster can complete the horizontal expansion of information only through a few servers, and does not need to carry out corresponding originals. The replacement of hardware or software can truly realize flexible expansion, reduce the risk of early investment of enterprises, and guarantee the investment goals of enterprises (Utkarsh et al. 2018). The power and environmental protection big data platform has great openness. The platform can process and analyze any structured or unstructured data, so as to provide corresponding containers for diverse modular applications and accept unified mobilization. Third-party applications provide more convenient and flexible Application Programming Interface (API) interfaces (Vergara et al. 2018).
The failure to timely and effectively monitor the existing faults in the power supply will cause huge losses to the power as a whole, so it is necessary to ensure the stability of the power supply. It is very important to perform corresponding health checks on the power equipment in operation in real time, so as to issue early warnings to some equipment with hidden dangers, and to issue alarms to equipment with problems, further output equipment health data reports, and also It can provide guarantee for the safe operation of the equipment (Zhang et al. 2018). Power companies have also taken corresponding measures to ensure the safety of power equipment operation, but they have not achieved the desired effect. With the continuous development of the power field, there are still many deficiencies. Some deficiencies are supplemented and solved with accurate and effective data by introducing the development of the electric power environmental protection big data platform, and by effectively recording the parameters of the operation of the detection equipment in real time, and observing whether it is within the normal range, so as to diagnose the fault (Zhao et al. 2018).
The two-level topology and one-level topology are two approaches to controlling power transistors in PFC and resonant half-bridge joint controller circuits. The one-level topology uses a single switch to control the flow of power, while the two-level topology uses two switches for more precise control. While the one-level topology is less complex and cheaper, it may result in higher switching losses and lower efficiency. In contrast, the two-level topology offers greater efficiency and lower losses, but is more complex and expensive.
This paper combines the big data technology to develop and design the power environmental protection platform, analyze its intelligent application effect, and promote the application effect of the power environmental protection platform.
2 Power and environmental protection data processing
2.1 EMI circuit design and simulation
When the power of the driving power supply is higher than 25 W, the Electromagnetic Compatibility (EMC) standard mandates that the driving power supply must meet the requirements for electromagnetic compatibility in the relevant provisions of the standard. Conducted electromagnetic interference (EMI) in electromagnetic compatibility is one of them. Electromagnetic interference (EMI) is an undesired disturbance that affects an electrical circuit or path due to external sources, also known as radio frequency interference. EMI can result in poor performance, malfunction or complete failure of electronic devices. Both natural and human-made sources can cause EMI. When a metal wire is exposed to magnetic fields, it induces an electric current along the wire, which may interfere with network signals and potentially lead to network shutdown. An EMI filter is used in electronic circuits to reduce the amount of electromagnetic interference or noise that can affect the performance of the circuit. The filter is designed to block or attenuate unwanted noise by using a combination of inductors, capacitors, and resistors arranged in a specific configuration. It can be placed at the input or output of a device or circuit to improve the electromagnetic compatibility (EMC) of electronic devices. The EMI filter adopts a scheme of combining common mode (CM) inductors and differential mode (DM) inductors, and uses the leakage inductance of a common mode suppressing inductor to form a differential mode suppressing inductor, as shown in Figure 1. Common mode (CM) inductors and differential mode (DM) inductors are two types of inductors used in electronic circuits to filter out unwanted signals or noise. CM inductors are designed to block or attenuate noise that appears identically on both signal lines, while DM inductors attenuate noise that appears as a difference between the two signal lines. This structure saves the number of magnetic components, can meet the design requirements, and is cost-effective and easy to popularize. In Figure 1, L1a and L1b are the two coils of the common mode inductor, which are used to form a common mode filter, and L1a′ and L1b′ are the leakage inductances of the common mode inductor coil, which are used to form a differential mode filter. Differential mode filter and common mode filter are used in electronic circuits to filter out unwanted signals or noise. Differential mode filter attenuates noise that appears as a difference between two signal lines, while common mode filter attenuates noise that appears identically on both signal lines. The filters are designed using various components and configurations depending on the circuit’s specific application and requirements.
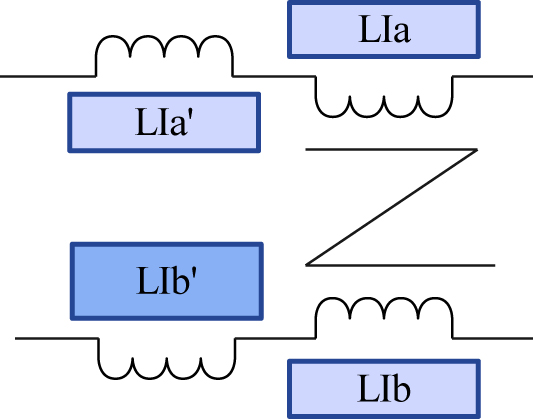
Combined filter inductor of common mode and differential mode.
The slope of the inductor current waveform shown in Figure 2 is the current change rate di/dt. The change of the current will generate a changing magnetic field, which radiates outward. The larger the current change rate, the stronger the magnetic field and the more serious the electromagnetic radiation interference.
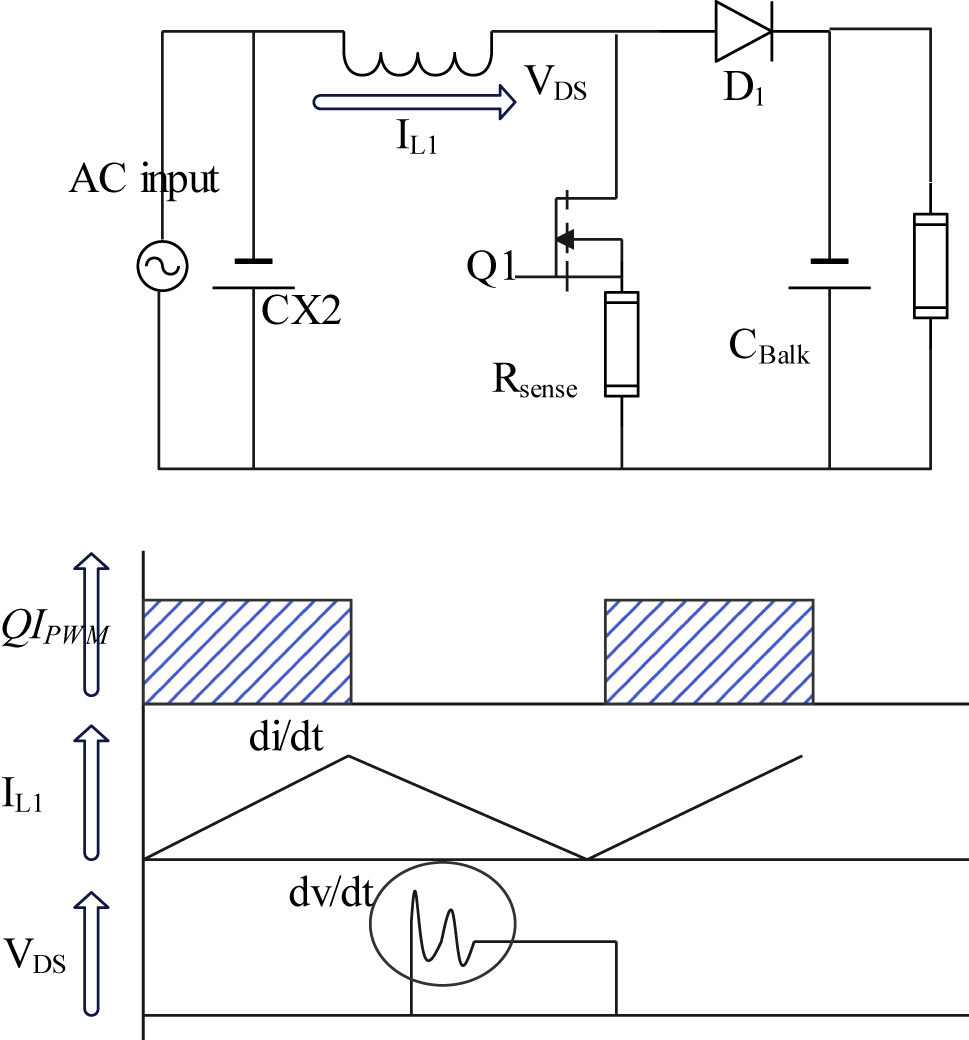
PFC circuit and waveforms.
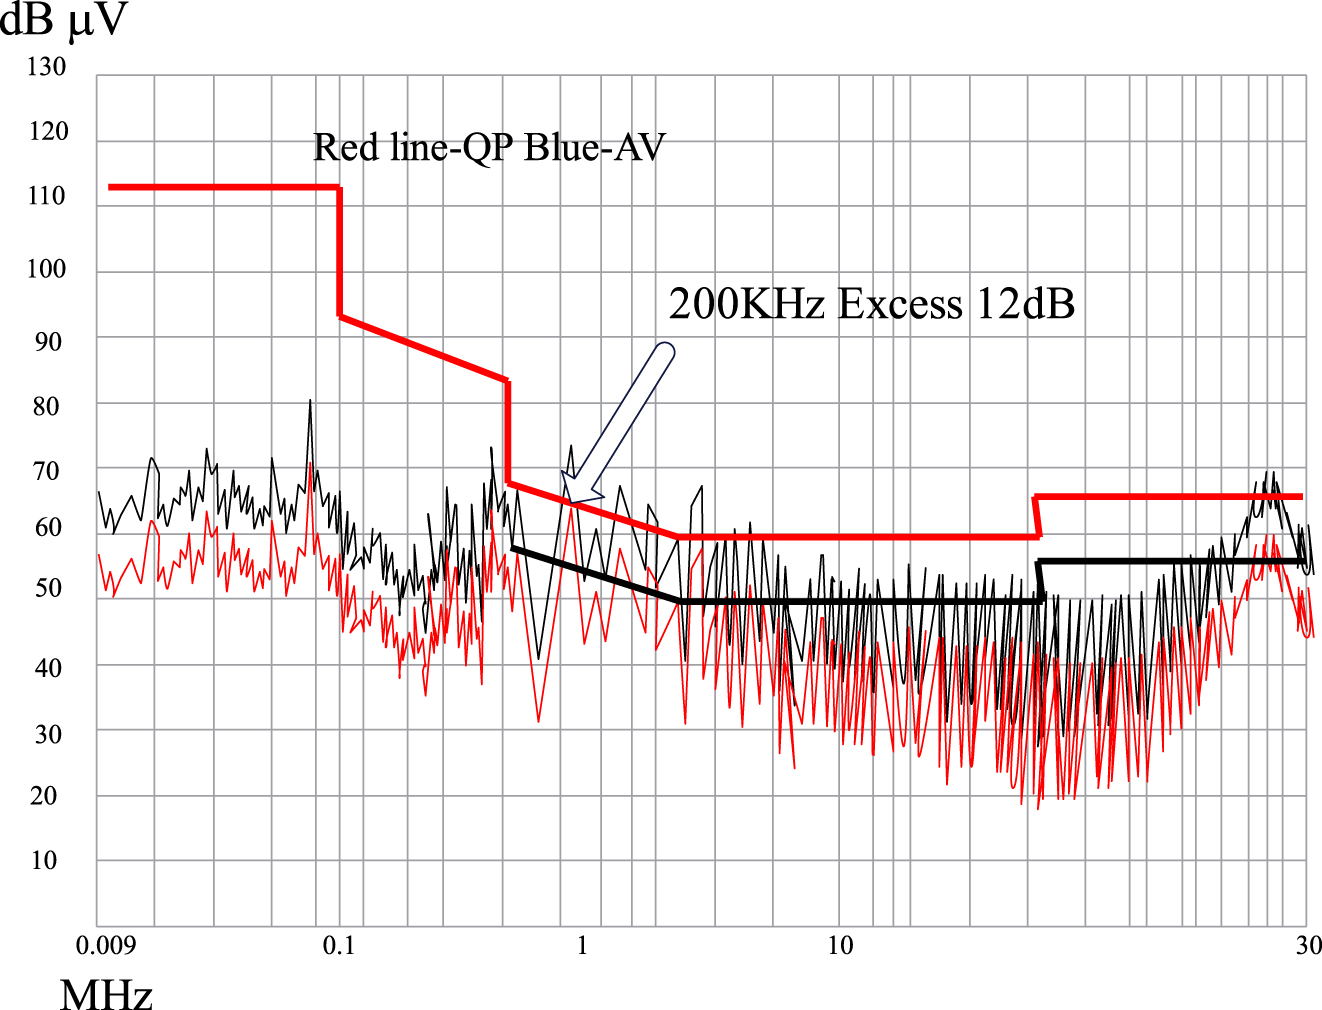
Figure 3 is the EMI conduction test result of EN55015 standard of Light-emitting diode (LED) power test without EMI Filter. From the test results, considering the 10 dB margin, the EMI filter needs to attenuate 22 dB at 200 KHz to meet the design requirements.
EMI test results without EMI filter.
According to the table, the input impedance of the power supply can be calculated as:
The operating frequency of the PFC in the LED drive power supply is 70 KHz, the operating frequency of the resonant half-bridge is 35 KHz, and the corner frequency of the EMI Filter needs to be greater than 10 times the input AC frequency. According to the analysis of the above test results, 22 dB attenuation is required at 200 KHz.
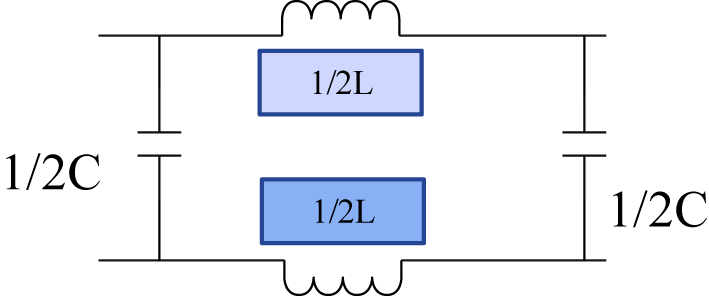
Figure 4 is an effective circuit of a designed common mode filter.
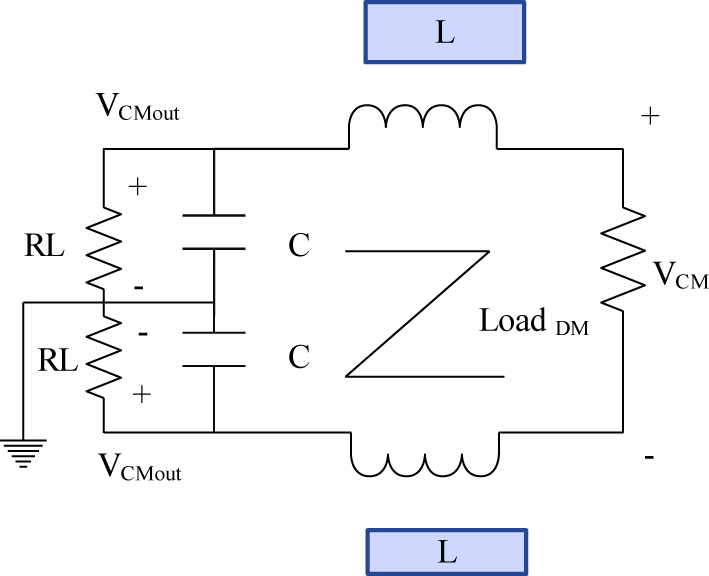
Equivalent circuit diagram of the second-order common mode filter.
The transfer function of this filter is:
Among them,
The size of the
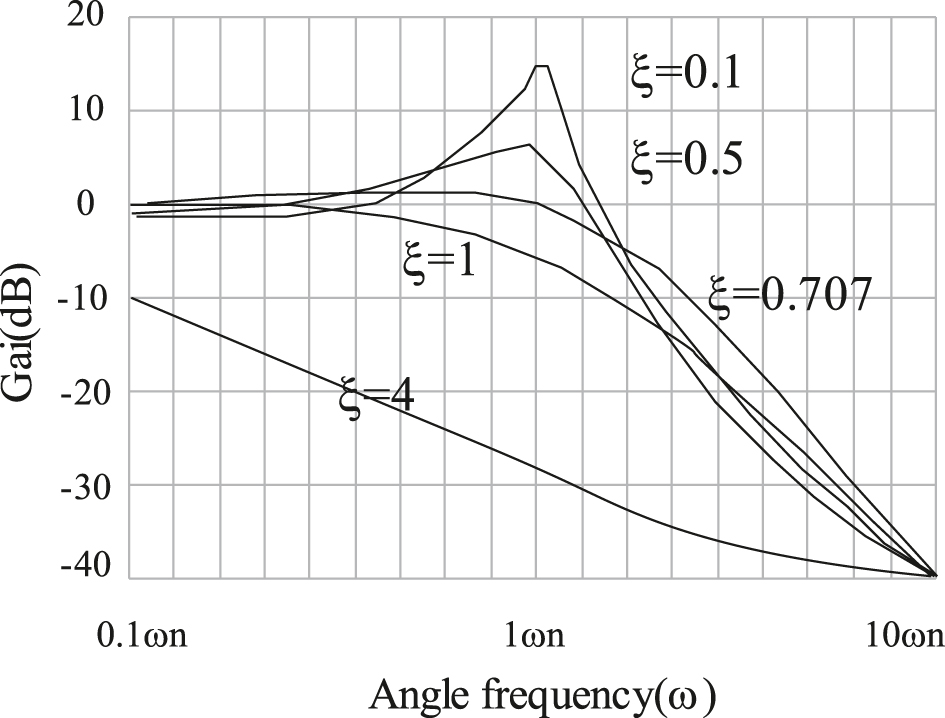
Second-order frequency response of different damping coefficients.
Therefore, the design goal of needing to attenuate
The maximum Y capacitance value specified by the
The designed differential mode filter is a
Equivalent circuit diagram of the third-order differential mode filter.
Therefore, the design target of 22 dB attenuation at 200 KHz requires that the corner frequency
The inductance value calculated according to equation (5) is
The capacitance value calculated according to equation (6) is
According to the calculation results of equations (5) and (6), it is reasonable to choose the value of DM Choke as
Combined with the design results of the previous two sections, the schematic diagram of the complete EMI filter circuit is obtained as shown in Figure 7.
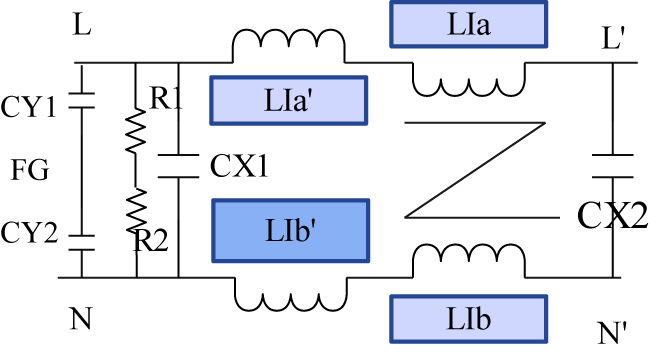
Complete EMI filter circuit diagram.
Among them, L1a and L1b are the two windings of the CMChoke, with a minimum inductance of 1.2 mH, L1a′ and L1b′ are the leakage inductance of the CMChoke, and the minimum inductance is 150 µH. CMChoke chooses ferrite EE20 core, double slot skeleton. The Y capacitors CY1 and CY2 are both 6.8 nF, and the X capacitors CX1 and CX2 are both 0.1 µF. The special feature of this circuit is that the leakage inductance of the CMChoke is used to provide the differential mode inductance required by the DMFilter, which reduces the use of magnetic materials and costs.
2.2 Design and calculation of CRMPFC circuit parameters
PFC output capacitors can be used in series with two 300 Vdc or 400 Vdc withstand voltages, and use two identical resistors in series to achieve equal voltages on each capacitor.
The realization of PFC voltage and overvoltage protection. The resistor divider network composed of PFB pin and R5, R6 is used to realize the PFC overvoltage alarm protection function. When the maximum PFC voltage is set to 430 Vdc, it is required to turn off the PFC drive signal when the PFC output voltage is higher than 430 V. The maximum PFC voltage of 430 Vdc can be estimated by checking the specifications of the PFC circuit or device being used. If the PFC output voltage exceeds this limit, it can result in damage to the PFC circuit or other system components, pose a safety hazard, and cause overvoltage stress leading to insulation breakdown and other failures. Hence, it is crucial to ensure that the PFC output voltage does not surpass the manufacturer’s maximum voltage rating or specified limit. This only requires selecting the resistance values of R5 and R6 according to equation (7).
According to equation (7) and the current driving capability of the PFB pin, the selected R5 is 5.4 MΩ and R6 is 31.5 KΩ to meet the requirements.
Design of PFCBULK capacitor. PFCBULK capacitors improve power factor, reduce harmonic distortion, enhance voltage regulation, and increase equipment lifespan in electrical systems. Their importance lies in improving system efficiency and reliability, resulting in cost savings and other benefits. The selection of the PFCBULK capacitor needs to meet the requirements of the ripple voltage and the withstand voltage of the BULK capacitor needs to be higher than the maximum BoostPFC voltage and half the ripple voltage. The ripple voltage in a circuit that employs a capacitor to filter out AC noise from a DC power source varies inversely with the capacitor’s value. Therefore, increasing the capacitance of the capacitor decreases the ripple voltage, while decreasing the capacitance increases the ripple voltage. This relationship is crucial when designing circuits that need steady DC power supplies. Typically, a 1 µF PFCBULK capacitor is chosen for 1WPFC output power. Therefore, it is reasonable to select two 400 V capacitors with a withstand voltage of 150 µF in series for this design of 60 W power supply, that is, the capacitance after the series is an equivalent capacitor of 75 µF, and then calculate the ripple voltage according to equation (8) as follows:
Among them, f is 50 Hz. The ripple calculated by equation (8) is the low-frequency ripple, because the ripple caused by the high-frequency switching frequency is negligible compared to the low-frequency ripple. According to equation (8), the ripple value can be obtained [5.9 V, 6.8 V], corresponding to the PFC output voltage [375 V, 430 V]. This value is the acceptable ripple range. Therefore, the choice of two 400 V, 150 µF capacitors in series can meet the design requirements.
Design and selection of PFCMOSFET and diode.
A PFCMOSFET (Power Factor Correction Metal-Oxide-Semiconductor Field-Effect Transistor) is an MOSFET specifically designed for use in power factor correction circuits. Design considerations include high voltage rating, low on-resistance, fast switching speed, and low gate charge. Selection factors include voltage and current ratings, switching frequency, and on-resistance among others. Selecting the appropriate PFCMOSFET is critical to achieve efficient and reliable power factor correction. The ultra-fast recovery diode MURS360 times of 600V3A can be selected to meet the design requirements.
Design of PFC inductor
The peak current of the PFC inductor at the minimum input voltage is calculated as 2.35 A according to equation (10), and the mean current can be calculated as
The design calculation of the PFC inductor is calculated according to the specification parameters in the table and equation (12). Among them, the minimum switching frequency is selected as
In order to make the PFC controller work in the verified frequency range, it is more reasonable to choose the inductance as 650 μH–700 μH. To protect a PFC controller operates in a verified frequency range, it is crucial to select the right inductance value for the PFC inductor. An inductance value in the range of 650 μH–700 μH is often the most reasonable choice since it provides a resonant frequency that matches the switching frequency of many PFC controllers, reduces ripple current, and minimizes the inductor size. However, the selection of the specific inductance value should depend on the application requirements, input voltage, output power, and component selection. It is advisable to refer to the PFC controller datasheet or consult an experienced engineer for the optimal inductance value. According to the selected maximum and minimum inductance and equation (13) to calculate the switching frequency operating range, the operating frequency range of the PFC controller can be obtained between the minimum
In order to provide the auxiliary voltage between all the way
In the known conditions,
To prevent core saturation, the core must be air-gapped according to equation (15). The calculated air gap length is
In summary, the PFC inductor design can be summed up as follows:
The 63.5WCRMPFC inductor core type under 70 KHz is ferrite PQ-2020, the material is PC40, the inductance is 650 μH–700 μH, and the skeleton type is
In the LLC resonant converter, the resonant tank element inductor L R and capacitor C R are connected in series with the primary side of the transformer, while the resonant inductor L M is connected in parallel with the primary side of the transformer, as shown in Figure 8a. The LLC resonant converter is a type of resonant converter used in power electronics, often with a transformer and a magnetizing inductance (L m ). The converter operates by switching the input voltage across a resonant circuit of L s and C s . During the on-time of the switch, the magnetizing inductance (L m ) limits the rate of change of current and during the off-time, it limits the rate of change of voltage. The L m acts as a buffer between the primary and secondary sides of the transformer, enabling efficient power transfer and controlling the current and voltage stresses. The LLC resonant converter uses the transformer magnetizing inductance to generate another resonant frequency, which is much lower than the main resonant frequency generated by the resonant tank elements L R and C R . LLC resonant converters are designed to operate at switching frequencies much higher than the resonant frequency of the resonant tank composed of L R and C R . The LLC converter is a DC/DC converter with soft-switching capabilities that is based on a resonant circuit. With zero-voltage switching, the LLC resonant circuit lowers switching loss (ZVS). Unlike the SLR converter, the LLC converter can maintain a constant output voltage under minimal load conditions.
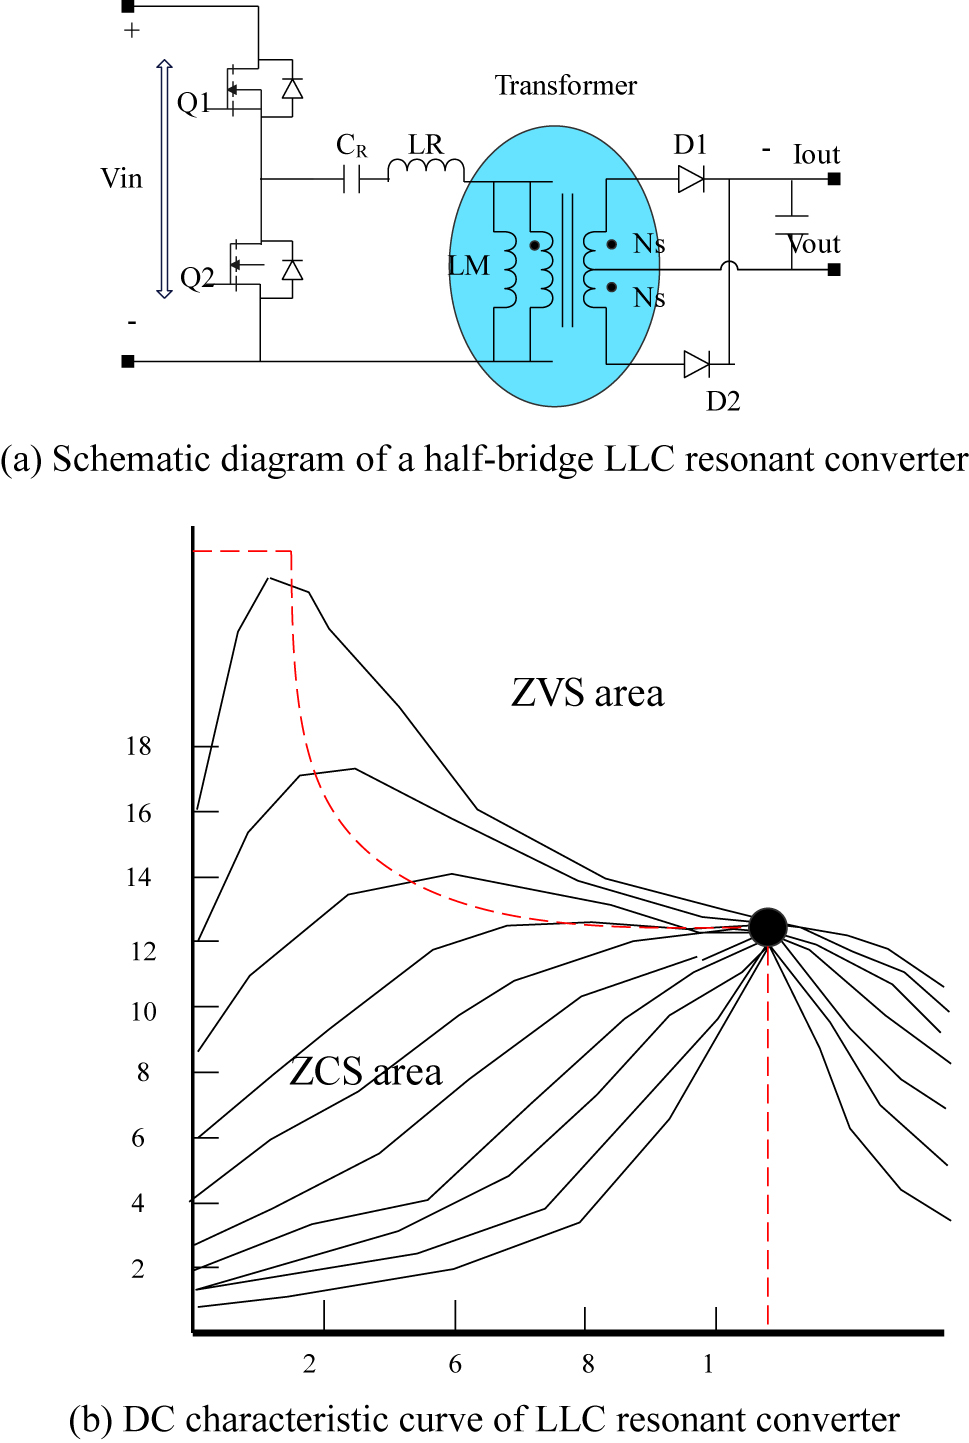
Schematic diagram of LC resonant converter.
The advantage of the LLC resonant converter is that it can achieve a narrow operating frequency range under light load conditions and ZVS capability under no-load conditions. Its DC characteristic curve, which is different from SRC and PRC, is shown in Figure 8b. This particular DC characteristic curve shows that LLC resonant converter is an excellent choice for DC–DC converter application in this project. The two resonant frequencies are given by formulas (16) and (17). The first resonant frequency is determined by L R and C R , while the other is determined by L R , C R and L M .
2.3 Design of LLC resonant half-bridge circuit parameters
LLC resonant half-bridge circuit (LLCHBR) contains resonant components C R , L R and L M , power MOSFETs, isolation transformers, output rectifier diodes, output capacitors, etc. A common practice is to use an isolation transformer to provide the inductance required by the two resonant inductors.
Determination of the resonance element. LLC resonant converters operate at a fixed frequency, thus mitigating EMI issues and improving efficiency. In order for the resonant converter to operate in this mode, the switching frequency needs to match the resonant frequency of the resonant cavity. The resonant frequency is shown in equation (18).
Design of resonant half-bridge isolation transformer. Because the resonant half-bridge isolated converter operates at a fixed frequency with a symmetrical duty cycle, the design of the transformer is relatively simple. Because the resonant capacitor is divided into two parts to form a voltage divider network, half of the HBR input voltage is added to the primary side of the transformer. A voltage divider network is typically made using a pair of resistors in series across a voltage source. However, instead of resistors, a voltage divider network can also be created using resonant capacitors. This is done by connecting two capacitors in series across the voltage source, with their resonant frequency equal to the input signal frequency. At resonance, the capacitors behave like resistors, and their impedance becomes purely resistive. The output voltage is obtained from the junction between the two capacitors, and its value depends on the capacitance ratio. Resonant capacitors can be advantageous in high-frequency circuits, reducing voltage drops and power losses. The maximum PFC output voltage was previously chosen to be 400 Vdc, and produces a maximum output voltage of 40 Vdc. Isolation transformers are transformers that have separate primary (input) and secondary (output) windings. These transformers are designed to transfer electrical power from an AC power source to a device or equipment while keeping the powered device electrically isolated from the power source. This is done for safety reasons and to minimize transients and harmonics. The primary and secondary windings are separated from each other by a dielectric insulation barrier, effectively creating an electrical separation between the input and output power. Therefore, the turns ratio of the isolation transformer is:
Therefore, the turns ratio of the primary and secondary turns of the isolation transformer is 5:1. The secondary side of the isolation transformer uses two equal windings with a center tap. Because the magnetic core is based on the power level and the overall planning of the project, the PQ-2020 magnetic core has been selected. After the turns ratio is determined, the minimum number of turns on the primary side needs to be determined to avoid core saturation. Core saturation can cause energy efficiency loss and damage to a transformer due to excessive magnetization caused by high input voltage or current. To prevent core saturation, the primary side of the transformer needs to have a minimum number of turns. Increasing the number of turns on the primary side increases the inductance of the transformer, which helps to keep the magnetic flux density within safe limits. However, this also increases resistance and reduces efficiency. Therefore, determining the minimum number of turns required to prevent core saturation while maintaining high efficiency depends on the transformer’s design requirements and operating conditions. The required minimum number of turns can be calculated from equation (20).
Among them, N p is the minimum number of turns of the primary side required by the isolation transformer; V is the maximum voltage of the primary side of the isolation transformer; F is the switching frequency of the LLC resonant half-bridge; BM is the maximum magnetic flux density of the ferrite; Ae is the cross-sectional area of the magnetic core. It is more appropriate to choose 96 turns.
The average current on the primary side of the isolation transformer is calculated according to equation (21).
According to the size of the current, we choose the wire diameter of the primary winding of the transformer, and choose the AWG#28 excitation wire, which can be wound in three layers, with 32 turns per layer, for 96 turns. The number of turns on the secondary side is 96/5 = 19.2 turns, so we can choose 19 turns.
2.4 Design of constant voltage and constant current feedback compensation circuit
The constant current feedback compensation circuit (CVCC) part in Figure 9 is the constant voltage and constant current feedback control loop. The output voltage of the resonant half-bridge is detected through R7 and R8, and the change of the output voltage is fed back to the operational amplifier in CVCC for conditioning and compensation. Then, it is fed back to the PFC and the resonant half-bridge controller to adjust the PFC output voltage, so that the change of the resonant half-bridge output voltage follows the change of the PFC output voltage.
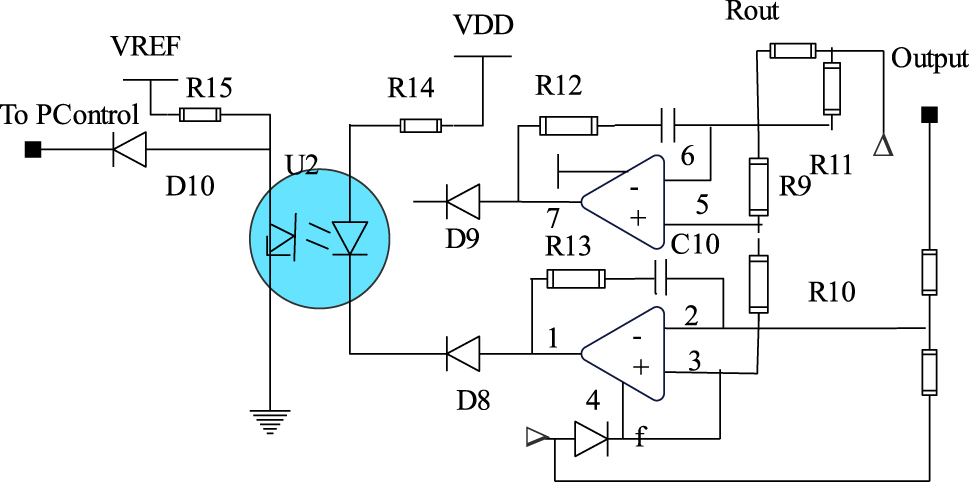
Constant voltage and constant current feedback control circuit.
Its transfer function is as follows equation (22).
By extracting the factor
From equation (23), the zero point, the zero-dB original pole and the IF gain can be obtained as follows:
As the frequency increases, C10 acts as a short circuit and the gain decreases to the ratio of the resistors, as shown in equation (27).
The phase angle is calculated according to equation (23). Because of the presence of the negative sign in front of
When
The AC signal from one of the two op amps interacts with the transfer network consisting of the optocoupler and its associated parts. Its transfer function is as follows:
Therefore, the transfer functions of voltage and current are given by equations (30) and (31), respectively.
Among them,
The high-frequency pole ω p appears in both the voltage and current transfer functions. Therefore, when the high-frequency pole is fixed in one compensation loop, it is necessary to adjust the zero in the other loop to meet the required phase margin.
In order to limit the loss, the loss on the current sense resistor is generally limited to 100 mW. Therefore, the sampling resistance can be calculated according to equation (37):
Since the voltage drop of the sampling resistor calculated according to equation (37) is too small, it is reasonable to use a sampling resistor of
In equation (38), the expression of R10 is obtained as equation (39), and this equation is used to set the output current through the resistance value of R10 in the table.
According to the above calculation process, the value of R out is 0.1 Ω, the value of R9 is 3.3 K, and the value of R10 is 50 K, that is, the maximum output current is set to be 1.65 A.
The setting of the output voltage is set by the value of the output voltage detection resistor divider network R7 and R8, and the maximum output voltage V out is determined by equation (40).
3 Electric power environmental protection platform based on big data
The power environmental protection big data platform is an integrated application platform, which consists of three parts: data acquisition system, distributed computing environment, and intelligent analysis application system, as shown in Figure 10. Power environmental protection platforms and integrated application platforms based on big data share similarities in their use of big data analytics to collect, analyze, and derive insights from large amounts of data. Both platforms also employ machine learning and real-time data to inform decision-making processes, prioritize data security and privacy, and are designed to be scalable and flexible. These similarities reflect the significance of big data analytics in modern business operations, highlighting the need for platforms that can handle large volumes of data and provide insights for informed decision-making.
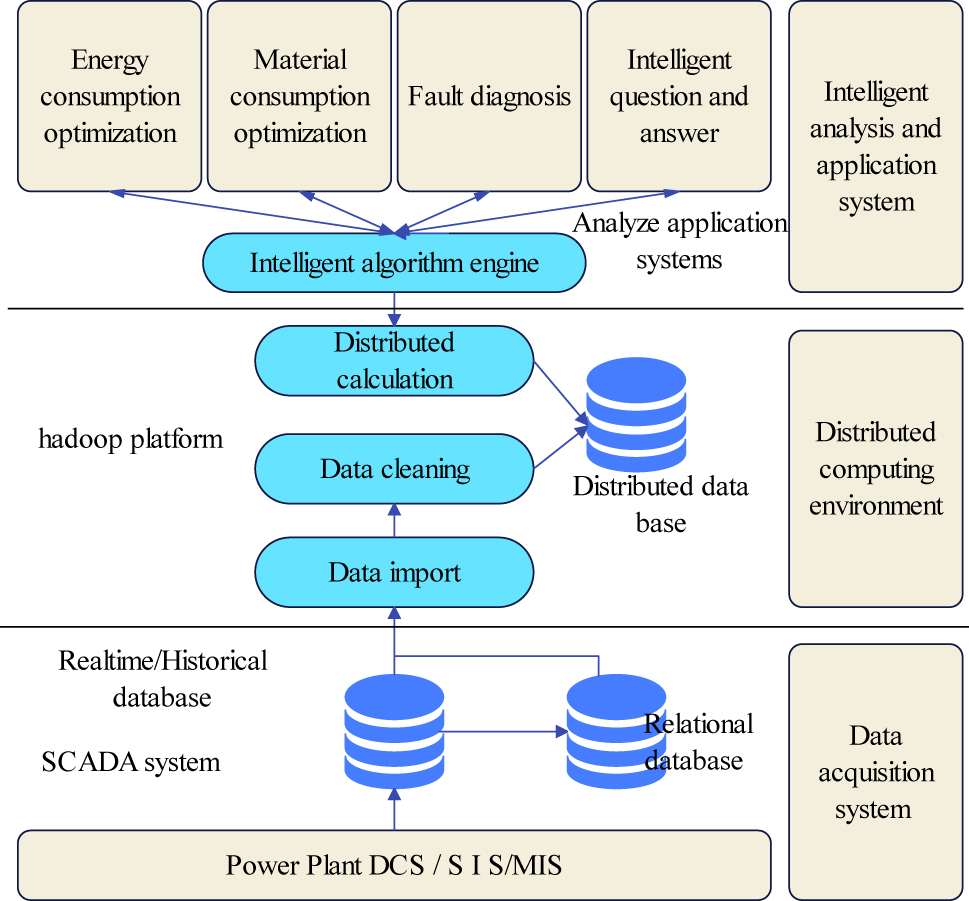
System framework.
A power environmental protection big data platform comprises of three key components, including the data acquisition system, distributed computing environment, and intelligent analysis application system. The data acquisition system collects data from various sources, which is then processed by the distributed computing environment. The data acquisition process contains Realtime/historical diabase and the SCADA system is involved in this part. Supervisory Control And Data Acquisition (SCADA) systems are used to collect and analyze data from a variety of sensors and network devices connected to programmable logic controllers (PLCs). SCADA systems provide real-time monitoring and control of industrial processes and are commonly used in industries such as manufacturing, energy, and transportation. The raw data collected by the sensors is crucial for optimizing these processes and identifying potential issues. By analyzing the data collected by the SCADA system, operators can make informed decisions to increase efficiency, reduce downtime, and improve safety. The intelligent analysis application system analyzes the processed data using advanced algorithms and machine learning techniques to provide insights and recommendations. The platform helps to power companies optimize their operations, reduce their environmental impact, and improve efficiency by leveraging big data analytics.
Test the effect of the model in this paper, and count the performance of the model in the power environment protection. Figure 11a is the normalized scatter plot of the original data, and it is difficult to distinguish the stationary state of the data from the figure. Figure 11b is the scatter plot after the normalization of the first two thousand data. It can be seen from the partial enlarged view that the data fluctuates up and down a certain horizontal line, and there is a certain periodic law, and the load sequence is preliminarily determined to be non-stationary.
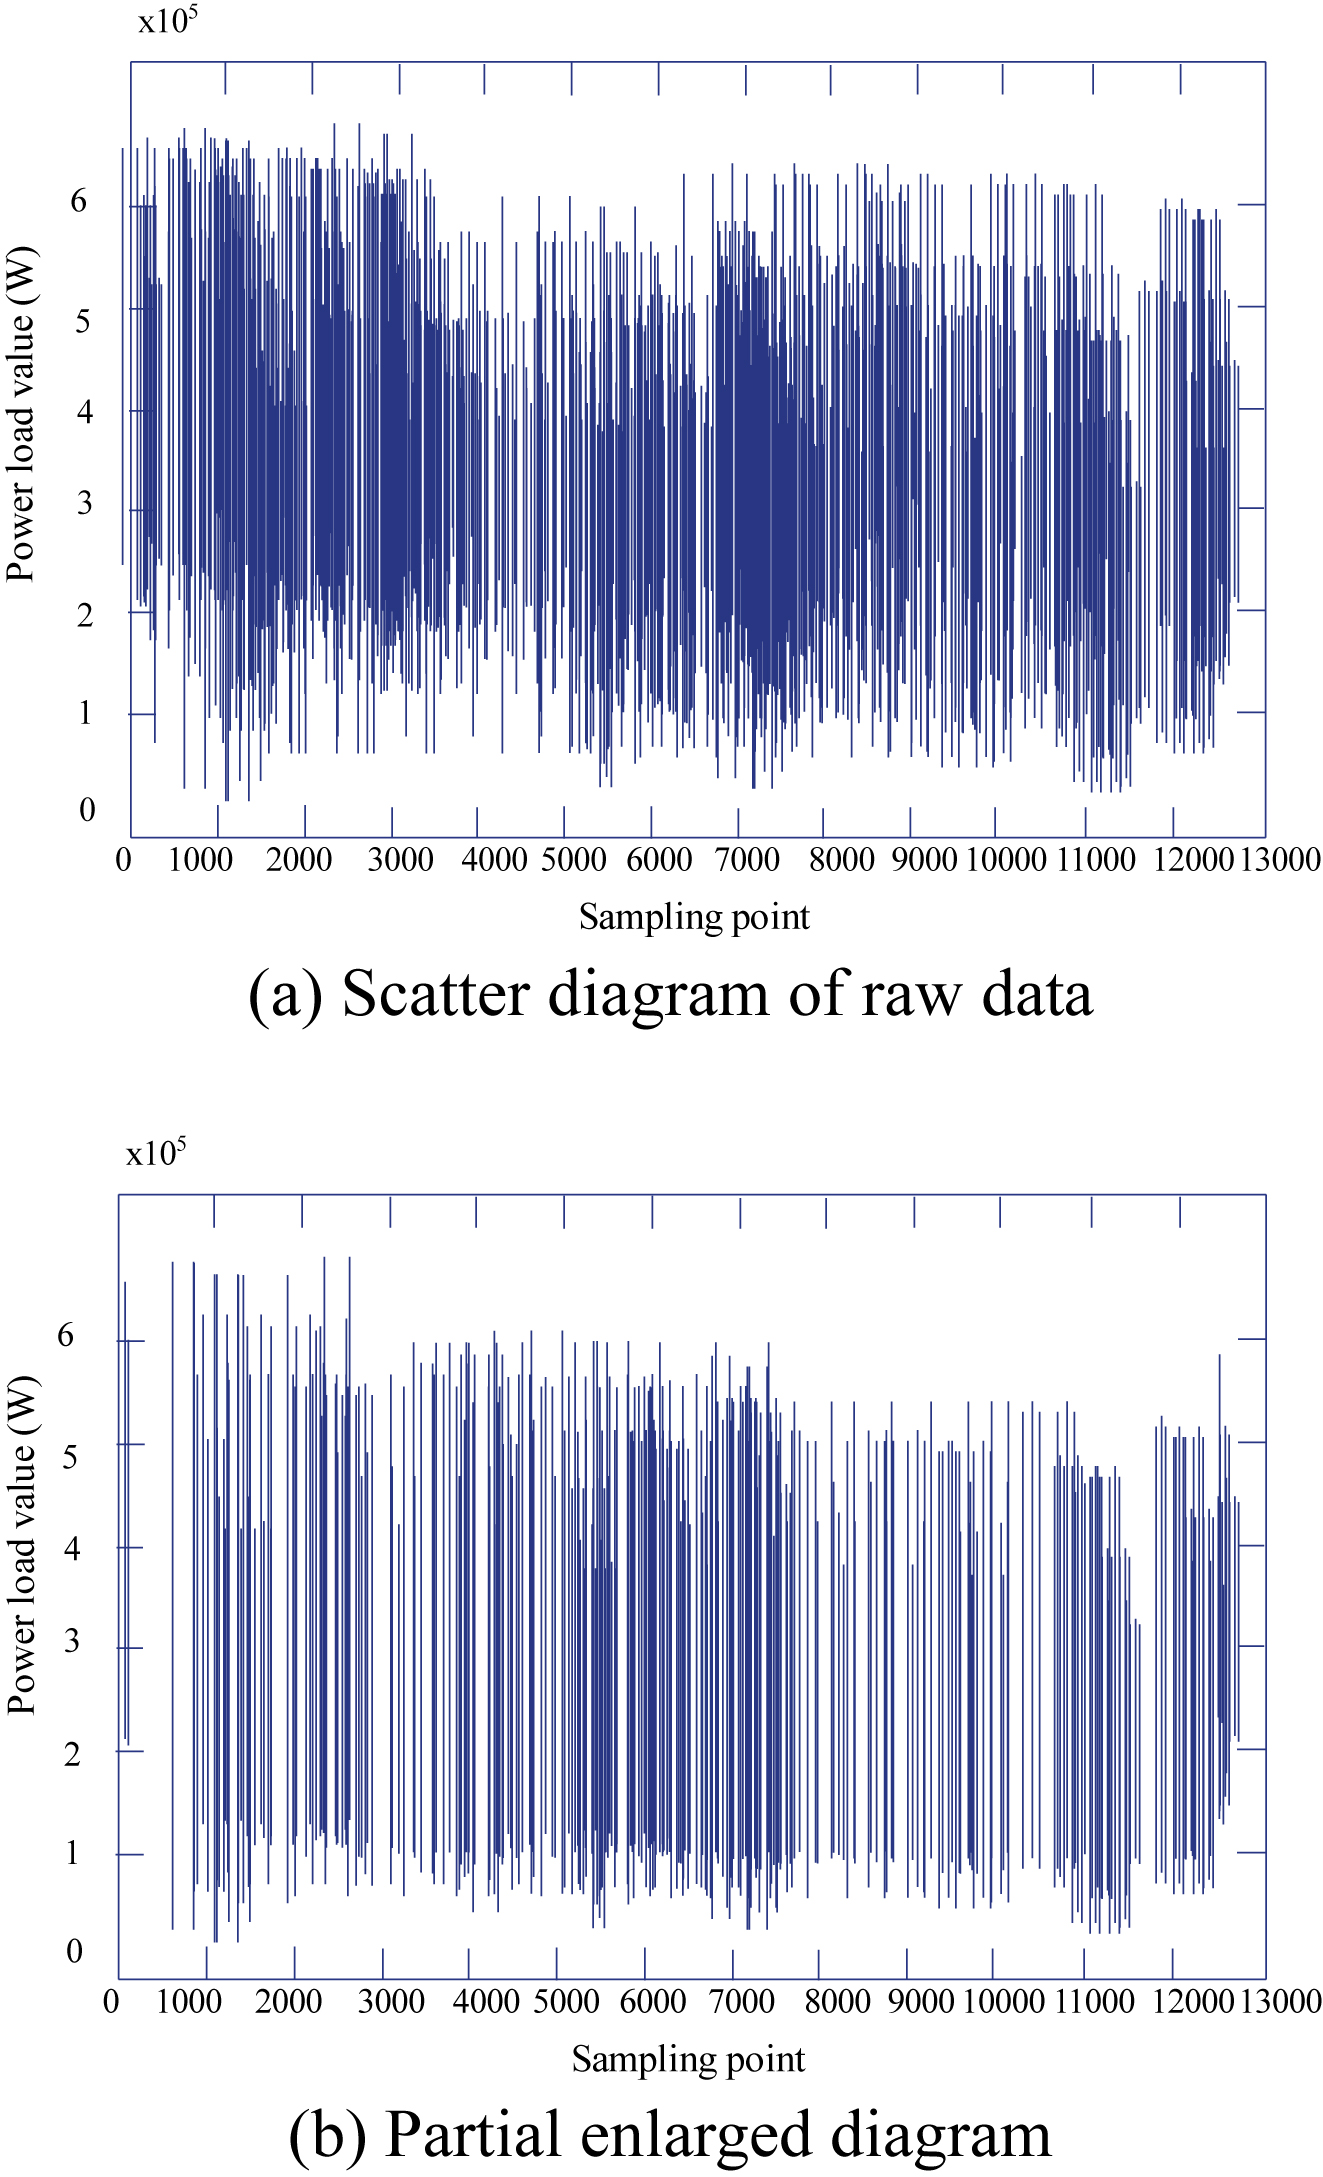
Stability judgment of power system.
Autocorrelation coefficient (ACF) measures the correlation between a time series and its lagged values, while partial autocorrelation coefficient (PACF) measures the direct correlation between two time series values, controlling for the effect of other lags. ACF can identify patterns or trends in time series data, while PACF can help determine the order of an autoregressive (AR) model used to predict future values based on past values. In order to more intuitively judge whether the time series is stable, the autocorrelation coefficient and the partial autocorrelation coefficient are used to judge, as shown in Figure 12.
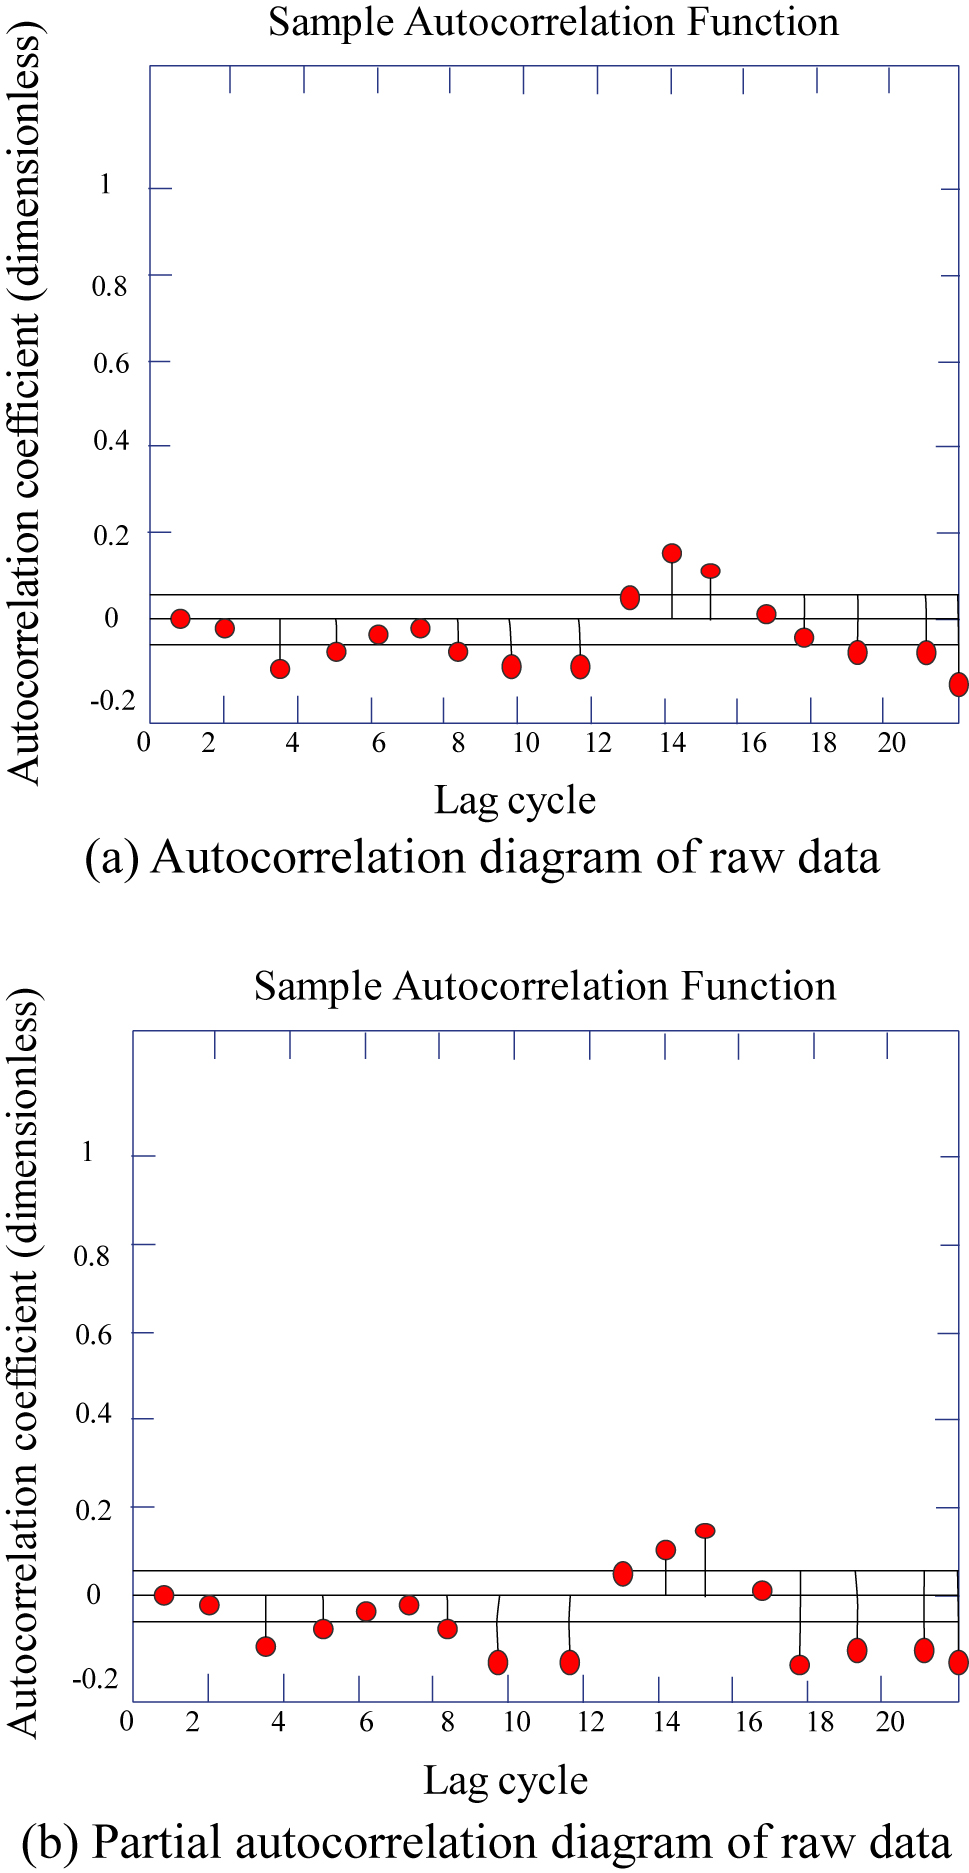
Data processing effect of power environmental protection.
From the above research, it can be seen that the power environmental protection platform based on big data proposed in this paper can effectively improve the effectiveness of power environmental protection strategies.
4 Conclusions
With the development of information technology and the introduction of relevant national Internet + policies, the combination and application of new technologies such as big data analysis and artificial intelligence with the energy industry is becoming more and more close. In the field of thermal power environmental protection, how to achieve emission standards and economic operation at the same time has always been a difficult problem for power generation enterprises. One of the traditional solutions is to improve the desulfurization and denitrification processes, including chemical reaction devices, conditions and automatic control processes, which require advanced technology and a lot of investment. The second is to strengthen management and improve the quality of operating personnel. Due to the complexity of on-site working conditions, optimal control often lacks standards, is highly subjective, and has unsatisfactory results. This paper combines the big data technology to develop and design the power environmental protection platform, and analyzes its intelligent application effect. Through the experimental research, it can be seen that the power environmental protection platform based on big data proposed in this paper can effectively improve the effectiveness of the power environmental protection strategy.
-
Author contributions: All author is contributed to the design and methodology of this study, the assessment of the outcomes and the writing of the manuscript.
-
Research funding: Authors did not receive any funding.
-
Conflicts of interests: Authors do not have any conflicts.
-
Data availability statement: No datasets were generated or analyzed during the current study.
-
Code availability: Not applicable.
References
Alavi, S. A., K. Mehran, Y. Hao, A. Rahimian, H. Mirsaeedi, and V. Vahidinasab. 2018. “A Distributed Event-Triggered Control Strategy for DC Microgrids Based on Publish-Subscribe Model over Industrial Wireless Sensor Networks.” IEEE Transactions on Smart Grid 10 (4): 4323–37. https://doi.org/10.1109/tsg.2018.2856893.Search in Google Scholar
Alghamdi, B., and C. A. Cañizares. 2020. “Frequency Regulation in Isolated Microgrids through Optimal Droop Gain and Voltage Control.” IEEE Transactions on Smart Grid 12 (2): 988–98. https://doi.org/10.1109/tsg.2020.3028472.Search in Google Scholar
Ananduta, W., J. M. Maestre, C. Ocampo‐Martinez, and H. Ishii. 2020. “Resilient Distributed Model Predictive Control for Energy Management of Interconnected Microgrids.” Optimal Control Applications and Methods 41 (1): 146–69. https://doi.org/10.1002/oca.2534.Search in Google Scholar
Daneshvar, M., B. Mohammadi-Ivatloo, K. Zare, and S. Asadi. 2020. “Two-stage Robust Stochastic Model Scheduling for Transactive Energy Based Renewable Microgrids.” IEEE Transactions on Industrial Informatics 16 (11): 6857–67. https://doi.org/10.1109/tii.2020.2973740.Search in Google Scholar
Du, Y., and F. Li. 2019. “Intelligent Multi-Microgrid Energy Management Based on Deep Neural Network and Model-free Reinforcement Learning.” IEEE Transactions on Smart Grid 11 (2): 1066–76. https://doi.org/10.1109/tsg.2019.2930299.Search in Google Scholar
Khan, M. R. B., J. Pasupuleti, J. Al-Fattah, and M. Tahmasebi. 2019. “Energy Management System for PV-Battery Microgrid Based on Model Predictive Control.” Indonesian Journal of Electrical Engineering and Computer Science 15 (1): 20–5. https://doi.org/10.11591/ijeecs.v15.i1.pp20-26.Search in Google Scholar
Li, Y., R. Wang, and Z. Yang. 2021. “Optimal Scheduling of Isolated Microgrids Using Automated Reinforcement Learning-Based Multi-Period Forecasting.” IEEE Transactions on Sustainable Energy 13 (1): 159–69. https://doi.org/10.1109/tste.2021.3105529.Search in Google Scholar
Lin, H., K. Sun, Z. H. Tan, C. Liu, J. M. Guerrero, and J. C. Vasquez. 2019. “Adaptive Protection Combined with Machine Learning for Microgrids.” IET Generation, Transmission & Distribution 13 (6): 770–9. https://doi.org/10.1049/iet-gtd.2018.6230.Search in Google Scholar
Liu, J., X. Cao, Z. Xu, X. Guan, X. Dong, and C. Wang. 2021. “Resilient Operation of Multi-Energy Industrial Park Based on Integrated Hydrogen-Electricity-Heat Microgrids.” International Journal of Hydrogen Energy 46 (57): 28855–69. https://doi.org/10.1016/j.ijhydene.2020.11.229.Search in Google Scholar
Mardani, M. M., M. H. Khooban, A. Masoudian, and T. Dragičević. 2018. “Model Predictive Control of DC–DC Converters to Mitigate the Effects of Pulsed Power Loads in Naval DC Microgrids.” IEEE Transactions on Industrial Electronics 66 (7): 5676–85. https://doi.org/10.1109/tie.2018.2877191.Search in Google Scholar
Pippia, T., J. Sijs, and B. De Schutter. 2019. “A Single-Level Rule-Based Model Predictive Control Approach for Energy Management of Grid-Connected Microgrids.” IEEE Transactions on Control Systems Technology 28 (6): 2364–76. https://doi.org/10.1109/tcst.2019.2945023.Search in Google Scholar
Shan, Y., J. Hu, M. Liu, J. Zhu, and J. M. Guerrero. 2019. “Model Predictive Voltage and Power Control of Islanded PV-Battery Microgrids with Washout-Filter-Based Power Sharing Strategy.” IEEE Transactions on Power Electronics 35 (2): 1227–38. https://doi.org/10.1109/tpel.2019.2930182.Search in Google Scholar
Shuai, Z., Y. Peng, J. M. Guerrero, Y. Li, and Z. J. Shen. 2018. “Transient Response Analysis of Inverter-Based Microgrids under Unbalanced Conditions Using a Dynamic Phasor Model.” IEEE Transactions on Industrial Electronics 66 (4): 2868–79. https://doi.org/10.1109/tie.2018.2844828.Search in Google Scholar
Utkarsh, K., D. Srinivasan, A. Trivedi, W. Zhang, and T. Reindl. 2018. “Distributed Model-Predictive Real-Time Optimal Operation of a Network of Smart Microgrids.” IEEE Transactions on Smart Grid 10 (3): 2833–45. https://doi.org/10.1109/tsg.2018.2810897.Search in Google Scholar
Vergara, P. P., J. M. Rey, J. C. López, M. J. Rider, L. C. da Silva, H. R. Shaker, and B. N. Jørgensen. 2018. “A Generalized Model for the Optimal Operation of Microgrids in Grid-Connected and Islanded Droop-Based Mode.” IEEE Transactions on Smart Grid 10 (5): 5032–45. https://doi.org/10.1109/tsg.2018.2873411.Search in Google Scholar
Zhang, X., B. Wang, U. Manandhar, H. B. Gooi, and G. Foo. 2018. “A Model Predictive Current Controlled Bidirectional Three-Level DC/DC Converter for Hybrid Energy Storage System in DC Microgrids.” IEEE Transactions on Power Electronics 34 (5): 4025–30. https://doi.org/10.1109/tpel.2018.2873765.Search in Google Scholar
Zhao, Y., Z. Lin, Y. Ding, Y. Liu, L. Sun, and Y. Yan. 2018. “A Model Predictive Control Based Generator Start-Up Optimization Strategy for Restoration with Microgrids as Black-Start Resources.” IEEE Transactions on Power Systems 33 (6): 7189–203. https://doi.org/10.1109/tpwrs.2018.2849265.Search in Google Scholar
© 2024 the author(s), published by De Gruyter, Berlin/Boston
This work is licensed under the Creative Commons Attribution 4.0 International License.
Articles in the same Issue
- Solar photovoltaic-integrated energy storage system with a power electronic interface for operating a brushless DC drive-coupled agricultural load
- Analysis of 1-year energy data of a 5 kW and a 122 kW rooftop photovoltaic installation in Dhaka
- Reviews
- Real yields and PVSYST simulations: comparative analysis based on four photovoltaic installations at Ibn Tofail University
- A comprehensive approach of evolving electric vehicles (EVs) to attribute “green self-generation” – a review
- Exploring the piezoelectric porous polymers for energy harvesting: a review
- A strategic review: the role of commercially available tools for planning, modelling, optimization, and performance measurement of photovoltaic systems
- Comparative assessment of high gain boost converters for renewable energy sources and electrical vehicle applications
- A review of green hydrogen production based on solar energy; techniques and methods
- A review of green hydrogen production by renewable resources
- A review of hydrogen production from bio-energy, technologies and assessments
- A systematic review of recent developments in IoT-based demand side management for PV power generation
- Research Articles
- Hybrid optimization strategy for water cooling system: enhancement of photovoltaic panels performance
- Solar energy harvesting-based built-in backpack charger
- A power source for E-devices based on green energy
- Theoretical and experimental investigation of electricity generation through footstep tiles
- Experimental investigations on heat transfer enhancement in a double pipe heat exchanger using hybrid nanofluids
- Comparative energy and exergy analysis of a CPV/T system based on linear Fresnel reflectors
- Investigating the effect of green composite back sheet materials on solar panel output voltage harvesting for better sustainable energy performance
- Electrical and thermal modeling of battery cell grouping for analyzing battery pack efficiency and temperature
- Intelligent techno-economical optimization with demand side management in microgrid using improved sandpiper optimization algorithm
- Investigation of KAPTON–PDMS triboelectric nanogenerator considering the edge-effect capacitor
- Design of a novel hybrid soft computing model for passive components selection in multiple load Zeta converter topologies of solar PV energy system
- A novel mechatronic absorber of vibration energy in the chimney
- An IoT-based intelligent smart energy monitoring system for solar PV power generation
- Large-scale green hydrogen production using alkaline water electrolysis based on seasonal solar radiation
- Evaluation of performances in DI Diesel engine with different split injection timings
- Optimized power flow management based on Harris Hawks optimization for an islanded DC microgrid
- Experimental investigation of heat transfer characteristics for a shell and tube heat exchanger
- Fuzzy induced controller for optimal power quality improvement with PVA connected UPQC
- Impact of using a predictive neural network of multi-term zenith angle function on energy management of solar-harvesting sensor nodes
- An analytical study of wireless power transmission system with metamaterials
- Hydrogen energy horizon: balancing opportunities and challenges
- Development of renewable energy-based power system for the irrigation support: case studies
- Maximum power point tracking techniques using improved incremental conductance and particle swarm optimizer for solar power generation systems
- Experimental and numerical study on energy harvesting performance thermoelectric generator applied to a screw compressor
- Study on the effectiveness of a solar cell with a holographic concentrator
- Non-transient optimum design of nonlinear electromagnetic vibration-based energy harvester using homotopy perturbation method
- Industrial gas turbine performance prediction and improvement – a case study
- An electric-field high energy harvester from medium or high voltage power line with parallel line
- FPGA based telecommand system for balloon-borne scientific payloads
- Improved design of advanced controller for a step up converter used in photovoltaic system
- Techno-economic assessment of battery storage with photovoltaics for maximum self-consumption
- Analysis of 1-year energy data of a 5 kW and a 122 kW rooftop photovoltaic installation in Dhaka
- Shading impact on the electricity generated by a photovoltaic installation using “Solar Shadow-Mask”
- Investigations on the performance of bottle blade overshot water wheel in very low head resources for pico hydropower
- Solar photovoltaic-integrated energy storage system with a power electronic interface for operating a brushless DC drive-coupled agricultural load
- Numerical investigation of smart material-based structures for vibration energy-harvesting applications
- A system-level study of indoor light energy harvesting integrating commercially available power management circuitry
- Enhancing the wireless power transfer system performance and output voltage of electric scooters
- Harvesting energy from a soldier's gait using the piezoelectric effect
- Study of technical means for heat generation, its application, flow control, and conversion of other types of energy into thermal energy
- Theoretical analysis of piezoceramic ultrasonic energy harvester applicable in biomedical implanted devices
- Corrigendum
- Corrigendum to: A numerical investigation of optimum angles for solar energy receivers in the eastern part of Algeria
- Special Issue: Recent Trends in Renewable Energy Conversion and Storage Materials for Hybrid Transportation Systems
- Typical fault prediction method for wind turbines based on an improved stacked autoencoder network
- Power data integrity verification method based on chameleon authentication tree algorithm and missing tendency value
- Fault diagnosis of automobile drive based on a novel deep neural network
- Research on the development and intelligent application of power environmental protection platform based on big data
- Diffusion induced thermal effect and stress in layered Li(Ni0.6Mn0.2Co0.2)O2 cathode materials for button lithium-ion battery electrode plates
- Improving power plant technology to increase energy efficiency of autonomous consumers using geothermal sources
- Energy-saving analysis of desalination equipment based on a machine-learning sequence modeling