Fault diagnosis of automobile drive based on a novel deep neural network
-
Cangku Guo


Abstract
The times are progressing. Facing the increasing number of electric vehicles, they use power batteries as energy storage power sources. As a core component of electric vehicle, the drive motor is related to the normal operation of the vehicle. If the driving motor fails, passengers may be irreversibly hurt, so it is very important to diagnose the driving motor of electric vehicle. This paper mainly analyzes the faults of electric vehicles, and makes use of diagnostic signals to diagnose the faults. A novel fault diagnosis method of automobile drive based on deep neural network is proposed. In this method, CNN-LSTM model is constructed. Firstly, the vibration signals are transformed into time-frequency images by fast Fourier transform, and then the time-frequency images are input into the proposed model to obtain the fault classification results. In addition, CNN, LSTM and BP neural network are introduced to compare with the methods proposed in this paper. The results show that CNN-LSTM model is superior to the other three models in the fault diagnosis of automobile drive, reaching 99.02 % of the fault accuracy rate, showing excellent fault diagnosis performance. And when the same learning rate is used for training, the rate of loss reduction is obviously better than that of the other three types of vehicle drive fault diagnosis method based on CNN-LSTM.
1 Introduction
With the rapid development of the world economy, the number of cars is also increasing. Conventional fuel vehicles use diesel and gasoline, which are made from petroleum. Oil is a mixture of organic hydrocarbons buried in the earth’s crust and gradually evolved. It is a non-renewable resource, and the oil resources on the earth are limited Lei et al. (2020).
Electric vehicle is a kind of new energy vehicle. Compared with the traditional fuel vehicle, the driving motor of electric vehicle replaces the internal combustion engine as the power source, and the power battery replaces the petrochemical fuel as the energy source Zheng et al. (2019). Electric vehicles (EVs) have the advantages of simple structure, high energy utilization rate, zero emission and little environmental pollution in the operation process. The key components are electric motor, battery pack, power electronics, onboard charger, thermal management system, vehicle control unit (VCU), charging port & infrastructure, etc. It is one of the most ideal “green vehicles” to replace traditional fuel vehicles. The biggest difference between electric vehicles and fuel vehicles is the use of different fuels, different forms of power source, electric vehicles rely on electric drive motor to make the car run, while traditional cars use internal combustion engine as the power to drive the car. The core component of electric vehicles is the driving motor. When the driving motor fails, it will affect the driving of electric vehicles and even the safety of drivers and passengers. Some of the key safety precautions in electric vehicles include battery safety, crash safety, high voltage system safety, charging safety, fire, electrical, safety standards, training and education. At present, the driving motor used in electric vehicles has various structures and forms. The structure of the driving motor determines some characteristics of electric vehicles, such as DC motor good speed performance, good starting performance, simple control advantages; PMSM has the advantages of high efficiency, high power density and so on.
An electric car drives a motor to move the wheels forward, and the motor must rely on a power battery to provide energy. Electric vehicles and fuel vehicles because of the use of different energy sources, power sources are different, at the same time, there are also big differences in structure. The main structural difference between the two lies in their different driving systems. Electric vehicles use power batteries, fuel cells and so on as energy sources to drive motor operation. A traditional petrol-powered car uses gasoline or diesel as its energy source to power an internal combustion engine. The structure of electric vehicle is mainly composed of motor drive system, battery system, control system, car body and chassis. Figure 1 shows the basic structure of an electric vehicle.
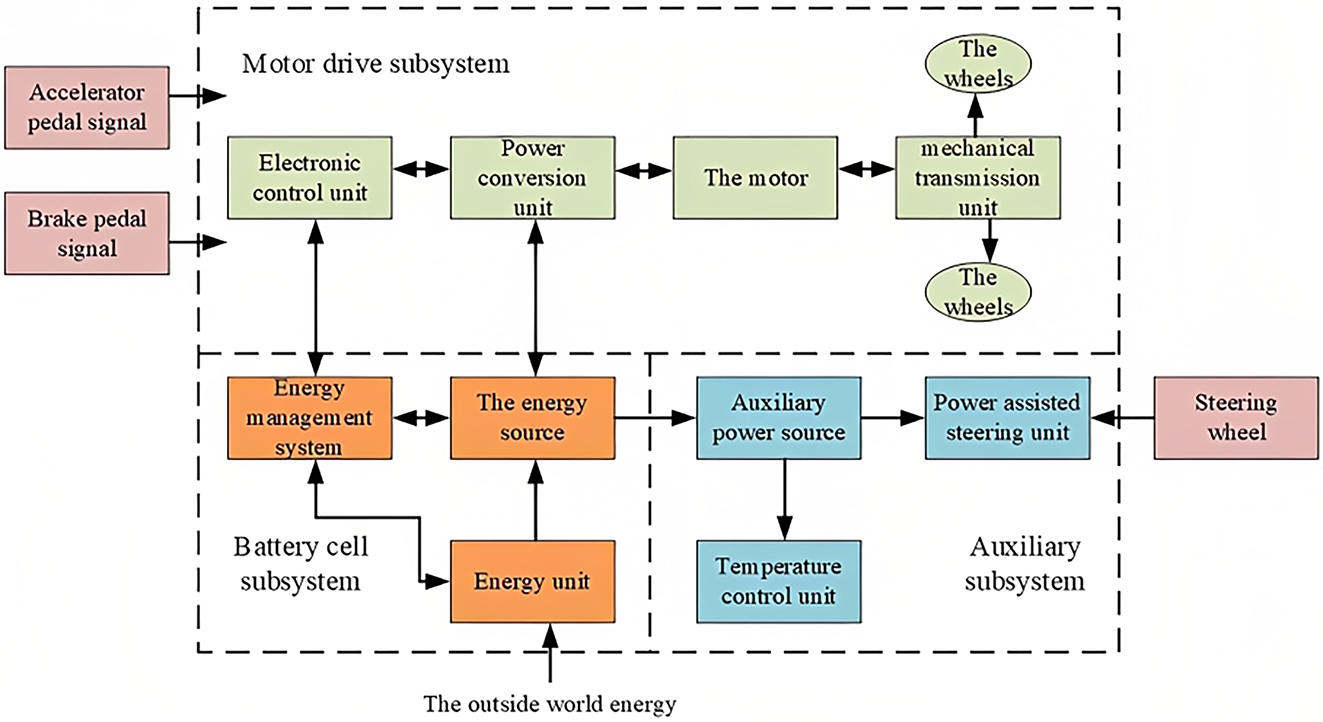
Basic structure of electric vehicle.
With the rapid development of modern industry and the popularity of electrical equipment, human labor is gradually replaced by artificial intelligence, and the probability of complex and special faults of motor system is rising sharply Xiong et al. (2020). In the modern industrial system, fault is absolute, safety is relative, so the first time to find the fault, is to ensure the safe operation of modern industrial system, in the modern industrial system, the power system in the relay protection direction has been basically perfect, can effectively avoid the occurrence of serious accidents. When the motor equipment in the power system is abnormal or faulty, the relay protection system will cut off the connection between the motor equipment and the whole system, but it will take effect after the motor equipment is abnormal or faulty, unable to avoid unnecessary losses and fundamentally prevent the occurrence of accidents Xu et al. (2020). Motor fault diagnosis technology can find the fault in the early stage or even before the fault, for the fault or failure of motor equipment and other stopped production maintenance, can save the motor maintenance funds, reduce the motor fault expenditure and improve economic benefits. Usually by measuring the motor current, vibration, speed, and radial magnetic flux of the rotating shaft and other technical parameters to measure, electrical scientists also study the characteristics of motor faults, but because the actual situation is often repeated and random, the technical requirements for motor fault diagnosis are also increasingly high Tang, Yuan, and Zhu (2020). Which is used to measure the motor fault characteristics require more professional knowledge in combination with the actual situation to judge the characteristics of the fault, and the motor running condition within a large number of uncontrollable factors, multiple factors combination makes fault diagnosis even more complicated, constraints of the traditional fault diagnosis technology, the need to be further research. With the rapid development of computer science and computer learning technology, artificial intelligence and machine learning have become more and more hot spots in scientific research. In recent years, artificial intelligence and machine learning have also emerged in the field of fault diagnosis Wu (2022).
As used in the fault diagnosis of machine learning and artificial intelligence technology to gradually reduce the external reason and the influence of human error, in the artificial intelligence and machine learning in more complex situations, the method of using self learning obtain fault characteristic also received more attention, making the failure diagnosis technology is also gradually towards intelligence aspect of the development. In reality, there are many fault types of motors with limited number of samples and complex and changeable conditions. In order to obtain fault characteristics from data more effectively, machine learning technology and artificial intelligence can be used to reflect fault characteristics more comprehensively, thus improving the accuracy of fault diagnosis. Machine learning and artificial intelligence in fault diagnosis on the whole process of self-learning automation. The latest research achievement in the field of artificial intelligence and machine learning is deep learning, which has stronger data processing ability in the face of multi-level data. It can effectively train corresponding deep networks to extract the features of data, and express the deep abstract features of data through complex self-learning ability Xiao, Cao, and Jolfaei (2020).
This paper analyzes and summarizes the characteristics of different types of driving motors of electric vehicles, and classifies and summarizes the faults of different types of driving motors of electric vehicles. Introducing neural network technology in the fault diagnosis of electric vehicle drive motor, formed a set of electric vehicle drive motor fault diagnosis based on neural network method, and the study of fault diagnosis methods, using software to the fault of collecting training, simulation, finally, the electric vehicle drive motor fault diagnosis. This method improves the efficiency of fault diagnosis and shortens the time of fault diagnosis for maintenance technicians.
2 Literature review
Since the 1970s, the Electrical fault Diagnosis Institute has established a special scientific research field to transform the traditional equipment repair work into predictive maintenance, in order to improve the reliability, stability and level economic benefits of maintenance of generators and their systems. Language modelling, contextual analysis, word frequency, N-gram models, user history, neural networks, real-time updating, and feedback loop. Part of the electrical and mechanical equipment fault diagnosis technology, but because of the complexity of the motor structure, various breakdowns may be contact each other, and the motor fault diagnosis should be divided into two parts, mechanical equipment failure and electricity failure so the fault diagnosis technology of the motor is very complex, considering the category of a broader, more amount of technologies involved. The traditional fault diagnosis method is based on some actual measured parameters of motor operation, and the characteristics reflecting the fault are extracted through signal processing. In the method of fault signal feature extraction, the most important is to first use signal processing method to obtain some feature quantities. These methods mainly include frequency domain method, time-frequency analysis method and wavelet packet method Wen, Li, and Gao (2020). Among them, frequency domain method and wavelet-based analysis technique are more commonly used, but they both have some problems and cannot obtain useful information, while Fourier transform technique is more suitable for studying continuous steady time domain signal information. When an unstable signal is generated after a generator failure, its frequency characteristic is generally band, but the frequency characteristic is local. At present, the signal processing techniques used to analyze the current signal of linear synchronous motor mainly include fast Fourier transform, Wegeneville distribution, empirical mode decomposition and wavelet transform. Since the deep learning way is put forward in the field of machine learning and research, many experts and scholars to study using machine learning method fully realized motor fault diagnosis technology with more confidence, and more achievements in this respect, has appeared in recent years, in order to promote the mechanical fault diagnosis technology of highly automated and large digital laid a foundation.
In the fault diagnosis of electric vehicle driving motor, the core idea of deep learning is to use multi-layer neural network to simulate the processing of internal organization and external information of human brain. Deep learning methods used include autoencoder, restricted Boltzmann machine, convolutional neural network (CNN), sparse coding, etc. Hinton et al. presented a deep belief network framework in their 2006 paper, and the greedy layer-by-layer approach in modeling and unsupervised training methods has important implications for later deep network computing Chen et al. (2020). Deep belief networks consist of stacks organized by finite Boltzmann. The basic structure of the probabilistic generation model is a two-layer neural network composed of visible layers and hidden layers of a single finite Boltzmann machine. This model can apply complex networks to large-scale data processing and analysis. In addition, it can further reduce computing resources by using multi-layer perceptrons for classification and prediction. These advantages have attracted wide attention. However, this method also has disadvantages. When the data scale is large, the computational complexity is high, and the coupling relationship between neurons in the hidden layer is not considered, so the fitting problem will occur. With the development of deep computing and artificial intelligence technology, CNN, as one of the most popular machine learning methods, has attracted more and more scholars’ attention, especially in recent years, it has been favored by many researchers. CNN is one of the earliest methods to realize deep structure, which is widely used in various visual recognition tasks. The various visual recognition tasks are image classification, object detection, semantic segmentation, instance segmentation, object recognition & localization, facial recognition, gesture recognition, etc. It has great advantages in image recognition. CNN has a high degree of deformation invariance, such as movement, compression and graph rotation, and also contains sparse connection, weight sharing, down sampling and other structural characteristics, which makes it more valuable in other application fields of human intelligence recognition and exploration significance.
Aiming at the fault diagnosis of the driving motor of electric vehicles, some scholars have conducted research on the fault diagnosis of electric vehicles. For example, Chen, Gryllias, and Li (2019) analyzed the working principle of GRC-BP neural network and GRC-RBF neural network, established a fault diagnosis method for electric vehicles based on GRC-NN, and analyzed the process of fault diagnosis method for electric vehicles according to GRC-NN and DS evidence theory. Qian et al. (2021) used the advantages of granular computing theory in knowledge representation and knowledge reduction, combined with the powerful nonlinear fitting ability and self-learning ability of neural network, and took the electric vehicle fault as the research object, established the electric vehicle fault diagnosis model based on granular computing and neural network. Using the theory of microphone array, Zhao et al. (2021) designed a fault diagnosis and testing system for electric vehicles. Through the system to the electric car fault in low torque at low speed motor noise tests under typical working conditions, provided the electric car motor fault diagnosis theory and practice basis, at the same time, through to the electric car motor in the rated speed, rated torque working condition of noise test and analysis, it is concluded that failure of noise frequency, determine the fault parts, It is proved that the fault diagnosis of electric vehicle motor by noise is feasible. Han, Oh, and Jeong (2021) used wavelet decomposition to diagnose the alignment uniformity of permanent magnets by using the Hall sensor output of the motor as the characteristic signal. The specific frequency components of phase current waveform are extracted, and the energy ratio of these frequency components is calculated by using continuous wavelet transform to judge whether the magnetic weakness fault occurs when the motor is running.
Some experts and scholars in electric vehicle drive motor controller is engaged in the research of fault diagnosis, such as: Ye et al. (2022) people adopt the hybrid system theory analysis method, such as establishing precise motor driven system switching function model of mixed logic dynamic model, based on this model in this paper, a permanent magnet synchronous motor drive system based on current residual inverter open circuit fault diagnosis method. On the basis of analyzing the existing fault diagnosis methods of electric vehicle motor and controller, Zhao et al. (2022) developed an electric vehicle motor and controller detector based on fuzzy fault diagnosis expert system. Most of the electric vehicle driving motor fault diagnosis has formed the corresponding fault diagnosis theory and method, maintenance technicians in the actual maintenance of the application of such theory and method is very little. For how to apply in practical maintenance method for fault diagnosis of the fault diagnosis theory study is less, such as: normally on the one uses the electric car wheel motor drive, on the road suddenly power down, acceleration, climbing and so on power condition: in really need cannot provide enough power of fault analysis, fault diagnosis and troubleshooting Xu et al. (2020).
Based on the fault diagnosis of electric vehicle driving motor, this paper analyzes the common driving motor of electric vehicle and the mechanism of common driving motor faults Cao et al. (2020). This paper analyzes the advantages of applying neural network in the fault diagnosis of electric vehicles, and puts forward a fault analysis method of electric vehicle driving motor system based on neural network based on the fusion of CNN-LSTM and traditional automobile diagnosis technology. The basic fault diagnosis model of electric vehicle driving motor system based on CNN-LSTM is established, and good results are achieved.
3 The theoretical background of CNN-LSTM
3.1 CNN
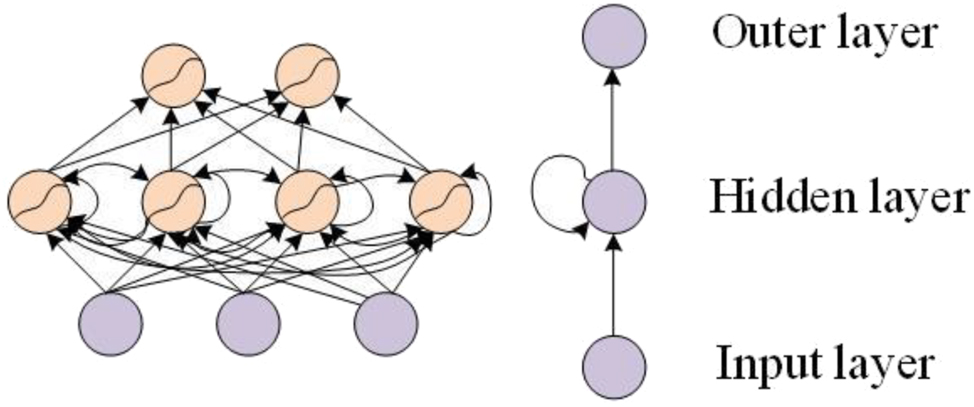
CNN is a nourishing neural network, and the network structure consists of three parts: a convolution layer, a pooling layer, and a full connectivity layer. Conventional neural network structures have the following two disadvantages in processing two-dimensional data, such as images: images need to be processed a lot of data, resulting in higher cost and lower efficiency. Two-dimensional characteristics are padding, stride, dilated convolution, transposed convolution, and batch normalization. These supplementary techniques and characteristics of two-dimensional convolution can be employed to maintain important image properties, such as size, resolution, spatial information, and statistical consistency, throughout the convolutional operations. Some probable ways to tackle these disadvantages and improve the processing of two-dimensional data are convolutional neural network, pooling layers, local connectivity, weight sharing, hierarchical feature extraction, transfer learning, data augmentation. In the process of digitizing the image, it is difficult to maintain the original properties, resulting in low image processing accuracy. Maintaining the original properties of an image during digitization is challenging due to lossy compression, sampling and quantization limitations, sensor limitations, image processing operations, variations in display and output devices, and subjective human perception. While efforts can be made to minimize these challenges, it is often difficult to fully preserve all the intricate details and characteristics of the original image. When digitizing an image, several properties can affect the quality of the resulting digital representation such as, resolution, color depth, compression, noise, artifacts, dynamic range, color accuracy, sharpness & detail, and artistic intent. The emergence of CNN solves this problem very well. The emergence of Convolutional Neural Networks (CNNs) has significantly improved the accuracy of low-level image processing tasks. Few are local receptive fields, parameter sharing, hierarchical feature extraction, automatic feature learning, data augmentation, and transfer learning. The structure of the convolutional pool allows you to correctly utilize the two-dimensional structure of the CNN access data, reduce the size of a large part of the image to a small amount of information, and effectively maintain image properties. Currently, CNN is widely used, for example: facial recognition, automatic driving, security and many other areas. Classical convolutional neural network training models include LeNet (as shown in Figure 2), VGGNet and ResNet, etc. Generally, it includes three parts: convolution, pooling and full connection Jin, Chen, and Zhao (2021).

LeNet network model.
3.1.1 Convolution
The most basic operation in CNN is convolution, which is specifically manifested as the use of a filter to filter each small area of the image Wang et al. (2020), so as to obtain the eigenvalues of these small areas. If the feature coordinate of the original input image in the current channel is (x,y), the size of the convolution kernel in the convolution layer is p*q, its weight is w, and the brightness value of the image in the channel is v, the convolution process can be expressed as follows:
The output feature size of the convolutional layer is determined by the depth, the step size and the value of zero padding. The depth represents the number of convolution kernels in the layer, the step size is the number of pixels sliding on the original image features (the longer the step size, the smaller the output feature map size), and the zero filling is the filling with 0 value in the boundary range, so as to ensure the consistency of input and output sizes. The number of filters in the convolution kernels used to extract particular features from an input image can vary depending on the specific application and network architecture. Typically, the number of filters is determined based on the complexity and diversity of the features that need to be captured. Bias is usually added after convolution operation and nonlinear activation function is introduced. Bias is added after the convolution operation in CNNs as a learnable parameter for each filter. It provides a constant offset or shift in the activation values and allows the model to introduce biases towards specific features or patterns. The bias terms are updated during training to improve the network’s performance, making it more adaptable and capable of capturing diverse patterns in the data. The benefits are shift in activation range, enhanced model flexibility, breaking symmetry, improved learning, and handling biased inputs. These benefits contribute to the network’s ability to learn and represent complex patterns and improve its overall predictive capabilities. Common activation functions include Relu, Sigmoid, and tanh. ReLU is an activation function commonly used in neural networks. It introduces non-linearity by outputting the input directly if it is positive, and zero otherwise. Sigmoid is a popular activation function that squashes the input values between 0 and 1. It provides a smooth transition from 0 to 1, which can be useful in tasks requiring probabilistic outputs. The hyperbolic tangent function, tanh, is similar to the sigmoid function but maps the input values between −1 and 1.
3.1.2 Pooling
At the end of the convolution operation, the pooling layer is usually accessed. Pooling is a downsampling operation, which aims to filter the feature information, that is, to reduce the dimension of the feature space, so as to reduce the number of parameters and computation times Qi, Gao, and Huang (2020). Pooling layer operation can effectively avoid overfitting. By incorporating pooling layers into the network architecture, the spatial dimensions are effectively reduced, translation invariance is introduced, regularization is applied, and the parameter count is controlled. These characteristics collectively contribute to the ability of pooling layers to mitigate overfitting, making them a valuable component in the design of deep neural networks. Popular ways in which the pooling layer operations are employed to successfully avoid overfitting are max pooling, average pooling, global pooling, dropout, besides spatial pyramid pooling. By incorporating these pooling operations into CNN architectures, models can better handle complex datasets, generalize well to unseen data, and avoid overfitting. While pooling can provide some regularization effects, it is important to note that it has limitations in avoiding overfitting. Pooling reduces the spatial resolution of the input, which may result in some loss of fine-grained details. In certain cases, pooling can also discard useful information that may be relevant for the task at hand. The feature is statistically replaced by pooling function, and the output result is similar to the convolution layer, and the output vector depends on the pooling size, step size and filling. The most commonly used pooling operations include maximum pooling, average pooling, L2 pooling and so on.
3.2 Recurrent neural networks
The deep learning-based fault diagnosis method for electric vehicle driving motor also needs to understand some basic knowledge of RNN. RNNS are used to process serialized feature data. RNNs are necessary for processing serialized feature data due to their ability to capture temporal dependencies, handle variable-length sequences, extract relevant features, encode context, facilitate sequence-to-sequence mapping, and perform time-series analysis and prediction. These characteristics make RNNs a powerful choice for tasks involving serialized data with a temporal structure. Serialized feature data is often processed using Recurrent Neural Networks (RNNs) because RNNs are particularly effective in handling sequential or time-dependent data. The main reasons for utilizing RNNs for processing serialized feature data are modelling temporal dependencies, variable-length input sequence, contextual information processing, sequential data generation, and backpropagation through time. Some common problems are vanishing or exploding gradients, long-term dependency, memory limitations, overfitting, computational efficiency, and lack of explicit alignment. The special network structure of RNN can solve the problem of saving and transferring serialized information, and it has good applicability for text and audio classification. In the basic neural network Li et al. (2018), the fully connected layer architecture leads to the information between nodes in the network is not correlated with each other, which makes it impossible to predict text words. RNNs and their variants incorporate recurrent connections that enable information to flow across timesteps, allowing the model to leverage the sequential structure of the text. These architectures can capture long-term dependencies, retain context information, and generate predictions based on the preceding words.
Text processing problems usually need to synthesize the semantic information of the context. The semantic data of the content is essential to synthesize in text processing issues because it allows for a deeper understanding of the meaning and context of the text. Certain reasons are contextual understanding, resolving ambiguity, entity recognition & linking, relationship extraction, sentiment analysis and opinion mining. There is a correlation between the current output and the previous state, and there is a certain problem if it is regarded as an independent node Wan et al. (2018). If a pooling layer is treated as an independent node in a neural network, it can lead to several problems such as, loss of spatial information, limited learning capability, overfitting & lack of generalization, increased computational complexity, incompatibility with backpropagation. In recurrent neural networks (RNNs), the problem of correlation between the current output and the previous state is often referred to as the “vanishing gradient” or “exploding gradient” problem. These problems arise due to the nature of the RNN architecture and can affect the learning and performance of the network. Such are vanishing gradient problem and exploding gradient problem. In the RNN network structure, the output result of the current sequence is related to the output of the previous node, that is, there are connections between nodes in the hidden layer. In the application of practical problems, in order to reduce network complexity, the current output state is set to be only related to the first few nodes, and the RNN structure representation is shown in Figure 3.
Basic structure of RNN.
In RNN, the output of a neuron node can continue to act on itself at the next moment. However, if the time series interval increases continuously, the basic RNN structure may lose some distant information, which is called gradient disappearance. Therefore, the problem of long text sequence requires a network structure that can learn long-term dependent information Han, Park, and Hong (2022).
Long short-term memory network (LSTM) adds a special gate structure based on RNN to solve the problem of long-term dependence. The main types available in LSTM networks are cell state, input gate, forget gate, output gate, and hidden state. It makes LSTMs particularly effective in handling tasks that require modeling long-term dependencies and dealing with sequential data. LSTM contains three gate structures: input gate, forget gate and output gate, which are used to determine whether the information continues to be available. The information that continues to be available after being judged by the algorithm is retained, otherwise it will be discarded by forgetting. The gate structure of the special LSTM is shown in Figure 4.

LSTM gate structure.
4 The CNN-LSTM model
The fault diagnosis method of driving motor based on CNN-LSTM model is described as follows. CNN-LSTM neural network is a parallel construction of CNN network and LSTM network, combining the advantages of the two networks to complement the network structure. The advantages are complementary features, enhanced performance, robustness & generalization, efficient training, transfer learning and adaptability. Convolutional neural networks are very strong in extracting the latent spatial features of fault features, which can not only reduce the network parameters, but also reduce the correlation between filter features Zhang et al. (2022). For fault classification, long and short memory neural networks are good at obtaining contextual information, which will provide more effective information for the network. The more effective classification information extracted, the higher the classification accuracy. The selection of features to be fused depends on the specific problem, available data, and domain expertise. The goal is to identify complementary or discriminative features that capture different aspects of the data and improve the classification accuracy when combined. The fusion of diverse features aims to create a more comprehensive representation of the data, enabling the classifier to leverage multiple sources of information and make more informed decisions. Among them, the convolution network can only extract the correlation between elements in the convolution receptive field, while the LSTM network can obtain the correlation between elements of longer distance, so as to provide multi-angle feature information for classification. When the fault data has obvious contextual correlation, the hybrid network can further improve the network classification performance. Several reasons are insufficient training data, model complexity, overfitting, hyperparameter tuning, data preprocessing, class imbalance, data quality or noise, and underlying data distribution. Some common techniques are increasing the model complexity, adjust hyperparameters, augment the training data, pretrain the model, use transfer learning, regularization techniques, ensemble learning, data balancing, and increase training data size. The feature extraction process of fault samples is shown in Figure 5.

Feature extraction of CNN-LSTM network.
Therefore, how to make full use of the information provided by these two networks is an urgent problem to be solved. In the experiment, neither the concatenation of two networks nor the output characteristics from the concatenation of two networks can improve the performance of the network. By improving the performance of a network resulting from the concatenation of two networks requires careful consideration of information compatibility, feature extraction, parameter optimization, network architecture, generalization, and computational complexity. By addressing these challenges effectively, it is possible to achieve improved performance through the synergy of the two networks. After analysis, it can be found that the cascading of two networks will lead to the loss of feature information. In addition, the experiment tries to concatenate the output of LSTM network with the original data as the input of CNN network. LSTM networks have several characteristics that make them more effective in extracting classification information and achieving higher accuracy compared to simple RNNs. Several reasons are memory cell, gating mechanisms, long-term dependencies, handling vanishing gradients, robust learning of sequential patterns. However, the classification performance of the network is not improved Jiao, Zhao, and Lin (2019).
In the fault diagnosis of driving motor based on CNN-LSTM, add layer is considered to connect the feature information of parallel output of two networks. The Add layer only increases the information under the image feature description, but the dimension of the image description feature itself does not increase, only the information under each dimension increases, which is obviously conducive to fault classification. The best approaches are functional API, concatenation and dense layer, residual connections, custom layer, lambda layer, and so on. However, the same fault sample data is used as the input data of CNN and LSTM networks, but the data in the output layer do not follow the same distribution, so the Add layer cannot be directly used to Add. However, with the same input of fault sample data, the distribution of output data of the two networks is different. Therefore, the BN layer is considered to solve the problem that the distribution is different due to different networks and cannot be added directly. In addition, considering the gradient descent, the influence of the features contained in the vibration signal is masked. In this paper, time-frequency graph, deep neural network (DNN) and attention mechanism are introduced to diagnose CNN-LSTM network structure as shown in Figure 6.

Structure diagram of CNN-LSTM network.
4.1 Input layer
The model enters the collected vibration signal data and preprocesses the initial vibration signal to obtain a time-frequency scheme. The size of the function of each frame spectroscopy is normalized to 256*256*3, which represents the width and height of 256 images, and 3 represents the number of channels (RGB) of the chromatography. The convolutions are then contained in the CNN layer for the next step in pooling.
4.2 Multi-convolutional kernels CNN layer
A multi-scale convolution is used to perform convoluted operations according to CNN layer input data to process time frequency function data, followed by a merger operation to further produce functions. The key characteristics of multi-scale convolution are time-frequency localization, multi-resolution analysis, feature extraction, time-frequency analysis, signal compression, scalability, and efficiency. The release of the network is ultimately combined into serial representation. The model expansion scheme is shown in Figure 7. When implementing a model, the CNN layer consists of two intricate layers and two union layers. The first layer of convolutional implementation is the time-frequency scheme of error. The convolution operation is performed using a 2 × 2 64 convolutional line with a step size set to 1. The relu is used as an activation function for this network model. The maximum pooling layer is used to combine the results of the convolution to obtain important properties of emotional properties, in which the size is 2 × 2 and is determined in 1 size of the gateway. All 64 feature maps are created by a merge operation of the maximum unifying layer. The second layer of the return adapts to the size of the 3 × 3, the same layer of the process. The conditions typically followed in the merge operation to assist in creating numerous features in a CNN are dimension compatibility, element-wise operation, feature combination, intermediate layers, regularization and information flow.

Multi-scale convolution kernel CNN.
In the model, the time-frequency graphs of fault samples are represented by CNN layer. The size of CNN output vector H depends on W, F, P and S Where W is input size. F is convolution kernel size. P is fill size. S is step size. The calculation formula is as follows:
When extracting convolution elements, first use a convolution kernel to calculate the local elements of each input, as shown in formula (3). Furthermore, as shown in Equation (4), the calculated characteristics are vertically connected. Finally, the calculation result adopts the activation function of nonlinear calculation, and the convolution finite element is obtained, as shown in formula (5). Convolution finite elements, also known as convolutional finite elements or FEM-C, are a specialized class of finite element methods (FEM) that incorporate convolution operations into the discretization process. These methods have been developed to solve partial differential equations (PDEs) in domains with complex or heterogeneous material properties. In the equation, W F represents convolution kernel with height F, and H represents the size of output vector.
Finally, different features are fused to improve the classification accuracy. The formula is as follows:
4.3 LSTM layer
LSTM network can effectively capture the context information of input sequence, and solve the problem of preservation and transmission of serialized information. The operation sequences of various convolution kernels mentioned above are used as input of LSTM, and each operation can be extracted from LSTM cells, which is helpful to obtain better classification model accuracy. The evaluation metrics are accuracy, precision, recall, F1 score, specificity, confusion matrix, cross-validation, precision-recall curve, etc. These evaluation metrics help to assess the performance of a classification model from different perspectives.
4.4 Attention mechanism layer
The attention mechanism is inspired by the nature of human vision. When viewing a particular scene, our visual system focuses only on the part we want to see, and ignores irrelevant redundant information. In the attention mechanism layer, the output of CNN + LSTM layer is taken as the input, and the corresponding output weights of all moments are calculated by the score function. The specific calculation of the score function can vary depending on the application and the desired similarity measure as input, comparison, element-wise comparison, aggregation, and normalization. It is important to select a suitable similarity measure that captures the desired characteristics of the weights and aligns with the objectives of the task. According to the weights, the original output vectors are weighted and summed to obtain the attention feature vector. The expansion of the attention mechanism layer model is shown in Figure 8.

Attention mechanism layer.
With the introduction of attention mechanism, the model can capture important information and make output representation by weighting the output of all moments according to the weight. For each vector a i output by CNN + LSTM, its attention weight r i can be calculated by the following formula:
Where f(r i ) is the scoring function.
4.5 Output layer
The Softmax output layer mainly solves the multi-classification problem, and the output of the fully connected layer is used as the input. The cross-entropy loss is usually chosen as the loss function for multiple classification problems. Calculation method of loss function:
Where y(i) and 和y C+L (i) represent the real output of the sample and the predicted output of CNN-LSTM network, respectively. Although the classification accuracy of the training set is improved, the accuracy of the validation set is not. Through the analysis of the output of the middle layer, it can be found that the classification accuracy of a single CNN and LSTM is around 90 % when only the loss function of the output classification result of the hybrid network is considered. To this end, by constraining the output accuracies of the two networks, we rewrite the overall loss function as:
Where y(i) is the ideal output of the sample. y C+L (i), y C (i) and y L (i) respectively represent the predicted output probabilities of the three networks. α1, α2 are the regularization parameters.
In the experiment, Adam algorithm is chosen as the optimization algorithm of neural network, and its advantage is that it can design independent adaptive learning rate according to different parameters. Adam algorithm is often chosen as the optimization method for neural networks as adaptive learning rates, efficient & effective, robust to different data & architectures, low memory requirements, handles sparse gradients, and easy implementation. Depending on the specific problem, dataset, and model architecture, other optimization methods such as stochastic gradient descent (SGD) or its variants may yield better results. Calculating an independent adaptive learning rate involves adjusting the learning rate based on different parameters or conditions during the training process. There are various methods for determining the adaptive learning rate, and here are a few commonly used approaches are learning rate scheduling, momentum-based methods, adaptive learning rate, learning rate based on loss, learning rate with validation performance, etc. The traditional stochastic gradient descent method can only use a single vector to update the ownership value, and it will not change during the training process, which is easy to cause the local optimal situation. In addition, due to the high learning rate, the loss value of the validation set will not decrease, but increase, and the shock is large. Learning rate decay is a technique used in machine learning to gradually reduce the learning rate during the training process. The purpose of learning rate decay is to achieve better convergence and improve the performance of the model over time. Instead of using a fixed learning rate throughout training, a decay function is applied to adjust the learning rate dynamically. However, the smaller the learning rate, the slower the convergence speed and the longer the training time. After experimental test and analysis, the learning rate decay function is selected and set. The initial learning rate is 0.001, and the decay rate is 0.1.
5 The experimental results
5.1 Data description
In order to determine the fault samples of the driving motor ontology of electric vehicles, 79 driving motor faults of different brands and different types of electric vehicles were investigated and statistically analyzed, and the typical fault types and fault characteristics of the driving motor ontology of electric vehicles were analyzed. Among the data samples investigated, 4 cases were not used because they had few fault phenomena or the fault location was not representative. Group in the remaining 75 effective samples, a fault phenomenon corresponds to multiple parts of the samples have 6 groups, one or more of the fault phenomenon corresponds to a part of the 65 groups of data, multiple fault phenomenon corresponding fault there are four parts of the sample, one or more of the fault phenomenon corresponds to a part of the sample account for 86.7 % of the total number of valid samples. Due to a malfunction phenomenon corresponds to multiple fault location and fault phenomenon corresponds to multiple parts of the sample is too little, the number of samples is too little for neural network learning, and learning sample size will directly affect the quality of the neural network, so this part of the sample after the follow-up study to collect enough sample size to study again. Since there are 65 samples corresponding to one fault location for one or more fault phenomena, the model selected for diagnosis using CNN-LSTM is multiple fault phenomena corresponding to one fault location model. In this paper, seven types of faults are selected for fault diagnosis, including inverter, stator, rotor, overload, bearing, air gap and radiator. Table 1 lists the detailed fault information.
Fault category information.
| The fault location | Abbreviations | Number | Label |
|---|---|---|---|
| Inverter | I | 240 | 0 |
| Stator | S | 240 | 1 |
| Overload | O | 240 | 2 |
| Bearing | B | 240 | 3 |
| Air gap, | AG | 240 | 4 |
| Radiator | RA | 240 | 5 |
| Rotor | RO | 240 | 6 |
5.2 The experiment
In this group of experiments, different classification methods are used to verify the classification performance. Several classification methods are accuracy, precision & recall, F1 score, confusion matrix, receiver operating characteristics, cross-validation, precision-recall curve, and so on. The data set is the automobile drive set mentioned in this paper. In the experiment, the collected vibration signal is used to diagnose the automobile drive fault, and then fast Fourier transform is used to transform the vibration signal into time-frequency diagram, which is used as the input. In addition, CNN, LSTM and BP neural network are used to carry out experiments for comparison. Finally, the accuracy of CNN-LSTM is 99.40 %, the accuracy of CNN is 97.02 %, the accuracy of LSTM is 96.13 %, and the accuracy of BP neural network is 94.94 %. In order to make the classification result easier to observe, the confusion matrix of the four methods is shown in Figure 9. The abscissa is the true label and the ordinate is the predicted label.

Confusion matrix.
From the confusion matrix, it can be seen that the vehicle driving fault diagnosis method proposed in this paper is significantly stronger than CNN, LSTM and BP neural network. Although other models also use time-frequency graph as the input of the network, CNN is good at extracting local features and LSTM has weak feature extraction ability. The CNN-LSTM model integrates the advantages of both and further improves the classification accuracy.
In order to analyze the convergence speed of various methods, after building the network, the training samples were set to the same, the learning rate was set to 0.001, and the Batchsize was set to 32. A total of 200 rounds of iterations were performed. The training results can be shown in Figure 10. The closer the loss is to 0, the more effective the network is. Conversely, the closer the loss is to 1, the worse the classification effect of the network is. The abscess is the number of training times (epochs). An EPOCH means that the complete data set has been propagated forward and back in the CNN respectively. Every time the network model is trained, the weights in the network will be updated, and the fit will be better. As can be seen from Figure 10, the loss of the four methods shows a downward trend on the whole, and there is no abnormal fluctuation in the whole training process, and it converges to near 0 when the epochs reach about 80 times. It can be seen from that the CNN-LSTM model converges very fast for car drive fault diagnosis, and there is no fluctuation with the increase of rounds. It can be seen that the convergence effect of CNN, LSTM and BP neural networks is not as good as the model proposed in this paper. The above shows that the fault diagnosis method of driving motor proposed in this paper can well extract fault features and achieve excellent fault diagnosis performance, which is greatly improved compared with the other three methods.

Loss curve.
6 Conclusions
The driving motor is the core component of the electric vehicle. The safe and stable operation of the electric vehicle is the prerequisite to ensure the safe running of the vehicle. With the increasing awareness of environmental protection and the increasing number of electric vehicles, the research on fault diagnosis of electric vehicles becomes more and more urgent. Based on the research on the fault diagnosis of electric vehicle driving motor, this paper analyzes the common faults of electric vehicle driving motor. The fault diagnosis method of CNN-LSTM is combined with the fault of driving motor, and good results are obtained. In this paper, the advantages of using CNN-LSTM in electric vehicle fault diagnosis are analyzed, and a fault analysis method of electric vehicle driving motor system based on CNN-LSTM is proposed based on the fusion of neural network and traditional automobile diagnosis technology. In addition, the application effect of CNN, LSTM and BP neural network on the driving motor fault dataset is analyzed, and it is found that the fault diagnosis performance of the method proposed in this paper is superior. In the future research, the intelligent development of fault diagnosis can be aimed at. Today’s cars are becoming more and more intelligent, and the application of electronic pairs on cars in the future is increasing. With the progress of science and technology, the intelligent level of automobile will be improved, and the intelligent level of automobile fault diagnosis will be further improved. For example, users can identify faults by remote access to car data, and more advanced signals can be used to extract fault features so that early faults can be detected.
-
Author contributions: Cangku Guo, contributed to the design and methodology of this study, the assessment of the outcomes and the writing of the manuscript.
-
Competing interests: The author declared no conflicts of interest regarding this work.
-
Research funding: No funds, grants were received by any of the authors.
-
Data availability: The data used to support the findings of this study are available from the corresponding author upon request.
References
Cao, H., X. Wang, D. He, and X. Chen. 2020. “An Improvement of Time-Reassigned Synchrosqueezing Transform Algorithm and its Application in Mechanical Fault Diagnosis.” Measurement 155: 107538. https://doi.org/10.1016/j.measurement.2020.107538.Suche in Google Scholar
Chen, Z., K. Gryllias, and W. Li. 2019. “Mechanical Fault Diagnosis Using Convolutional Neural Networks and Extreme Learning Machine.” Mechanical Systems and Signal Processing 133: 106272. https://doi.org/10.1016/j.ymssp.2019.106272.Suche in Google Scholar
Chen, H., D. L. Fan, L. Fang, W. Huang, J. Huang, C. Cao, L. Yang, Y. He, and L. Zeng. 2020. “Particle Swarm Optimization Algorithm with Mutation Operator for Particle Filter Noise Reduction in Mechanical Fault Diagnosis.” International Journal of Pattern Recognition and Artificial Intelligence 34 (10): 2058012. https://doi.org/10.1142/s0218001420580124.Suche in Google Scholar
Han, S., S. Oh, and J. Jeong. 2021. “Bearing Fault Diagnosis Based on Multiscale Convolutional Neural Network Using Data Augmentation.” Journal of Sensors 2021: 1–14, https://doi.org/10.1155/2021/6699637.Suche in Google Scholar
Han, J. H., S. U. Park, and S. K. Hong. 2022. “A Study on the Effectiveness of Current Data in Motor Mechanical Fault Diagnosis Using XAI.” Journal of Electrical Engineering & Technology 17: 3329–35, https://doi.org/10.1007/s42835-022-01207-y.Suche in Google Scholar
Jiao, J., M. Zhao, and J. Lin. 2019. “Unsupervised Adversarial Adaptation Network for Intelligent Fault Diagnosis.” IEEE Transactions on Industrial Electronics 67 (11): 9904–13. https://doi.org/10.1109/tie.2019.2956366.Suche in Google Scholar
Jin, Y., C. Chen, and S. Zhao. 2021. “Multisource Data Fusion Diagnosis Method of Rolling Bearings Based on Improved Multiscale CNN.” Journal of Sensors 2021: 1–17, https://doi.org/10.1155/2021/2251530.Suche in Google Scholar
Lei, Y., B. Yang, X. Jiang, F. Jia, N. Li, and A. K. Nandi. 2020. “Applications of Machine Learning to Machine Fault Diagnosis: A Review and Roadmap.” Mechanical Systems and Signal Processing 138: 106587. https://doi.org/10.1016/j.ymssp.2019.106587.Suche in Google Scholar
Li, B., M. Liu, Z. Guo, and Y. Ji. 2018. “Mechanical Fault Diagnosis of High Voltage Circuit Breakers Utilizing EWT-Improved Time Frequency Entropy and Optimal GRNN Classifier.” Entropy 20 (6): 448. https://doi.org/10.3390/e20060448.Suche in Google Scholar PubMed PubMed Central
Qi, J., X. Gao, and N. Huang. 2020. “Mechanical Fault Diagnosis of a High Voltage Circuit Breaker Based on High-Efficiency Time-Domain Feature Extraction with Entropy Features.” Entropy 22 (4): 478. https://doi.org/10.3390/e22040478.Suche in Google Scholar PubMed PubMed Central
Qian, Q., Y. Qin, Y. Wang, and F. Liu. 2021. “A New Deep Transfer Learning Network Based on Convolutional Auto-Encoder for Mechanical Fault Diagnosis.” Measurement 178: 109352. https://doi.org/10.1016/j.measurement.2021.109352.Suche in Google Scholar
Tang, S., S. Yuan, and Y. Zhu. 2020. “Convolutional Neural Network in Intelligent Fault Diagnosis toward Rotatory Machinery.” IEEE Access 8: 86510–9. https://doi.org/10.1109/access.2020.2992692.Suche in Google Scholar
Wan, S., L. Chen, L. Dou, and J. Zhou. 2018. “Mechanical Fault Diagnosis of HVCBs Based on Multi-Feature Entropy Fusion and Hybrid Classifier.” Entropy 20 (11): 847. https://doi.org/10.3390/e20110847.Suche in Google Scholar PubMed PubMed Central
Wang, J., S. Ji, B. Han, H. Bao, and X. Jiang. 2020. “Deep Adaptive Adversarial Network-Based Method for Mechanical Fault Diagnosis under Different Working Conditions.” Complexity 2020: 1–11, https://doi.org/10.1155/2020/6946702.Suche in Google Scholar
Wen, L., X. Li, and L. Gao. 2020. “A Transfer Convolutional Neural Network for Fault Diagnosis Based on ResNet-50.” Neural Computing & Applications 32 (10): 6111–24. https://doi.org/10.1007/s00521-019-04097-w.Suche in Google Scholar
Wu, D. 2022. “Prediction of Employment Index for College Students by Deep Neural Network.” Mathematical Problems in Engineering 2022: 1–8, https://doi.org/10.1155/2022/3170454.Suche in Google Scholar
Xiao, F., Z. Cao, and A. Jolfaei. 2020. “A Novel Conflict Measurement in Decision-Making and its Application in Fault Diagnosis.” IEEE Transactions on Fuzzy Systems 29 (1): 186–97. https://doi.org/10.1109/tfuzz.2020.3002431.Suche in Google Scholar
Xiong, R., W. Sun, Q. Yu, and F. Sun. 2020. “Research Progress, Challenges and Prospects of Fault Diagnosis on Battery System of Electric Vehicles.” Applied Energy 279: 115855. https://doi.org/10.1016/j.apenergy.2020.115855.Suche in Google Scholar
Xu, X., D. Cao, Y. Zhou, and J. Gao. 2020. “Application of Neural Network Algorithm in Fault Diagnosis of Mechanical Intelligence.” Mechanical Systems and Signal Processing 141: 106625. https://doi.org/10.1016/j.ymssp.2020.106625.Suche in Google Scholar
Ye, X., J. Yan, Y. Wang, J. Wang, and Y. Geng. 2022. “A Novel U-Net and Capsule Network for Few-Shot High-Voltage Circuit Breaker Mechanical Fault Diagnosis.” Measurement 199: 111527. https://doi.org/10.1016/j.measurement.2022.111527.Suche in Google Scholar
Zhang, Z., C. Liu, R. Wang, J. Li, D. Xiahou, Q. Liu, S. Cao, and S. Zhou. 2022. “Mechanical Fault Diagnosis of a Disconnector Operating Mechanism Based on Vibration and the Motor Current.” Energies 15 (14): 5194. https://doi.org/10.3390/en15145194.Suche in Google Scholar
Zhao, D., H. Zhang, S. Liu, Y. Wei, and S. Xiao. 2021. “Deep Rational Attention Network with Threshold Strategy Embedded for Mechanical Fault Diagnosis.” IEEE Transactions on Instrumentation and Measurement 70: 1–15. https://doi.org/10.1109/tim.2021.3085951.Suche in Google Scholar
Zhao, D., S. Liu, T. Zhang, H. Zhang, and Z. Miao. 2022. “Subdomain Adaptation Capsule Network for Unsupervised Mechanical Fault Diagnosis.” Information Sciences 611: 301–16. https://doi.org/10.1016/j.ins.2022.07.113.Suche in Google Scholar
Zheng, H., R. Wang, Y. Yang, J. Yin, Y. Li, Y. Li, and M. Xu. 2019. “Cross-Domain Fault Diagnosis Using Knowledge Transfer Strategy: A Review.” IEEE Access 7: 129260–90. https://doi.org/10.1109/access.2019.2939876.Suche in Google Scholar
© 2024 the author(s), published by De Gruyter, Berlin/Boston
This work is licensed under the Creative Commons Attribution 4.0 International License.
Artikel in diesem Heft
- Solar photovoltaic-integrated energy storage system with a power electronic interface for operating a brushless DC drive-coupled agricultural load
- Analysis of 1-year energy data of a 5 kW and a 122 kW rooftop photovoltaic installation in Dhaka
- Reviews
- Real yields and PVSYST simulations: comparative analysis based on four photovoltaic installations at Ibn Tofail University
- A comprehensive approach of evolving electric vehicles (EVs) to attribute “green self-generation” – a review
- Exploring the piezoelectric porous polymers for energy harvesting: a review
- A strategic review: the role of commercially available tools for planning, modelling, optimization, and performance measurement of photovoltaic systems
- Comparative assessment of high gain boost converters for renewable energy sources and electrical vehicle applications
- A review of green hydrogen production based on solar energy; techniques and methods
- A review of green hydrogen production by renewable resources
- A review of hydrogen production from bio-energy, technologies and assessments
- A systematic review of recent developments in IoT-based demand side management for PV power generation
- Research Articles
- Hybrid optimization strategy for water cooling system: enhancement of photovoltaic panels performance
- Solar energy harvesting-based built-in backpack charger
- A power source for E-devices based on green energy
- Theoretical and experimental investigation of electricity generation through footstep tiles
- Experimental investigations on heat transfer enhancement in a double pipe heat exchanger using hybrid nanofluids
- Comparative energy and exergy analysis of a CPV/T system based on linear Fresnel reflectors
- Investigating the effect of green composite back sheet materials on solar panel output voltage harvesting for better sustainable energy performance
- Electrical and thermal modeling of battery cell grouping for analyzing battery pack efficiency and temperature
- Intelligent techno-economical optimization with demand side management in microgrid using improved sandpiper optimization algorithm
- Investigation of KAPTON–PDMS triboelectric nanogenerator considering the edge-effect capacitor
- Design of a novel hybrid soft computing model for passive components selection in multiple load Zeta converter topologies of solar PV energy system
- A novel mechatronic absorber of vibration energy in the chimney
- An IoT-based intelligent smart energy monitoring system for solar PV power generation
- Large-scale green hydrogen production using alkaline water electrolysis based on seasonal solar radiation
- Evaluation of performances in DI Diesel engine with different split injection timings
- Optimized power flow management based on Harris Hawks optimization for an islanded DC microgrid
- Experimental investigation of heat transfer characteristics for a shell and tube heat exchanger
- Fuzzy induced controller for optimal power quality improvement with PVA connected UPQC
- Impact of using a predictive neural network of multi-term zenith angle function on energy management of solar-harvesting sensor nodes
- An analytical study of wireless power transmission system with metamaterials
- Hydrogen energy horizon: balancing opportunities and challenges
- Development of renewable energy-based power system for the irrigation support: case studies
- Maximum power point tracking techniques using improved incremental conductance and particle swarm optimizer for solar power generation systems
- Experimental and numerical study on energy harvesting performance thermoelectric generator applied to a screw compressor
- Study on the effectiveness of a solar cell with a holographic concentrator
- Non-transient optimum design of nonlinear electromagnetic vibration-based energy harvester using homotopy perturbation method
- Industrial gas turbine performance prediction and improvement – a case study
- An electric-field high energy harvester from medium or high voltage power line with parallel line
- FPGA based telecommand system for balloon-borne scientific payloads
- Improved design of advanced controller for a step up converter used in photovoltaic system
- Techno-economic assessment of battery storage with photovoltaics for maximum self-consumption
- Analysis of 1-year energy data of a 5 kW and a 122 kW rooftop photovoltaic installation in Dhaka
- Shading impact on the electricity generated by a photovoltaic installation using “Solar Shadow-Mask”
- Investigations on the performance of bottle blade overshot water wheel in very low head resources for pico hydropower
- Solar photovoltaic-integrated energy storage system with a power electronic interface for operating a brushless DC drive-coupled agricultural load
- Numerical investigation of smart material-based structures for vibration energy-harvesting applications
- A system-level study of indoor light energy harvesting integrating commercially available power management circuitry
- Enhancing the wireless power transfer system performance and output voltage of electric scooters
- Harvesting energy from a soldier's gait using the piezoelectric effect
- Study of technical means for heat generation, its application, flow control, and conversion of other types of energy into thermal energy
- Theoretical analysis of piezoceramic ultrasonic energy harvester applicable in biomedical implanted devices
- Corrigendum
- Corrigendum to: A numerical investigation of optimum angles for solar energy receivers in the eastern part of Algeria
- Special Issue: Recent Trends in Renewable Energy Conversion and Storage Materials for Hybrid Transportation Systems
- Typical fault prediction method for wind turbines based on an improved stacked autoencoder network
- Power data integrity verification method based on chameleon authentication tree algorithm and missing tendency value
- Fault diagnosis of automobile drive based on a novel deep neural network
- Research on the development and intelligent application of power environmental protection platform based on big data
- Diffusion induced thermal effect and stress in layered Li(Ni0.6Mn0.2Co0.2)O2 cathode materials for button lithium-ion battery electrode plates
- Improving power plant technology to increase energy efficiency of autonomous consumers using geothermal sources
- Energy-saving analysis of desalination equipment based on a machine-learning sequence modeling