Techno-economic assessment of battery storage with photovoltaics for maximum self-consumption
-
Qusay Hassan
 ,
Majid K. Abbas
,
Majid K. Abbas

Abstract
The study provided a techno-economic optimization technique for acquiring the ideal battery storage capacity in conjunction with a solar array capable of meeting the desired residential load with high levels of self-sufficiency. Moreover, the viability of a proposed photovoltaic battery system was evaluated. With a resolution of one minute, the annual energy consumption, irradiance, and ambient temperature for 2021 have been measured. Simulations of a stationary economic model are run from 2021 to 2030. Based on the experimental evaluation of the annual energy consumption, which was 3755.8 kWh, the study reveals that the photovoltaic array with a capacity of 2.7 kWp is capable of producing an annual energy production of 4295.5 kWh. The optimal battery capacity determined was 14.5 kWh, which can satisfy 90.2% of self-consumption at the cost of energy $0.25/kWh. Additionally, two third-order polynomial relationships between self-consumption and net present costs and energy cost were established.
1 Introduction
By reducing greenhouse gas emissions from the energy sector, solar energy is viewed as a strategy to address climate change (Hoesung and Fatih 2020). The worldwide solar energy business rebounded well in 2019, with total photovoltaic (PV) installations reaching 627 GW (Nowak 2014). This capacity reduces global electricity-related CO2 emissions by 5% (Jäger-Waldau 2020) and amounts for around 3% of global electricity use. Significant contributors to the growth of the PV sector include the availability of subsidies and the general decline in prices. Subsidies are emerging to compensate for the capital-intensive nature of PV projects. The injecting price is the injection compensations paid by distribution center network operators. Today or in the near future, the wholesale rate will be lower than the retail rate, which will encourage PV self-consumption. The use of battery (BA) storage, which might boost PV self-consumption while correcting real-time imbalances caused by forecasting mistakes, is one of the approaches that enables the continuous spread of PV systems (Han and Hug 2020). In the past, high pricing and restricted use case designs were the most significant barriers to battery installations. Batteries are currently regarded as one of the most promising strategies to transition to renewable energy sources. This is due to the rapid decline in battery prices over the past decade, which is mostly attributable to advancements in the electric car industry (Stephan et al. 2016).
Middle Eastern consumption of energy, climate control, and water heating is increasing due to the region fast expanding population and economic growth, which is fostering rapid urbanization. This situation exacerbates geopolitical, economic, and environmental risks. In the vast majority of cases where renewable energy rules exist, their fundamental objective is to reduce dependency on fossil fuels, limit their energy use, and meet the socioeconomic demands of the people (Taher et al. 2021). Nonetheless, these nations are concerned about the substantial increase in the domestic use of fossil fuels for electricity generation in buildings and other sectors (Ghodbane et al. 2019). In reality, Greenhouse Gases are mostly related with the demand for electrical power to meet this energy demand. In addition, they are experiencing tremendous economic and demographic growth that will have future negative consequences. The annual increase in energy usage in these locations ranges from 3 to 8 percent (Mesia 2020).
This region contains around 60% and 45% of the world oil and natural gas reserves, making it one of the largest producers of oil and natural gas. Thus, its energy mix remains dominated by fossil fuels (coal, oil and gas). The Middle East must deploy alternate energy security measures in response to some of these energy concerns. However, oil-producing nations are penalized by subsidies for fossil fuels that result in enormous waste, especially considering the finite nature of these energies. Yet, the renewable nature of energy sources (solar and wind) offers the possibility of producing clean energy. While extensive investments in the production capacity of these green sources are necessary for them to have a significant impact (Solargis).
1.1 Literature review
In recent years, a considerable amount of research has been conducted on the techno-economic evaluations of PV/BA systems, particularly in Germany, which has favorable rules for renewable energy. Allwyn et al. (2022) optimized a PV/BA system for the street lighting system at Sultan Qaboos University in Oman. Comparing the life cycle cost analysis and cost per for two PV and battery configurations, one with a high capacity of PV/BA and the other with a reduced capacity of PV/BA, helps to establish the techno-economic feasibility of installing the system in Oman. Utilizing experimental data, MATLAB is used to determine the optimal size of a component. The findings showed that the cost per kilowatt-hour of energy generated by the large panel/battery system was $/0.08 compared to $/19.9 for the modest system capacity. In addition, the findings suggest that the conversion of a grid-connected, 8.6-km-long street lighting system with 285 400-W lights to a PV/BA system with an 80-W bulb would reduce annual CO2 emissions by 133,600 tonnes. Gul et al. (2022) created an innovative mathematical model for the PV/BT system in order to optimize power generation and balance load demand. Using mathematical optimization software, the System Advisor Model examines energy production, energy consumption, and economic performance, including capital cost, total investment, net present cost (NPC), and project levelized cost of energy (COE). Innovative is the use of decentralized load centres to trade power with other communities. The constructed model is grid-connected to increase system flexibility, reliability, and environmental protection as a result of a reduction in CO2 emissions. The analysis revealed that the yearly energy expenses without the system was 552,477 dollars, but the proposed solution reduced these costs by 45 percent, to 303,927 dollars. The constructed system had a net capital cost of $2,046,993, a net present value of $971,200, and a payback time projected to be 8.8 years. Environmental study indicates that the model annual CO2 emissions have decreased by 1150 tons. Li et al. (2022) investigate the techno-economic elements of hybrid renewable energy design options that serve the multi-vector energy demand, i.e. electricity, hydrogen, and heat, in four diverse Chinese sites. A two-stage optimization technique is proposed: First, the HOMER software is used to find every feasible scenario that satisfies criteria at the lowest possible cost; Then, a Multi-Criteria Decision-Making technique is used to evaluate all feasible circumstances in order to determine the optimal solution for monitoring economic and environmental factors. The authors calculate the best combination of the following technologies: PV/BA and PV/WT (Wind turbine). In places where solar and wind energy are abundant, the results suggest that the PV/WT combination produces more electricity than either PV or WT alone. Ashtiani et al. (2020) illustrate how backup PV/BA systems might reduce power costs, even in countries where energy is low and subsidized. The NPC and COE of the on-grid PV/BA system are 15.6% and 16.8% more than in the non-renewable scenario, respectively. The NPC and COE variables were calculated and compared to two different optimization methods in order to validate the suggested approach and assess the accuracy of the findings. Multiple cities were analyzed to compare the results, and the fact that the numbers were comparable indicated that the technique is successful regardless of the local climate. In addition, sensitivity analysis based on climatic data from several cities, varying load requirements, and PV prices helped determine the optimal system size for the economy. Ma et al. (2014) studied a PV/BA and a PV/WT and found that, compared to PV and WT alone, a hybrid of the two with BA power output may reduce the NPC by between 9 and 11 percent. Merei et al. (2016) give self-sustainability-optimization results for a supermarket in Aachen, Germany. Optimization of generation is achieved by using exact experimental load and solar data. In addition, techno-economic and sensitivity analyses have been performed to analyze the effects of varying PV system capacity, PV system pricing, and interest rates. In addition, numerous battery sizes and costs have been investigated and analyzed for the 2015 and 2025 scenarios in order to improve self-sufficiency. The findings show that the self-consumption of PV energy via the installation of a PV system may reduce electricity costs. Moreover, if battery costs can be reduced below €200/kWh in the future, the combination of battery energy storage and PV systems might further reduce electricity prices. Shabani et al. (2021) investigate the implications of the two battery topologies on the size of a PV/BA system. The first configuration is based on a conventional, straightforward battery model and control strategy that excludes dynamic behavior from its representation of the battery status. The second configuration is determined by a complex battery model that calculates battery properties under various operating conditions. The results revealed that the optimization of a suggested system based on the first configuration required alternatives with a higher life cycle cost and bigger battery capacity than the second configuration in order to achieve the same degree of self-sufficiency. Moreover, given the same design parameters, the system optimization based on the second configuration supplies the end-user with more power, resulting in a higher self-sufficiency ratio than when the system is simulated using the first configuration. This research reveals that a complete battery model with adequate efficiency is technologically superior and results in a more accurate battery size. Jamroen (2022) seeks to determine the optimal techno-economic scale of a floating solar PV/BA energy system for powering an aquaculture aeration and monitoring system, while retaining the PV module and BA weights in mind. System dependability was evaluated in order to evaluate the energy system capacity to provide electricity to ensure its continuing operation. In addition, the levelized cost of energy was analyzed to determine the cost-effectiveness of the energy system designs. The PV/BA system is the best technically and economically feasible design for both daytime and nocturnal ventilation circumstances, according to the findings. Hassan et al. (2022a) assessed the economic feasibility of a PV/BA system to power a home with a high proportion of renewable energy. The investigation revealed that the suggested solution was economically viable in terms of energy costs. Abbas et al. (2021) investigated the practicality of a PV/BA system for supplying electrical energy for irrigation. The suggested system size was determined over the course of many summer days. Environmentally and economically, an independent PV/BA system is a smart option to power an irrigation system, according to the research. Hassan et al. (2022b) designed a PV/BA system to power pump-based diffuser aerators on a modest scale in rural locations. The results indicated that the system safety factor was sufficient to power the aerators. In line with Uddin et al. (2022), a techno-economic model for the electrical characteristics of the modeled PV/BA energy system has been constructed using HOMER and MATLAB/Simulink. Techno-economic and ecological studies are given throughout to establish the microgrid feasibility and usefulness. The simulations demonstrate a remarkable connection, and the best COE for the power plant is predicted to be $18.3. Researchers predict that 2500 residential scooters might cut yearly CO2 emissions by 466.56 tonnes. Hassan (2022) determined the optimal size of a PV/BA system to satisfy the electrical needs of residential applications. During the day, the PV array fed the electrical load and charged the batteries, while at night, the battery fed the load. The optimal system size was attained with the cheapest COE. Jaszczur et al. (2020) examined the effectiveness of a PV/BA system for electricity in terms of both cost and environmental impact. The economic feasibility analysis revealed that the suggested system could generate power for about $0.13 per kilowatt-hour, which is much cheaper than the cost of conventional electricity. Ceran et al. (2021) provide a computer method for the techno-economic assessment of PV systems with and without energy storage devices. A mathematical model used to calculate the economic assessment of PV system integration. Using the offered computational approaches, five instances containing no storage system, two scenarios employing lithium-ion batteries, and two cases involving flow batteries were studied. In comparison to comparable PV systems with batteries, the PV system using lithium cobalt oxide batteries had a levelized power cost of 3.40 cents per kilowatt-hour. An integrated system with lithium-ion batteries was deemed the most feasible and cost-effective alternative, according to the research. The full analysis of the PV system with energy storage options illustrates the far-reaching applicability of this technology.
There are numerous more advantages to use solar energy to power homes and residential areas and to support the grid. Using renewable energy sources to create electricity contributes to environmental preservation, which a company could leverage to improve its image. This article examines the influence of economic visibility in comparison to household that consumes 3760 kWh annually. In addition, a technical and economic analysis of the installation of a photovoltaic system with and without battery storage between 2021 and 2030 was conducted, taking into account a number of influencing factors. This article focuses mostly on addressing issues regarding the optimal size of the battery that can be incorporated into a PV system and the optimal combination of PV system size and battery capacity for maximum self-sufficiency.
The study presents a novel approach to optimizing the deployment of battery storage systems in combination with photovoltaic panels to achieve maximum self-consumption of generated energy. Specifically, the authors use a simulation model that considers both the technical and economic aspects of the system to analyze the impact of different battery capacities based on the PV panel capacity and energy management strategies on self-consumption rates. Additionally, the study provides a comprehensive analysis of the impact of different factors on the performance of the system to provide insights into the most effective ways to deploy battery storage systems in combination with PV panels for maximum self-consumption.
2 System modelling
The concept under study is a PV/BA on-grid system in which the batteries are recharged by the PV array during the day and fed the required load at night and on cloudy days. The most important criterion for a dependable system is that the energy stored in the batteries can support the required load with the maximum level of self-sufficiency. Consequently, system modelling entails optimising the number of batteries to extract adequate storage power to fulfil demand with the optimal number of batteries to store the required energy. Several terminologies are used in the literature to evaluate the dependability of PV/BA energy systems Figure 1. In this study, numerical simulations are used to determine the battery capacity and assess the dependability of the proposed system for supplying renewable energy at the highest efficiency and lowest cost.
The technological and economic specifications of the system components presented in Table 1.
The technological and economic specifications of the proposed system components.
| Component | Rated power | Model | Cost | Ref. |
|---|---|---|---|---|
| PV module | 0.45 kWp | Sunceco | $110 | Monocrystalline (2022) |
| Battery | 200 Ah/2.4 kWh | Visionbat | $200 | Battery |
| Converter | 8 kW | Absopulse | $1500 | Absopulse Inverter |
2.1 Experimental measurements
The relevant experimental measurements of load, irradiance, and ambient temperature were taken with an accuracy of one minute over the course of one year in 2021. The and global horizontal irradiation and diffused horizontal irradiation components of solar radiation were measured by using Kipp Zonen CM21 pyranometers located in Diyala, Iraq (33.7733° N, 45.1495° E) at the University of Diyala campus weather measurement station as presented in Figure 2. The most crucial part of such a design system is the annual electrical energy, and the energy delivered by the PV panel is dependent on daily fluctuations in solar irradiance and ambient temperature.
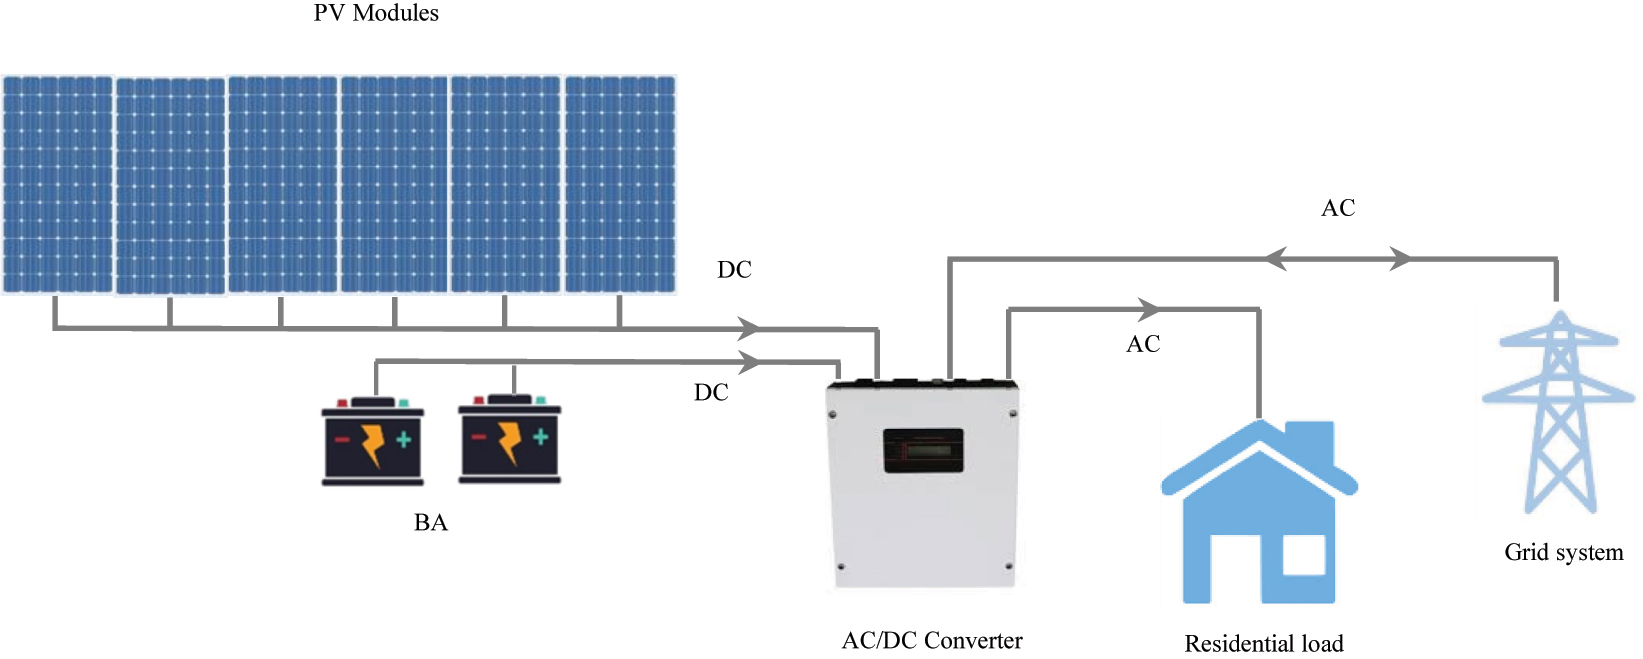
Schematic of the proposed PV/BA energy system.
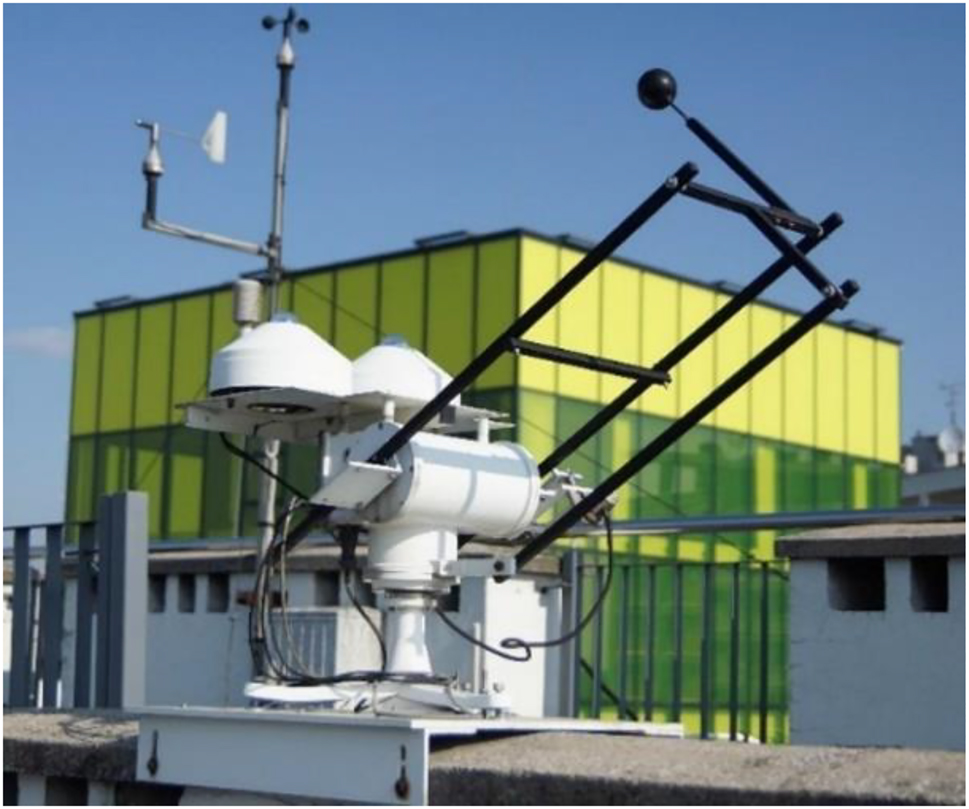
Solar radiation measurement station.
Figure 3 depicts the daily electrical load, solar irradiance, and ambient temperature readings for four chosen seasonal days. Table 2 displays the average daily use of energy, solar irradiance, and ambient temperature for four days. The energy use fluctuates on a daily basis. It was greatest in January 05th, by about 12.8 kWh and lowest in October 05th, whereas solar irradiance and ambient temperature were lowest in January and October, and highest in the spring and summer. The monthly and yearly averages for experiment load, irradiance, and ambient temperature are shown on Figure 4. The largest monthly energy use was in April, at 1271.71 kWh, and the lowest was in October, at 635.55 kWh. The average daily energy consumption by about 10.4 kWh, and the total annual consumption was 3758 kWh. Solar irradiance and ambient temperature were lowest in the winter and greatest in the summer, with yearly averages of 4.6 kWh/m2/day and 23.7 °C, respectively (refer Figure 3).
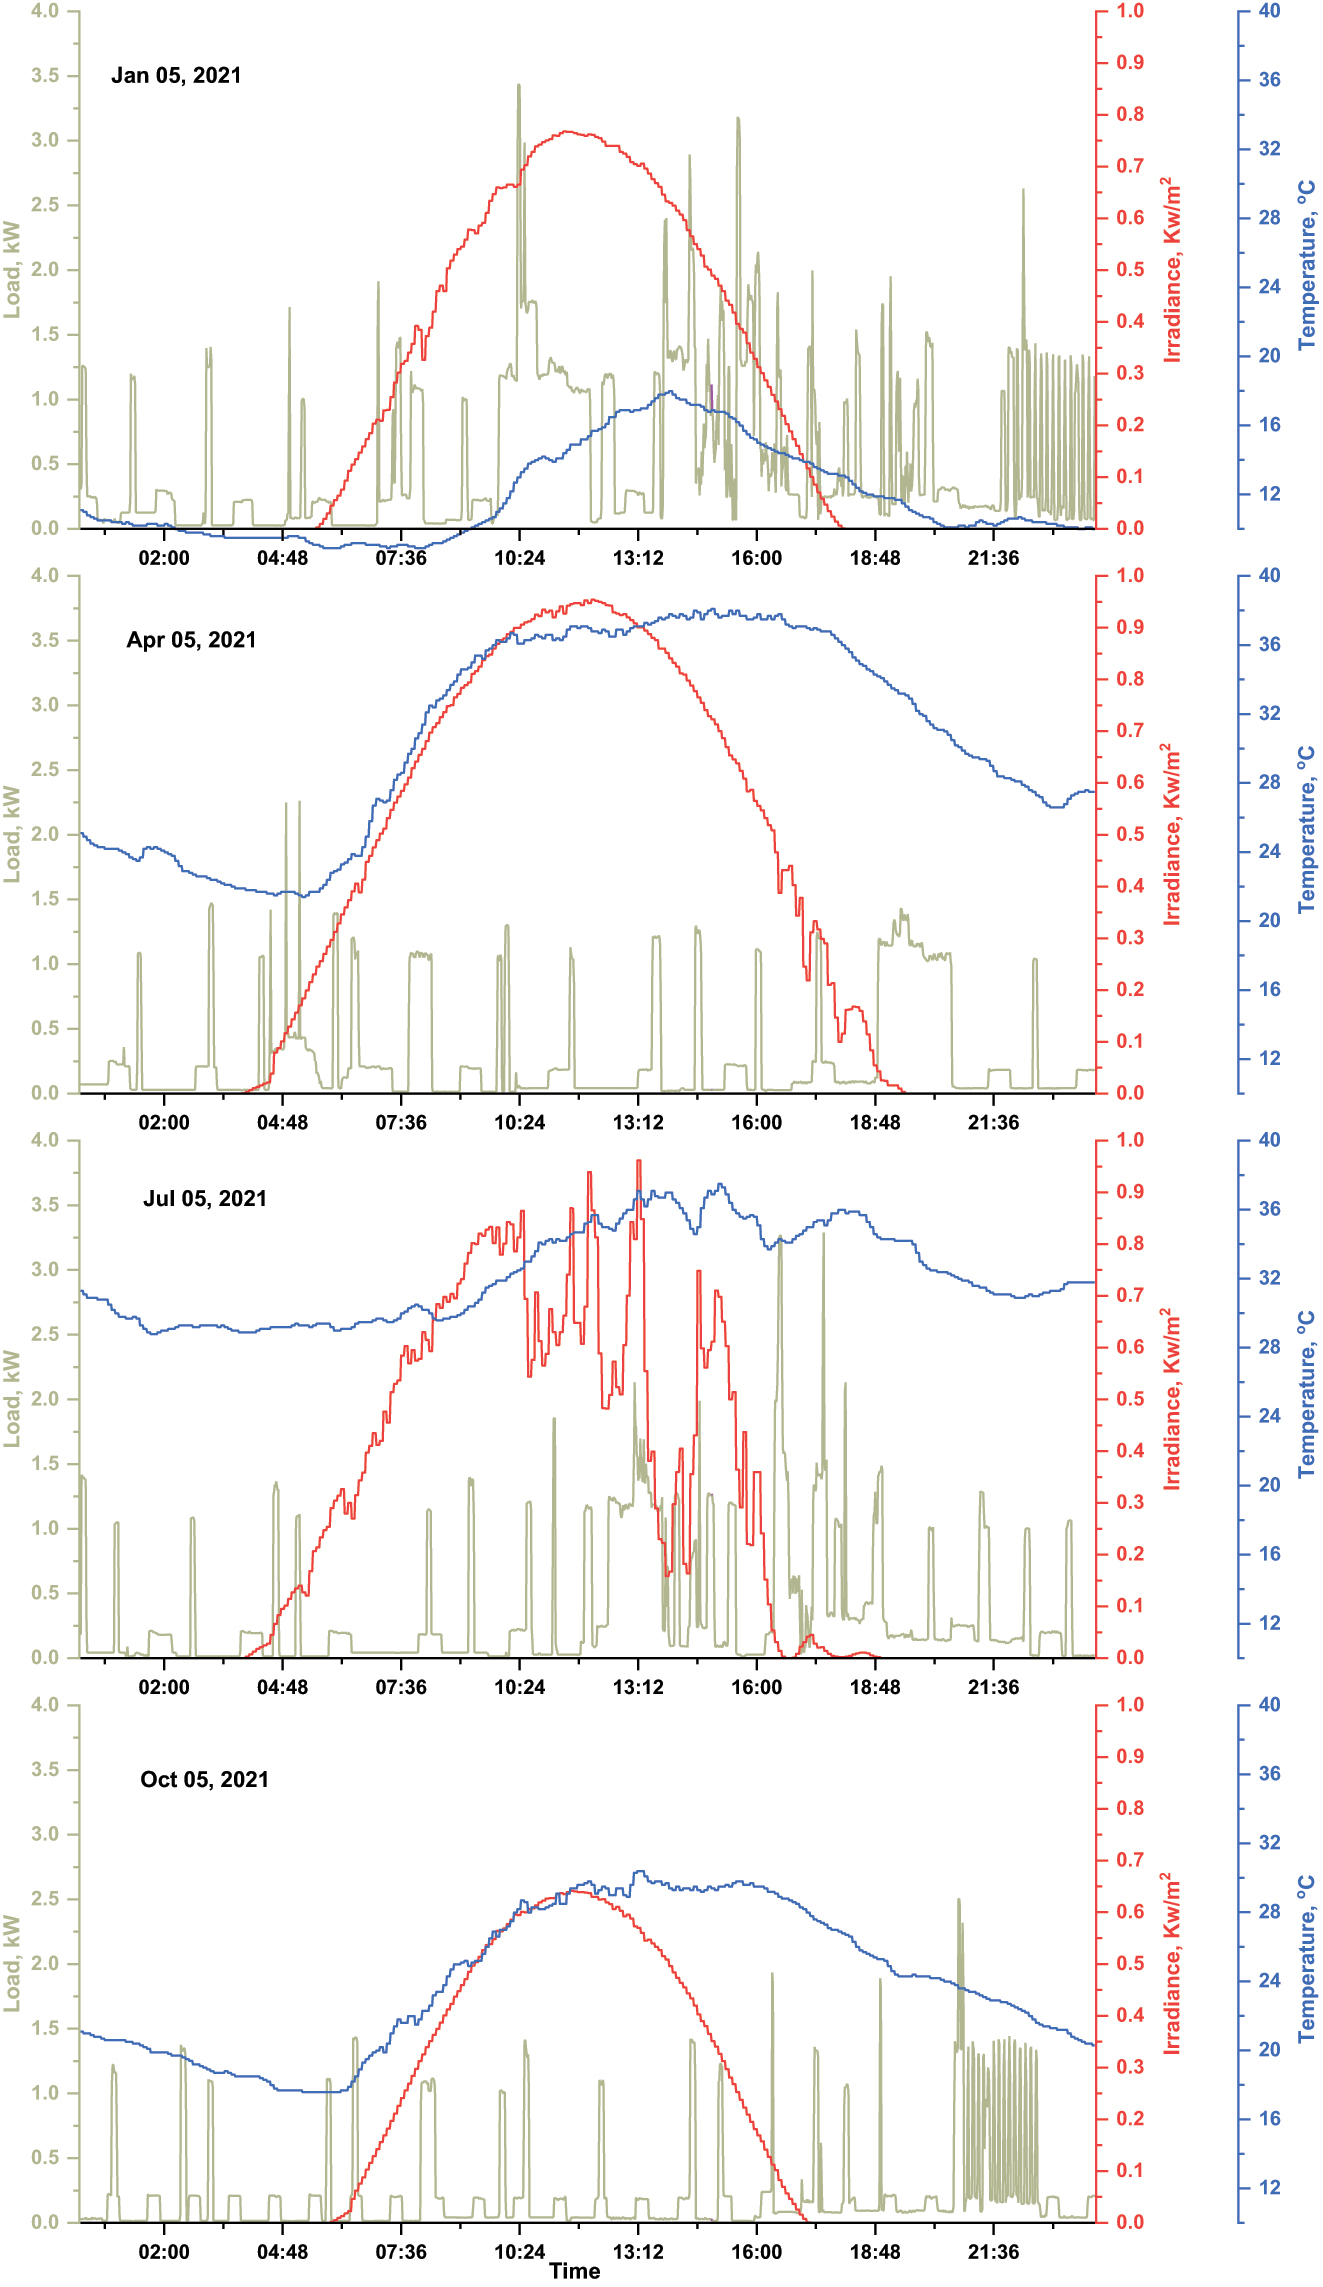
Experiment load, solar irradiance and ambient temperature data for four selected days through the year.
The daily energy, irradiance ad ambient temperature for four selected days.
| Day | Energy (kWh) | Irradiance (kWh/m2) | Temp. (oC) |
|---|---|---|---|
| Jan 05 | 12.84 | 3.62 | 11.8 |
| Apr 05 | 6.64 | 8.71 | 30.7 |
| Jul 05 | 8.51 | 6.08 | 32.2 |
| Oct 05 | 5.53 | 4.34 | 23.9 |
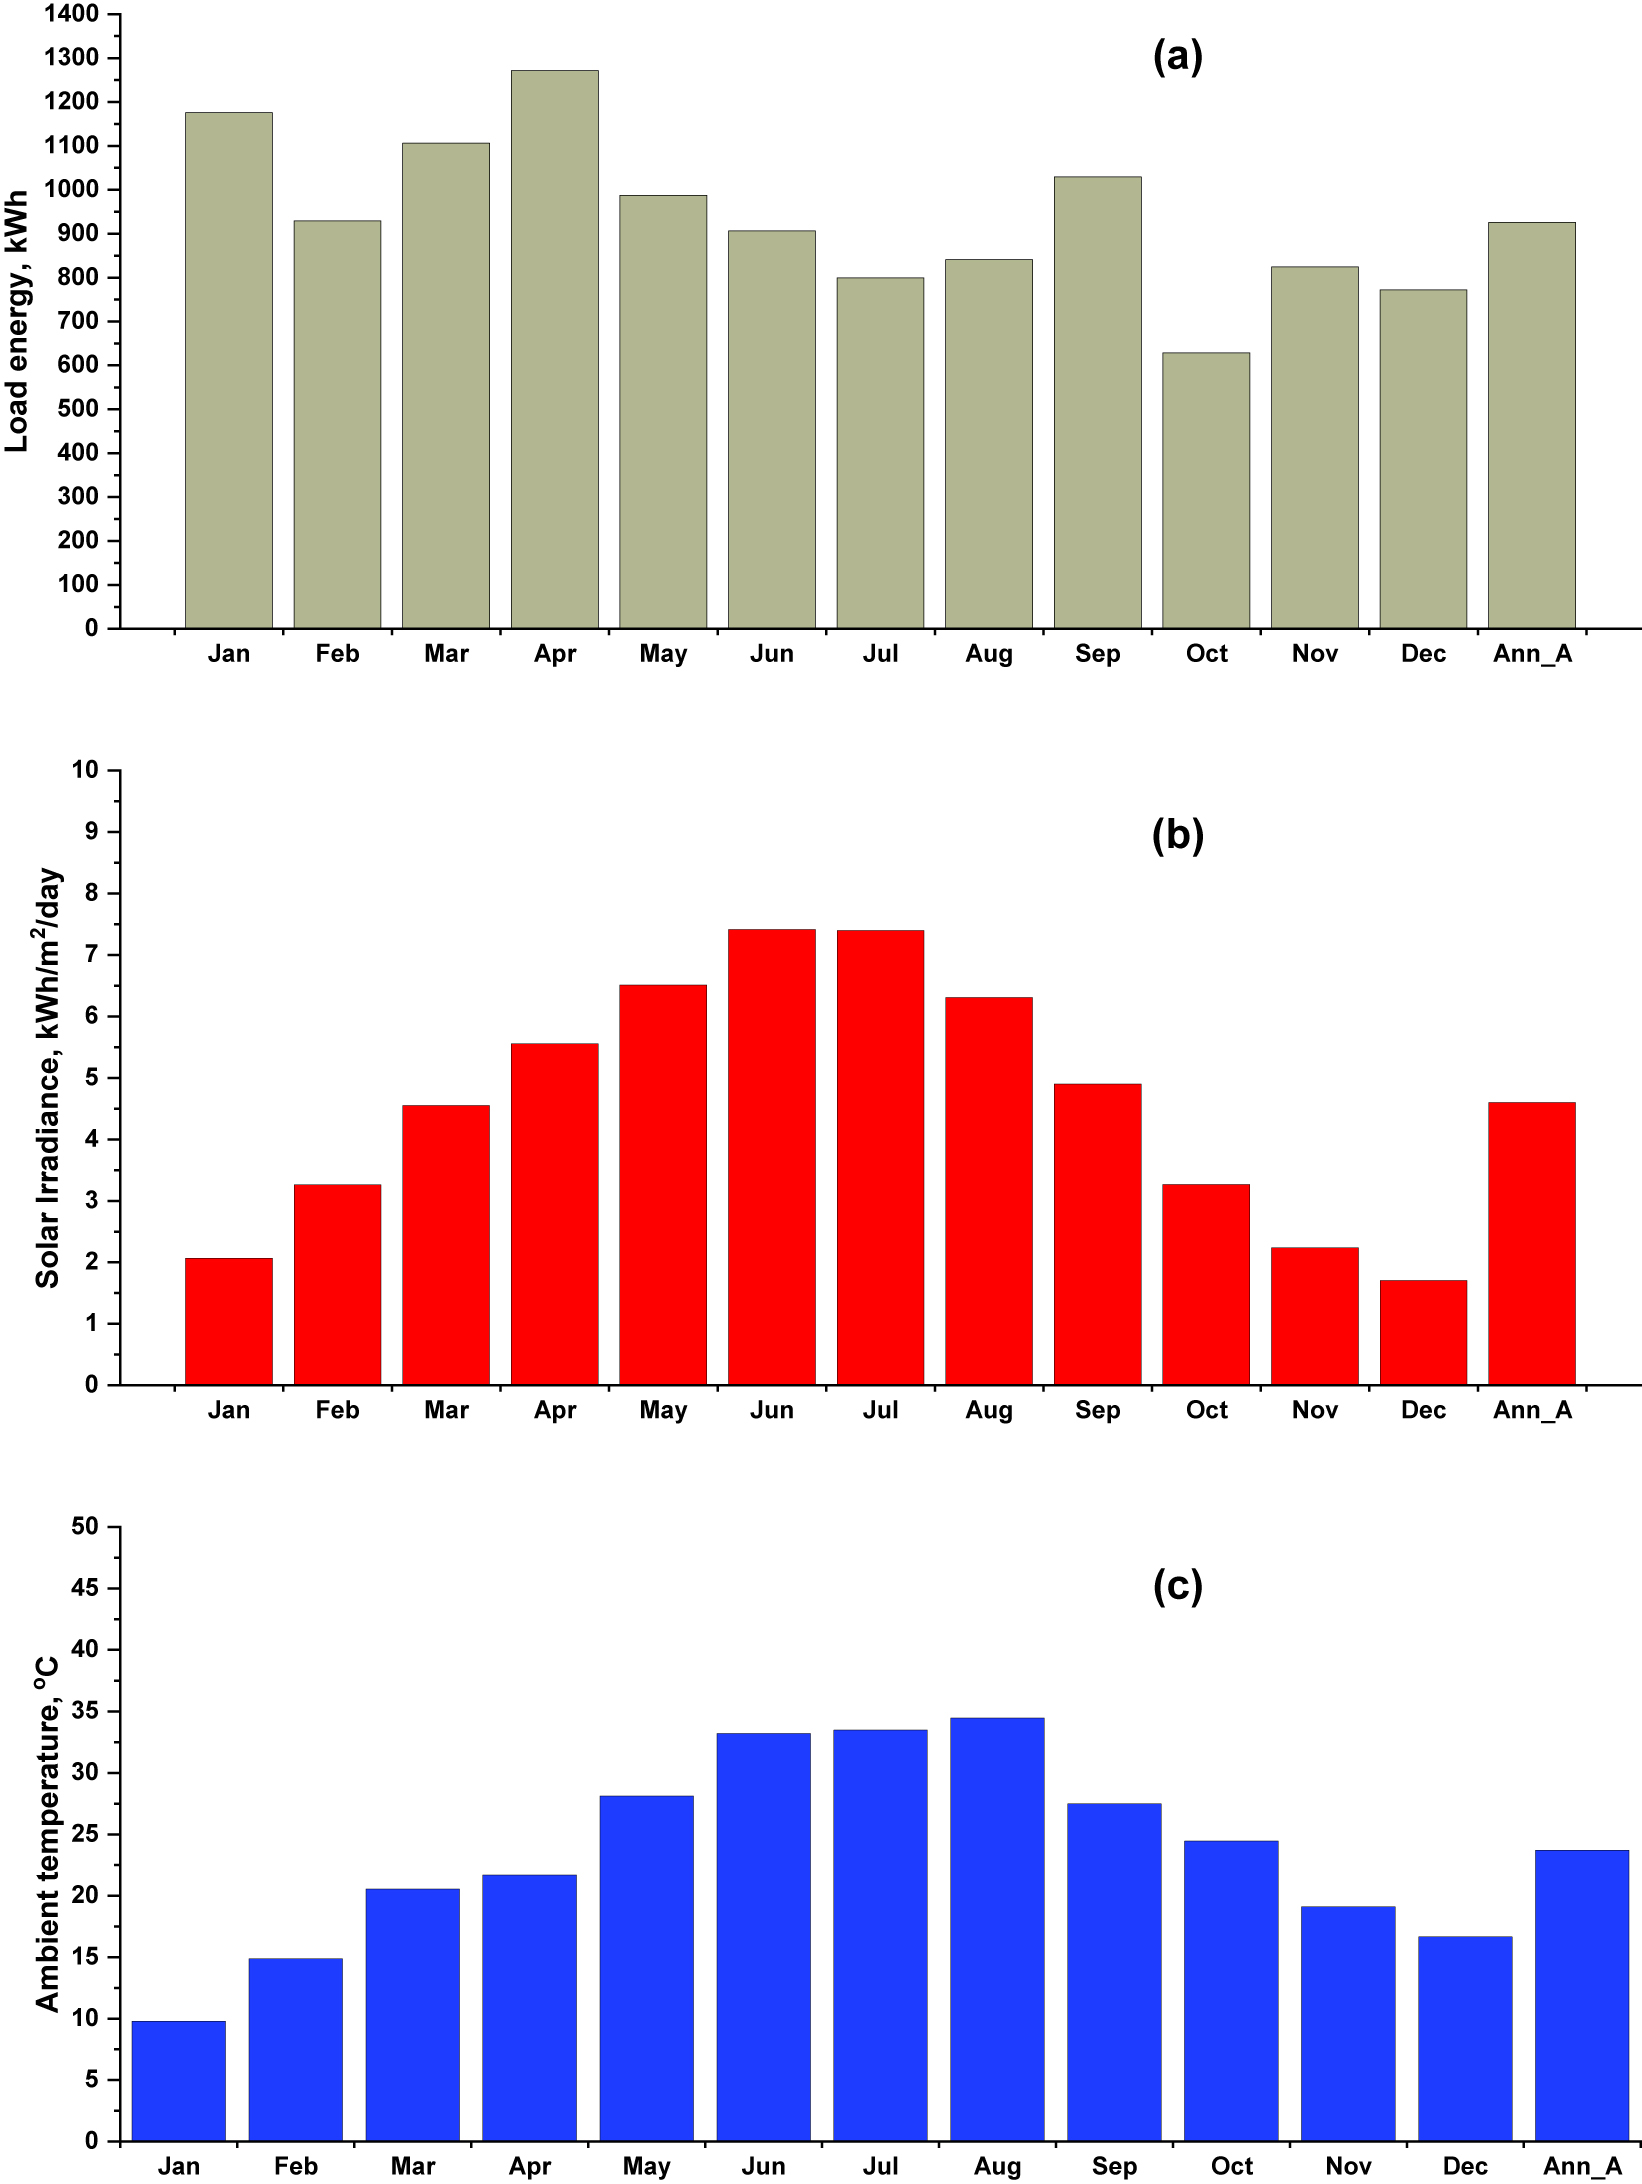
Monthly average and annual experiment (a) load, (b) irradiance, and (c) ambient temperature.
2.2 Energy flow distribution
The proposed system energy consumption in (kWh) can be expressed as:
where E T represents the total energy usage, E PV is the energy produced by the PV array, E BA , is the energy stored in the battery, and E G is the energy drawn from the grid.
The PV array energy can be obtained as (Hassan et al. 2022c):
where C PV represents the PV array capacity, η PV represents the PV array derating factor (%), H T and H T, STC represents the incident solar radiation and solar radiation at standard condition, α P represents the module cell temperature coefficient of power (Hassan et al. 2022d), T C and T C,STC represents the module cell temperature and cell temperature at standard condition respectively.
The array performance ratio is calculated using the following formula:
The limitation applies to the battery stored energy can be expressed as:
where E BA,min , and E BA,max is the minimum and maximum batteries energy level respectively.
Considering that throughout sunny days the storage batteries are fully charged, the energy stored is used to supply the load at night, however during partially cloudy days the storage batteries supply the load with available energy and the required energy is provided by the grid can be expressed as (Hassan et al. 2022e):
the maximum permitted battery energy level can be expressed as:
where N BA is the number of batteries, and t is the maximum batteries depth of discharge.
The minimum permitted battery energy level can be expressed as (Jaszczur et al. 2018):
The simultaneous load-balancing formula, which describes the energy transfer between system components, is as follows.
2.3 Technical and economic indicators
The following section describes the technical metrics for self-consumption rate and self-sufficiency rates, as well as the economic indicator that will be utilised in the subsequent study.
2.3.1 Rate of self-consumption (E SC )
The self-sufficiency indicator (self-consumption) is defined in (Hassan et al. 2019) as the proportion of load profiles and generation profiles that cross, with the values can reported in kWh as follows:
The percentage of E SC is given as:
where E R is the energy produced by (PV + BA charge – BA discharge) and E Load denotes the electrical energy used (kWh), E From grid denotes the energy drawn from the grid (kWh), and E Fed to grid is the energy fed to the grid (kWh), n denotes the number of simulation steps.
2.3.2 Cost of electricity
The cost of electricity (COE) is computed using the “discounting” approach, which equals the ratio of projected total lifetime cost to lifetime generating output. Importantly, numerous versions of COE metrics have been established in recent years, particularly for hybrid systems, and the conclusions may not be directly comparable due to the varying assumptions and COE formulae they include. Even though the COE value is a good way to compare the results of different studies, readers should be careful when using these values (Jaszczur et al. 2019; Styszko et al. 2019).
where A cost is the total annualized cost of the system, E AC,DC is the annual AC, DC primary load served, and E grid sales is the annual energy sales to grid.
The total NPC can be determined using the following formula (Jaszczur et al. 2021; Javed et al. 2019; Javed et al. 2020; Shafiullah 2016; Uddin et al. 2020; Zhang et al. 2020):
where, S c is the system annual cost ($/year), R is recovery factor capital, i is the annual interest rate (%) and P s is lifespan for project (year).
3 Results and discussion
This study optimises the PV/BA energy system for residential applications using a 2.7 kW PV array and various battery sizes. The PV array yield and performance ratio is evaluated by about 76.1%. The number of batteries is adjusted using a MATLAB programme for each battery to reach the optimal capacity to provide the most self-sustaining and lowest energy cost. The Section 2 equations are used for independent optimization. The PV array was positioned at the optimum annual adjustment (tilt angle β = 30, azimuth angle α = 0°) south direction for the annual highest incident solar radiation at the investigated site (latitude 33.7733° N, longitude 45.1495° E), where the simulation process was conducted at 1-min resolution. The project life span is nine years until 2030, and the economic assessment is made based on the Iraqi regulation (buy from the grid at $0.33/kWh and sell to the grid at $0.11/kWh), which means the annual interest rate is 6%.
Figure 5 shows the daily power flow at different battery capacities for the day of Jan 05, 2022. The PV array generated about 15.172 kWh and the energy consumption was 12.84 kWh. The energy from the grid decreases by the battery capacity that compensates for the desired load. At the same time, the energy fed to the grid is decreased by increasing bakery capacity, which means more energy for battery charging.
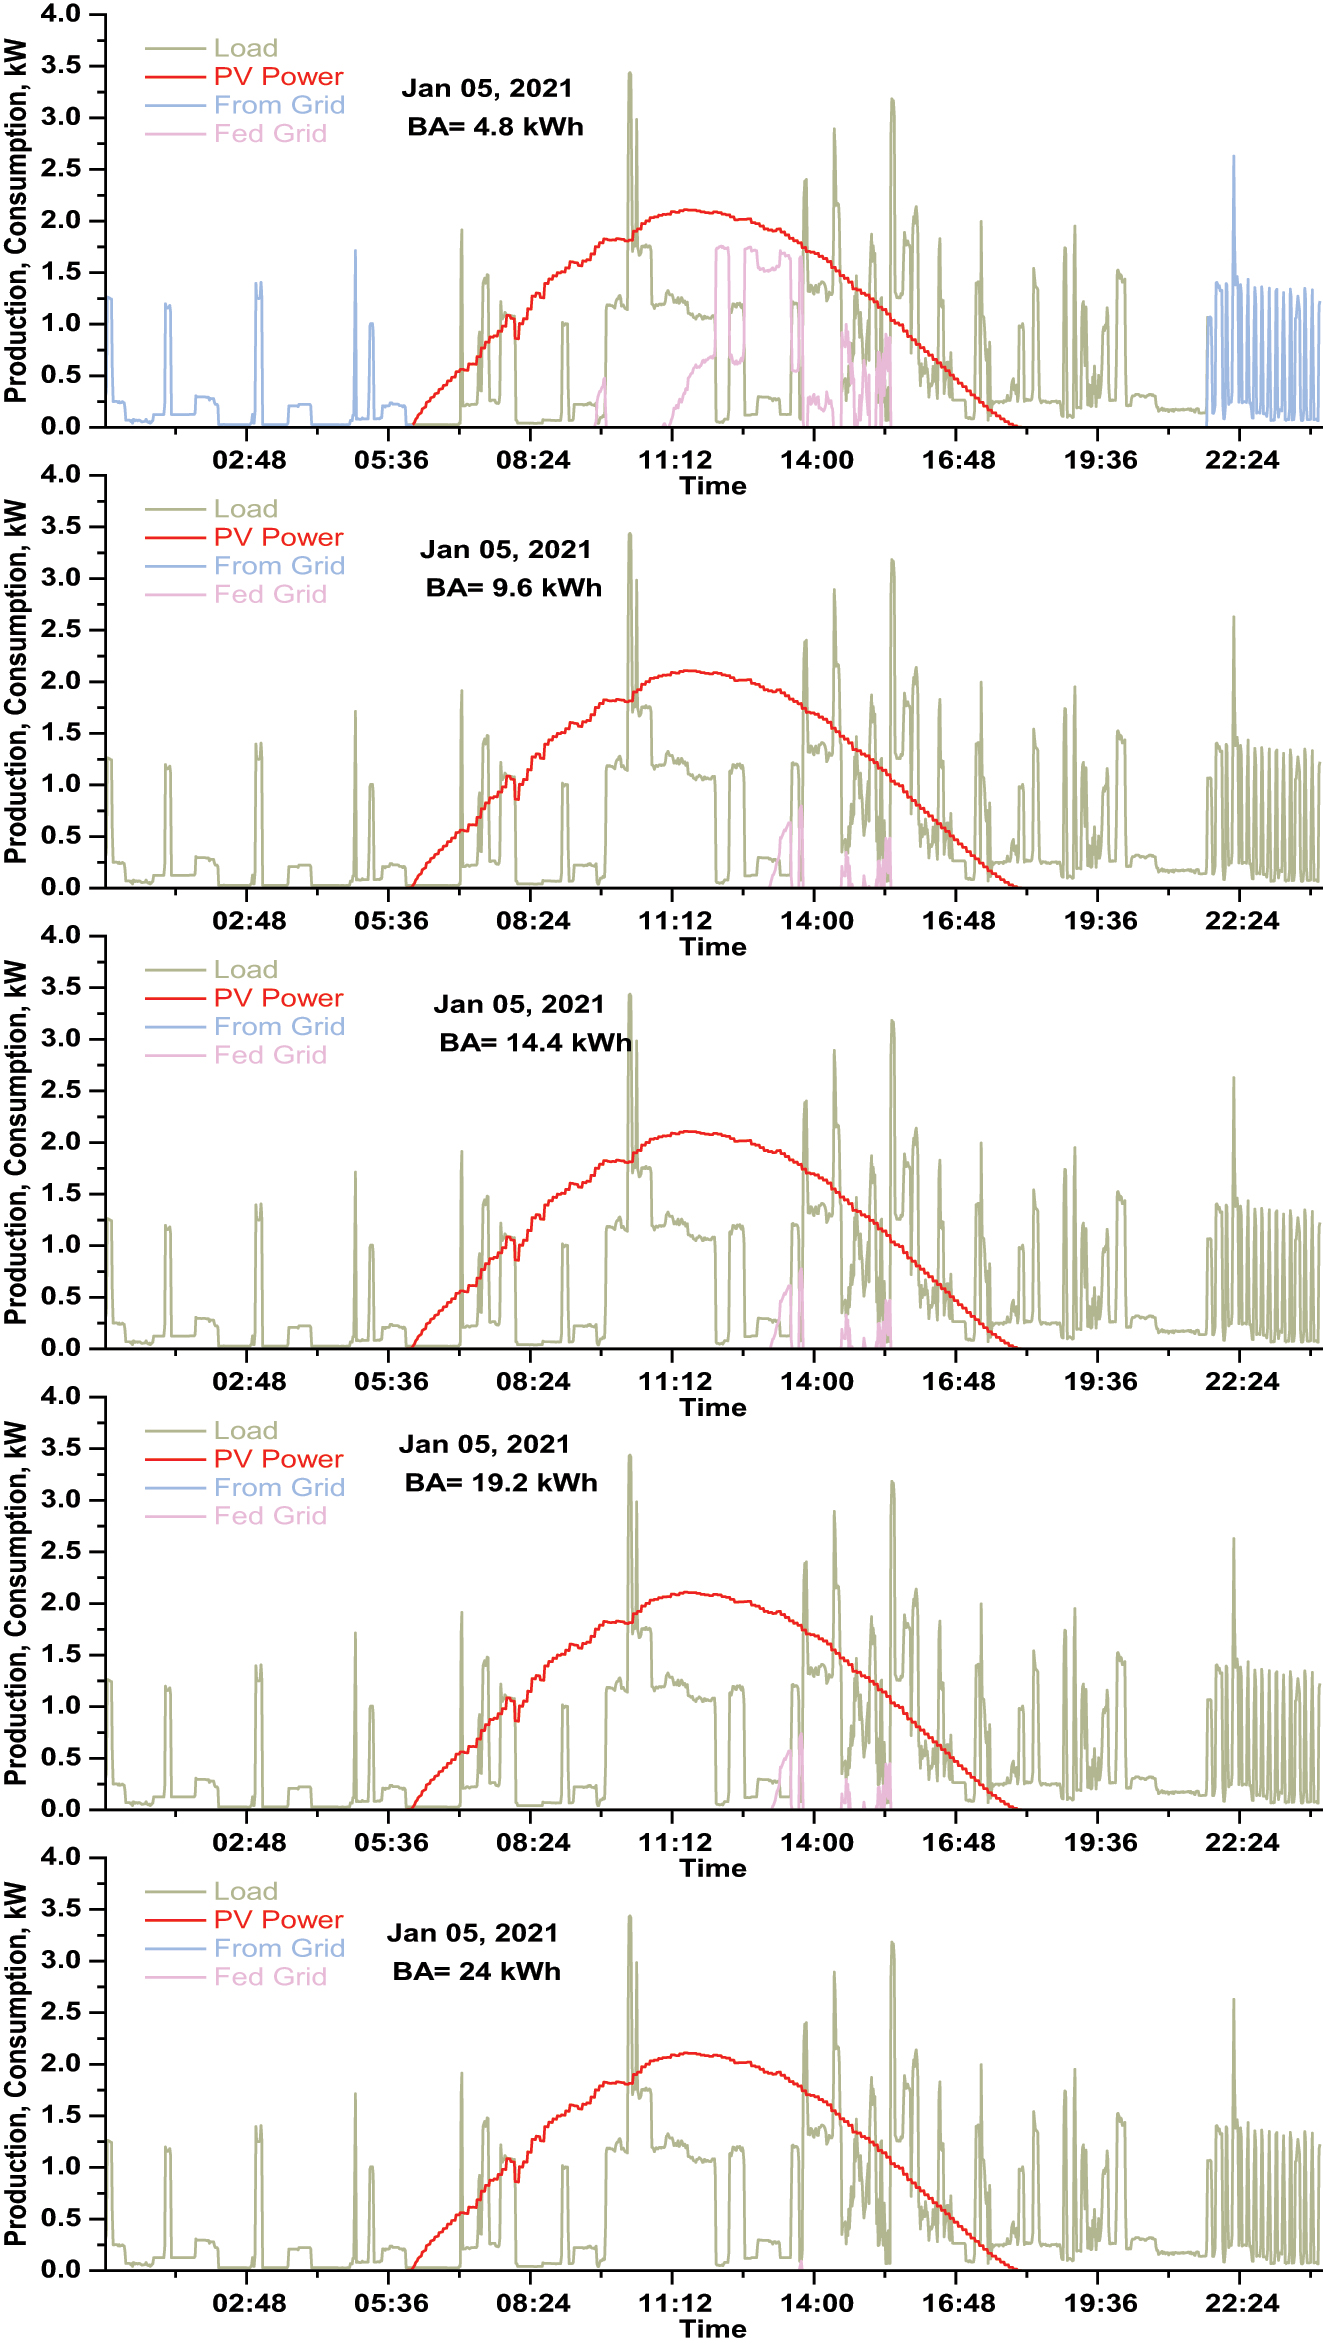
Daily power flow at different battery capacity for the day of Jan 05, 2022.
Figure 6 shows the daily energy from the grid/fed to the grid for the selected four days. It is very clear that for all selected days, the energy taken from the grid gets zero at 9.6 kWh and above battery capacity. That means the renewable energy generated by the PV array and BA storage unit can feed the desired load 100%. For all days, increasing battery capacity reduces energy fed to the grid because the energy generated by the PV array goes to charge the batteries, which are designed only to charge from the PV array (not from the grid).
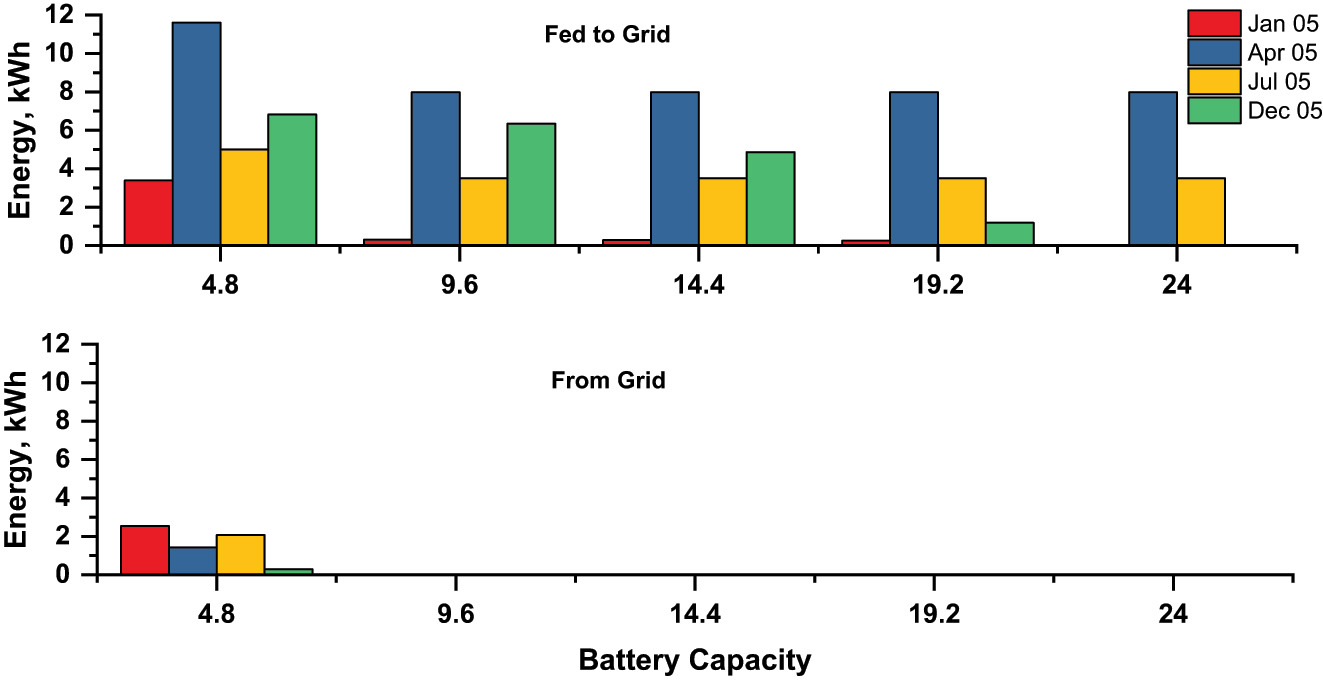
Daily energy from grid/fed to grid at different battery capacity for four selected days.
Figure 7 shows the flow of energy self-consumption for the selected four days with several battery capacities (4.8 kW–24 kW, based on battery specification presented in Table 2). The energy self-consumption increases by increasing battery capacity for all selected days. For all days, increasing battery capacity reduces energy fed to the grid because the energy generated by the PV array goes to charge the batteries, which are designed only to charge from the PV array (not from the grid).
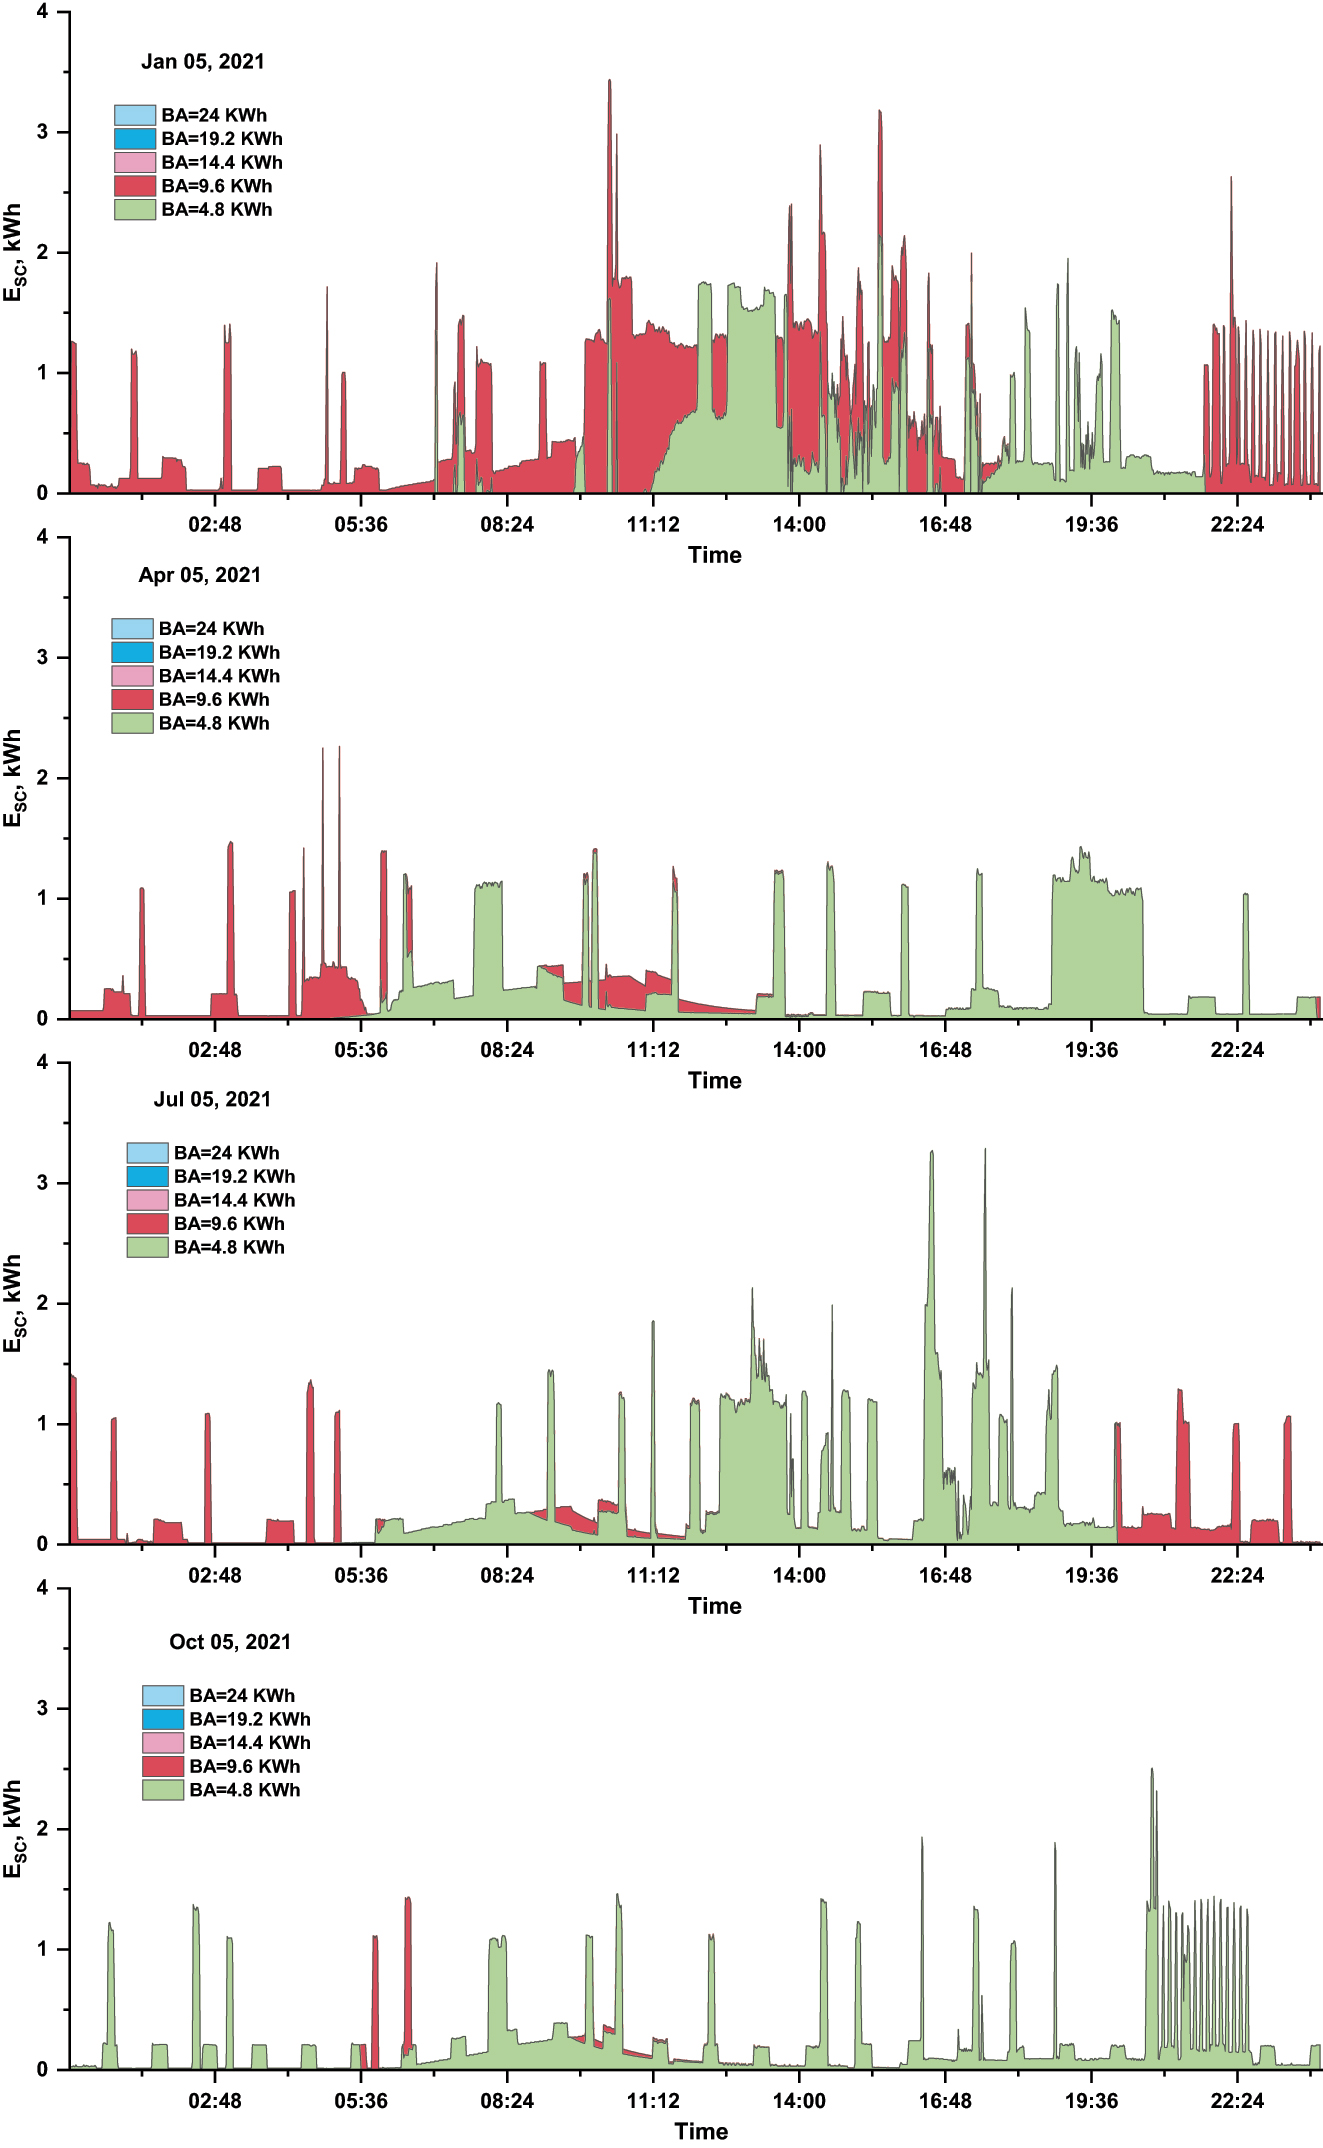
The daily energy self-consumption for the selected days with several battery capacities.
Figure 8 shows the daily total energy self-consumption for the selected four days with several battery capacities (4.8 kW–24 kW, based on battery specification presented in Table 2). The value of energy self-consumption increases by increasing battery capacity for all selected days. For all days, increasing battery capacity reduces energy fed to the grid because the energy generated by the PV array goes to charge the batteries, which are designed only to charge from the PV array (not from the grid).
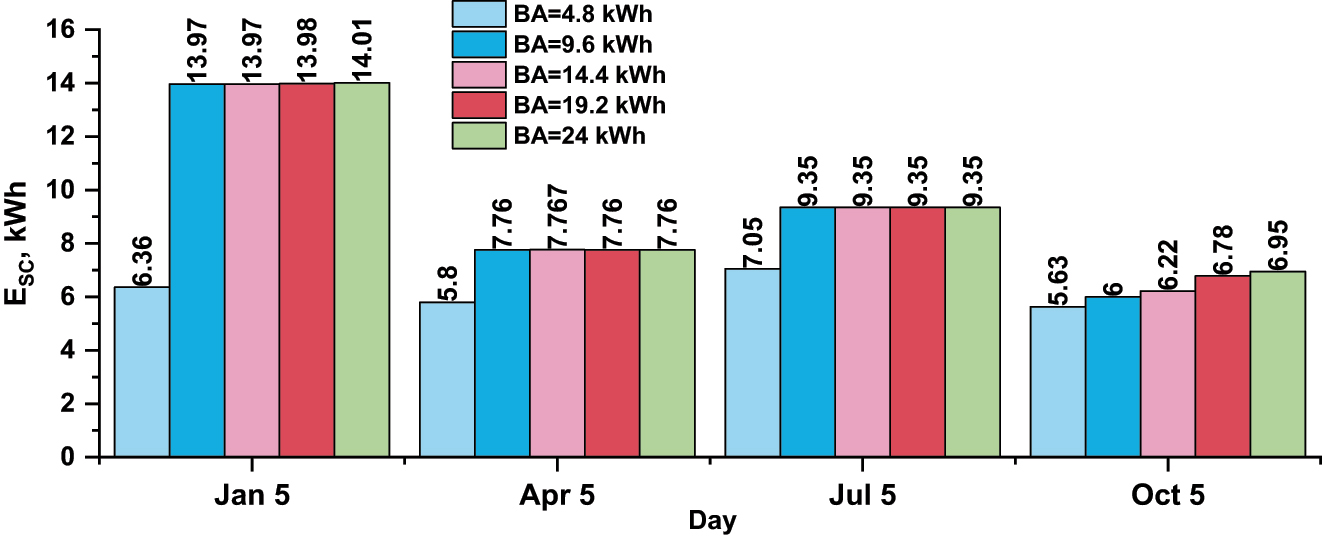
The daily total energy self-consumption for the selected days with several battery capacities.
Figure 9 shows the monthly energy generated by a PV array with a selected capacity of 2.7 kW based on the modules presented in Table 2. The energy generated by the array is highly dependent on the incident solar irradiance (see Figure 3). The results showed that the highest energy can be generated by the specified array by about 510 kWh during July and the lowest by about 148 kWh during December, and the total annual energy can be generated by about 975 kWh.
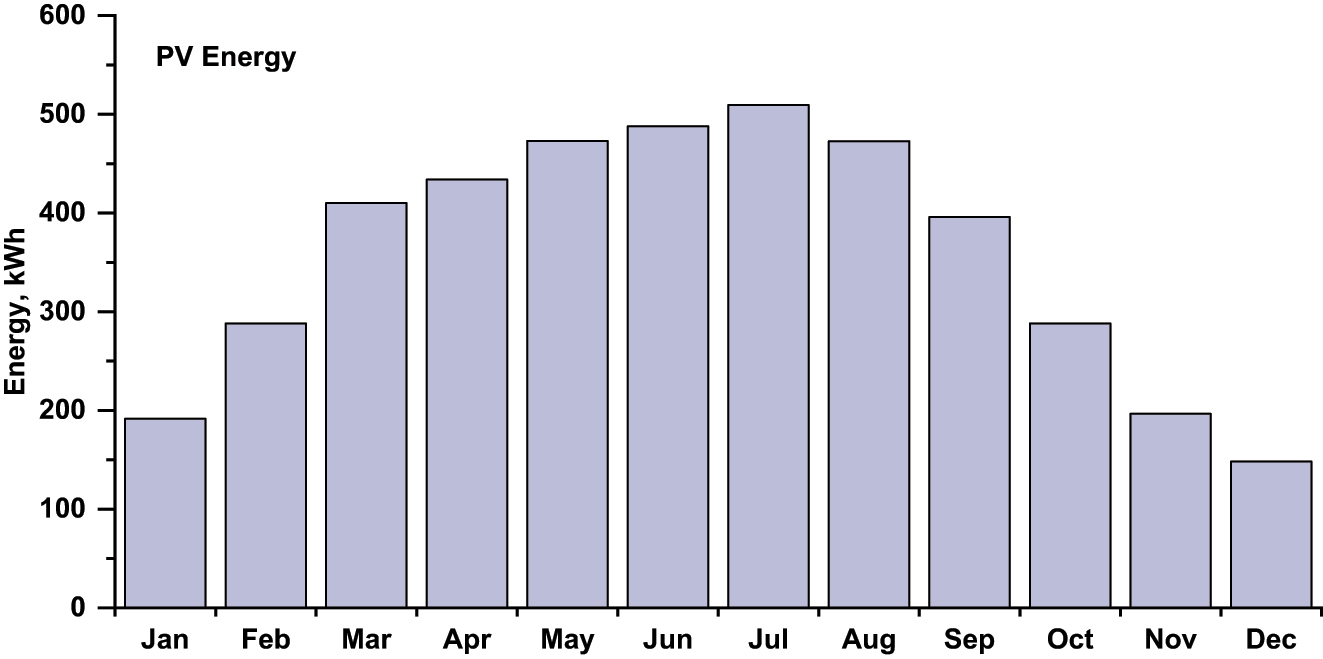
The monthly energy generated by PV array with capacity 2.7 kWp.
Figure 10 shows the monthly energy self-consumption and percentage with several battery capacities. The amount of energy self-consumption increases by increasing battery storage capacity and decreases by decreasing battery capacity, which is why this value variants from one month to another. It highly depends on the desired load, energy generated by the PV array and battery storage capacity. It is very difficult to decide which optimum battery storage capacity can achieve the highest energy self-consumption based on the daily and monthly results. Such a decision requires at least one year lead time.
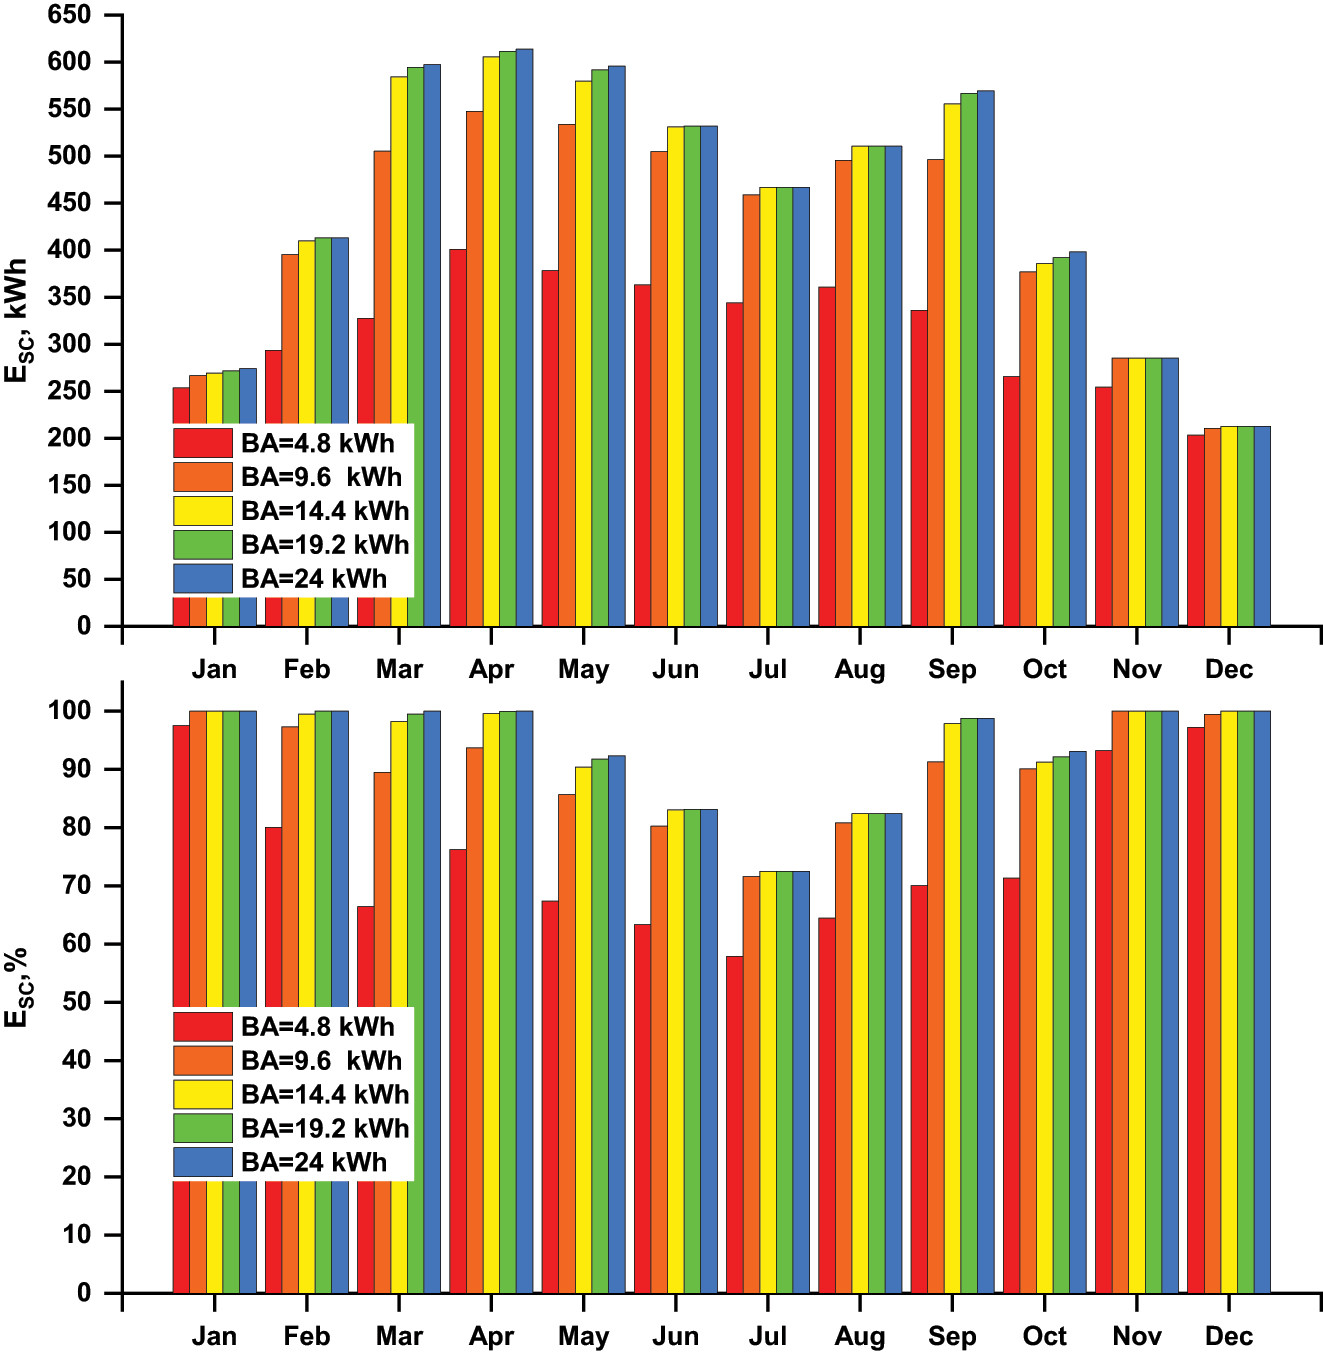
The monthly energy SC energy and SC percentage with several battery capacities.
The experimental measurement of yearly energy consumption was 3755.8 kWh, and the simulation results demonstrated that the PV array with a capacity of 2.7 can generate 4295.4 kWh annually. Figure 11 depicts the annual amount of energy absorbed from the grid and returned to it at various battery capacities. According to the data, the 4.8 kWh battery consumed the most energy at 1435 kWh, while the least amount of energy was sent to the grid at 1487 kWh. Increasing battery storage capacity degreases both the energy absorbed and the energy fed to the grid. Because rising battery capacities necessitate more energy for charging, the PV array’s surplus energy exceeds the anticipated load requirements for charging the batteries.
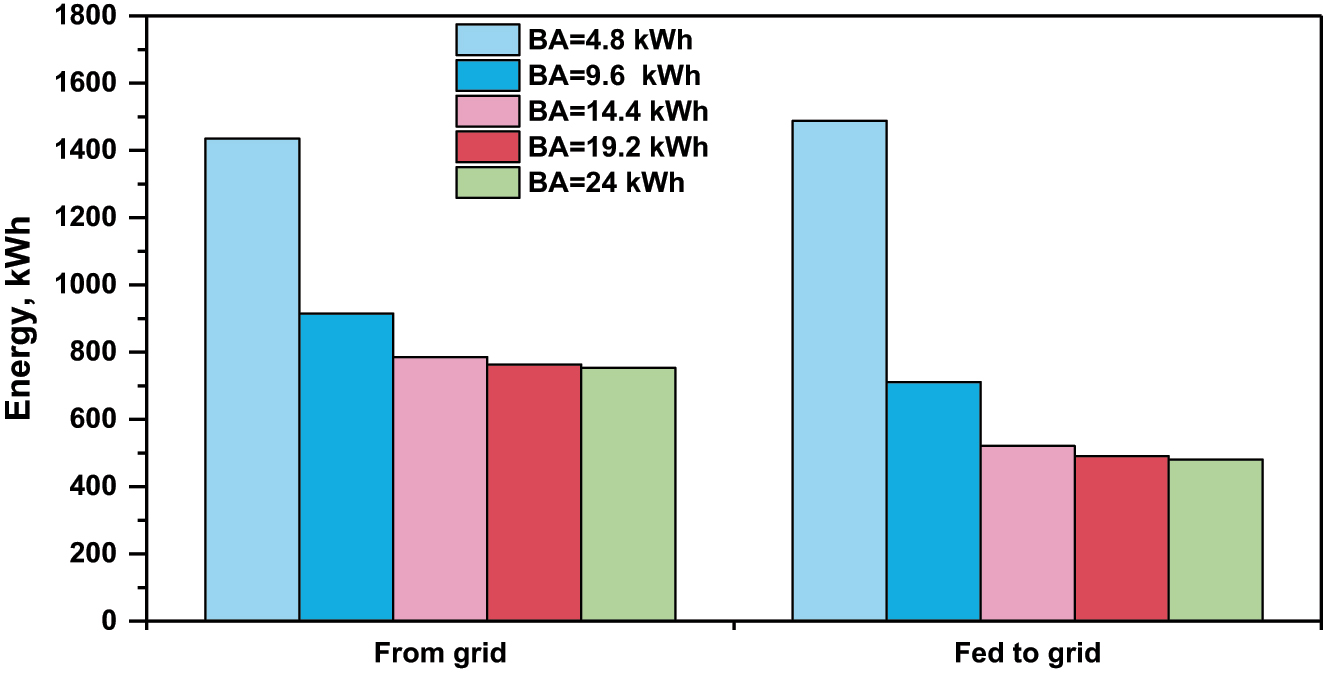
The annual energy taken from the grid and fed back to the grid with several battery capacities.
Figure 12 shows the annual energy charge and discharge of batteries at several capacities. In general, the energy for charge is higher than the energy for discharge due to the selected batteries round-trip efficiency of 85%. The batteries charge and discharge are increased by increasing the battery storage capacity.
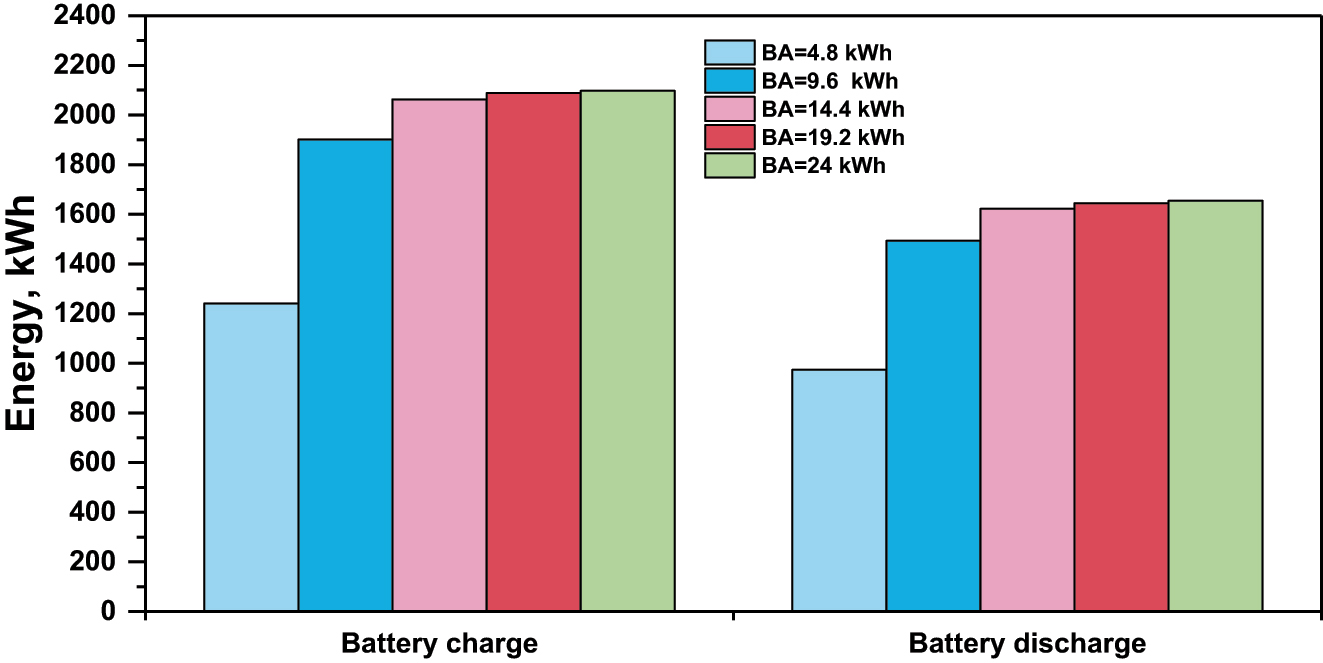
The annual energy charge and discharge batteries at several capacities.
Figure 13 shows the annual energy self-consumption and percentage with several battery capacities. The simulation results demonstrated the increasing percentage getting raised very low after capacity of 14.4 kWh (6-batteries), which is the energy self-consumption of 5396.85 kWh. It can be said that the optimum battery capacity is 14.4 kWh, which can match the highest self-consumption for the investigated design.
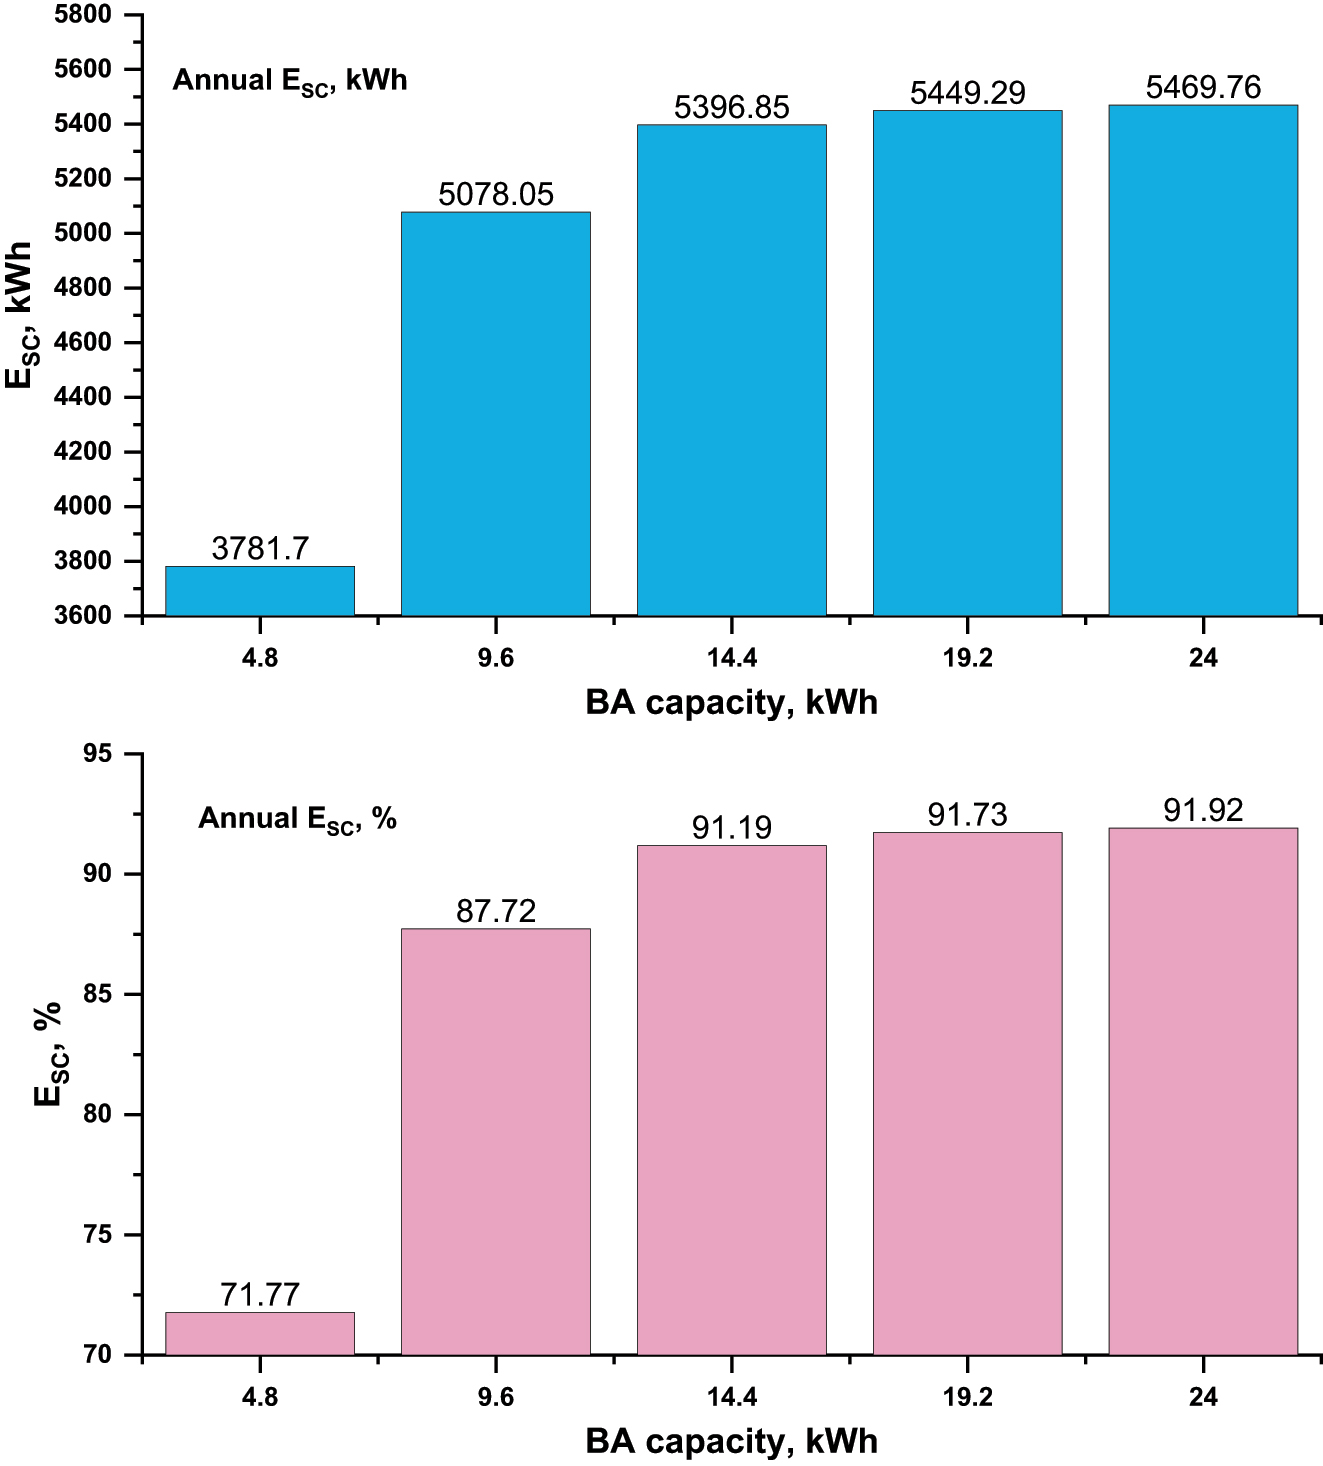
The annual energy self-consumption with several battery capacities.
Figure 14 shows the annual energy net present cost and the energy cost with several battery capacities. The simulation showed that both the net present cost and the cost of energy went up as the battery storage capacity went up. The lowest net present cost was $9615 at battery capacity 4.8 kWh and the highest was $11818 at battery capacity 24 kWh. The same was true for the energy cost, which showed the lowest was $0.223 at battery capacity 4.8 kWh and the highest was $0.274 at battery capacity 24 kWh.
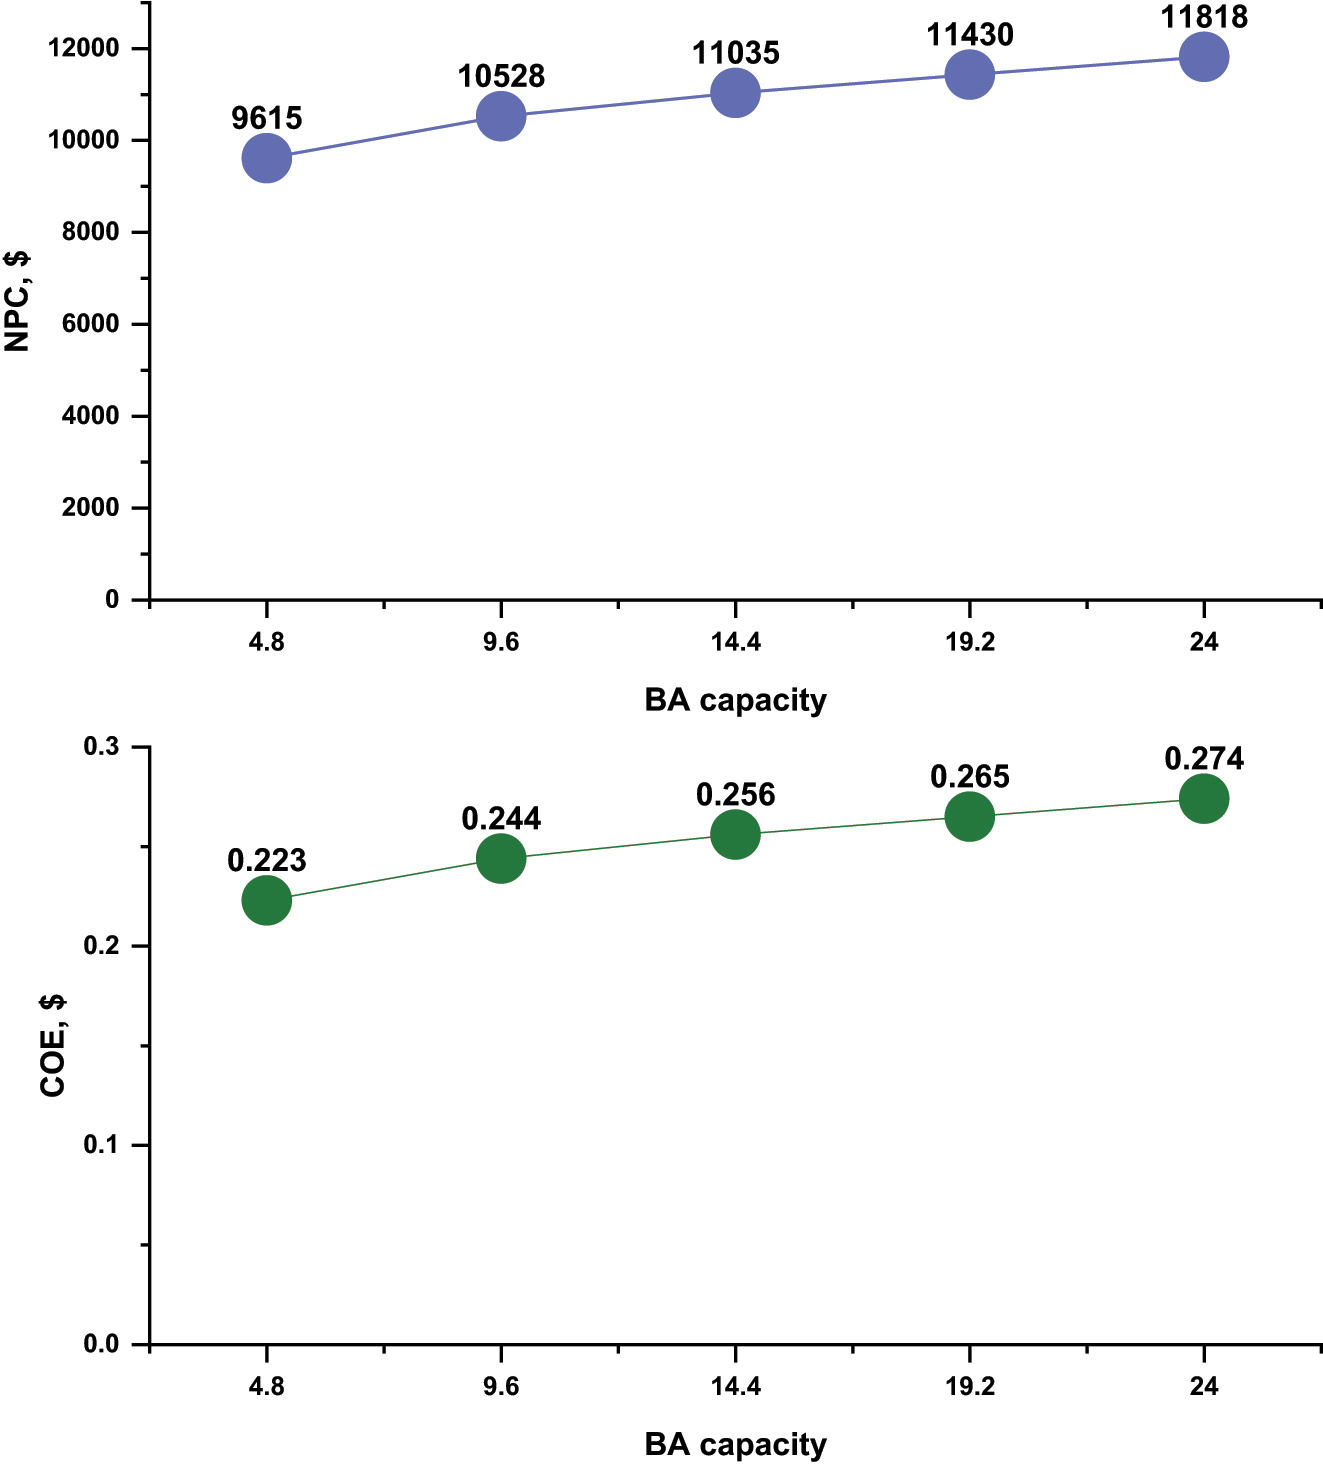
The annual NPC and COE with several battery capacities.
4 Conclusions
Despite the fact that combining solar with batteries results in higher net present values than standalone PV for different residential customer groups today, payback periods vary between 2021 and 2030 as a result of regulatory changes, rising costs, and fluctuating power market prices. The ideal PV and battery sizes rise with time, and by 2050, the PV expenditure is mostly constrained by the roof size. The economic feasibility of PV/BA system investments differs across residential customers, with the most advantageous investments being most readily available to residential customer groups with greater annual irradiance and power use. Moreover, investment choices are significantly impacted by payback periods, future expenses, power prices, and tariff changes.
This research was utilized to construct a model of a microgrid energy system for a municipality in Central Iraq based on prospective trends. In addition, the authors will investigate and incorporate solar energy sources and new energy storage technology in order to expand the use of renewable energy in the electrification field to include industrial, agricultural, and commercial load centers for long-term energy distribution in the Municipality of Iraq. The study conclusion might be stated as:
The average of the annual daily solar irradiance (4.6 kWh/m2/day) can generate energy of about 4295.4 kWh with 2.7 kWp of PV array positioned at the annual optimum orientation.
For the annual energy consumption (3755.8 kWh), the optimum battery capacity that can be injected with 2.7 kWp of PV array is 14.4 kWh, which can satisfy 91.1% of self-consumption.
The NPC for the optimum system configurations mentioned above was $11053 with a project life span from 2021 to 2030.
The COE for the optimum system configurations mentioned above was $0.256/kWh.
This study proposes answers to the worldwide issues of reducing the escalation of environmental problems and satisfying energy requirements. The offered system offers a feasible technical, financial, and ecological solution to the aforementioned concerns. The established energy system model of a solar PV system that incorporates batteries and a local grid is an effective means of meeting energy needs. The numerical method used to identify optimum system configurations may be applied to any system capacity, enabling the designer to determine optimal system component capacities.
5 Future recommendation
In recent years, home storage, especially for expanded self-consumption, has become economically feasible in a number of nations without government backing. A fundamental proposal is that the homes, residential communities and commercial buildings should unify legislation around auxiliary services and encourage to create settings that are conducive to investments in storage devices by prosumers. Consequently, it is important to set up rules that encourage self-consumption and less energy use, especially because of concerns about peak loads.
The most important aspect of self-consumption is the expansion of its scope: while some countries have preferred to optimise local self-consumption through storage, it seems logical to assume that self-consumption will become progressively delocalized, either between different consumption and production points associated with the same individual, or through energy communities. Mentalities and grid pricing must adapt in order to decouple dispersed power use from the producing site. Local, collaborative, decentralized, and creative self-consumption is expected to be a big part of the future carbon-free electrical system, which will have millions of power plants, storage units, and more places to charge, stabilise the grid, and store power.
-
Author contributions: All the authors have accepted responsibility for the entire content of this submitted manuscript and approved submission.
-
Research funding: None declared.
-
Conflict of interest statement: The authors declare no conflicts of interest regarding this article.
References
Abbas, M. K., Q. Hassan, M. Jaszczur, Z. S. Al-Sagar, A. N. Hussain, A. Hasan, and A. Mohamad. 2021. “Energy Visibility of a Modeled Photovoltaic/diesel Generator Set Connected to the Grid.” Energy Harvesting and Systems, https://doi.org/10.1515/ehs-2021-0022.Search in Google Scholar
Absopulse Inverter. Also available at https://absopulse.com/ (accessed January 03, 2022).Search in Google Scholar
Allwyn, R. G., A. Al-Hinai, R. Al-Abri, and A. Malik. 2022. “Optimization and Techno-Economic Analysis of PV/Battery System for Street Lighting Using Genetic Algorithm–A Case Study in Oman.” Cleaner Engineering and Technology 8: 100475, https://doi.org/10.1016/j.clet.2022.100475.Search in Google Scholar
Ashtiani, M. N., A. Toopshekan, F. R. Astaraei, H. Yousefi, and A. Maleki. 2020. “Techno-economic Analysis of a Grid-Connected PV/battery System Using the Teaching-Learning-Based Optimization Algorithm.” Solar Energy 203: 69–82, https://doi.org/10.1016/j.solener.2020.04.007.Search in Google Scholar
Battery. Also available at http://www.vision-batt.com/ (accessed January 03, 2022).Search in Google Scholar
Ceran, B., A. Mielcarek, Q. Hassan, J. Teneta, and M. Jaszczur. 2021. “Aging Effects on Modelling and Operation of a Photovoltaic System with Hydrogen Storage.” Applied Energy 297: 117161, https://doi.org/10.1016/j.apenergy.2021.117161.Search in Google Scholar
Ghodbane, M., B. Boumeddane, Z. Said, and E. Bellos. 2019. “A Numerical Simulation of a Linear Fresnel Solar Reflector Directed to Produce Steam for the Power Plant.” Journal of Cleaner Production 231: 494–508, https://doi.org/10.1016/j.jclepro.2019.05.201.Search in Google Scholar
Gul, E., G. Baldinelli, P. Bartocci, F. Bianchi, P. Domenghini, F. Cotana, and J. Wang. 2022. “A Techno-Economic Analysis of a Solar PV and DC Battery Storage System for a Community Energy Sharing.” Energy: 123191, https://doi.org/10.1016/j.energy.2022.123191.Search in Google Scholar
Han, X., and G. Hug. 2020. “A Distributionally Robust Bidding Strategy for a Wind-Storage Aggregator.” Electric Power Systems Research 189: 106745, https://doi.org/10.1016/j.epsr.2020.106745.Search in Google Scholar
Hassan, Q. 2022. “Evaluate the Adequacy of Self-Consumption for Sizing Photovoltaic System.” Energy Reports 8: 239–54, https://doi.org/10.1016/j.egyr.2021.11.205.Search in Google Scholar
Hassan, Q., M. Jaszczur, M. S. Juste, and R. Hanus. 2019. “Predicting the Amount of Energy Generated by aWind Turbine Based on the Weather Data.” IOP Conference Series: Earth and Environmental Science 214 (1): 012113, https://doi.org/10.1088/1755-1315/214/1/012113.Search in Google Scholar
Hassan, Q., M. Jaszczur, S. A. Hafedh, M. K. Abbas, A. M. Abdulateef, A. Hasan, J. Abdulateef, and A. Mohamad. 2022. “Optimizing a Microgrid Photovoltaic-Fuel Cell Energy System at the Highest Renewable Fraction.” International Journal of Hydrogen Energy 47 (28): 13710–31, https://doi.org/10.1016/j.ijhydene.2022.02.108.Search in Google Scholar
Hassan, Q., M. Jaszczur, A. M. Abdulateef, J. Abdulateef, A. Hasan, and A. Mohamad. 2022. “An Analysis of Photovoltaic/supercapacitor Energy System for Improving Self-Consumption and Self-Sufficiency.” Energy Reports 8: 680–95, https://doi.org/10.1016/j.egyr.2021.12.021.Search in Google Scholar
Hassan, Q., B. Pawela, A. Hasan, and M. Jaszczur. 2022. “Optimization of Large-Scale Battery Storage Capacity in Conjunction with Photovoltaic Systems for Maximum Self-Sustainability.” Energies 15 (10): 3845, https://doi.org/10.3390/en15103845.Search in Google Scholar
Hassan, Q., M. Jaszczur, J. Teneta, M. K. Abbas, A. Hasan, and A. K. Al-Jiboory. 2022. “Experimental Investigation for the Estimation of the Intensity of Solar Irradiance on Oblique Surfaces by Means of Various Models.” Energy Harvesting and Systems, https://doi.org/10.1515/ehs-2021-0087.Search in Google Scholar
Hassan, Q., M. Jaszczur, A. K. Al-Jiboory, A. Hasan, and A. Mohamad. 2022. “Optimizing of Hybrid Renewable Photovoltaic/wind Turbine/super Capacitor for Improving Self-Sustainability.” Energy Harvesting and Systems, https://doi.org/10.1515/ehs-2021-0095.Search in Google Scholar
Hoesung, L., and B. Fatih. 2020. Energy is at the Heart of the Solution to the Climate Challenge.Search in Google Scholar
Jäger-Waldau, A. 2020. “Snapshot of Photovoltaics—February 2020.” Energies 13 (4): 930, https://doi.org/10.3390/en13040930.Search in Google Scholar
Jamroen, C. 2022. “Optimal Techno-Economic Sizing of a Standalone Floating Photovoltaic/battery Energy Storage System to Power an Aquaculture Aeration and Monitoring System.” Sustainable Energy Technologies and Assessments 50: 101862, https://doi.org/10.1016/j.seta.2021.101862.Search in Google Scholar
Jaszczur, M., Q. Hassan, M. Szubel, and E. Majewska. 2018. “Fluid Flow and Heat Transfer Analysis of a Photovoltaic Module under Varying Environmental Conditions.” Journal of Physics: Conference Series 1101 (1): 012009, https://doi.org/10.1088/1742-6596/1101/1/012009.Search in Google Scholar
Jaszczur, M., J. Teneta, K. Styszko, Q. Hassan, P. Burzyńska, E. Marcinek, and N. Łopian. 2019. “The Field Experiments and Model of the Natural Dust Deposition Effects on Photovoltaic Module Efficiency.” Environmental Science and Pollution Research 26 (9): 8402–17, https://doi.org/10.1007/s11356-018-1970-x.Search in Google Scholar PubMed PubMed Central
Jaszczur, M., Q. Hassan, P. Palej, and J. Abdulateef. 2020. “Multi-Objective Optimisation of a Micro-grid Hybrid Power System for Household Application.” Energy 202: 117738, https://doi.org/10.1016/j.energy.2020.117738.Search in Google Scholar
Jaszczur, M., J. Teneta, Q. Hassan, E. Majewska, and R. Hanus. 2021. “An Experimental and Numerical Investigation of Photovoltaic Module Temperature under Varying Environmental Conditions.” Heat Transfer Engineering 42 (3–4): 354–67, https://doi.org/10.1080/01457632.2019.1699306.Search in Google Scholar
Javed, M. S., A. Song, and T. Ma. 2019. “Techno-economic Assessment of a Stand-Alone Hybrid Solar-Wind-Battery System for a Remote Island Using Genetic Algorithm.” Energy 176: 704–17, https://doi.org/10.1016/j.energy.2019.03.131.Search in Google Scholar
Javed, M. S., D. Zhong, T. Ma, A. Song, and S. Ahmed. 2020. “Hybrid Pumped Hydro and Battery Storage for Renewable Energy Based Power Supply System.” Applied Energy 257: 114026, https://doi.org/10.1016/j.apenergy.2019.114026.Search in Google Scholar
Li, X., J. Gao, S. You, Y. Zheng, Y. Zhang, Q. Du, M. Xie, and Y. Qin. 2022. “Optimal Design and Techno-Economic Analysis of Renewable-Based Multi-Carrier Energy Systems for Industries: A Case Study of a Food Factory in China.” Energy: 123174, https://doi.org/10.1016/j.energy.2022.123174.Search in Google Scholar
Ma, T., H. Yang, and L. Lu. 2014. “A Feasibility Study of a Stand-Alone Hybrid Solar–Wind–Battery System for a Remote Island.” Applied Energy 121: 149–58, https://doi.org/10.1016/j.apenergy.2014.01.090.Search in Google Scholar
Merei, G., J. Moshövel, D. Magnor, and D. U. Sauer. 2016. “Optimization of Self-Consumption and Techno-Economic Analysis of PV-Battery Systems in Commercial Applications.” Applied Energy 168: 171–8, https://doi.org/10.1016/j.apenergy.2016.01.083.Search in Google Scholar
Mesia, M. E. 2020. Solar Outlook Report 2020.Search in Google Scholar
Monocrystalline. “Sunceco PV Module.” Also available at https://sunceco.com/ (accessed January 03, 2022).Search in Google Scholar
Nowak, S. 2014. Photovoltaic Power Systems Programme. Annual Report. Paris: International Energy Agency.Search in Google Scholar
Shabani, M., E. Dahlquist, F. Wallin, and J. Yan. 2021. “Techno-economic Impacts of Battery Performance Models and Control Strategies on Optimal Design of a Grid-Connected PV System.” Energy Conversion and Management 245: 114617, https://doi.org/10.1016/j.enconman.2021.114617.Search in Google Scholar
Shafiullah, G. M. 2016. “Hybrid Renewable Energy Integration (HREI) System for Subtropical Climate in Central Queensland, Australia.” Renewable Energy 96: 1034–53, https://doi.org/10.1016/j.renene.2016.04.101.Search in Google Scholar
Solargis. Solar Resource Maps and GIS Data for 180+ Countries| Solargis.Search in Google Scholar
Stephan, A., B. Battke, M. D. Beuse, J. H. Clausdeinken, and T. S. Schmidt. 2016. “Limiting the Public Cost of Stationary Battery Deployment by Combining Applications.” Nature Energy 1 (7): 1–9, https://doi.org/10.1038/nenergy.2016.79.Search in Google Scholar
Styszko, K., M. Jaszczur, J. Teneta, Q. Hassan, P. Burzyńska, E. Marcinek, N. Łopian, and L. Samek. 2019. “An Analysis of the Dust Deposition on Solar Photovoltaic Modules.” Environmental Science and Pollution Research 26 (9): 8393–401, https://doi.org/10.1007/s11356-018-1847-z.Search in Google Scholar PubMed PubMed Central
Taher, M. B., Z. Benseddik, A. Afass, S. Smouh, M. Ahachad, and M. Mahdaoui. 2021. “Energy Life Cycle Cost Analysis of Various Solar Water Heating Systems under Middle East and North Africa Region.” Case Studies in Thermal Engineering 27: 101262, https://doi.org/10.1016/j.csite.2021.101262.Search in Google Scholar
Uddin, M., M. F. Romlie, M. F. Abdullah, C. Tan, G. M. Shafiullah, and A. H. A. Bakar. 2020. “A Novel Peak Shaving Algorithm for Islanded Microgrid Using Battery Energy Storage System.” Energy 196: 117084, https://doi.org/10.1016/j.energy.2020.117084.Search in Google Scholar
Uddin, M. N., M. M. Biswas, and S. Nuruddin. 2022. “Techno-economic Impacts of Floating PV Power Generation for Remote Coastal Regions.” Sustainable Energy Technologies and Assessments 51: 101930, https://doi.org/10.1016/j.seta.2021.101930.Search in Google Scholar
Zhang, Y., T. Ma, P. E. Campana, Y. Yamaguchi, and Y. Dai. 2020. “A Techno-Economic Sizing Method for Grid-Connected Household Photovoltaic Battery Systems.” Applied Energy 269: 115106, https://doi.org/10.1016/j.apenergy.2020.115106.Search in Google Scholar
© 2024 the author(s), published by De Gruyter, Berlin/Boston
This work is licensed under the Creative Commons Attribution 4.0 International License.
Articles in the same Issue
- Solar photovoltaic-integrated energy storage system with a power electronic interface for operating a brushless DC drive-coupled agricultural load
- Analysis of 1-year energy data of a 5 kW and a 122 kW rooftop photovoltaic installation in Dhaka
- Reviews
- Real yields and PVSYST simulations: comparative analysis based on four photovoltaic installations at Ibn Tofail University
- A comprehensive approach of evolving electric vehicles (EVs) to attribute “green self-generation” – a review
- Exploring the piezoelectric porous polymers for energy harvesting: a review
- A strategic review: the role of commercially available tools for planning, modelling, optimization, and performance measurement of photovoltaic systems
- Comparative assessment of high gain boost converters for renewable energy sources and electrical vehicle applications
- A review of green hydrogen production based on solar energy; techniques and methods
- A review of green hydrogen production by renewable resources
- A review of hydrogen production from bio-energy, technologies and assessments
- A systematic review of recent developments in IoT-based demand side management for PV power generation
- Research Articles
- Hybrid optimization strategy for water cooling system: enhancement of photovoltaic panels performance
- Solar energy harvesting-based built-in backpack charger
- A power source for E-devices based on green energy
- Theoretical and experimental investigation of electricity generation through footstep tiles
- Experimental investigations on heat transfer enhancement in a double pipe heat exchanger using hybrid nanofluids
- Comparative energy and exergy analysis of a CPV/T system based on linear Fresnel reflectors
- Investigating the effect of green composite back sheet materials on solar panel output voltage harvesting for better sustainable energy performance
- Electrical and thermal modeling of battery cell grouping for analyzing battery pack efficiency and temperature
- Intelligent techno-economical optimization with demand side management in microgrid using improved sandpiper optimization algorithm
- Investigation of KAPTON–PDMS triboelectric nanogenerator considering the edge-effect capacitor
- Design of a novel hybrid soft computing model for passive components selection in multiple load Zeta converter topologies of solar PV energy system
- A novel mechatronic absorber of vibration energy in the chimney
- An IoT-based intelligent smart energy monitoring system for solar PV power generation
- Large-scale green hydrogen production using alkaline water electrolysis based on seasonal solar radiation
- Evaluation of performances in DI Diesel engine with different split injection timings
- Optimized power flow management based on Harris Hawks optimization for an islanded DC microgrid
- Experimental investigation of heat transfer characteristics for a shell and tube heat exchanger
- Fuzzy induced controller for optimal power quality improvement with PVA connected UPQC
- Impact of using a predictive neural network of multi-term zenith angle function on energy management of solar-harvesting sensor nodes
- An analytical study of wireless power transmission system with metamaterials
- Hydrogen energy horizon: balancing opportunities and challenges
- Development of renewable energy-based power system for the irrigation support: case studies
- Maximum power point tracking techniques using improved incremental conductance and particle swarm optimizer for solar power generation systems
- Experimental and numerical study on energy harvesting performance thermoelectric generator applied to a screw compressor
- Study on the effectiveness of a solar cell with a holographic concentrator
- Non-transient optimum design of nonlinear electromagnetic vibration-based energy harvester using homotopy perturbation method
- Industrial gas turbine performance prediction and improvement – a case study
- An electric-field high energy harvester from medium or high voltage power line with parallel line
- FPGA based telecommand system for balloon-borne scientific payloads
- Improved design of advanced controller for a step up converter used in photovoltaic system
- Techno-economic assessment of battery storage with photovoltaics for maximum self-consumption
- Analysis of 1-year energy data of a 5 kW and a 122 kW rooftop photovoltaic installation in Dhaka
- Shading impact on the electricity generated by a photovoltaic installation using “Solar Shadow-Mask”
- Investigations on the performance of bottle blade overshot water wheel in very low head resources for pico hydropower
- Solar photovoltaic-integrated energy storage system with a power electronic interface for operating a brushless DC drive-coupled agricultural load
- Numerical investigation of smart material-based structures for vibration energy-harvesting applications
- A system-level study of indoor light energy harvesting integrating commercially available power management circuitry
- Enhancing the wireless power transfer system performance and output voltage of electric scooters
- Harvesting energy from a soldier's gait using the piezoelectric effect
- Study of technical means for heat generation, its application, flow control, and conversion of other types of energy into thermal energy
- Theoretical analysis of piezoceramic ultrasonic energy harvester applicable in biomedical implanted devices
- Corrigendum
- Corrigendum to: A numerical investigation of optimum angles for solar energy receivers in the eastern part of Algeria
- Special Issue: Recent Trends in Renewable Energy Conversion and Storage Materials for Hybrid Transportation Systems
- Typical fault prediction method for wind turbines based on an improved stacked autoencoder network
- Power data integrity verification method based on chameleon authentication tree algorithm and missing tendency value
- Fault diagnosis of automobile drive based on a novel deep neural network
- Research on the development and intelligent application of power environmental protection platform based on big data
- Diffusion induced thermal effect and stress in layered Li(Ni0.6Mn0.2Co0.2)O2 cathode materials for button lithium-ion battery electrode plates
- Improving power plant technology to increase energy efficiency of autonomous consumers using geothermal sources
- Energy-saving analysis of desalination equipment based on a machine-learning sequence modeling