
Compressive strength and thermal properties of sand–bentonite mixture
-
Mindaugas Zakarka
 ,
Šarūnas Skuodis
,
Šarūnas Skuodis

Abstract
Sand–bentonite mixtures are used in road embankments as a protective material for protecting underground high-voltage cables and utility pipelines supplying water and gas etc. The sand–bentonite mixtures provide benefits while laying high-voltage cables. The purpose of this study is to determine the proportions as well as mechanical and thermal properties of a dry-mixed sand–bentonite mixture and to investigate the suitability of such mixtures for installation around high-voltage underground power lines in road embankments. When selecting a sand–bentonite mixture, the following requirements must be ensured: the compressive strength must be greater than 0.5 MPa after 24 h; the thermal resistivity must be greater than 1.2 K m/W (thermal conductivity 0,833 W/(K m)); and the moisture content of the sand–bentonite mixture must be less than 13%. The following materials were used when selecting the bentonite mixture: bentonite, 0–4.0 mm fraction sand, cement (CEM I 42.5R), and water. In this study, six groups of samples were formed, in which the parts of concrete, sand, cement, and water were added in different proportions. The strength and thermal conductivity of the samples were analyzed. Studies about the use of bentonite around high-voltage cables have revealed the need for wet mixing of bentonite suspensions. The required thermal conductivity properties of the soil were not achieved by dry mixing. This method of mixing can be useful only in cases when the thermal conductivity of the mixed soil is not relevant, because the work can be continued after a day.
1 Introduction
Usually, road embankments are equipped for the possible laying of underground electricity cable lines, water, gas, or other supply pipelines [1,2]. The installation of underground cable lines under the road embankment is a rational use of space [3]. To protect underground cable lines from road loads, reinforced concrete U profiles can be installed or cables can be laid by enclosing them with a special layer of liquid soil, which is called controlled low-strength material (CLSM) [4]. Liquid soil is the result of the application of an innovative process, which is characterized by the fact that the on-site excavated soil with natural additives is temporarily made flowable in a mixing plant and returned to the excavation pit. The liquid soil can be processed quickly and easily. It encloses pipes and lines without cavities and does not need to be compacted. However, the protective liquid soil layer (flowability >200 mm spread), which later hardens within 28 days, acquires the necessary properties: mechanical strength (sufficient strength ≥0.5 MPa according to ref. [5]) and thermal conductivity (less than or equal to 1.2 K m/W according to ref. [6]). Mechanical strength and thermal conductivity parameters are relevant to ensure the successful maintenance of the underground cable line in the road embankment [7]. Also, the dry protective soil layer can be applied, in which case the mixture must acquire the required mechanical properties within a day. Dry-mixed mixture means that the water content is intended for binder activation and the prepared mixture is nonplastic without any flowability (Figure 2). The main difference is that such a mixture needs to be compacted [8], and there is no necessity to use flexible combination shaft system as in the CLSM method. Also, as per the CLSM method, during the installation of cable lines and/or water, gas, or other supply lines, temporary position fixing elements must be used to avoid the floating of pipes and lines. For dry-mixed mixtures the following materials are most commonly used: sand, water, clay, bentonite, and cement [9,10,11,12]. Sand–bentonite mixtures are used in road embankments as a protective material to protect underground utility cables and pipelines. This is beneficial while laying high-voltage cables [7]. Due to the abovementioned properties of bentonite mixtures, i.e., low thermal resistance, these mixtures have good thermal interaction with cables and provide a stable basis for underground cable installations [13]. The strength of the top layer is enough to protect underground cable lines from external forces and it is easy to accomplish re-excavation as in the case of the CLSM method. The sand–bentonite mixture is fine and therefore does not cause mechanical damage to the cables. These mixtures are resistant to freeze–thaw cycles and have low water permeability [14,15,16]. The most popular use of bentonite is for creating an artificial water barrier [17,18,19]. Also, bentonite is widely used in landfills to isolate waste [20,21] from groundwater [22]. The following ratio is usually used for bentonite mixtures [23,24]: 100 parts of 10:1 bentonite/water mix with 20 parts of sand and 8 parts of cement. This mixture must be pumped into the duct to totally eliminate air. When the duct is filled, it must be sealed to prevent any escape of bentonite mixture [8].
It has been observed that in sand-bentonite mixtures, bentonite is evenly distributed and fills the voids around sand particles [25]. An essential property that results in water impermeability is that bentonite mixed with water can expand up to ten times [26]. Upon desiccating, the products of bentonite mixtures crack [27]. The higher the bentonite content and the lower the water content, the more cracks appear on the surface [28]. However, cracks close up moistened with water due to the swelling process [29]. Bentonite does not have good strength properties, but compressibility tests have shown that the strength of a sand–bentonite mixture can be substantially increased by adding cement [14,30,31]. By replacing part of the cement with bentonite, the compressive strength of the replaced sample becomes similar to that of the original sample [31]. The amount of bentonite and water has a significant influence on compaction and its quality [17]. Another property characteristic of mixtures containing bentonite is its low thermal resistivity [14]. The thermal resistivity of the soil depends on the type of soil and moisture and can range from 0.80 to 3.00 K m/W [32].
Bentonite or sand–bentonite mixtures have been investigated as a water leakage inhibitor [33] and different mixtures have been formulated, namely the Kunigel-V1 bentonite [34], the MX80 bentonite [35,36], the Calcigel bentonite [37], and others [11]. Sand–bentonite mixtures can be very diverse [31] – different types of bentonite (sodium bentonite, calcium bentonite, magnesium bentonite), the content of which varies from 3 to 80%. Different kinds of sands are supplemented with binders (Portland cement) and water [38]. Different quantities of bentonite and water affect the rate of stabilization, and it highlights different properties [20].
The purpose of this study is to determine the proportions as well as mechanical and thermal properties of a dry-mixed sand–bentonite mixture and to investigate the suitability of such mixtures for installation around high-voltage underground cable lines in road embankments. When selecting a sand–bentonite mixture, the following requirements of this research must be ensured: the compressive strength must be greater than 0.5 MPa after 24 h; the thermal resistivity must be less than 1.2 K m/W; and the moisture content of the sand–bentonite mixture must be less than 13%. If compressive strength is less than 0.5 MPa, it can be used with reinforced concrete tray and a reinforced concrete slab on top of it.
2 Source information
This research is related to one of the Lithuanian projects – the Vilnius Combined Heat and Power (CHP) plant. Waste incineration is beneficial in reducing the amount of waste accumulated in the Vilnius regional landfill. At the CHP plant, there are 110 kV underground power lines which cross the road embankment. Here, due to limited space, underground power line cables cannot be at the same level, and there is a certain distance between them [39]. So the cables must be installed in triangular shape (Figure 1), where three single cables are laid in a single reinforced concrete tray.
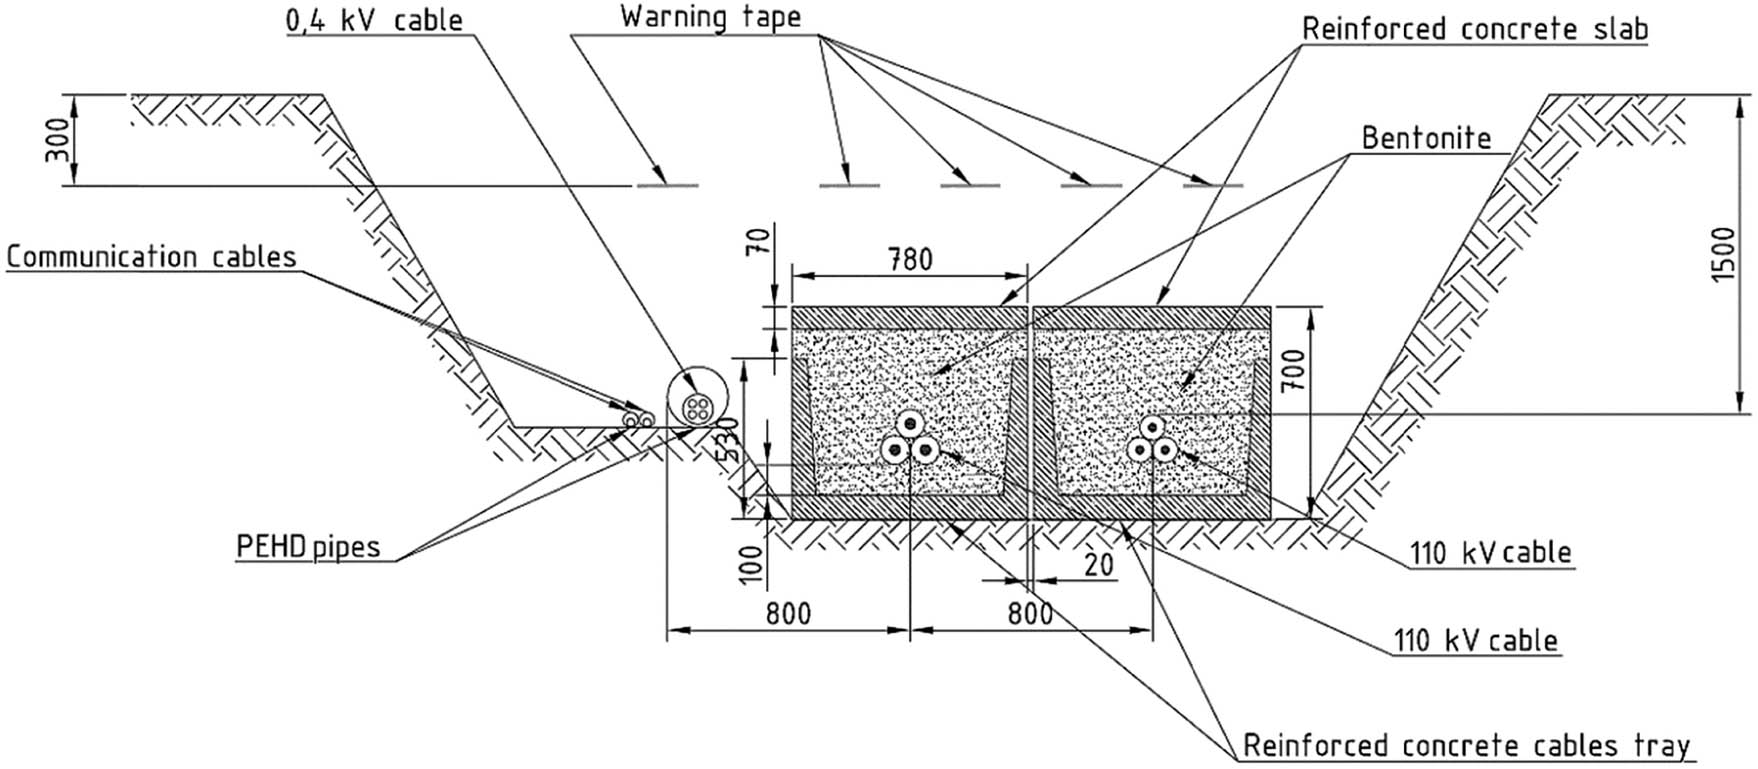
Cross-section of underground power line cable installation.
Underground power line cables are installed with a reinforced concrete base, and have at least a 20 cm layer of bentonite mixture around them. In this case, the bentonite layer must ensure thermal soil properties. Also, one of the requirements of the bentonite mixture is to use not more than 13% of water content and after 24 h the cables must be installed on bentonite mixture. After cable laying the next layer of bentonite mixture is installed, and on top of it a reinforced concrete slab is placed. Work on the road embankment starts only after all this is done.
3 Experimental set-up
The following materials were used for the sand-bentonite mixture: bentonite, 0–4.0 mm fraction sand, cement (CEM I 42.5 R), and water. The investigated main component of bentonite is montmorillonite My + nH2O(Al2y (Fe,Mg) y )Si4O10(OH)2, where M stands for Na/Ca minimum exchangeable cations 75%, and maximum carbonate content is 1.5%. In addition, bentonite contains accompanying minerals (impurities), such as smectites, calcite, dolomite, feldspar, kaolinite, and quartz in various percentages, which is related to the variability of the deposit. Bentonite swelling index is up to 8.0 cm3/2 g, bulk density – 0.8–1.0 g/cm3, pH value varies from 7 to 9, and grain size ≤0.056 mm. The used sand was even graded, and the mineral composition was with dominating quartz [40]. Only dry materials were mixed initially, later a small amount of water was added. The proportions of the substances are given in Table 1. The dry materials were mixed for 1–2 min, then water was added in and mixed for 1–2 min (Figure 2). After adding the water (small amount of water activates the cement), the mixing is still dry, because all the mixed mass does not reach plastic or even liquid limit.
Investigated bentonite mixture proportions (%)
| Sample group no. | Bentonite | Cement | Water | Sand |
|---|---|---|---|---|
| 1 | 100 | — | 10 | — |
| 2 | 78 | 6 | 10 | 16 |
| 3 | 36 | 9 | 10 | 55 |
| 4 | 55 | 9 | 10 | 36 |
| 5 | 45 | 9 | 20 | 45 |
| 6 | 9 | 9 | 10 | 82 |
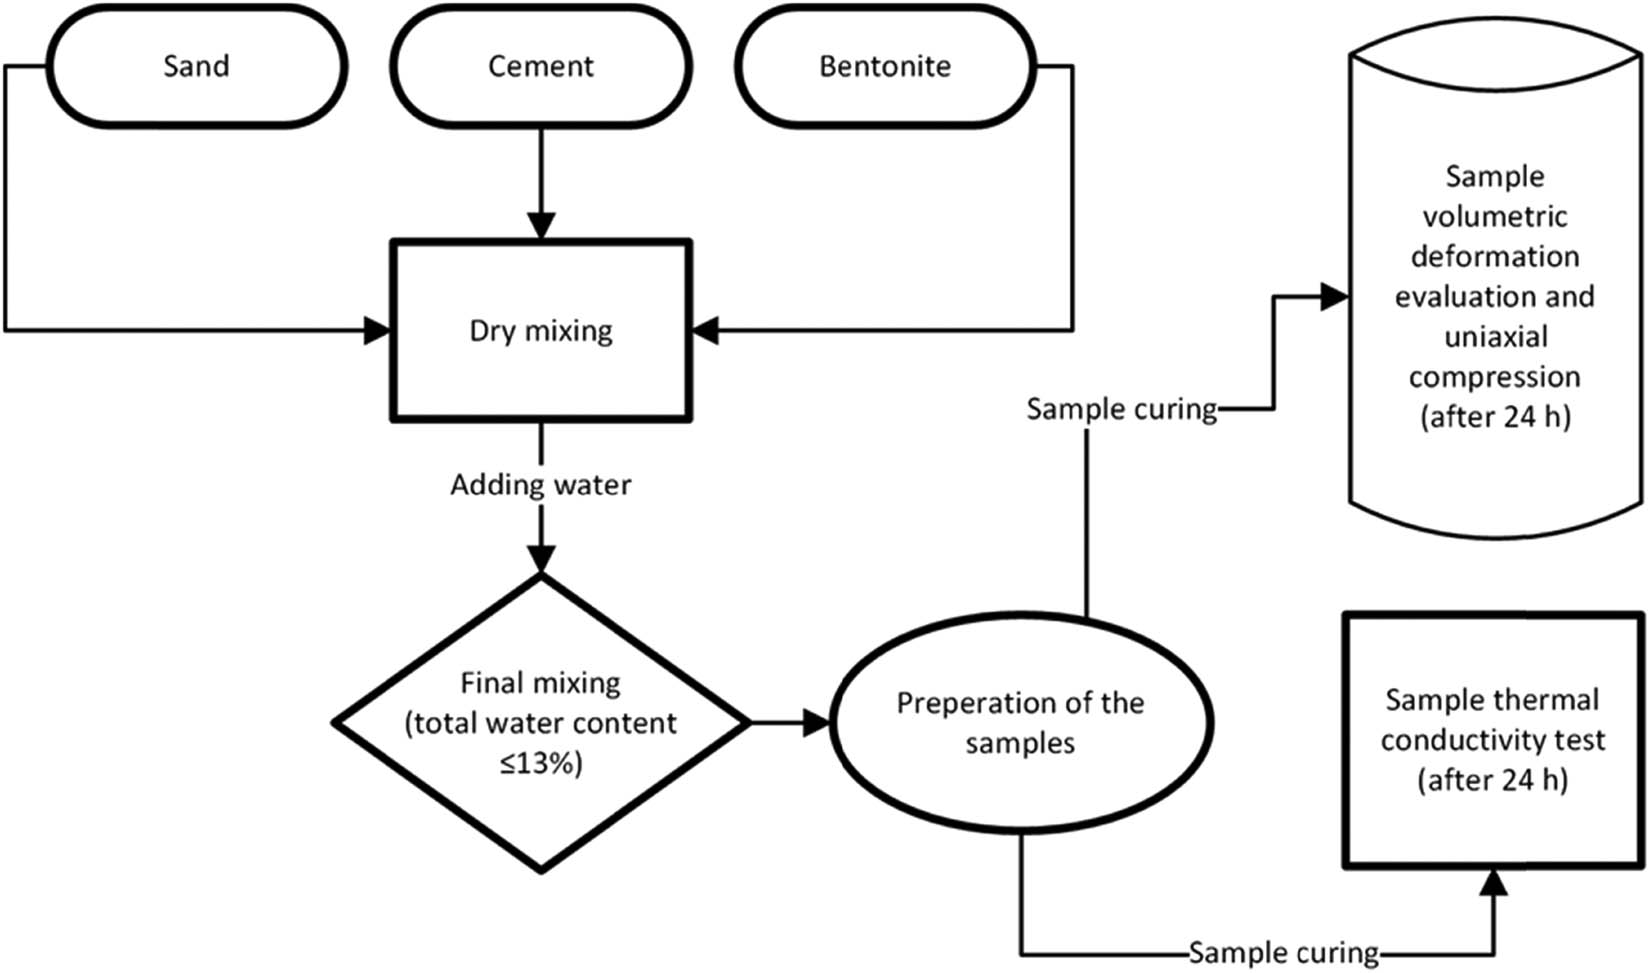
Flowchart of research program.
The tests were performed at a constant temperature of 20°C. All the samples were prepared using template form of 50 mm diameter and 100 mm height. After the preparation of the samples, none of them showed any visible signs of cracks. All the defects occurred within 24 h after the sample preparation (Figure 3).
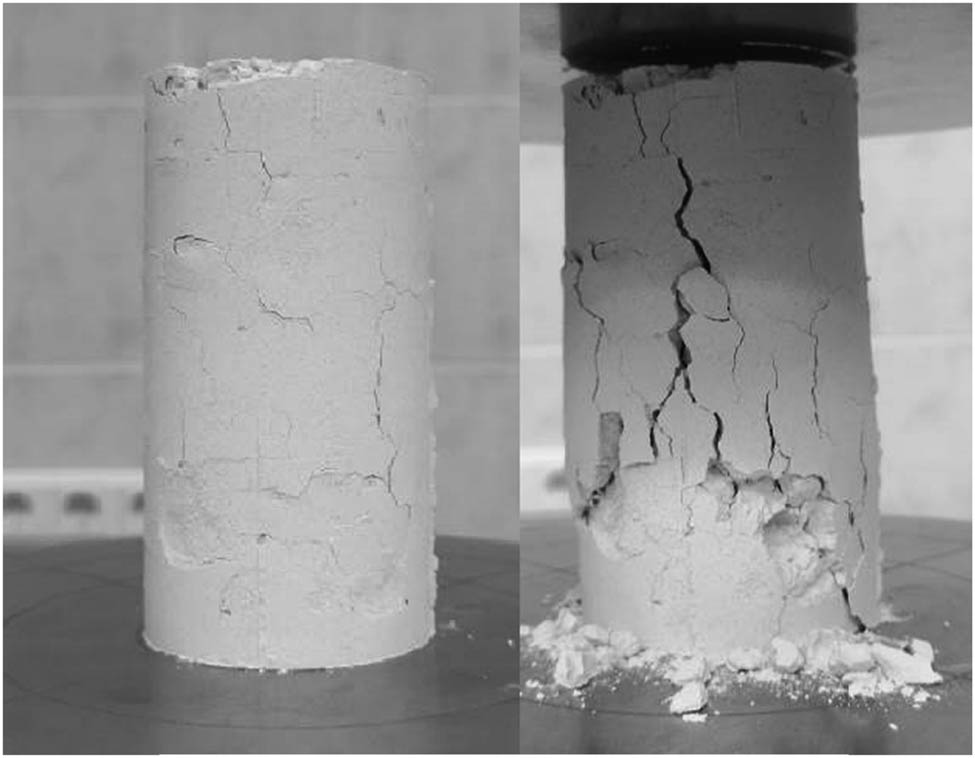
Signs of cracks in the samples after 24 h: on the left – before the compressive test, on the right – after the compressive test.
Before the compressive and thermal conductivity tests, the natural moisture content of the bentonite in the package and bentonite samples was determined. The test procedure of oven dry method was applied by these steps: the natural specimen was weighed and placed in a hot air oven with a temperature of 110 ± 5°C, and dried for 4 h. The weight of the dried soil sample was measured at 20°C. The natural moisture content of the bentonite in the package was determined to be 3.00% (with oven dry method). After 24 h, none of the prepared mixtures had a moisture content higher than 13.00%. The dimensions of the samples were measured immediately after preparation and after 24 h. In this way, the volumetric deformation (expansion) of the samples due to the interaction of water and bentonite, i.e., swelling of the bentonite mixture due to moisture appearing in the bentonite, was evaluated.
The compressive strength of the samples was determined with Walter + Bai AG 100 kN electromechanical universal testing machine. The samples were loaded with the sanded surfaces contacting the testing machine plates. The top loading plate has a spherical hinge. Uniaxial compression ramp 2 mm/min was applied.
The thermal conductivity coefficient is usually determined experimentally. There are several methods to determine it, which are based on comparatively simple principles. First, all methods are divided into steady and transient (unsteady) [41]. The tests to determine bentonite thermal conductivity were conducted using the steady method.
For testing the thermal properties, two samples were prepared (see positions 2 and 4 in Table 1) with a width and length of 300 mm and a height of 40 mm. The thermal conductivity tests were performed on the thermal conductivity test bench IZOL-01P (Figure 3).
In Figure 4, a schematic of the thermal conductivity test bench with the main elements is presented. This test bench consists of the ALMEMO 5690 multichannel data logger from Ahlborn (see No. 1 in Figure 4). A heat flow measuring board (3) “FQA018C” with a length and width of 120 mm, a measuring range from −40 to +80°C and an accuracy of 5% at +23°C is connected to this data logger. Temperature sensors are also connected to this data logger; they record the surface temperatures of the heated (5) and cooled plates (4) and are adjacent to the sample. The temperature of these surfaces is recorded by NiCr-Ni T 190-0 thermocouples, measuring range from −25 to +400°C, and they are assigned to accuracy class 2. To measure the thickness of the sample, a position sensor “FWA050T” (6) is connected to the data logger. The maximum length of the position sensor measurement is 50 mm and its resolution is 0.01 mm. The surface temperature of the heating plate (5) is regulated by a temperature controller (2), which turns on or off the relay that supplies electricity to the electric heater on the plate. The cooled surface (3) is cooled with water.
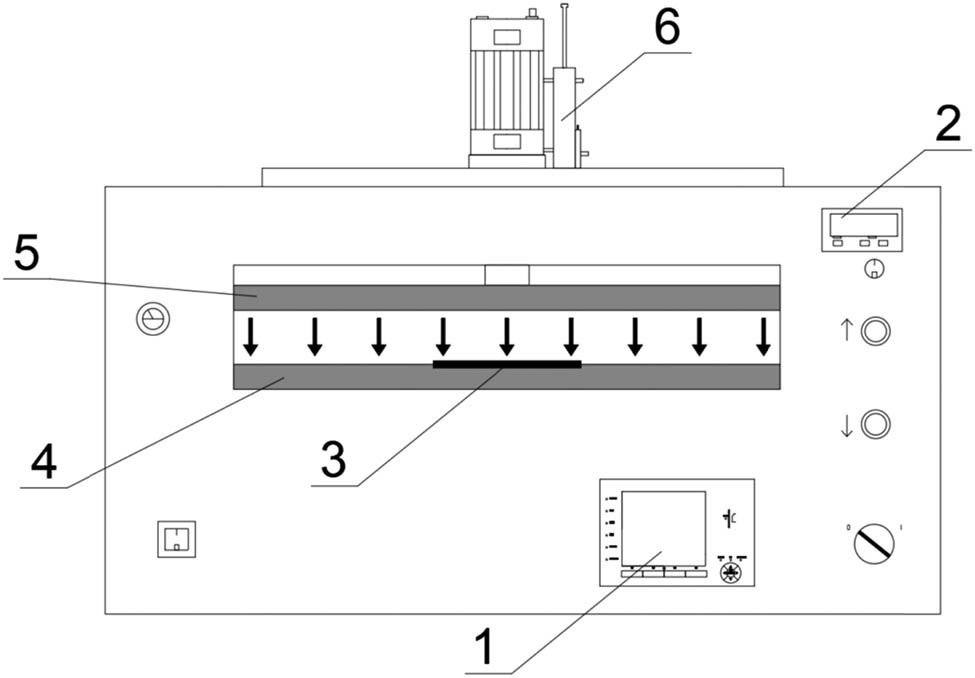
Thermal conductivity measuring test bench IZOL-01P.
A digital photograph showing how the sample is placed into the test bench is provided in Figure 5. In this photograph, it can be seen that the sample is prepared in a special form (dashed rectangular) so that it does not collapse during the test when a hot plate is pressed against it. A layer of sand 40 mm thick is supported by four thinner supporting forms.
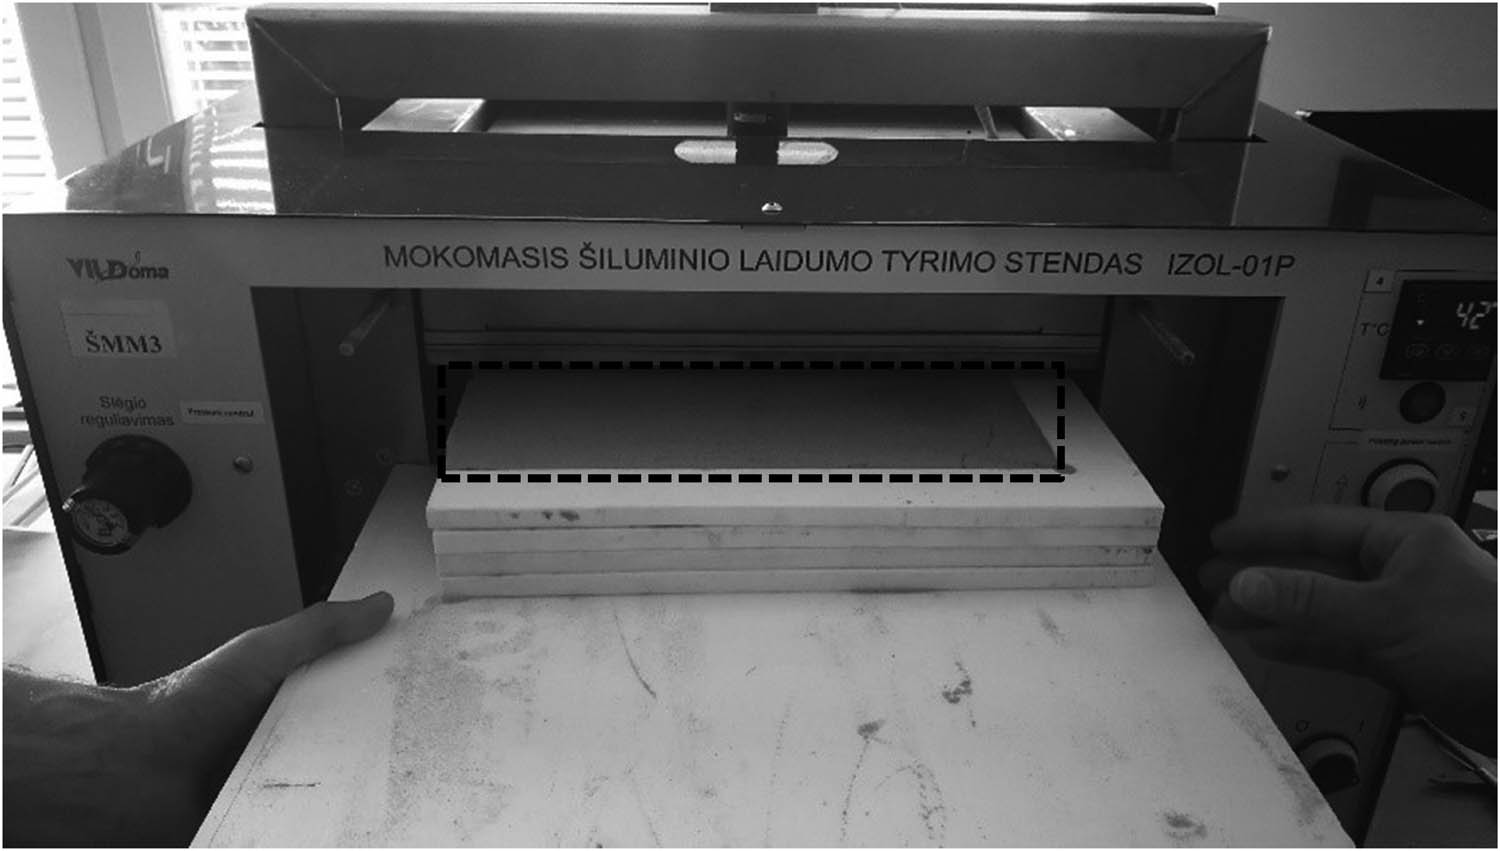
Sample A is placed into the thermal conductivity measuring test bench.
The next principle followed in determining the thermal conductivity of a given material by steady method is the following: a heat source with an evenly distributed heat flow is placed near one side of the sample and a cooler near the other side. At steady state (the temperature at individual points does not change over time), the same heat flows near the hot and cold sides of the sample.
Knowing its value and the surface temperatures of the sample, according to Fourier law, the numerical value of the thermal conductivity coefficient can be found by evaluating the form of the sample. In direct mode, a steady heat flow passing through the test plate:
where λ is the thermal conductivity coefficient (W/(m K)); d is the tested plate thickness (m); t 1 is the temperature of heated side of the plate (°C); t 2 is the temperature of cooled side of the plate (°C); and Q is the heat flow (W/m2).
Using the following equation thermal conductivity is determined:
Thermal resistance of material is calculated according to the following equation:
where λ is the thermal conductivity coefficient (W/(m K)); R is the thermal resistance ((m2 K)/W); and d is the material thickness (m).
The results of the test are discussed below.
4 Obtained results
The proportions of tested bentonite mixtures and their strengths after 24 h are given in Table 2. According to the determined compressive strengths, only sample No. 6 had strength greater than 0.5 MPa [5]. The bentonite mixture can be installed in a reinforced concrete tray with reinforced concrete slab on top, thus lower strength values can be accepted. All samples were prepared with a moisture content of 13% (estimating the natural moisture content of bentonite equal to 3%). After a setting time of 24 h, the maximum moisture was found in a mixture of 100% bentonite and 10% water, which was 9.38%. It was observed that by increasing the ratio of the sand fraction in the mixture, the samples desiccated faster, i.e., the sample evaporated the free water faster. Also, the volumetric deformations of the samples were observed, which occurred within 24 h (Table 3).
Properties of bentonite mixtures
| Bentonite | Cement | Water | Sand | Sample group no. | Diameter | Height | Density | Water content after 24 h | Failure load |
|---|---|---|---|---|---|---|---|---|---|
| (%) | (%) | (%) | (%) | (mm) | (mm) | (cm3/g) | (%) | (kPa) | |
| 100 | — | 10 | — | 1.1 | 50.0 | 100.0 | 1.17 | 9.38 | 3.31 |
| 1.2 | 50.0 | 100.5 | 1.19 | 2.50 | |||||
| 1.3 | 50.0 | 100.9 | 1.19 | 8.56 | |||||
| Average | 50.0 | 100.5 | 1.18 | 4.79 | |||||
| 78 | 6 | 10 | 16 | 2.1 | 50.0 | 102.3 | 1.28 | 8.33 | 10.34 |
| 2.2 | 50.0 | 102.0 | 1.31 | 25.73 | |||||
| 2.3 | 50.0 | 102.0 | 1.32 | 23.24 | |||||
| Average | 50.0 | 102.1 | 1.30 | 19.77 | |||||
| 36 | 9 | 10 | 55 | 3.1 | 50.0 | 101.7 | 1.65 | 4.59 | 93.64 |
| 3.2 | 50.1 | 101.8 | 1.63 | 117.14 | |||||
| 3.3 | 50.1 | 101.9 | 1.63 | 109.27 | |||||
| Average | 50.1 | 101.8 | 1.64 | 106.68 | |||||
| 55 | 9 | 10 | 36 | 4.1 | 50.9 | 102.0 | 1.49 | 6.15 | 33.65 |
| 4.2 | 51.1 | 102.2 | 1.48 | 53.92 | |||||
| 4.3 | 51.0 | 102.3 | 1.46 | 49.12 | |||||
| Average | 51.0 | 102.2 | 1.48 | 45.56 | |||||
| 45 | 9 | 20 | 45 | 5.1 | 50.0 | 102.2 | 1.73 | 6.85 | 494.43 |
| 5.2 | 50.5 | 101.9 | 1.70 | 347.00 | |||||
| 5.3 | 50.3 | 101.7 | 1.69 | 324.85 | |||||
| Average | 50.3 | 101.9 | 1.71 | 389.03 | |||||
| 9 | 9 | 10 | 82 | 6.1 | 51.0 | 101.8 | 1.95 | 4.13 | 475.61 |
| 6.2 | 51.2 | 102.0 | 1.94 | 564.59 | |||||
| 6.3 | 50.9 | 102.1 | 1.92 | 555.32 | |||||
| Average | 51.1 | 102.0 | 1.94 | 531.84 |
Changes of samples’ volume
| Sample group | Volume after sample preparation (cm3) | Volume after 24 h of sample preparation (cm3) | Volume change (%) |
|---|---|---|---|
| 1 | 196.25 | 197.23 | 0.50 |
| 2 | 196.25 | 200.37 | 2.06 |
| 3 | 196.25 | 200.48 | 2.11 |
| 4 | 196.25 | 208.67 | 5.95 |
| 5 | 196.25 | 202.39 | 3.03 |
| 6 | 196.25 | 209.08 | 6.14 |
By analyzing the two criteria, i.e., the bentonite content of the bentonite–sand mixture is more than 50% [42] (including the volumetric deformations of the samples) and the bentonite mixture is enclosed in a reinforced concrete tray, it was decided to perform tests to determine the thermal resistivity for the second and fourth groups of samples (Table 1). The second group is indicated as sample A and the fourth group is indicated as sample B (Table 4). Sample A has a low compressive strength (Table 2), but cracks a little (Figure 6). Sample B has a high compressive strength (Table 2), but the signs of cracking are higher than in sample A (Figure 7).
Selected samples for determination of thermal conductivity
| Sample group | Sample group in Table 1 | Bentonite (%) | Cement (%) | Sand (%) | Failure load (kN) |
|---|---|---|---|---|---|
| A | 2 | 78 | 6 | 16 | 19.77 |
| B | 4 | 55 | 9 | 36 | 45.56 |
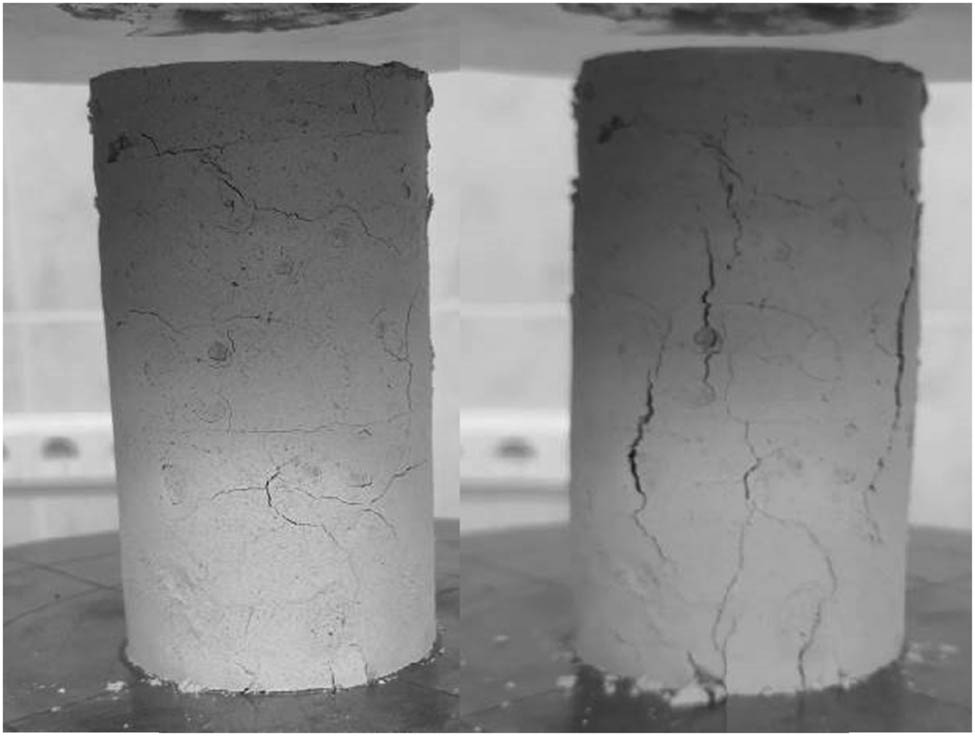
Signs of cracks in the second group of samples after 24 h: on the left – before the compressive test, on the right – after the compressive test.
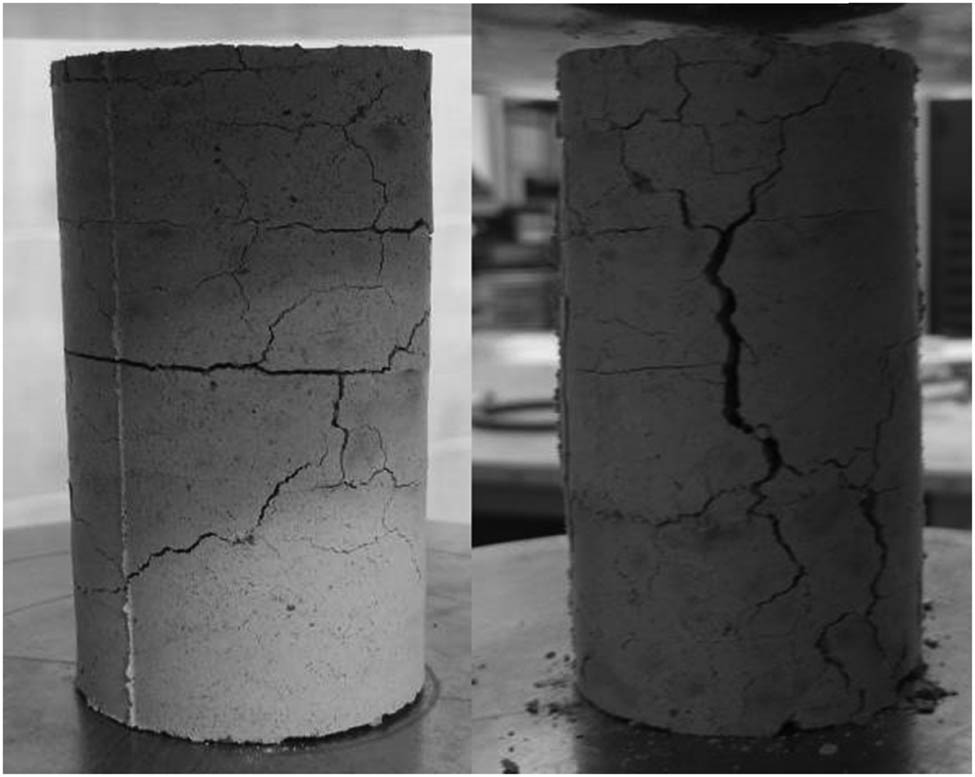
Signs of cracks in the fourth group of samples after 24 h: on the left – before the compressive test, on the right – after the compressive test.
The thermal conductivity is determined for samples A and B (Table 4). Sample A (composition corresponds to sample No. 2 in Table 1) has a thickness of about 45.1 mm and a measurement time of 20 h. The data are recorded and stored at 1 min intervals. Sample B (composition corresponds to sample No. 4 in Table 1) has a thickness of 46.5 mm and a measurement time of 21 h. About 1,200 measurements were collected for each sample.
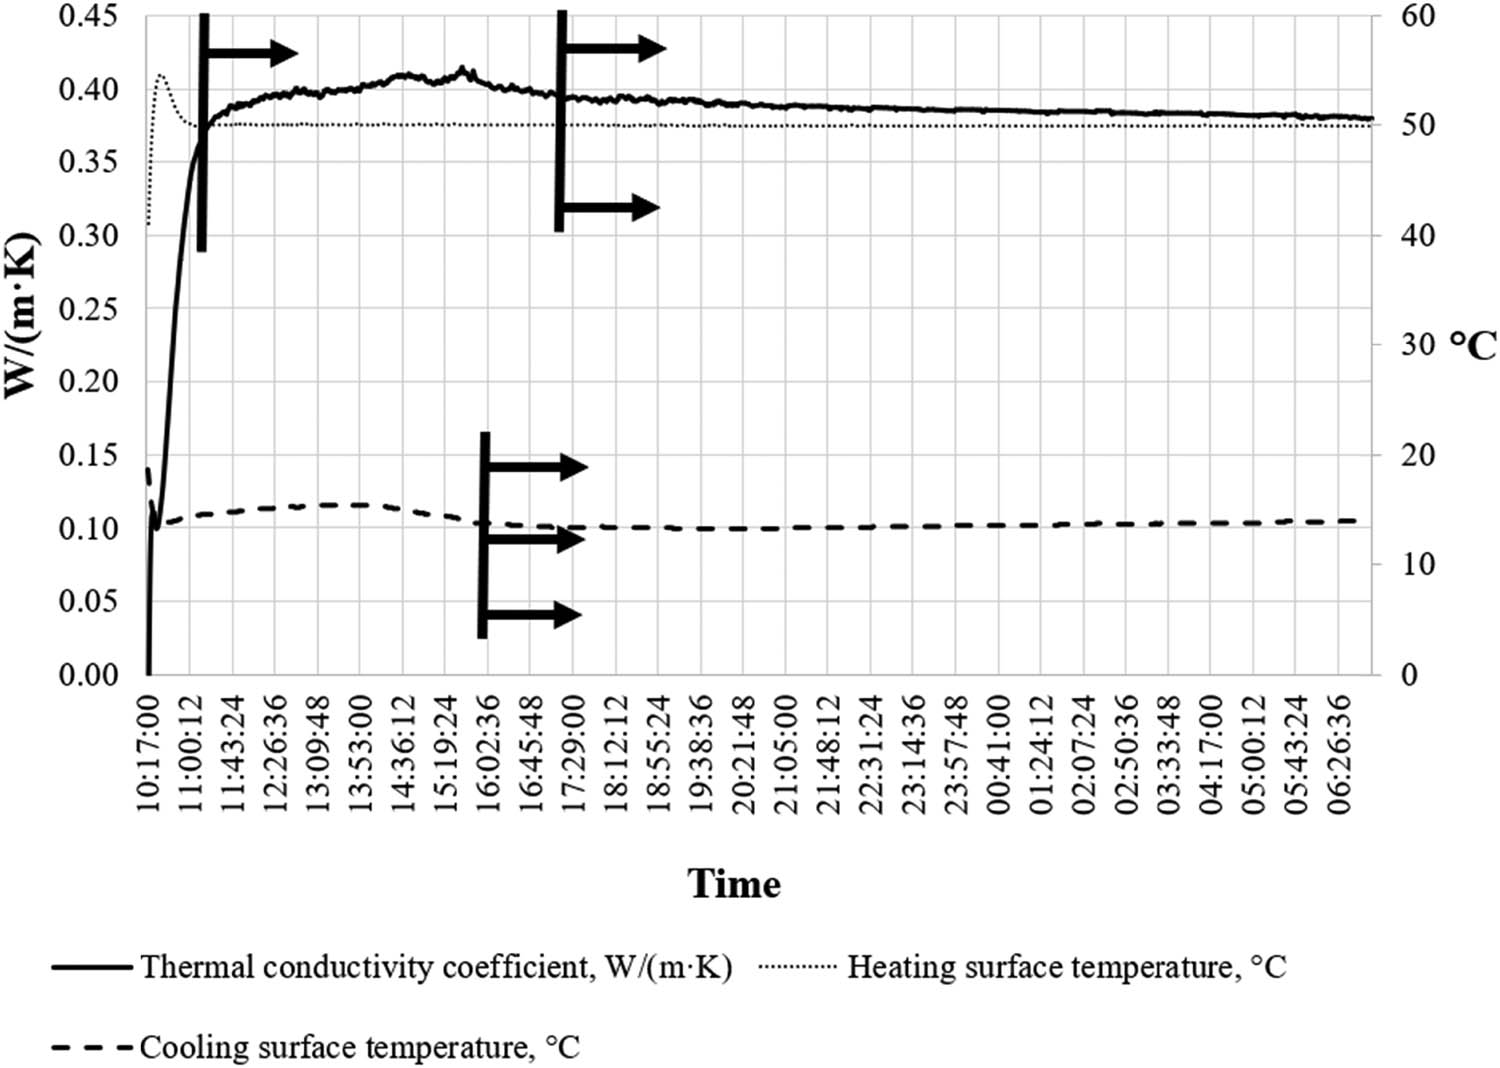
Figure 8 shows the measurement results of sample A, i.e., the temperature of the heated (see black dotted line in Figure 8) and cooled (see black dashed line in Figure 8) surfaces and thermal conductivity (see black line in Figure 8) determined according to equation (2). In this figure, it can be seen that the temperature of the warm plate has stabilized within 40 min since the start of the test (see vertical black line with one arrow pointing to the right), the temperature of the cooled surface (see vertical black line with three arrows pointing to the right) has stabilized after approximately 6 h, and the thermal conductivity (see vertical black line with two arrows pointing to the right in Figure 8) has stabilized after approximately 7 h. It can also be observed that as the thermal conductivity process stabilizes, it has gradually decreased over time. This decrease is possible because the sample was measured 1 day after it was manufactured, so it may not be completely desiccated and the moisture content in it decreased during the measurement. The thermal conductivity is estimated as the average value of the steady state, which is equal to 0.307 W/(m K).
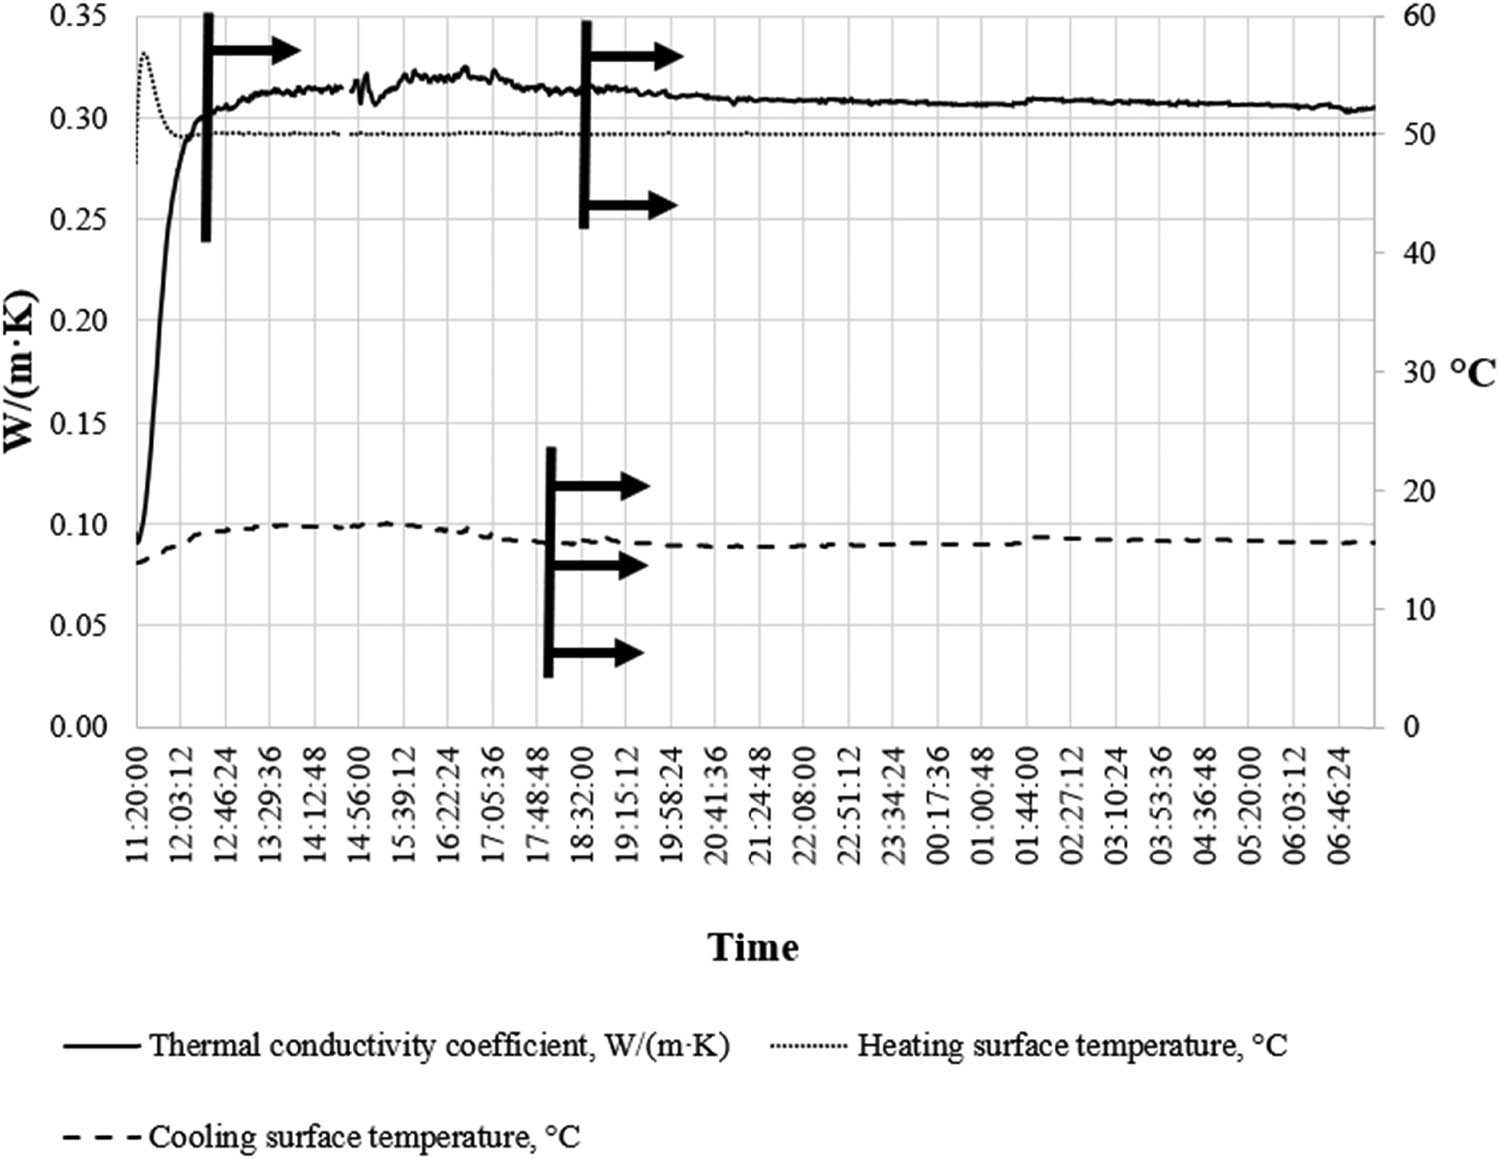
Sample A measurement data and conductivity coefficient values.
The notations in Figure 9 are the same as in Figure 8. In Figure 9, it can be seen that the temperature of the warm plate has stabilized within 40 min. From the start of the test, the temperature of the cooled surface has stabilized after approximately 6 h, and the thermal conductivity (see Figure 9 vertical black line with the two arrows pointing to the right) has stabilized after approximately 7 h. It can also be observed that after the stabilization of the thermal conductivity process, it gradually decreased over time as in test A. The reasons for this decrease are the same as for sample A, i.e., variation in humidity in the sample over the period measured. The thermal conductivity is estimated as the average value of the settled period, which is equal to 0.385 W/(m K).
Sample B measurement data and conductivity coefficient values.
Figure 10 shows the values of thermal conductivity and thermal resistance during the analyzed period of both the samples. Here, the maximum coefficient of thermal conductivity is observed in sample B’s case. The values of the thermal conductivity coefficient stabilize after approximately 7 h of measurement (see Figure 8 vertical black line with the two arrows pointing to the right) and remain constant for most of the remaining period. A very small decrease in the coefficient of thermal conductivity can be observed, which can be related to the evaporation of moisture from the samples.
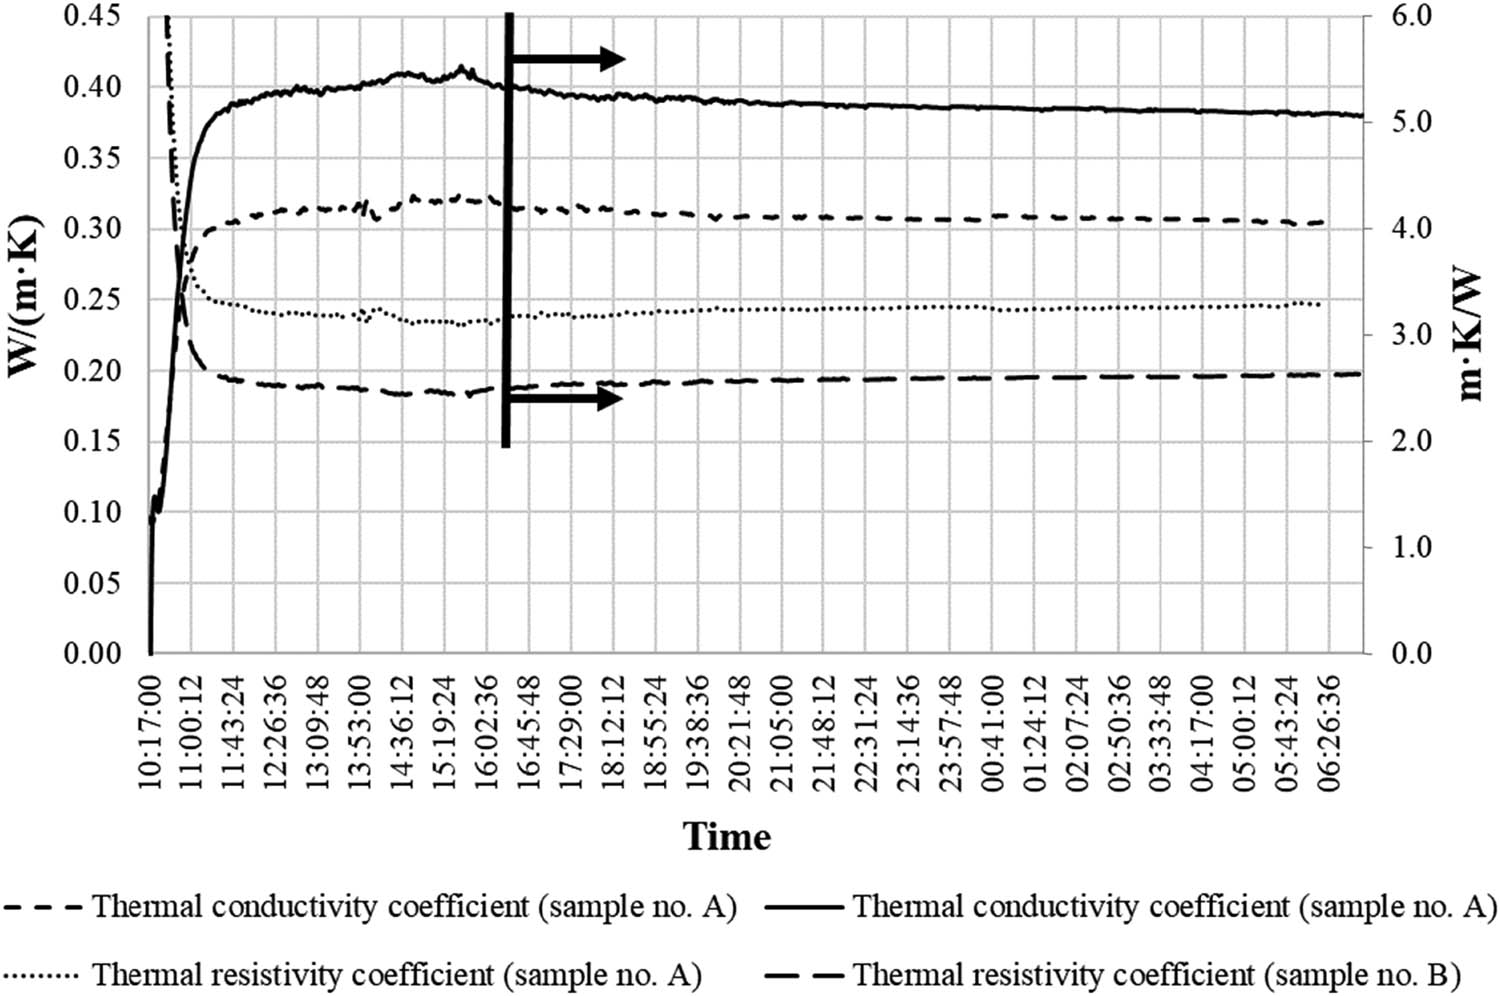
Thermal conductivity coefficient values for tested samples.
The thermal conductivity coefficient of sample A was found to be 0.307 W/(m K), and the transfer coefficient of the sample B was about 20% bigger than that of sample A, i.e., 0.385 W/(m K). Therefore, for laying high voltage electrical cables it is more appropriate to use the bentonite mixture of sample B.
5 Conclusion
The analysis of the strength and thermal conductivity of bentonite, sand, cement, and water mixture of various compositions revealed:
According to the determined compressive strengths, only sample No. 6 had strength greater than 0.5 MPa. The compressive strength of other samples ranged from 0.0025 up to 0.564 MPa. The obtained strength values allow to continue construction works in site after 1 day of mixture laying, as the bentonite mixture is applied in a reinforced concrete tray.
The thermal conductivity coefficient of sample A was found to be 0.307 W/(m K) (thermal resistivity 3.25 m K/W), and the transfer coefficient of sample B was about 20% bigger than that of sample A, i.e., 0.385 W/(m K) (thermal resistivity 2.597 m K/W). Therefore, for laying high voltage electrical cables it is more appropriate to use the bentonite mixture of sample B.
A very small decrease in the coefficient of thermal resistivity can be observed, which may be related to the evaporation of moisture from the samples.
The required thermal conductivity properties of the soil are not achieved by dry mixing. The disadvantage of dry mixing – sand mixed with bentonite and cement which has very low water content (<13%) forms a heat insulating layer. For those cases, when compression strength is less than 0.5 MPa, it is necessary to use reinforced concrete tray with reinforced concrete slab on top. This method of mixing can be useful only in cases in which the thermal conductivity of the mixed soil is not relevant, because the work can be continued after 1 day.
-
Author contributions: Š.S. conceived and planned the experiments. M.Z. and J.B carried out the experiments. M.Z. and J.B. contributed to sample preparation. Š.S. and G.Š. contributed to the interpretation of the results. Š.S. and G.Š. took the lead in writing the manuscript. All authors provided critical feedback and helped conduct the research and analysis, and to prepare the manuscript.
-
Conflict of interest: Authors state no conflict of interest.
References
[1] Bartlett SF, Lingwall BN, Vaslestad J. Methods of protecting buried pipelines and culverts in transportation infrastructure using EPS geofoam. Geotext Geomembr. 2015;43(5):450–61. 10.1016/j.geotexmem.2015.04.019.Search in Google Scholar
[2] Kuliczkowska E. An analysis of road pavement collapses and traffic safety hazards resulting from leaky sewers. Balt J Road Bridge Eng. 2016;11(4):251–8. 10.3846/bjrbe.2016.29.Search in Google Scholar
[3] Delmastro C, Lavagno E, Schranz L. Energy and underground. Tunn Undergr Space Technol. 2016;55:96–102. 10.1016/j.tust.2015.10.021.Search in Google Scholar
[4] Do TM, Kim HK, Kim MJ, Kim YS. Utilization of controlled low strength material (CLSM) as a novel grout for geothermal systems: laboratory and field experiments. J Build Eng. 2020;29:101110. 10.1016/j.jobe.2019.101110.Search in Google Scholar
[5] MN GPSR 12. Gruntų pagerinimo ir sustiprinimo rišikliais metodiniai nurodymai MN GPSR 12. Lietuvos automobilių kelių direkcija prie Susisiekimo ministerijos; 2012. p. 25 (in Lithuanian).Search in Google Scholar
[6] EĮĮBT. Elektros įrenginių įrengimo bendrosios taisyklės. Lietuvos Respublikos energetikos ministro įsakymas Nr. 1–22; 2012 (in Lithuanian).Search in Google Scholar
[7] Ocłoń P, Bittelli M, Cisek P, Kroener E, Pilarczyk M, Taler D, et al. The performance analysis of a new thermal backfill material for underground power cable system. Appl Therm Eng. 2016;108:233–50. 10.1016/j.applthermaleng.2016.07.102.Search in Google Scholar
[8] Ling TC, Kaliyavaradhan SK, Poon CS. Global perspective on application of controlled low-strength material (CLSM) for trench backfilling – AN overview. Constr Build Mater. 2018;158:535–48. 10.1016/j.conbuildmat.2017.10.050.Search in Google Scholar
[9] Onyejekwe S, Ghatora GS. Soil stabilization using proprietary liquid chemical stabilizers: sulphonated oil and a polymer. Bull Eng Geol Environ. 2015;74(12):651–65. 10.1007/s10064-014-0667-8.Search in Google Scholar
[10] Rezaeimalek S, Huang J, Bin-Shafique S. Evaluation of curing method and mix design of a moisture activated polymer for sand stabilization. Constr Build Mater. 2017;146(15):210–20. 10.1016/j.conbuildmat.2017.04.093.Search in Google Scholar
[11] Lafiti N, Marto A, Eisazadeh A. Physicochemical behavior of tropical laterite soil stabilized with non-traditional additive. Acta Geotech. 2016;11(2):433–43. 10.1007/s11440-015-0370-3.Search in Google Scholar
[12] Lv Q, Chang Ch, Zhao B, Ma B. Loess soil stabilization by means of SiO2 nanoparticles. Soil Mech Found Eng. 2018;54(6):409–13. 10.1007/s11204-018-9488-2.Search in Google Scholar
[13] Akesson M, Jacinto AC, Gatabin C, Sanchez M, Ledesma A. Bentonite THM behaviour at high temperatures: experimental and numerical analysis. Geotechnique. 2009;59(4):307–18. 10.1680/geot.2009.59.4.307.Search in Google Scholar
[14] Alkaya D, Barış EA. Usability of sand-bentonite-cement mixture in the construction of unpermeable layer. Sci Res Essays. 2011;6(21):4492–4503. 10.5897/SRE10.1189.Search in Google Scholar
[15] Vaitkus A, Žalimienė L, Židanavičiūtė J, Žilionienė D. Influence of temperature and moisture content on pavement bearing capacity with improved subgrade. Materials. 2019;12(23):1–29. 10.3390/ma12233826.Search in Google Scholar PubMed PubMed Central
[16] Vaitkus A, Vorobjovas V, Žiliūtė L, Kleizienė R, Ratkevičius T. Optimal selection of soils and aggregates mixtures for a frost blanket course of road pavement structure. Balt J Road Bridge Eng. 2012;7(2):154–9. 10.3846/bjrbe.2012.21.Search in Google Scholar
[17] Sallfors G, Oberg-Hogsta A. Determination of hydraulic conductivity of sand-bentonite mixtures for engineering purposes. Geotech Geol Eng. 2002;20:65–80. 10.1023/A:1013857823676.Search in Google Scholar
[18] Komine H. Predicting hydraulic conductivity of sand–bentonite mixture backfill before and after swelling deformation for underground disposal of radioactive wastes. Eng Geol. 2010;114(3–4):123–34. 10.1016/j.enggeo.2010.04.009.Search in Google Scholar
[19] Chen YG, Zhu CM, Ye WM, Cui YJ, Chen B. Effects of solution concentration and vertical stress on the swelling behavior of compacted GMZ01 bentonite. Appl Clay Sci. 2016;124–125:11–2. 10.1016/j.clay.2016.01.050.Search in Google Scholar
[20] Zeng Z, Cui Y, Zhang F, Conil N, Talandier J. Investigation of swelling pressure of bentonite/claystone mixture in the full range of bentonite fraction. Appl Clay Sci. 2019;178:105137. 10.1016/j.clay.2019.105137.Search in Google Scholar
[21] Zheng L, Xu H, Rutqvist J, Reagan M, Birkholzer J, Villar MV, et al. The hydration of bentonite buffer material revealed by modeling analysis of a long-term in situ test. Appl Clay Sci. 2020;185:105360. 10.1016/j.clay.2019.105360.Search in Google Scholar
[22] Mishra AK, Ohtsubo M, Li LY, Higashi T. Influence of the bentonite on the consolidation behaviour of soil–bentonite mixtures. Carbon Evapor. 2010;25:43–9. 10.1007/s13146-010-0006-5.Search in Google Scholar
[23] TG-PS-881. The provision and installation of electricity service, intake and distributor cables. Scottish and Southern Energy Power Distribution. p. 16.Search in Google Scholar
[24] SD8B3 (Part 6). Relating to 275kV underground cable ratings, Western Power Distribution. South West, PLC; 2009. p. 33.Search in Google Scholar
[25] Kenney TC, Van Veen WA, Swallow MA, Sungaila MA. Hydraulic conductivity of compacted bentonite–sand mixtures. Can Geotech J. 1992;29(3):364–74. 10.1139/t92-042.Search in Google Scholar
[26] Bowles JH. Engineering properties of soils and their measurement. 3rd edn. Singapore: Mcgraw-Hill Book Company; 1998.Search in Google Scholar
[27] Kleppe JH, Olson RE. Desiccation cracking of soil barriers. Hydr Barr Soil Rock. 1985;874:263–75. 10.1520/STP34583S.Search in Google Scholar
[28] Esener AB. Geotechnical studies to design soil fill structures. MSc thesis. Denizli: Pamukkale University, Institute of Scienes; 2005.Search in Google Scholar
[29] Boardman BT, Daniel DE. Hydraulic conductivity of desiccated geosynthetic clay liners. J Geotech Eng. 1996;122(3):204–8. 10.1061/(ASCE)0733-9410(1996)122:3(204).Search in Google Scholar
[30] Kaufhold S, Dohrmann R, Ufer K. Determining the extent of bentonite alteration at the bentonite/cement interface. Appl Clay Sci. 2020;186:105446. 10.1016/j.clay.2020.105446.Search in Google Scholar
[31] Mengliang L, Yang H, Zhenyu L, Tao Y, Xin H, Jie W, et al. Influence of various bentonites on the mechanical properties and impermeability of cement mortars. Constr Build Mater. 2020;241:118015. 10.1016/j.conbuildmat.2020.118015.Search in Google Scholar
[32] General rules for the installation of electrical equipment. Vilnius, The ministry of Energy; 2012 (in Lithuanian).Search in Google Scholar
[33] Komine H, Ogata N. Experimental study on swelling characteristics of compacted bentonite. Can Geotech J. 1994;31(4):478–90. 10.1139/t94-057.Search in Google Scholar
[34] Sun DA, Cui H, Sun WJ. Swelling of compacted sand-bentonite mixtures. Appl Clay Sci. 2009;43(3–4):485–92. 10.1016/j.clay.2008.12.006.Search in Google Scholar
[35] Saba S, Barnichon JD, Cui YJ, Tang AM, Delage P. Microstructure and anisotropic swelling behaviour of compacted bentonite/sand mixture. J Rock Mech Geotech Eng. 2014;6(2):126–32. 10.1016/j.jrmge.2014.01.006.Search in Google Scholar
[36] Kivikovski H, Heimonen I, Hyttinen H. Bentonite pellet thermal conductivity techniques and measurments. Report no. 2015-09:50; 2015.Search in Google Scholar
[37] Agus SS, Schanz T. A method for predicting the swelling pressure of compacted bentonites. Acta Geotech. 2008;3(2):125. 10.1007/s11440-008-0057-0.Search in Google Scholar
[38] Tripathi KK. Hydraulic conductivity prediction of saturated sand-bentonite mixtures. Geotech Geol Eng. 2013;31(2):581–91. 10.1007/s10706-012-9610-6.Search in Google Scholar
[39] Sundberg J. Evaluation of thermal transfer processes and back-fill material around buried high voltage power cables. Report/Department of Civil and Environmental Engineering, Chalmers University of Technology. Report no. 5; 2016.Search in Google Scholar
[40] Martinkus V, Norkus A, Statkus T, Žilionienė D. Experimental investigation of stresses in sand during the installation and loading of the short displacement pile. Balt J Road Bridge Eng. 2014;9(1):10–6. 10.3846/bjrbe.2014.02.Search in Google Scholar
[41] Vitiello D, Nait-Ali B, Tessier-Doyen N, Tonnesen T, Laím L, Rebouillat L, et al. Thermal conductivity of insulating refractory materials: comparison of steady-state and transient measurement methods. Open Ceram. 2021;6:1–9. 10.1016/j.oceram.2021.100118.Search in Google Scholar
[42] Sun W, Wei Z, Sun D, Liu S, Fatahi B, Wang X. Evaluation of the swelling characteristics of bentonite–sand mixtures. Eng Geol. 2015;199:1–11. 10.1016/j.enggeo.2015.10.004.Search in Google Scholar
© 2021 Mindaugas Zakarka et al., published by De Gruyter
This work is licensed under the Creative Commons Attribution 4.0 International License.
Articles in the same Issue
- Regular Articles
- Lithopetrographic and geochemical features of the Saalian tills in the Szczerców outcrop (Poland) in various deformation settings
- Spatiotemporal change of land use for deceased in Beijing since the mid-twentieth century
- Geomorphological immaturity as a factor conditioning the dynamics of channel processes in Rządza River
- Modeling of dense well block point bar architecture based on geological vector information: A case study of the third member of Quantou Formation in Songliao Basin
- Predicting the gas resource potential in reservoir C-sand interval of Lower Goru Formation, Middle Indus Basin, Pakistan
- Study on the viscoelastic–viscoplastic model of layered siltstone using creep test and RBF neural network
- Assessment of Chlorophyll-a concentration from Sentinel-3 satellite images at the Mediterranean Sea using CMEMS open source in situ data
- Spatiotemporal evolution of single sandbodies controlled by allocyclicity and autocyclicity in the shallow-water braided river delta front of an open lacustrine basin
- Research and application of seismic porosity inversion method for carbonate reservoir based on Gassmann’s equation
- Impulse noise treatment in magnetotelluric inversion
- Application of multivariate regression on magnetic data to determine further drilling site for iron exploration
- Comparative application of photogrammetry, handmapping and android smartphone for geotechnical mapping and slope stability analysis
- Geochemistry of the black rock series of lower Cambrian Qiongzhusi Formation, SW Yangtze Block, China: Reconstruction of sedimentary and tectonic environments
- The timing of Barleik Formation and its implication for the Devonian tectonic evolution of Western Junggar, NW China
- Risk assessment of geological disasters in Nyingchi, Tibet
- Effect of microbial combination with organic fertilizer on Elymus dahuricus
- An OGC web service geospatial data semantic similarity model for improving geospatial service discovery
- Subsurface structure investigation of the United Arab Emirates using gravity data
- Shallow geophysical and hydrological investigations to identify groundwater contamination in Wadi Bani Malik dam area Jeddah, Saudi Arabia
- Consideration of hyperspectral data in intraspecific variation (spectrotaxonomy) in Prosopis juliflora (Sw.) DC, Saudi Arabia
- Characteristics and evaluation of the Upper Paleozoic source rocks in the Southern North China Basin
- Geospatial assessment of wetland soils for rice production in Ajibode using geospatial techniques
- Input/output inconsistencies of daily evapotranspiration conducted empirically using remote sensing data in arid environments
- Geotechnical profiling of a surface mine waste dump using 2D Wenner–Schlumberger configuration
- Forest cover assessment using remote-sensing techniques in Crete Island, Greece
- Stability of an abandoned siderite mine: A case study in northern Spain
- Assessment of the SWAT model in simulating watersheds in arid regions: Case study of the Yarmouk River Basin (Jordan)
- The spatial distribution characteristics of Nb–Ta of mafic rocks in subduction zones
- Comparison of hydrological model ensemble forecasting based on multiple members and ensemble methods
- Extraction of fractional vegetation cover in arid desert area based on Chinese GF-6 satellite
- Detection and modeling of soil salinity variations in arid lands using remote sensing data
- Monitoring and simulating the distribution of phytoplankton in constructed wetlands based on SPOT 6 images
- Is there an equality in the spatial distribution of urban vitality: A case study of Wuhan in China
- Considering the geological significance in data preprocessing and improving the prediction accuracy of hot springs by deep learning
- Comparing LiDAR and SfM digital surface models for three land cover types
- East Asian monsoon during the past 10,000 years recorded by grain size of Yangtze River delta
- Influence of diagenetic features on petrophysical properties of fine-grained rocks of Oligocene strata in the Lower Indus Basin, Pakistan
- Impact of wall movements on the location of passive Earth thrust
- Ecological risk assessment of toxic metal pollution in the industrial zone on the northern slope of the East Tianshan Mountains in Xinjiang, NW China
- Seasonal color matching method of ornamental plants in urban landscape construction
- Influence of interbedded rock association and fracture characteristics on gas accumulation in the lower Silurian Shiniulan formation, Northern Guizhou Province
- Spatiotemporal variation in groundwater level within the Manas River Basin, Northwest China: Relative impacts of natural and human factors
- GIS and geographical analysis of the main harbors in the world
- Laboratory test and numerical simulation of composite geomembrane leakage in plain reservoir
- Structural deformation characteristics of the Lower Yangtze area in South China and its structural physical simulation experiments
- Analysis on vegetation cover changes and the driving factors in the mid-lower reaches of Hanjiang River Basin between 2001 and 2015
- Extraction of road boundary from MLS data using laser scanner ground trajectory
- Research on the improvement of single tree segmentation algorithm based on airborne LiDAR point cloud
- Research on the conservation and sustainable development strategies of modern historical heritage in the Dabie Mountains based on GIS
- Cenozoic paleostress field of tectonic evolution in Qaidam Basin, northern Tibet
- Sedimentary facies, stratigraphy, and depositional environments of the Ecca Group, Karoo Supergroup in the Eastern Cape Province of South Africa
- Water deep mapping from HJ-1B satellite data by a deep network model in the sea area of Pearl River Estuary, China
- Identifying the density of grassland fire points with kernel density estimation based on spatial distribution characteristics
- A machine learning-driven stochastic simulation of underground sulfide distribution with multiple constraints
- Origin of the low-medium temperature hot springs around Nanjing, China
- LCBRG: A lane-level road cluster mining algorithm with bidirectional region growing
- Constructing 3D geological models based on large-scale geological maps
- Crops planting structure and karst rocky desertification analysis by Sentinel-1 data
- Physical, geochemical, and clay mineralogical properties of unstable soil slopes in the Cameron Highlands
- Estimation of total groundwater reserves and delineation of weathered/fault zones for aquifer potential: A case study from the Federal District of Brazil
- Characteristic and paleoenvironment significance of microbially induced sedimentary structures (MISS) in terrestrial facies across P-T boundary in Western Henan Province, North China
- Experimental study on the behavior of MSE wall having full-height rigid facing and segmental panel-type wall facing
- Prediction of total landslide volume in watershed scale under rainfall events using a probability model
- Toward rainfall prediction by machine learning in Perfume River Basin, Thua Thien Hue Province, Vietnam
- A PLSR model to predict soil salinity using Sentinel-2 MSI data
- Compressive strength and thermal properties of sand–bentonite mixture
- Age of the lower Cambrian Vanadium deposit, East Guizhou, South China: Evidences from age of tuff and carbon isotope analysis along the Bagong section
- Identification and logging evaluation of poor reservoirs in X Oilfield
- Geothermal resource potential assessment of Erdaobaihe, Changbaishan volcanic field: Constraints from geophysics
- Geochemical and petrographic characteristics of sediments along the transboundary (Kenya–Tanzania) Umba River as indicators of provenance and weathering
- Production of a homogeneous seismic catalog based on machine learning for northeast Egypt
- Analysis of transport path and source distribution of winter air pollution in Shenyang
- Triaxial creep tests of glacitectonically disturbed stiff clay – structural, strength, and slope stability aspects
- Effect of groundwater fluctuation, construction, and retaining system on slope stability of Avas Hill in Hungary
- Spatial modeling of ground subsidence susceptibility along Al-Shamal train pathway in Saudi Arabia
- Pore throat characteristics of tight reservoirs by a combined mercury method: A case study of the member 2 of Xujiahe Formation in Yingshan gasfield, North Sichuan Basin
- Geochemistry of the mudrocks and sandstones from the Bredasdorp Basin, offshore South Africa: Implications for tectonic provenance and paleoweathering
- Apriori association rule and K-means clustering algorithms for interpretation of pre-event landslide areas and landslide inventory mapping
- Lithology classification of volcanic rocks based on conventional logging data of machine learning: A case study of the eastern depression of Liaohe oil field
- Sequence stratigraphy and coal accumulation model of the Taiyuan Formation in the Tashan Mine, Datong Basin, China
- Influence of thick soft superficial layers of seabed on ground motion and its treatment suggestions for site response analysis
- Monitoring the spatiotemporal dynamics of surface water body of the Xiaolangdi Reservoir using Landsat-5/7/8 imagery and Google Earth Engine
- Research on the traditional zoning, evolution, and integrated conservation of village cultural landscapes based on “production-living-ecology spaces” – A case study of villages in Meicheng, Guangdong, China
- A prediction method for water enrichment in aquifer based on GIS and coupled AHP–entropy model
- Earthflow reactivation assessment by multichannel analysis of surface waves and electrical resistivity tomography: A case study
- Geologic structures associated with gold mineralization in the Kirk Range area in Southern Malawi
- Research on the impact of expressway on its peripheral land use in Hunan Province, China
- Concentrations of heavy metals in PM2.5 and health risk assessment around Chinese New Year in Dalian, China
- Origin of carbonate cements in deep sandstone reservoirs and its significance for hydrocarbon indication: A case of Shahejie Formation in Dongying Sag
- Coupling the K-nearest neighbors and locally weighted linear regression with ensemble Kalman filter for data-driven data assimilation
- Multihazard susceptibility assessment: A case study – Municipality of Štrpce (Southern Serbia)
- A full-view scenario model for urban waterlogging response in a big data environment
- Elemental geochemistry of the Middle Jurassic shales in the northern Qaidam Basin, northwestern China: Constraints for tectonics and paleoclimate
- Geometric similarity of the twin collapsed glaciers in the west Tibet
- Improved gas sand facies classification and enhanced reservoir description based on calibrated rock physics modelling: A case study
- Utilization of dolerite waste powder for improving geotechnical parameters of compacted clay soil
- Geochemical characterization of the source rock intervals, Beni-Suef Basin, West Nile Valley, Egypt
- Satellite-based evaluation of temporal change in cultivated land in Southern Punjab (Multan region) through dynamics of vegetation and land surface temperature
- Ground motion of the Ms7.0 Jiuzhaigou earthquake
- Shale types and sedimentary environments of the Upper Ordovician Wufeng Formation-Member 1 of the Lower Silurian Longmaxi Formation in western Hubei Province, China
- An era of Sentinels in flood management: Potential of Sentinel-1, -2, and -3 satellites for effective flood management
- Water quality assessment and spatial–temporal variation analysis in Erhai lake, southwest China
- Dynamic analysis of particulate pollution in haze in Harbin city, Northeast China
- Comparison of statistical and analytical hierarchy process methods on flood susceptibility mapping: In a case study of the Lake Tana sub-basin in northwestern Ethiopia
- Performance comparison of the wavenumber and spatial domain techniques for mapping basement reliefs from gravity data
- Spatiotemporal evolution of ecological environment quality in arid areas based on the remote sensing ecological distance index: A case study of Yuyang district in Yulin city, China
- Petrogenesis and tectonic significance of the Mengjiaping beschtauite in the southern Taihang mountains
- Review Articles
- The significance of scanning electron microscopy (SEM) analysis on the microstructure of improved clay: An overview
- A review of some nonexplosive alternative methods to conventional rock blasting
- Retrieval of digital elevation models from Sentinel-1 radar data – open applications, techniques, and limitations
- A review of genetic classification and characteristics of soil cracks
- Potential CO2 forcing and Asian summer monsoon precipitation trends during the last 2,000 years
- Erratum
- Erratum to “Calibration of the depth invariant algorithm to monitor the tidal action of Rabigh City at the Red Sea Coast, Saudi Arabia”
- Rapid Communication
- Individual tree detection using UAV-lidar and UAV-SfM data: A tutorial for beginners
- Technical Note
- Construction and application of the 3D geo-hazard monitoring and early warning platform
- Enhancing the success of new dams implantation under semi-arid climate, based on a multicriteria analysis approach: Case of Marrakech region (Central Morocco)
- TRANSFORMATION OF TRADITIONAL CULTURAL LANDSCAPES - Koper 2019
- The “changing actor” and the transformation of landscapes