Static testing evaluation of pipe conveyor belt for different tensioning forces
-
Vieroslav Molnár
 and
Martin Sabovčík
and
Martin Sabovčík

Abstract
The paper analyzes static tests of pipe conveyors using various statistical indicators and points out the mutual interactions between individual roller stands. Individual measurements were performed on a physical model of a pipe conveyor, while the methodology and procedure were verified by experiments. 15 repetitions of the given series of measurements were selected, which was a compromise between time demands and statistical requirement. Normal contact forces on the individual rollers of three hexagonal roller stands acting on the conveyor belt for different tension forces in the static state (conveyor belt without movement and without transported material) were evaluated. The LabVIEW Signal Express 2010 program from the National Instruments Company was used to record the measured data. The measurements were evaluated by Microsoft Office Excel.
1 Introduction
During normal operation, the conveyor belt of the pipe conveyor is exposed to various influences, which cause its static and dynamic wear. Abrasions, cuts and cracks and incorrect operating conditions are the main causes of wear.
Research into the contact forces on the pipe conveyor rollers in terms of durability, reliability and wear on the conveyor belt, is currently an issue which is increasingly at the forefront of researchers, designers, pipe conveyor manufacturers and their users [1, 2, 3, 4, 5, 6].
A very effective way of obtaining real values of contact forces between the conveyor belt and the guide rollers in the continuous transport of bulk materials using pipe conveyors is the use of specially designed test equipment. In cooperation between the PHOENIX Conveyor Belt Systems GmbH and the Institute of Transport and Automation Technology (ITA) a research project was realised [7]. The CKIT Company, in cooperation with the Mining University of Leoben, has developed a testing device for pipe conveyors [8]. Further research is known in the field of determining the real values of contact forces between the conveyor belt and the guide rollers of the pipe conveyor [9, 10, 11, 12, 13, 14].
This paper analyzes normal contact forces on individual rollers of three hexagonal idler housings acting on conveyor belt for different tension forces in static state - conveyor belt without movement and without conveyed material, pointing out mutual interactions between individual roller stands.
2 Methods
The physical model of the pipe conveyor in Figure 2 was preceded by the creation of its 3D geometric model shown in Figure 1. The physical model is used to measure normal contact forces (CF) on the individual rollers of three hexagonal idler housings acting on the conveyor belt for 5 different tensioning force levels (TF) in static condition - conveyor belt without movement and without transported material. Both models contain three identical hexagonal idler housings No.1, No.2, No.3.
Hexagonal idler housing No.1 – characterizes the state of closing the conveyor belt,
Hexagonal idler housing No.2 - characterizes the normal operation of the conveyor belt,
Hexagonal idler housing No.3 - characterizes the state of fixation of the conveyor belt by means of clamping screws.
![Figure 1 3D geometric model of a pipe conveyor [9]](/document/doi/10.1515/eng-2019-0069/asset/graphic/j_eng-2019-0069_fig_001.jpg)
3D geometric model of a pipe conveyor [9]
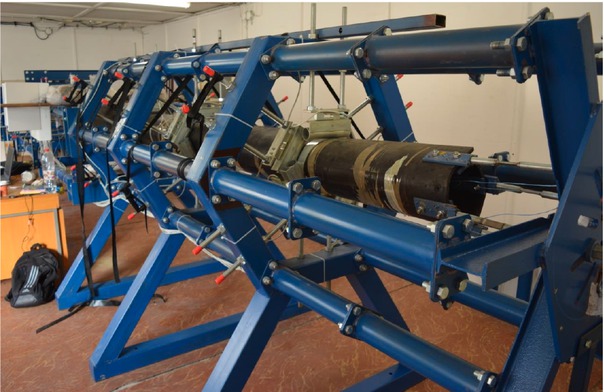
Physical model of a pipe conveyor
The physical model of the pipe conveyor (Figure 2) contains 18 strain gauges at positions ID1-ID18 on three hexagonal idler housings and 2 strain gauges at positions ID23, ID24 on the tensioning plate (Figure 1). The 5 different levels of TF are derived by the sum of the tensioning forces at positions ID23 and ID24. The position of straing gauges on all three idler housings is shown in Figure 3.
![Figure 3 Marking the positions of strain gauges on idler housings No.1, No.1, No.3 [12]](/document/doi/10.1515/eng-2019-0069/asset/graphic/j_eng-2019-0069_fig_003.jpg)
Marking the positions of strain gauges on idler housings No.1, No.1, No.3 [12]
Table 1 contains the characteristics of strain gauges on the physical model of pipe conveyor, in Table 2 are their parameters.
The characteristics of strain gauges
| Measuring point | Marking of the measuring point | Type of strain gauge | Number of strain gauges |
|---|---|---|---|
| Idler | ID1 ÷ ID18 | KDI 500 | 18 pcs |
| housings | Single | ||
| Tension | ID23, ID24 | KDI 1.5 kN | 2 pcs |
| plate | tens |
Strain gauge sensor parameters
| Type of strain gauge | KDI 500 Single | KDI 1.5 kN tens |
|---|---|---|
| Capacity [N] | 800 | 15900 |
| Sensitivity [mV / V] | 1 | 1 |
| Accuracy [%] | 5 | 5 |
In the physical model, an older conveyor belt already in operation (Figure 4) with the parameters displayed in Table 3 was used.
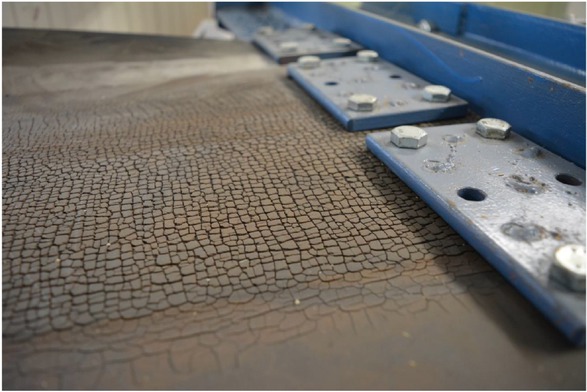
Detail of mounting the end of the conveyor belt
Basic characteristics of the conveyor belt and experimental testing equipment
| Type of the conveyor belt | EP500/3 HP 5+3 D |
|---|---|
| Polyester rubber-textile conveyor belt | EP |
| Strength of the belt | 500N·mm−1 |
| Pipe shaped belt | HP |
| Top cover thickness | 5mm |
| Bottom cover thickness | 3mm |
| Category: transport of materials with the recommended belt surface temperature +150∘C | D |
| Length of the conveyor belt | 8000mm |
| Width of the conveyor belt | 800mm |
| Thickness of the conveyor belt | 20mm |
| Diameter of the pipe shaped conveyor belt | 200mm |
| Distance between the idler housings | 1000mm |
| Diameter of the idler rolls | 76mm |
2.1 The measurement chain and description of automated measurement of TF and CF
On the physical model of pipe conveyor, the National Instruments LabVIEW Signal Express 2010 measuring apparatus was installed, which sequentially records data from individual strain gauges and exports it to Microsoft Office Excel for further processing and mutual comparison. Figure 5 shows the connection of an automated measurement measuring chain that sequentially records CF and TF values from individual sensing sites using strain gauges.
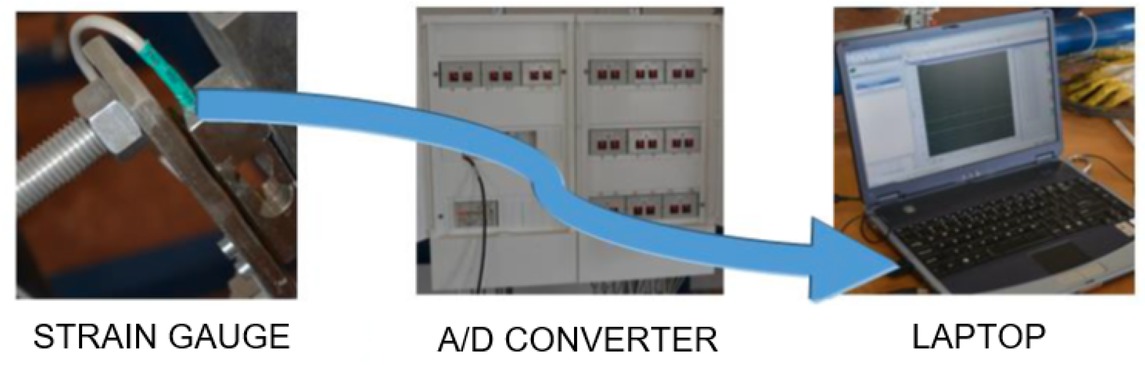
Connection of the measuring chain
The results were processed in the form of tables and graphs [15]. Figure 6 shows a set of A/D converters from the National Instruments.

Set of A/D converters
The course of 15 automated repeated measurements and their evaluation was carried out according to a preplanned procedure. At first, the verification of strain gauge sensors was performed using calibration curves. Measurement time courses were recorded for both 5-level stretching and release at once, as shown in Figure 7.
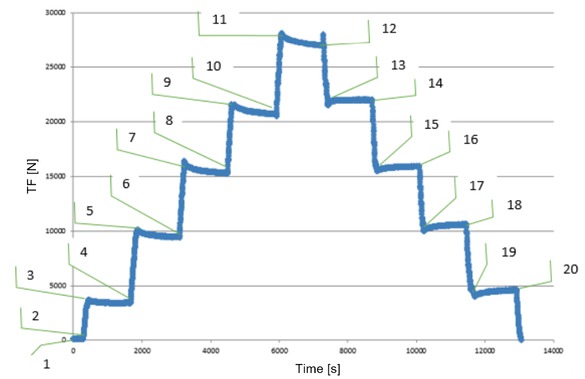
The time course of TF measurement at positions ID23, ID24
The measurement procedure according to Figure 7:
Waiting time approximately 30s
Gradual stretching to a given value in [N]
Waiting time approximately 120s
Gradual stretching to a given value in [N]
Waiting time approximately 120s
Gradual stretching to a given value in [N]
Waiting time approximately 120s
Gradual stretching to a given value in [N]
Waiting time approximately 120s
Gradual stretching to a given value in [N]
Waiting time approximately 120s
Gradual stretching to a given value in [N]
Waiting time approximately 120s
Gradual stretching to a given value in [N]
Waiting time approximately 120s
Gradual stretching to a given value in [N]
Waiting time approximately 120s
Gradual stretching to a given value in [N]
Waiting time approximately 120s
Gradual complete release of the conveyor belt.
3 Results
Figure 8 shows the CF progression for a hexagonal roller stand No.1 using a spatial surface graph. On the x-axis, the positions of the strain gauges ID1 ÷ ID6 belonging to hexagonal idler housing No.1 for 5 TF levels are shown. On the Y axis, the resulting CF values for the strain gauges ID1 ÷ ID6 positions are shown. The position of each strain gauge is displayed above each CF course.
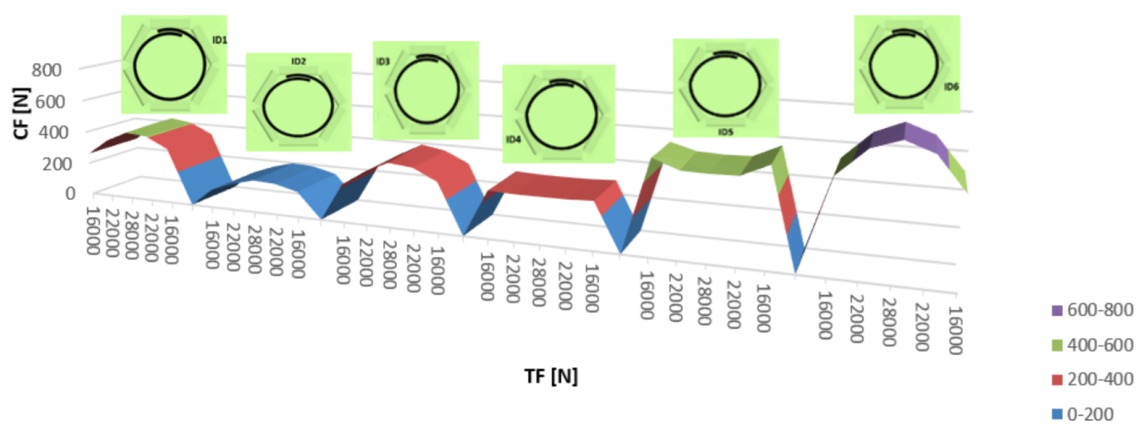
The course of CF for hexagonal idler housing No.1
The course of CF shown in Figure 9 shows the course of the hexagonal roller stand No.2 using a spatial surface graph. On the x-axis there are the positions of the strain gauges ID7 ÷ ID12 belonging to hexagonal idler housing No.2 for 5 TF levels. On the Y axis, the resulting CF values for the positions of the strain gauges ID7 ÷ ID12 are shown. The position of each strain gauge is displayed above each CF course.
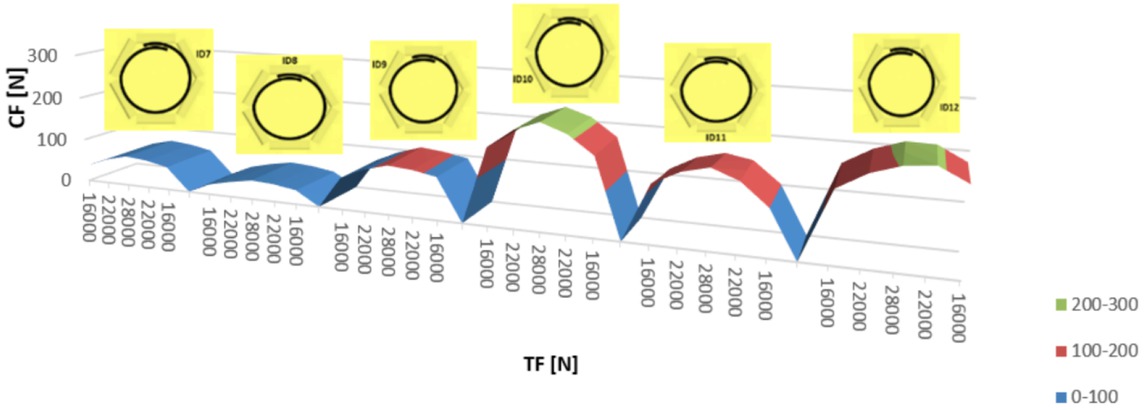
The course of CF for hexagonal idler housing No.2
Figure 10 shows the course of CF for the hexagonal roller stand No.3 using a spatial surface graph. On the x-axis, there are the positions of the strain gauges ID13 ÷ ID18 that belong to the hexagonal idler housing No.3 for 5 TF levels. On the Y axis, the resulting CF values for the positions of the strain gauges ID13 ÷ D18 are shown. The position of each strain gauge is displayed above each CF course.
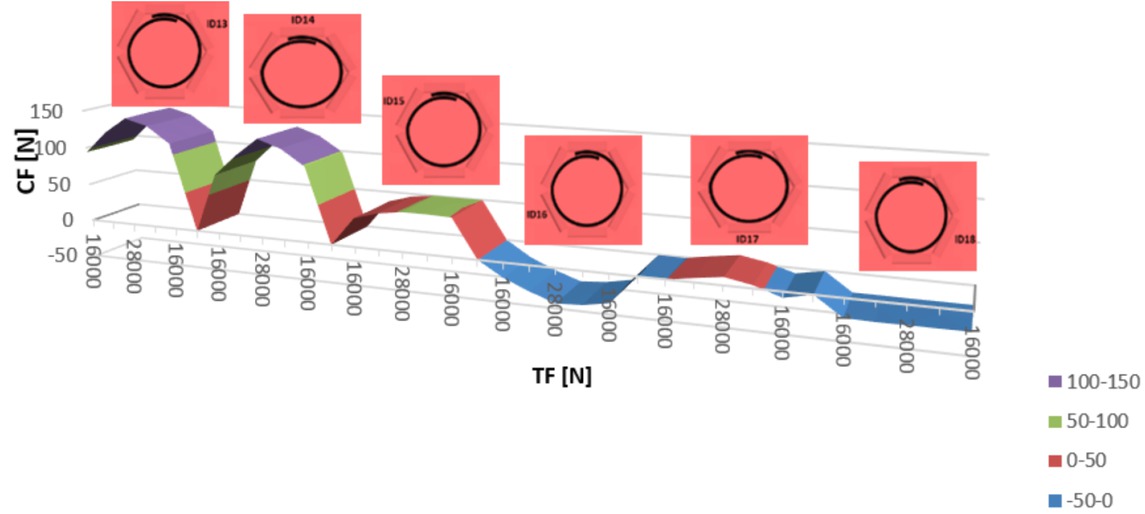
The course of CF for hexagonal idler housing No.3
4 Discussion
The results of individual measurements were not always as expected. Some strain gauge sensors showed no results due to deformation of the conveyor belt or if the conveyor belt did not touch the strain gauge sensor, which could have happened due to the inertia of the deformation of the conveyor belt when the conveyor belt was packed between repetitive measurements for several days. In this case, the measured data showed low or even negative values.
Different CF courses for 5 TF levels were obtained from the CF waveforms for strain gauges ID1 ÷ ID6 belonging to idler housing No.1. The maximum CF = 727.8N was at position ID6 at the total value of TF = 28000N. The minimum CF = 108.8N was at position ID2 at the total value of TF = 16000N. Anomalies were observed at the ID4 position, where the course of CF was constant during the 30 sec, 60 sec and 90 sec of settling for the TF amounts monitored, respectively.
From the CF waveforms for strain gauges ID7 ÷ ID12 belonging to idler housing No.2, different CF courses were measured for 5 TF levels. The maximum CF = 229.1N was at position ID10 at the total value of TF = 28000N. The minimum CF = 22.7N was at position ID8 at the total value of TF = 16000N. A variety of CF results could have been observed in tensioning and releasing the conveyor belt after 30 sec, 60 sec, and 90 sec of settling.
From the CF waveforms for strain gauges ID13 ÷ ID18 belonging to idler housing No.3, different CF courses were observed for 5 TF levels. The maximum CF = 144.1N was at position ID13 at the total value of TF = 28000N. The minimum CF = - 44.8N was at position ID16 at the total value of TF = 28000N. It was possible to observe the diversity of CF results in tensioning and releasing the conveyor belt after 30 sec, 60 sec and 90 sec of settling. Anomalies were observed at the ID18 position, where the course of CF after 30 sec, 60 sec and 90 sec of settling was constant and even negative for the observed TF amounts.
From the course of CF shown in Figures 8, 9, 10, the order of loading of the individual idler rolls in the idler housings was determined - as is displayed in Table 4.
The order of idler roll loading in each idler housings
| Idler housing | ID | The order of idler roll loading |
|---|---|---|
| No.1 | ID1 | 3. |
| ID2 | 6. | |
| ID3 | 4. | |
| ID4 | 5. | |
| ID5 | 2. | |
| ID6 | 1. | |
| No.2 | ID7 | 5. |
| ID8 | 6. | |
| ID9 | 4. | |
| ID10 | 1. | |
| ID11 | 3. | |
| ID12 | 2. | |
| No.3 | ID13 | 1. |
| ID14 | 2. | |
| ID15 | 3. | |
| ID16 | 5. | |
| ID17 | 4. | |
| ID18 | 6. |
5 Conclusion
Despite frequent use of pipe conveyors, the issue of tracking CF on idler rolls is relatively neglected. Nevertheless, CF significantly influence the performance characteristics of pipe conveyors and represent an important factor in the continuous transport of raw materials. As a result of further research on this issue, a large volume of measured data needs to be processed. Therefore, there are often problems in terms of both time processing and evaluation.
The paper points out a suitable way of evaluating individual CF measurements on a physical model of a pipe conveyor in dependence on TF, while the respective methodology and procedure were verified by experiments. The data obtained from the individual CF measurements from the rollers acting on the conveyor belt for various TFs in a static state (the conveyor belt does not move) were categorized into a whole and then investigated and analyzed from different perspectives separated from measurement errors or eventual operator errors. Data was analyzed by means of statistical characteristics using charts and tables in Microsoft Office Excel. The obtained results will be used in further follow-up research, which will bring useful new knowledge for the theory, practice as well as for the production of conveyor belts.
Acknowledgement
This work is a part of the following projects: VEGA 1/0403/18, VEGA 1/0063/16, KEGA 012 TUKE-4/2019, KEGA 013TUKE-4/2019, APVV SK-SRB-18-0053.
References
[1] Barburski M. (2016). Analysis of the pipe conveyor belt pressure on the rollers on its circuit, J. Ind. Text. 45, 1619–1634. doi:10.1177/1528083714567242.10.1177/1528083714567242Search in Google Scholar
[2] Michalik P., Molnár V., Fedorko G., Zajac J., Luściński S., Hatala M., Monka P., Simkulet V. & Orlovský I. (2011). Analysis of compressive forces on rolls of a pipe conveyor, In EAN 2011 49th Int. Sci. Conf. Exp. Stress Anal., (pp. 245–250). Brno, Czech republic: Brno Univ. of Technology.Search in Google Scholar
[3] Stehlíková B., Molnár V. & Fedorko G. (2014). Possibilities of Experiments and of Using Experimental Results obtained from the Test Equipment for Measuring Properties of Conveyor Belts Pipe Conveyor, Appl. Mech. Mater. 683, 165–170. doi:10.4028/www.scientific.net/AMM.683.165.10.4028/www.scientific.net/AMM.683.165Search in Google Scholar
[4] Ramjee S. & Staples P. (2015). Pipe conveyors for infrastructure projects: Innovative solution for conveyor systems, Bulk Solids Handl. 35, 20–25. https://www.scopus.com/inward/record.uri?eid=2-s2.0-84941914359&partnerID=40&md5=e585cb5433761a1c39d23bf0c71562a7Search in Google Scholar
[5] Marasova D., Fedorko G., Kubin K., Molnar V. & Husakova N. (2010). Analysis model for determination of contact loads between tube-shaped conveyor belt of a pipe conveyor and carrier rolls, Cuprum Czas. Nauk. Górnictwa Rud. 3, 71–76. http://baztech.icm.edu.pl/baztech/cgi-bin/btgetdoc.cgi?AGH1-0023-0174Search in Google Scholar
[6] Michalik P. & Zajac J. (2012). Using of computer integrated system for static tests of pipe conveyer belts, In Proc. 13th Int. Carpathian Control Conf. ICCC 2012, (pp. 480–484). IEEE. doi:10.1109/CarpathianCC.2012.6228691.10.1109/CarpathianCC.2012.6228691Search in Google Scholar
[7] Hötte S., Overmeyer L. & Wennekamp T. (2011). Research on the Form Force Behaviour of a Pipe Conveyor in Different Curve Radii, In Bulk Solids India 2011.Search in Google Scholar
[8] CKIT. Retrieved July 26, 2019, from www.ckit.co.za/right-index/tech-focus/belt-guide/new-belt-guidance.htmSearch in Google Scholar
[9] Molnár V., Fedorko G., Stehlíková B., Kudelás Ľ. & Husáková N. (2013). Statistical approach for evaluation of pipe conveyor’s belt contact forces on guide idlers, Meas. J. Int. Meas. Confed. 46, 3127–3135. doi:10.1016/j.measurement.2013.06.019.10.1016/j.measurement.2013.06.019Search in Google Scholar
[10] Molnár V., Fedorko G., Stehlíková B., Michalik P. & Weiszer M. (2013). A regression model for prediction of pipe conveyor belt contact forces on idler rolls, Meas. J. Int. Meas. Confed. 46, 3910–3917. doi:10.1016/j.measurement.2013.07.045.10.1016/j.measurement.2013.07.045Search in Google Scholar
[11] Molnár V., Fedorko G., Stehlíková B., Michalik P. & Kopas M. (2014). Mathematical models for indirect measurement of contact forces in hexagonal idler housing of pipe conveyor, Meas. J. Int. Meas. Confed. 47, 794–803. doi:10.1016/j.measurement.2013.10.012.10.1016/j.measurement.2013.10.012Search in Google Scholar
[12] Molnar V., Fedorko G., Stehlikova B. & Paulikova A. (2015). Influence of tension force asymmetry on distribution of contact forces among the conveyor belt and idler rolls in pipe conveyor during transport of particulate solids, Meas. J. Int. Meas. Confed. 63, 120–127. doi:10.1016/j.measurement.2014.12.014.10.1016/j.measurement.2014.12.014Search in Google Scholar
[13] Fedorko G. & Ivanco V. (2012). Analysis of Force Ratios in Conveyor Belt of Classic Belt Conveyor, Procedia Engineering, 48, 123–128.10.1016/j.proeng.2012.09.494Search in Google Scholar
[14] Rozbroj J., Nečas J., Gelnar D., Hlosta J. & Zegzulka J. (2017). Validation of movement over a belt conveyor drum, Advances In Science And Technology-Research Journal, 11(2), 118-124. doi:10.12913/22998624/7118310.12913/22998624/71183Search in Google Scholar
[15] Vlach J., Havlíček J. & Vlach M. (2008). Začínáme s LabVIEW, BEN - technická literatura.Search in Google Scholar
© 2019 V. Molnár and M. Sabovčík, published by De Gruyter
This work is licensed under the Creative Commons Attribution 4.0 International License.
Articles in the same Issue
- Regular Article
- Exploring conditions and usefulness of UAVs in the BRAIN Massive Inspections Protocol
- A hybrid approach for solving multi-mode resource-constrained project scheduling problem in construction
- Identification of geodetic risk factors occurring at the construction project preparation stage
- Multicriteria comparative analysis of pillars strengthening of the historic building
- Methods of habitat reports’ evaluation
- Effect of material and technological factors on the properties of cement-lime mortars and mortars with plasticizing admixture
- Management of Innovation Ecosystems Based on Six Sigma Business Scorecard
- On a Stochastic Regularization Technique for Ill-Conditioned Linear Systems
- Dynamic safety system for collaboration of operators and industrial robots
- Assessment of Decentralized Electricity Production from Hybrid Renewable Energy Sources for Sustainable Energy Development in Nigeria
- Seasonal evaluation of surface water quality at the Tamanduá stream watershed (Aparecida de Goiânia, Goiás, Brazil) using the Water Quality Index
- EFQM model implementation in a Portuguese Higher Education Institution
- Assessment of direct and indirect effects of building developments on the environment
- Accelerated Aging of WPCs Based on Polypropylene and Plywood Production Residues
- Analysis of the Cost of a Building’s Life Cycle in a Probabilistic Approach
- Implementation of Web Services for Data Integration to Improve Performance in The Processing Loan Approval
- Rehabilitation of buildings as an alternative to sustainability in Brazilian constructions
- Synthesis Conditions for LPV Controller with Input Covariance Constraints
- Procurement management in construction: study of Czech municipalities
- Contractor’s bid pricing strategy: a model with correlation among competitors’ prices
- Control of construction projects using the Earned Value Method - case study
- Model supporting decisions on renovation and modernization of public utility buildings
- Cements with calcareous fly ash as component of low clinker eco-self compacting concrete
- Failure Analysis of Super Hard End Mill HSS-Co
- Simulation model for resource-constrained construction project
- Getting efficient choices in buildings by using Genetic Algorithms: Assessment & validation
- Analysis of renewable energy use in single-family housing
- Modeling of the harmonization method for executing a multi-unit construction project
- Effect of foam glass granules fillers modification of lime-sand products on their microstructure
- Volume Optimization of Solid Waste Landfill Using Voronoi Diagram Geometry
- Analysis of occupational accidents in the construction industry with regards to selected time parameters
- Bill of quantities and quantity survey of construction works of renovated buildings - case study
- Cooperation of the PTFE sealing ring with the steel ball of the valve subjected to durability test
- Analytical model assessing the effect of increased traffic flow intensities on the road administration, maintenance and lifetime
- Quartz bentonite sandmix in sand-lime products
- The Issue of a Transport Mode Choice from the Perspective of Enterprise Logistics
- Analysis of workplace injuries in Slovakian state forestry enterprises
- Research into Customer Preferences of Potential Buyers of Simple Wood-based Houses for the Purpose of Using the Target Costing
- Proposal of the Inventory Management Automatic Identification System in the Manufacturing Enterprise Applying the Multi-criteria Analysis Methods
- Hyperboloid offset surface in the architecture and construction industry
- Analysis of the preparatory phase of a construction investment in the area covered by revitalization
- The selection of sealing technologies of the subsoil and hydrotechnical structures and quality assurance
- Impact of high temperature drying process on beech wood containing tension wood
- Prediction of Strength of Remixed Concrete by Application of Orthogonal Decomposition, Neural Analysis and Regression Analysis
- Modelling a production process using a Sankey diagram and Computerized Relative Allocation of Facilities Technique (CRAFT)
- The feasibility of using a low-cost depth camera for 3D scanning in mass customization
- Urban Water Infrastructure Asset Management Plan: Case Study
- Evaluation the effect of lime on the plastic and hardened properties of cement mortar and quantified using Vipulanandan model
- Uplift and Settlement Prediction Model of Marine Clay Soil e Integrated with Polyurethane Foam
- IoT Applications in Wind Energy Conversion Systems
- A new method for graph stream summarization based on both the structure and concepts
- “Zhores” — Petaflops supercomputer for data-driven modeling, machine learning and artificial intelligence installed in Skolkovo Institute of Science and Technology
- Economic Disposal Quantity of Leftovers kept in storage: a Monte Carlo simulation method
- Computer technology of the thermal stress state and fatigue life analysis of turbine engine exhaust support frames
- Statistical model used to assessment the sulphate resistance of mortars with fly ashes
- Application of organization goal-oriented requirement engineering (OGORE) methods in erp-based company business processes
- Influence of Sand Size on Mechanical Properties of Fiber Reinforced Polymer Concrete
- Architecture For Automation System Metrics Collection, Visualization and Data Engineering – HAMK Sheet Metal Center Building Automation Case Study
- Optimization of shape memory alloy braces for concentrically braced steel braced frames
- Topical Issue Modern Manufacturing Technologies
- Feasibility Study of Microneedle Fabrication from a thin Nitinol Wire Using a CW Single-Mode Fiber Laser
- Topical Issue: Progress in area of the flow machines and devices
- Analysis of the influence of a stator type modification on the performance of a pump with a hole impeller
- Investigations of drilled and multi-piped impellers cavitation performance
- The novel solution of ball valve with replaceable orifice. Numerical and field tests
- The flow deteriorations in course of the partial load operation of the middle specific speed Francis turbine
- Numerical analysis of temperature distribution in a brush seal with thermo-regulating bimetal elements
- A new solution of the semi-metallic gasket increasing tightness level
- Design and analysis of the flange-bolted joint with respect to required tightness and strength
- Special Issue: Actual trends in logistics and industrial engineering
- Intelligent programming of robotic flange production by means of CAM programming
- Static testing evaluation of pipe conveyor belt for different tensioning forces
- Design of clamping structure for material flow monitor of pipe conveyors
- Risk Minimisation in Integrated Supply Chains
- Use of simulation model for measurement of MilkRun system performance
- A simulation model for the need for intra-plant transport operation planning by AGV
- Operative production planning utilising quantitative forecasting and Monte Carlo simulations
- Monitoring bulk material pressure on bottom of storage using DEM
- Calibration of Transducers and of a Coil Compression Spring Constant on the Testing Equipment Simulating the Process of a Pallet Positioning in a Rack Cell
- Design of evaluation tool used to improve the production process
- Planning of Optimal Capacity for the Middle-Sized Storage Using a Mathematical Model
- Experimental assessment of the static stiffness of machine parts and structures by changing the magnitude of the hysteresis as a function of loading
- The evaluation of the production of the shaped part using the workshop programming method on the two-spindle multi-axis CTX alpha 500 lathe
- Numerical Modeling of p-v-T Rheological Equation Coefficients for Polypropylene with Variable Chalk Content
- Current options in the life cycle assessment of additive manufacturing products
- Ideal mathematical model of shock compression and shock expansion
- Use of simulation by modelling of conveyor belt contact forces