Intelligent techno-economical optimization with demand side management in microgrid using improved sandpiper optimization algorithm
-
Mande Praveen
 and
Venkata Siva Krishna Rao Gadi
and
Venkata Siva Krishna Rao Gadi

Abstract
The energy management system is established in the microgrid system for optimally integrating the Distributed Energy Resources (DERs) and generating the power distribution grids. At last, diverse mechanisms have been highly concentrated on cost reduction and at the same time, both the technical indices and economic factors are considered. Thus, this research work suggests a new heuristic algorithm termed Modified Sandpiper optimization algorithm (M-SOA) for optimal integration of DER-like Photo Voltaic (PV), wind turbines, and Energy Storage Systems (ESS) into microgrids. Here, the techno-economical optimization with ISOA is designed for determining the optimal capacity of PV, Wind Turbine, and ESS via the multi-objective function concerning measures like network power losses, voltage fluctuations, Electricity Supply Costs, initial cost, operation cost, fuel cost, and demand side management. Finally, the optimal energy management is done on distributed energy resources, and this developed model experiments on the IEEE-33 bus network. Throughout the result analysis, the developed M-SOA obtains 3.84 %, 0.98 %, 5.72 %, and 4.63 % better performance with less latency than the AGTO, BOA, WOA, and SOA. Finally, the result evaluation is done for minimizing the Electricity Supply Costs, initial cost, operation cost, and fuel cost and maximize energy efficiency.
Notation table
- STD
-
Solar cell temperature
- Noct
-
General operating cell temperature
- SUN
-
The intensity rate has been taken based on the solar radiation
- STamb
-
Ambient temperature
-
-
Statistical data
- η pv
-
The energy efficiency of the solar cell
- ρ, Ar and Le
-
Air density, area secured by the turbine blades, and turbine blade length
- α Dch
-
Self-discharging rate
- η Ess
-
Discharging or charging efficiency of ESS
-
-
The discharging or charging power
- Δtt Ess
-
The period for discharging or charging
- η Conv
-
The efficiency of the DC/AC converter
- Ecap
-
Capacity of ESS
- μ d and σ d
-
Lognormal distribution
- DSTMax
-
Maximum distance
- Bcap
-
Battery capacity
- F D
-
Energy consumption is computed per mile
- T Arvl
-
Arrival time
- T Deprt
-
Departure time
- T Durtn
-
Time duration
-
-
Charging rate
- OCWT
-
Optimal capacity of wind turbine
- OCPV
-
Optimal capacity of PV
- OCESS
-
Optimal capacity of ESS
- BLPV
-
Bus location of PV
- BLWT
-
Bus location of wind turbine
- BLESS
-
Bus location of ESS
-
-
Charging duration of EV
-
-
Charging duration of ESS
1 Introduction
In developed countries, nearly 40 % of the total energy is consumed by commercial and residual usage (Martínez Ceseña et al. 2020). This will further increase the energy demand in the buildings in the future generation due to the electrical usage of household heating, urbanization, population growth, and raising penetration of Electric Vehicles (EVs) (Cai and Kong 2017). To resolve these issues, most of the works have been focused on developing Microgrid aided future electrical power systems for enhancing performance. A microgrid is considered a Low Voltage (LV) power network comprising shared energy sources like fuel cells, micro-wind turbines, energy storage devices, and PV (Mohamed et al. 2022). In addition, the energy efficiency in the microgrid has enhanced with the appropriate Direct Current (DC) distribution without being dependent on the utilization of traditional AC-aided distribution (Bourhim et al. 2021). Microgrid development is steadily observed to be a general mechanism to help entities by reducing grid reliance and energy costs as well as enhancing sustainability and also for obtaining higher resilience (Erdogan, Kucuksari, and Cali 2022). On the other hand, there are more limitations occurred in the development of microgrids like the requirement of capital investment. Microgrid operation is considered to be challenging because of requiring certain implementation of robust control schemes containing the ability to combine diverse disparate technologies. The main perspective of designing the microgrid is focused on techno-economic optimization (Gao, Jia, and Marnay 2019). Such implementation involves the comparison of operational and capital investments over the economic gain on the technological investment like Thermal Energy Storage (TES), wind turbines, Energy Storage Systems (ESS), solar PV, and Fuel-Fired Generators (GEN). For generating the established economic decision, this evaluation has to consider the complete demand data, parameters related to project financing, regulations, investment cost, utility tariff information, and local weather scenarios (Tsai et al. 2020).
With the analysis of the recently developed research works, it has shown that the expanded computations were done through these present works, yet the interpretation of the optimization constraints and objective functions without considering the economic and technical parameters reduces the accuracy rate and efficiency of the optimized outcomes (Murty and Kumar 2020a). Moreover, these conventional models do not establish a particular mechanism for controlling the unmanageable discharging and charging of ESS and EVs for attaining the optimal operation condition of the power system, which has also resolved the problem of economic power dispatch (Shaheen and El-Sehiemy 2021). It is unable to find the conventional research works on the power system to develop a comprehensive model that contains the ability to determine the optimal configuration belongs to the microgrid and at the same time, it has to assure as the energy management mechanism for coordinating the grid-implemented DERs along with the support of centralized power plant (Queen, Moses Babu, and Thota 2021).
Various optimization algorithms are presented for handling optimization issues and also solving the objectives of a single optimization problem (Venkatasubramanian, Jately, and Azzopardi 2021). These heuristic approaches are utilized for resolving the heuristic issues having more technical constraints that have various difficulties because of raising the non-linearity problem. For better utilization of RESs over the economic condition, it is highly significant to make the optimal sizing of microgrid components (Shekari, Golshannavaz, and Aminifar 2017). Based on the variant of the optimization approach, supremacy in the microgrid performance and the complete usage of RESs can be provided (Jahid et al. 2020). Therefore, many optimization algorithms are focused on utilizing the microgrid performance in recent research works (Kolhe 2009). Various developed works have considered the techno-economic evaluation independent of considering the effects of Demand Response (DR) (Alhasawi and Milanovic 2012). In addition, the effective advantages of the DR program are not mentioned in their evaluation which is highly essential for performing the efficient microgrid operation. The dispatching of optimal energy having fused energy sources is observed to be a challenging task based on the aspect of load as well as generation uncertainties that are required to be included in the evaluation for enhancing the system scheduling (Lopez-Lorente et al. 2021). Furthermore, the comparative testing of techno-economic advantages belonging to diverse combined power systems is not established based on the seasonal load variation and also with the DR program (Taheri 2022). Hence, novel research towards the techno-economical optimization for microgrid performance is focused on in this research work, particularly on PV, Wind turbines, and ESS.
The main contributions of the developed Demand Side management system in Microgrid are given as follows.
Design an efficient microgrid system with the support of techno-economic optimization for demand side management and also for conserving the optimal capacity of PV, Wind turbines, and ESS.
Implement a hybrid optimization algorithm named M-SOA integrated with the techno-economic optimization considering the multi-objective function concerning network power losses, voltage fluctuations, electricity supply costs, initial cost, operation cost, and fuel cost by tuning the parameters like PV capacity, wind turbine capacity, ESS capacity, PV bus location, wind turbine bus location, and ESS bus location.
Examine the developed demand side management system in microgrid with the comparison over the conventional heuristic algorithms with the convergence analysis along with the analysis over the power loss, supply, and voltage fluctuations.
The rest of the sections of the developed model are described as follows. In Section 2, the conventional works on techno-economic optimization in microgrids are discussed. In Section 3, the system components are modeled and in Section 4, the demand side management for techno-economic optimization in a microgrid is discussed along with multi-objective function. In Section 5, the developed M-SOA for techno-economic optimization in a microgrid is described. In Section 6, the results obtained are given and in Section 7, the conclusion about the implemented model is given.
2 Literature survey
2.1 Related works
In 2020, Rezaeimozafar et al. (2020) proposed a novel two-layered heuristic framework for reducing operational expenses along with power losses and voltage fluctuations that occurred in the microgrids. When observing the outer layer, the capacity and size of the DERs included with the EV, RES, and ESS were acquired simultaneously. Similarly, the inner layer used for performing the scheduled operation belongs to ESSs and EVs with the support of the Integrated Coordination Model (ICM). This acted as the fuzzy interface that was incorporated for solving the multi-objectivity considered with cost function implemented according to the electricity response, the charge state of ESS and EVs, and hourly demand response. Demand response was developed within the ICM for evaluating the impact of electricity costs for optimal energy management. For resolving the heuristic issue as well as load-flow equations, a fusion of optimization algorithms was used for deployment correspondingly. One-day experiment outcomes were used for revealing the effectiveness of the developed model based on the analysis of voltage fluctuations, electricity supply cost, and power loss that has enhanced the energy efficiency and stability of the power system.
In 2020, Murty and Kumar (2020b) investigated the benefits of techno-economic advantages, optimal capacity, and energy dispatching in a remote area over Tamilnadu. Microgrids containing fused energy sources with the Diesel Generator (DG), Battery ESS (BESS), and wind turbine. Diverse case studies were developed using fused energy sources and a comparison among the advantages of techno-economic was made for every case study. Eight diverse configurations were designed for fused energy sources using renewable fractions. The heuristic evaluation was done with the support of the Hybrid Optimization Model for Electric Renewable (HOMER) software. The effect of demand responses was also confirmed based on the techno-economic merits and energy dispatching. The experimental analysis was made for testing the optimal capacity belonging to fuel cost, payback period consisting of seasonal load variation, Cost Of Energy (COE), State Of Charge (SOC), operational expenses, initial expenses, and emission penalty of greenhouse gas. The simulation report has revealed the reduced emissions of CO2 using the hybrid optimization algorithm when compared to the traditional isolated distribution system using DG.
In 2021, Ishraque et al. (2021) analyzed the implementation and optimization of the developed off-grid fused microgrid systems for diverse load dispatch mechanisms with the evaluation of diverse cost evaluations, system responses, and component sizes of the developed system. This research work was comprised of optimization of sizing in the fused microgrid systems comprised of diesel generator, wind turbine, solar PV, storage unit, and load profile with the help of five dispatch techniques such as integrated dispatch mechanism, load following, HOMER predictive dispatch, cycle charging, and generator order. The involved microgrids were considered for tuning to get the reduced CO2 emission, Levelized Cost Of Energy (LCOE), and Net Present Cost (NPC). Here, the two microgrids were tested based on the five dispatch approaches according to HOMER software and consequently, the efficiency of the system performance along with the availability study of the microgrids was considered. The analysis reports have assured the instruction of estimating the diverse probable costs and component size for processing optimal operation done in the developed microgrids using the diverse constraints related to loading dispatch. The experiments were made to confirm the optimal dispatch mechanism which was the load-following mechanism for providing consistent power system responses consisting of lower net power cost, CO2 emission rate, and operational cost. In addition, the fused dispatch mechanism was declared as the poor dispatch approach for the developed off-grid fused microgrid implementation comprising of higher operational cost, CO2 emission rate, and LCOE.
In 2020, Bandyopadhyay et al. (2020)) presented a brief heuristic model for tuning the grid converter, battery, and PV belonging to the microgrid system with the consideration of diverse objectives such as capital costs, payback period, power autonomy, and energy autonomy. The developed technique was incorporated with the development of a holistic techno-economic microgrid framework according to the parameters such as electricity tariffs, capital investment, converter ratings, battery size, azimuth angle, and system power of PVs. The implemented approach was applicable for determining the optimum capacity of the BSS and PV system to estimate the impact of meteorological scenarios over the relative capacity of the battery and PV. According to the heuristic outcomes, thumb rules were obtained for performing the optimal system sizing, which has supported facilitating the microgrid design engineers at the time of starting the implementation phase.
In 2021, Mathiesen et al. (2021) introduced an advanced and faster approach for tuning the DER expenditure and also for doing the dispatch schedule to take over the intra-hour variability. A new collection of conditions functioned using the intra-hour data for supporting the mixed-integer-linear-program microgrid expenditure optimization. Variability was described using the single fluctuations of worst-case intra-hour, which has enabled the rapid optimizations when correlated with other approaches considered for the evaluation. This developed model has confirmed the optimality at 2 % and also minimized the runtime by involving all time steps explicitly.
In 2020, Nagapurkar and Smith (2019) developed a new approach for evaluating the environmental as well as the techno-economic performance of the small microgrid. When assuring an uninterrupted power supply, the microgrid was comprised of seven different components like H2 tanks, electrolyzers, fuel cells, biodiesel generators, lead acid batteries, wind turbines, and solar PVs. Initially, the brief mathematical frameworks were used for hourly energy production for every component that was evaluated after implementation. Then, the configurations containing the minimum LCOE were computed based on the electricity dispatch mechanism with the support of a Genetic Algorithm (GA). The result obtained from the individual microgrid was validated based on the exhaustive search algorithm that was useful for scanning the complete implementation for determining the minimum LCOE configurations. The microgrid size was constantly increasing for meeting the power requirements and also, novel minimum LCOE configurations were computed with the support of GA for evaluating the economies of scale impact over the robustness.
In 2020, Ganjeh et al. (2020) proposed a new multi-level optimization based on the techno-economic technique along with the recent time-varying price model to enhance the involvement in the coalition system and also for reducing the energy cost of home microgrid and finally, evaluate the reliability and voltage stability of the grid. The developed model has considered the apartments of certain units that included thermal as well as electrical energy generators and energy storage devices and also can share the energy among the upstream network. The developed approach has utilized an algorithm for smart discharging or charging of both EVs and energy storage for enhancing energy efficiency. The efficacy of the developed algorithm was evaluated based on come thermal and electrical loads configurations and also IEEE bus networks were enclosed for ensuring the efficacy of the coalition system among the microgrids on a huge scale.
In 2021, Yu et al. (2021) analyzed the effects of the developed demand response program considering the outcomes of microgrid planning that were included with the investigation on the utility grid’s emission generation, NPC, COE, best configuration, and sizing were done. The optimization outcomes have demonstrated that the implemented demand response program was comprised of a positive impact on the environmental, economic, and technical perspectives of microgrids. The COE and NPC were minimized along with the component size which has led to reducing the initial cost.
In 2023, Rizvi, Pratap, and Singh (2023) presented the development of demand-side management for minimizing the dispatch of optimal power and cost of operation. Here, the microgrid was fused with the natural gas network to resolve the renewable energy. Especially, the electric network has been incorporated with a new hybridization of two optimization approaches grasshopper and flower pollination algorithms to ignore the congestion in a gas network. At last, the designed scheme was experimented with using a seven-node with the 33-bus IEEE test system.
In 2023, Dey, Dutta, and Marquez (2023a) developed an intelligence-technique-based DSM for the reduction of the overall cost of using the MG structure. Additionally, there are seven diverse cases are reviewed which cover various electricity market pricing strategies, DSM programs, and grid participation. Thus, the simulation results of the designed method have been obtained using the DSM scheme regarding cost savings.
In 2023, Dey, Basak, and Bhattacharyya (2023b) introduced a bi-level optimization approach to reduce the operating costs of a low-voltage microgrid system. Based on the initial optimization of DSM was utilized to the reorganize level load model (Rodezno et al. 2023). Here, the distributed generator scheduling ideas and the restructured load demand models were for reducing the microgrid system’s generating costs.
2.2 Problem statement
Some techno-economical optimization approaches on microgrids are listed in Table 1. GA-PSO (Rezaeimozafar et al. 2020) minimizes the electricity supply cost, voltage fluctuations, and power loss and significantly enhances the energy efficiency and stability of the power system. It does not handle the uncertainties in hourly updated information. The hybrid Optimization Model (Murty and Kumar 2020b) tries to reduce emissions, operation reserve, and reduced energy demand and guarantees grid resilience. The real-time implementation of this model is costly. HOMER pro (Ishraque et al. 2021) ensures the performance regarding the LCOE, NPC, and CO2 gas emissions and ensures an uninterrupted supply of electrical power. It suffers from processing the real-life Barishal and Chattogram distribution network via the considered distribution line in the Simulink study. PSO (Bandyopadhyay et al. 2020) performs better by deriving trade-offs among various objectives such as simple payback period, power autonomy, self-sufficiency, and lifetime capital cost and examines the effect of feed-in tariffs and the electricity pricing tariffs on optima sizing of battery and PV systems. It suffers from higher payback periods. Mixed-integer-linear-program (Mathiesen et al. 2021) incorporates the intra-hour variability into the microgrid and reduces the runtime and maintained the optimality. It does not explore purchases on utility on power demand charges. In the Genetic Algorithm (Nagapurkar and Smith 2019), the economies of scale impacts are examined on sustainability and verify the power requirements and achieve a lower carbon footprint. It does not explore the social cost of carbon on a utility-scale microgrid. Multi-level optimization (Ganjeh et al. 2020) increases the performance owing to grid reliability and voltage quality and the network efficiency is enhanced regarding reliability indices, voltage quality, thermal dumped energy, and total cost. It faces complications regarding the generality of the designed model. K-means clustering (Yu et al. 2021) maximizes the flexibility of the system via techno-economic analysis of an off-grid microgrid and efficiently alters the load profiles for economic reasons. The results are affected by the uncertainties of renewable energy sources. Thus, there is a need on designing a new techno-economical optimization approach using a microgrid.
Features and challenges of traditional techno-economical optimization approach using microgrid.
| Author (citation) | Methodology | Features | Challenges |
|---|---|---|---|
| Rezaeimozafar et al. (2020) | GA-PSO |
|
|
| Murty and Kumar (2020b) | Hybrid optimization model |
|
|
| Ishraque et al. (2021) | HOMER pro |
|
|
| Bandyopadhyay et al. (2020) | PSO |
|
|
| Mathiesen et al. (2021) | Mixed-integer-linear-program |
|
|
| Nagapurkar and Smith (2019) | Genetic algorithm |
|
|
| Ganjeh et al. (2020) | Multi-level optimization |
|
|
| Yu et al. (2021) | K-means clustering |
|
|
3 Modeling of system components: solar cell, wind turbine, and energy storage systems
3.1 Solar cell
Based on the considerations in (Rahbari et al. 2017), the resultant power obtained from the solar cells gets affected by factors like solar cell temperature STD which is given in Eq. (1).
Here, the term SUN denotes the intensity rate taken based on the solar radiation, STamb represents the ambient temperature that is considered to be °C and the general operating cell temperature depicted by Noct. For generating the pattern from solar radiation, the beta possibility distribution function is given as shown in Eq. (2).
Here, the terms β and α are correspondingly the parameters related to beta distribution, which are computed in Eqs. (3) and (4), respectively. The standard deviation and mean of the solar radiation acquired through the statistical data are indicated by
Here, the term η pv indicates the energy efficiency of the solar cell.
3.2 Wind turbine
The output power obtained through the wind turbine is computed based on three parameters such as air mass direction, wind speed, and turbine location as mentioned in (Rahbari et al. 2017). At the same time, the wind speed contains a huge impact on the turbine output and thus, the Weibull possibility distribution function is employed for generating the arbitrary wind speed variation (Abedini, Moradi, and Hosseinian 2016) that is depicted in Eq. (6).
Here, the term l indicates the shape parameter and λ represents the scale parameter. The kinetic energy for the airflow is considered with the wind speed v and mass M that is shown in Eq. (7).
Next, the generated power through the wind turbines is determined in Eq. (9).
This kinetic energy is utilized for acquiring the transmission power through the wind turbine blades. Here, the terms ρ, Ar and Le are correspondingly denoted for air density, area secured by the turbine blades, and turbine blade length.
3.3 Energy storage systems
The optimal scheduling performed for ESS causes increasing frequency stability and power balance (Atia and Yamada 2016). ICM is involved in deriving the optimal discharging and charging patterns belonging to the storage system. The specifications considered for the ESS are given in Table 2 (Delfino et al. 2019; Jarraya et al. 2019).
Specifications considered for the ESS.
| Terms | SOC |
|---|---|
| SOC1 upper limit (%) | 90 |
| SOC lower limit (%) | 20 |
| Self-discharge rate (%Energy/month) | 5 |
| Efficiency (%) | 95 |
Then, the SOC for the hourly ESS is acquired in Eq. (10).
Here, the term α
Dch denotes the self-discharging rate, η
Ess indicates the discharging or charging efficiency of ESS,
3.4 System model
The DSM act as a significant role in handling renewable power generation and load. The core concept of this DSM is to reduce the emission rate, electricity cost, and peak demand. The critical key issues in the existing approaches are not well examined in the microgrids (Mbungu et al. 2023) to reduce the electricity cost. Owing to the stochastic behavior of wind and solar energies, it affects the accuracy rate of the system. Therefore, in this research work the latest hybrid ISOA algorithm is integrated into the microgrid system for reducing fuel cost electricity supply costs, initial costs, energy efficiency, and operation cost.
The diagrammatic representation of the presented techno-economic optimization in a microgrid with a demand-side management model is shown in Figure 1. Here, the Wind Turbine, ESS, optimal capacity of PV is determined by the novel techno-economical optimization with ISOA model using multi-objective function concerning metrics like network power losses, voltage fluctuations, electricity supply costs, initial cost, operation cost, fuel cost, and demand side management. At last, the experiments on the IEEE-33 bus network are conducted for achieving optimal energy management which is done on distributed energy resources.
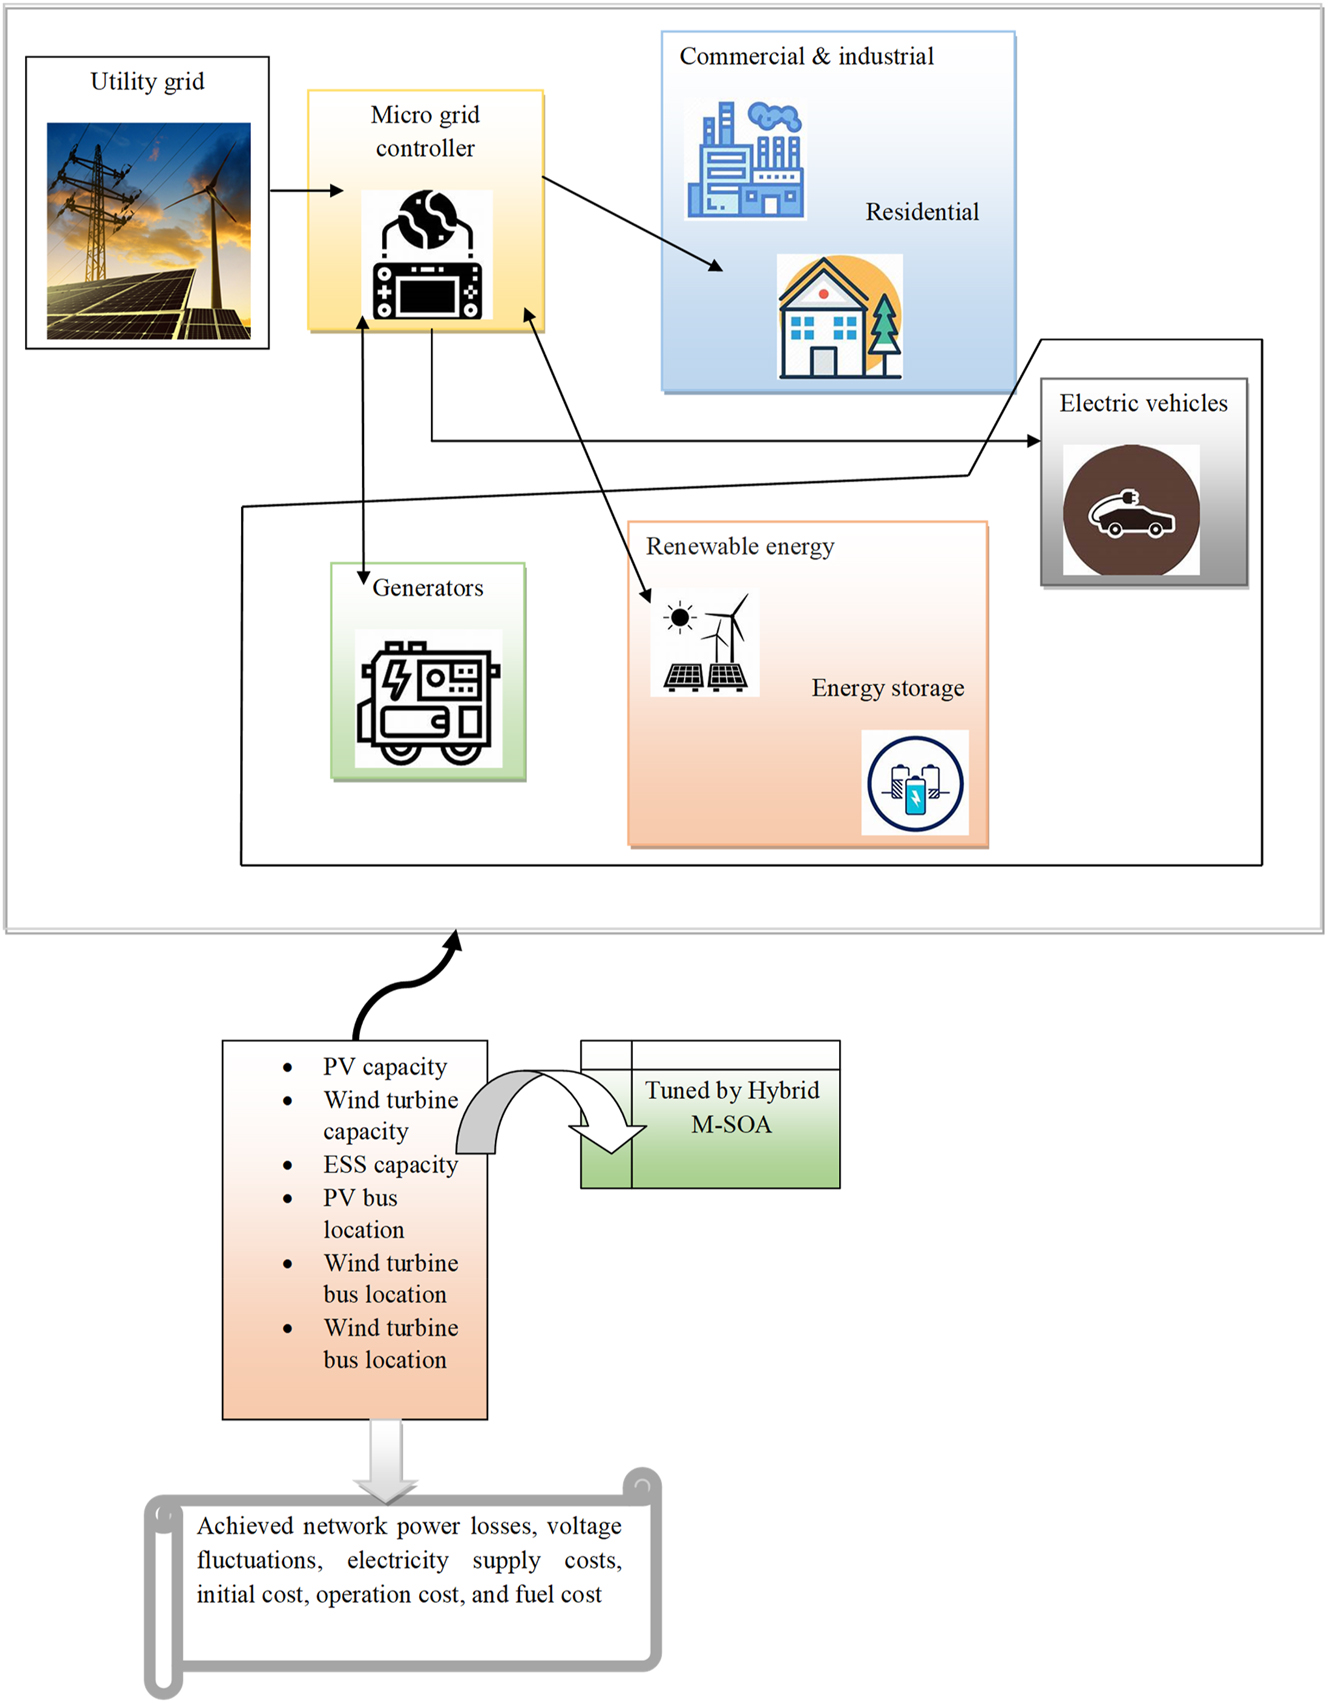
Structural view of the developed techno-economic optimization in a microgrid with demand side management model.
4 Demand side management for techno-economic optimization in microgrid with multi-objective function
4.1 Demand side management
Demand-side involvement is a significant part of the scheduling of optimal energy with superior security and minimum cost (Zakariazadeh, Jadid, and Siano 2014). Demand response is considered as the standard approach for the demand side involvement that motivates the users for adjusting their elastic loads based on the request of the users or with the price signals. Generally, elastic loads are categorized into curtailable and shiftable loads. The advantages of demand response for the users have included continuity and fewer expenses for electricity. In addition, it contains the profits for microgrid operators in terms of avoiding the expensive generators, optimal operations with the intention of cost savings, and minimal purchasing of costly power through the load curve flattening and the main grid. Generally, the demand responses are categorized into two significant classes belonging to Incentive-Based and Time-Based Rate (TBR) programs. Here, the IB programs are modified based on user demand with the consideration of penalty and incentive options, and at the same time, the TBR program is modified based on the consideration of variations in the electricity costs at various times.
According to Amini and Moghaddam (2013), a single EV probabilistic demand is designed for acquiring the hourly demand of parking lots based on diverse kinds of EVs and diverse driving modes. The specifications of EVs are represented in Tables 3 and Table 4 that is obtained from (Mozafara, Hadi Amini, and Hasan Moradi 2018). As battery life is reduced by the full battery discharge, the Depth of Discharge (DOD) is considered to be 80 %.
Specifications related to EV.
| EV Type | A | B | C | D | Mean value | |
|---|---|---|---|---|---|---|
| Battery cap (kWh) | 35 | 16 | 18 | 12 | 18.54 | |
| Energy consumption (kWh/mile) | Road | 0.14 | 0.13 | 0.16 | 0.16 | 0.1397 |
| City | 0.182 | 0.168 | 0.21 | 0.21 | 0.1945 | |
| Freeway | 0.21 | 0.194 | 0.242 | 0.242 | 0.2245 | |
| High traffic | 0.213 | 0.196 | 0.245 | 0.245 | 0.2274 | |
| Market share (%) | 38 | 9 | 25.5 | 27.5 |
Charging rates of EV.
| Charging/discharging power (kW) | 0.1 | 0.3 | 1.0 |
|---|---|---|---|
| Charging mode | Slow charging | Slow charging | Slow charging |
The Log-Normal distribution function is employed for computing the routine mileage of the estimated EVs (Domínguez-García, Heydt, and Suryanarayanan 2011; Roe et al. 2030) that are shown in Eq. (12).
Here, the arbitrary variable is indicated by Y that is having a mean value of 0 and a variance of 1. The parameters of the lognormal distribution are given by μ d and σ d , respectively, which are determined based on the standard deviation and mean of the distance traveled with the EVs according to statistics (Amini and Moghaddam (2013); Jarraya et al. 2019). These formulations are made as follows.
Then, the maximum distance DSTMax is computed for finding the traveling capacity of the EVs containing a fully charged battery which is shown in Eq. (17).
Here, the term Bcap denotes the battery capacity of the EV in terms of kWh, and the energy consumption is computed per mile that is indicated by F D . For computing the estimated energy demand belonging to EVs, four diverse driving modes are considered in Eq. (18).
Furthermore, the computation of respective SOC at the time of relieving the parking lot is done by utilizing the arrival time T Arvl, the duration of EVs availability over the parking lot, and the departure time T Deprt. Then, the time duration T Durtn is acquired as in Eq. (23).
Here, the term μ denotes the mean value and σ indicates the standard deviation considered for arrival and departure time according to historical data. The generally distributed arbitrary variables are given by Y 1 and Y 2.
Then, the required SOC is computed with the determined parameters and also with the charging rate
4.2 Derived multi-objective function
The developed M-SOA is used for optimizing the microgrid constraints like optimal capacity as well as bus location of PV, Wind Turbine, and ESS for meeting the demand side management in the Microgrid system based on the concept of techno-economic optimization. The main objective of the techno-economic optimization is to reduce the power loss, voltage fluctuations, and electricity supply costs that are shown in Eq. (25).
Here, the terms OCPV denote the optimal capacity of PV that is in the range of [0.002, 0.009], OCWT indicates the optimal capacity of wind turbine that is in the range of [0.2, 0.8], OCESS represents the optimal capacity of ESS that is in the range of [0.2, 0.8], BLPV describes the bus location of PV that is in the range of [2, 33], BLWT depicts the bus location of wind turbine that is in the range of [2, 33] and BLESS describes the bus location of ESS that is in the range of [2, 33]. Here, the penalty value is included for avoiding the worst solution from the model and this penalty value is indicated by PN. This penalty will be added to the solution if the solution does not satisfy objective constraints like demand-supply balance, bus voltage limitations, and pricing constraints. The penalty value is considered to be 0.1.
Power loss pLs is considered the first objective to be reduced as shown in Eq. (26).
Then, the voltage fluctuation vFl is considered as the second objective to be reduced as shown in Eq. (27).
At last, the electricity supply costs have to be reduced as the third objective as given in Eq. (28).
Here, the charging durations of EV are given as
5 Development of modified sandpiper optimization algorithm for techno-economic optimization in microgrid with demand side management
5.1 Proposed M-SOA
The developed M-SOA integrated with the techno-economic optimization considering the multi-objective function concerning network power losses, voltage fluctuations, electricity supply costs, initial cost, operation cost, and fuel cost by tuning the parameters like PV capacity, wind turbine capacity, ESS capacity, PV bus location, wind turbine bus location and ESS bus location of the microgrid. SOA is chosen in the developed model since it can solve the multi-objective problem and is also able to balance the exploration and exploitation phase efficiently. However, this algorithm shows a slight deviation in the convergence performance due to the random update of the parameters. Therefore, a new improvement is made in the SOA and the improved optimization algorithm is named M-SOA for solving the conventional problems. In the implemented M-SOA, the additional variable D B in the collision avoidance phase of the conventional SOA is updated with the fitness-based concept as shown in Eq. (33).
Here, the term Fitmin denotes the minimum fitness value and Fitmax indicates the maximum fitness value.
SOA (Kaur, Jain, and Goel 2020): This heuristic algorithm is derived from the attacking behavior of the seabirds which are observed to be highly sharp birds, which utilizes the bread crumbs for hunting the fishes and are also very efficient in generating the rain-like sound with the support of their feet for catching the underground earthworms. These sandpipers have excellent behaviors of migrating as well as attacking characteristics. These behaviors are described as follows.
Exploration phase (Migration behavior) : This algorithm tests the set of sandpipers that propagates from one place to another place at the time of migration. A sandpiper has to meet the upcoming three constraints.
Avoid the collision: A supplementary variable D B is utilized for determining the new sandpiper’s location for avoiding collision among their nearby sandpipers. This is formulated in Eq. (34).
Here, the term
Convergence towards the optimal neighbor’s direction: Followed by avoidance of collision, the search agent propagates in the path of reaching the best neighbor as shown in Eq. (35).
Here, the term
Here, the term S nd indicates the arbitrary number that stays between [0, 1].
Position Upgrade based on the position of the best search agent: At last, the sandpiper gets updated with their position concerning the optimal sandpiper, and the distance between the sandpiper and the optimal sandpiper is given in Eq. (37).
Here, the term
Exploitation phase (Attacking characteristic) : At the time of migration, the sandpipers modify their angle and speed of the attack continuously. It enhances the altitude by utilizing their wings. Here, the sandpipers produce the spiral characteristic for attacking the prey, which is observed to perform in the 3D plane as shown below.
Here, the term Rd denotes the radius of every spiral turn, j indicates the variable that lies in-between [0 ≤ l ≤ 2π], and the constant parameters are correspondingly indicated by v and w for describing the spiral shape and e denotes the logarithm base. Then, the improved position of the sandpiper is determined as in Eq. (42) based on the computations made in Eqs. (38)–(40).
Here, the term
| Algorithm 1: Developed M-SOA |
| Population initialization
|
| Get the parameters D C |
| Determine the best search agent
|
| Compute the fitness of all search agents |
| While (a<Mx it ) do |
| For every sandpiper do |
| Compute the additional variable D B with the adaptive concept as in Eq. (33) |
| Update the sandpiper’s position based on Eq. (42) |
| End for |
| Update the value of parameters |
| Determine the fitness value after the position update |
| a←a+1 |
| End while |
| Return
|
| End |
The flowchart of the developed M-SOA is depicted in Figure 2.
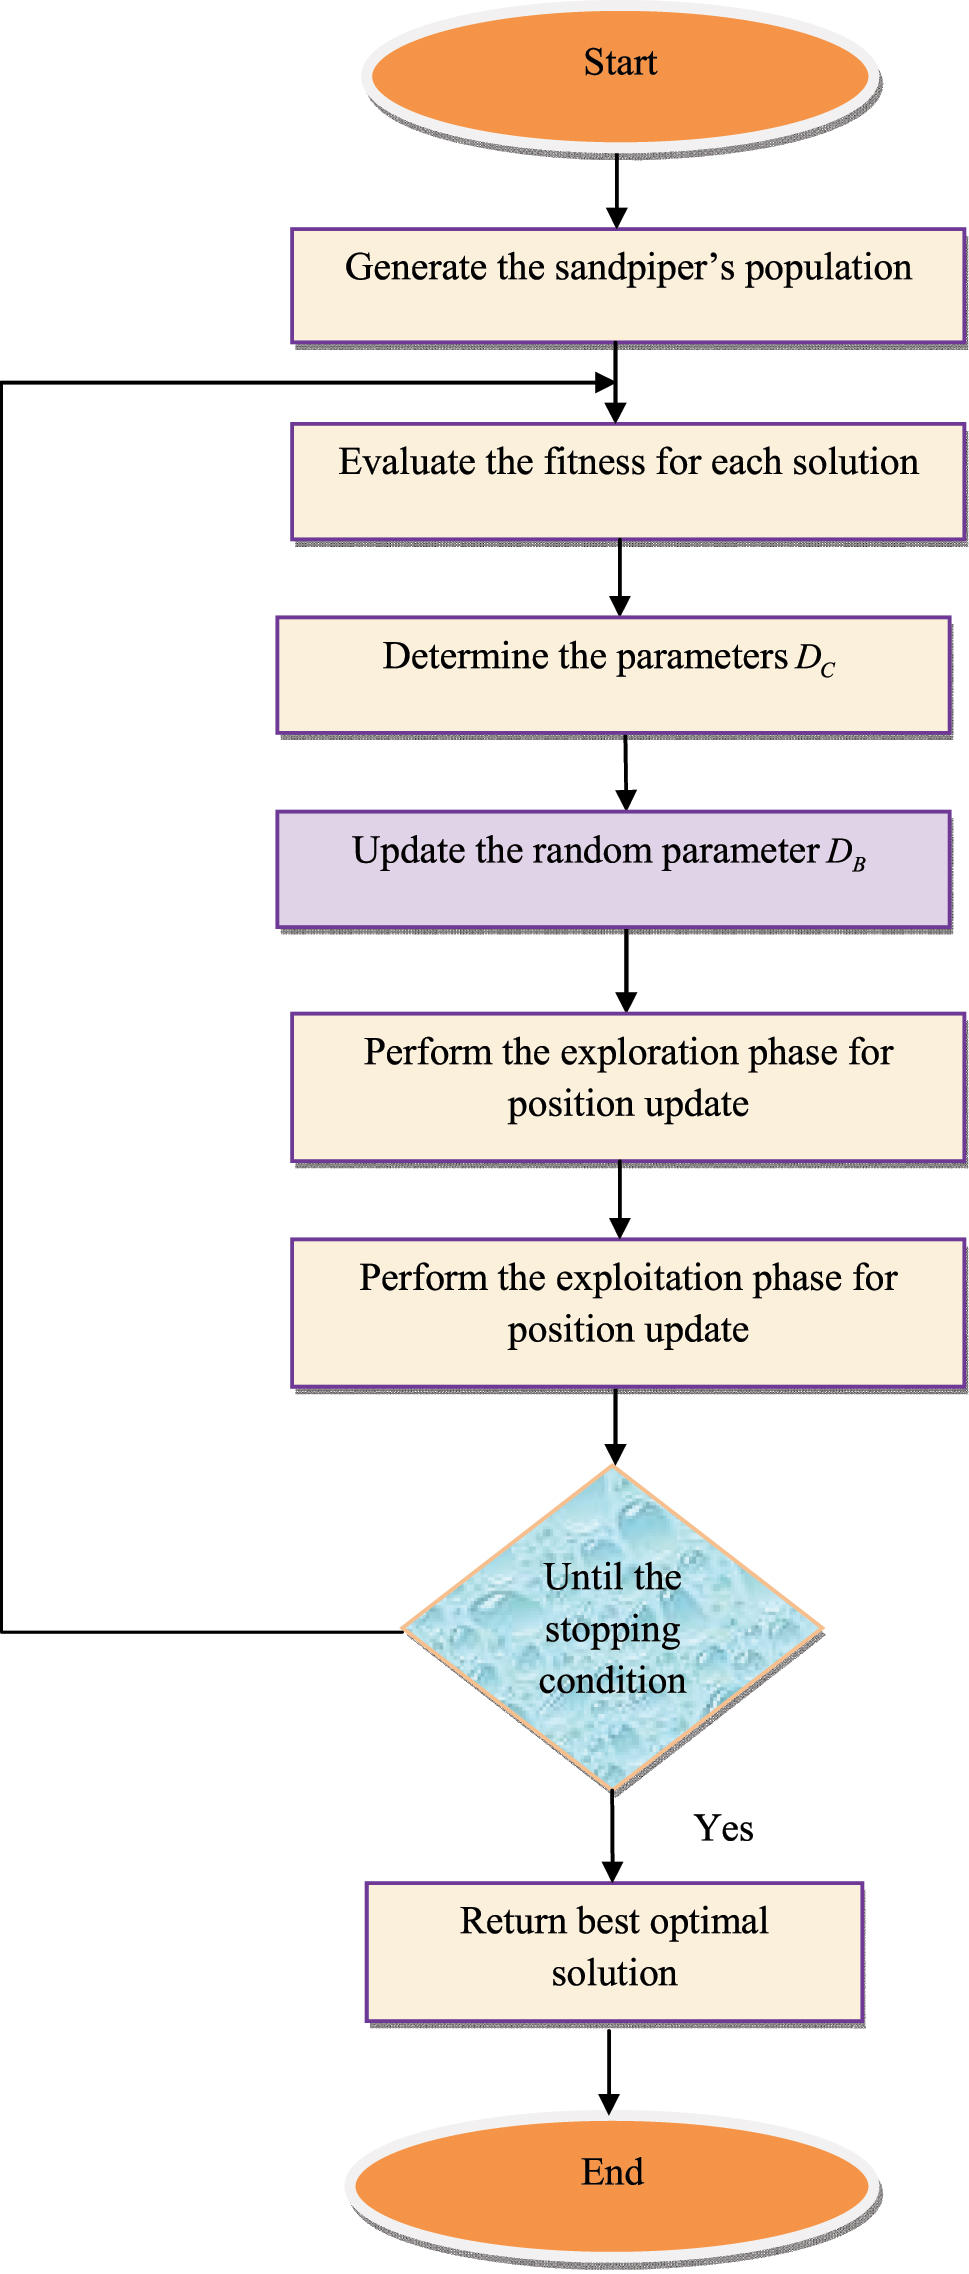
Flowchart of the developed M-SOA.
5.2 Constraints to meet
Three constraints are considered as the objective constraints and the optimal solution should satisfy these objective constraints or else a penalty will be added to it for removing the particular solution for solving the objective problem. The objective constraints are described as follows.
Demand supply balance is depicted as follows.
Here, the balance between the load demand and power generation overall buses have to be managed. Since DERs combined to be a system, then it can be written as in Eq. (45).
Pricing constraints: The energy prices are committed to being in the limited range for reducing the expenses of the customers and the permitted range is given in Eq. (48).
Then, the lower bills are assured for customers to motivate them to be actively involved in the demand response program. This is given in Eq. (49).
When the condition (τ ≤ 1) is satisfied, the distribution network operator gets benefitted.
6 Results and discussions
6.1 Experimental setup
The proposed techno-economic optimization in microgrid with demand side management model was implemented in MATLAB 2020a. The evaluation of the developed system was made to analyze the performance of convergence along with demand, power loss, and supply cost. The developed M-SOA was compared with other algorithms like “Artificial Gorilla Troops Optimizer (AGTO) (Singh et al. 2022), Butterfly Optimization Algorithm (BOA) (Qazani et al. 2020), Whale Optimization Algorithm (WOA) (Zhai et al. 2020), and SOA (Kaur, Jain, and Goel 2020)”. Also, objective functions like power loss, voltage fluctuations, and electricity costs were considered for analyzing the benefits of the developed model. This implemented model has been simulated in the IEEE-33 bus network (Delfino et al. 2019), where the electricity supply is conducted through the centralized power plant associated with bus 1. Here, the line diagram is given representing the IEEE-33 bus network as shown in Figure 3.

Architectural representation of the IEEE-33 bus network.
6.2 Parameter initialization
The parameter generated for the developed Demand Side Management in a Microgrid system with techno-economic optimization is given in Table 5.
Simulation parameters of the developed Demand Side Management in a Microgrid system with techno-economic optimization.
| Parameter description | Ranges |
|---|---|
| Energy resources | {PV, wind turbine, ESS} |
| No. of network buses Nb | 33 |
| Minimum voltage V MIN | 0.002 |
| Maximum voltage V MAX | 0.009 |
| Minimum phase angle δ MIN | 0.01 |
| Maximum phase angle δ MAX | 0.08 |
| The nominal output power of solar cell Npv | 5 MW |
| Solar energy efficiency η pv | 2 % |
| Nominal operating cell temperature Noct | 28 °C |
| The intensity of solar radiation SUN | 3 W/m2 |
| Ambiant temperature STamb | 8 °C |
| Self-price elasticity of the demand η tt | −0.1 |
| The cross-price elasticity of the demand η sg | 0.001 |
| Number of EVs(electric vehicles) at each time interval M EV | 7 |
| Minimum charging/Discharging power of ESS F MIN | 0.2 |
| Maximum charging/Discharging power of ESS F MAX | 0.8 |
| Number of charging stations M ST | 3 |
| Minimum charging/Discharging duration of ESS and EV T MIN | 0.5 |
| Maximum charging/Discharging duration of ESS and EV T MAX | 0.9 |
| The minimum price of ESS
|
12 |
| Maximum price of ESS
|
25 |
| The minimum price of electricity PRMIN | 144 $/MWh |
| Maximum price of electricity PRMAX | 167 $/MWh |
6.2 Cost function analysis
The cost function analysis is performed for the developed techno-economic optimization in microgrid with demand side management model by comparing with the conventional heuristic algorithms for 24 h, in which 3 h, 6 h, 9 h, and 12 h are given in Figure 4. Here, the developed model has shown minimum convergence rate than the conventional algorithms like AGTO, BOA, WOA, and SOA, respectively that is lower power loss, voltage fluctuation, and minimum pricing constraints are achieved through the developed techno-economic optimization model in microgrids.
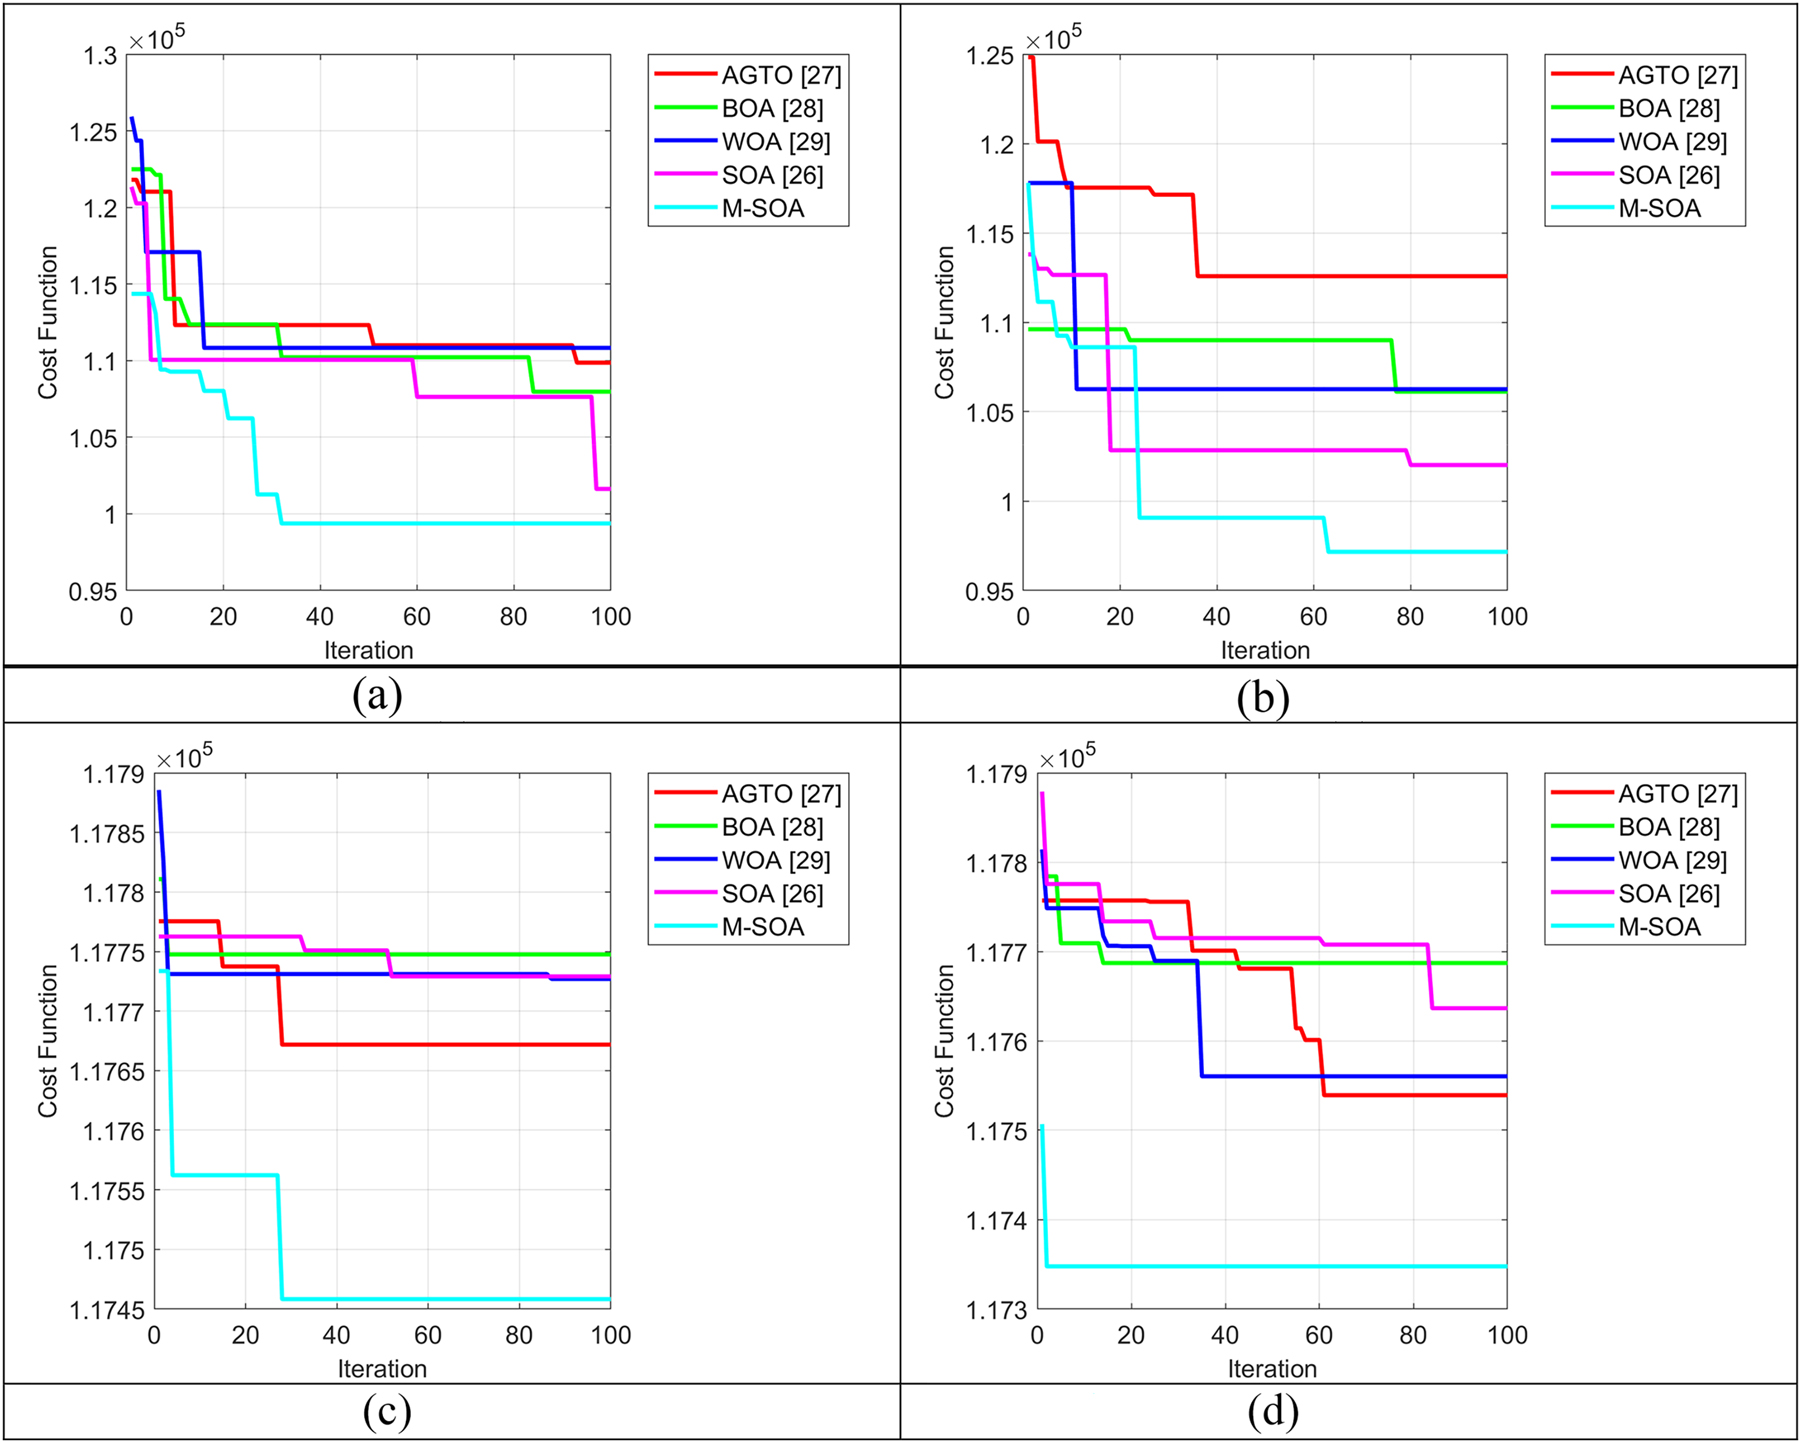
Cost function evaluation on the developed techno-economic optimization in microgrid with demand side management model for (a) 3 h, (b) 6 h, (c) 9 h, and (d) 12 hours.
6.4 Network demand analysis
The implemented techno-economic optimization in microgrid with demand side management model is compared with the conventional algorithms based on the constraint of network demand that is shown in Figure 5. On observing the graph, the highest demand occurred between 10 and 15 h, which represents the reduction in the system dependency based on the centralized power plant, which is highly essential for decreasing the costs of the network operation.
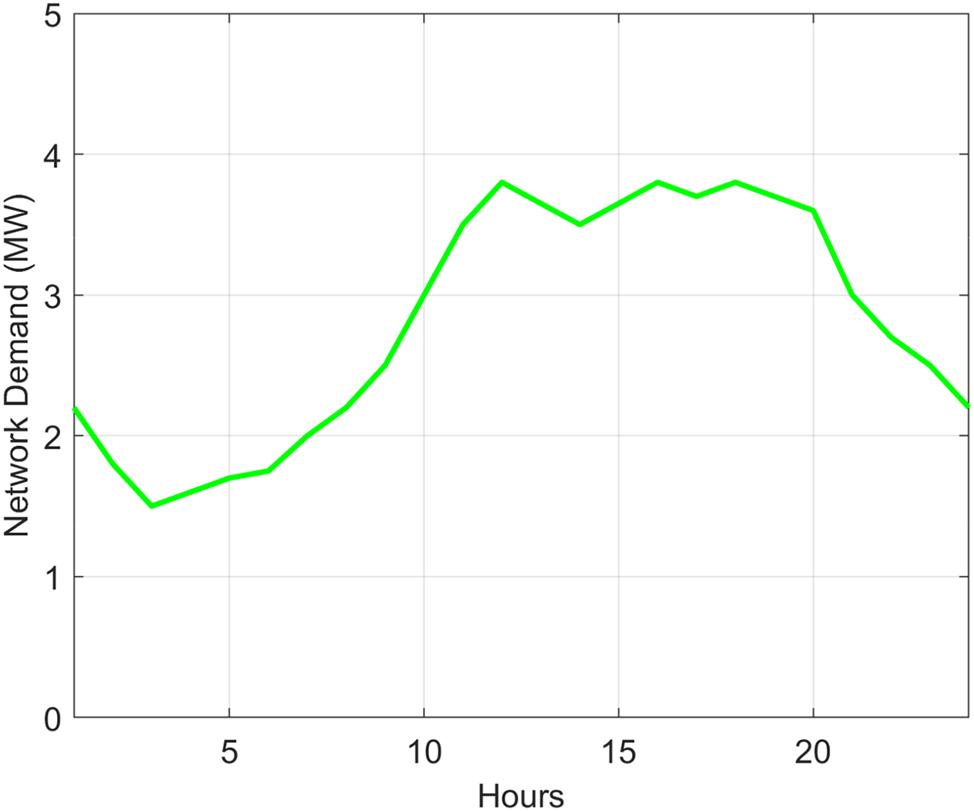
Network demand analysis on developed techno-economic optimization in microgrid model for 24 hours.
6.5 Multi-objective analysis based on power loss, supply cost, and voltage fluctuations
The objective constraints are considered for the analysis of the developed techno-economic optimization in microgrid with demand side management model by comparing with the conventional algorithms as shown in Figure 6. With the consideration of power loss analysis, the proposed model sudden variations in the power loss between the 10–20 h and finally, get reduced the power loss. Similarly, the reduction in the supply costs and voltage fluctuations takes place.
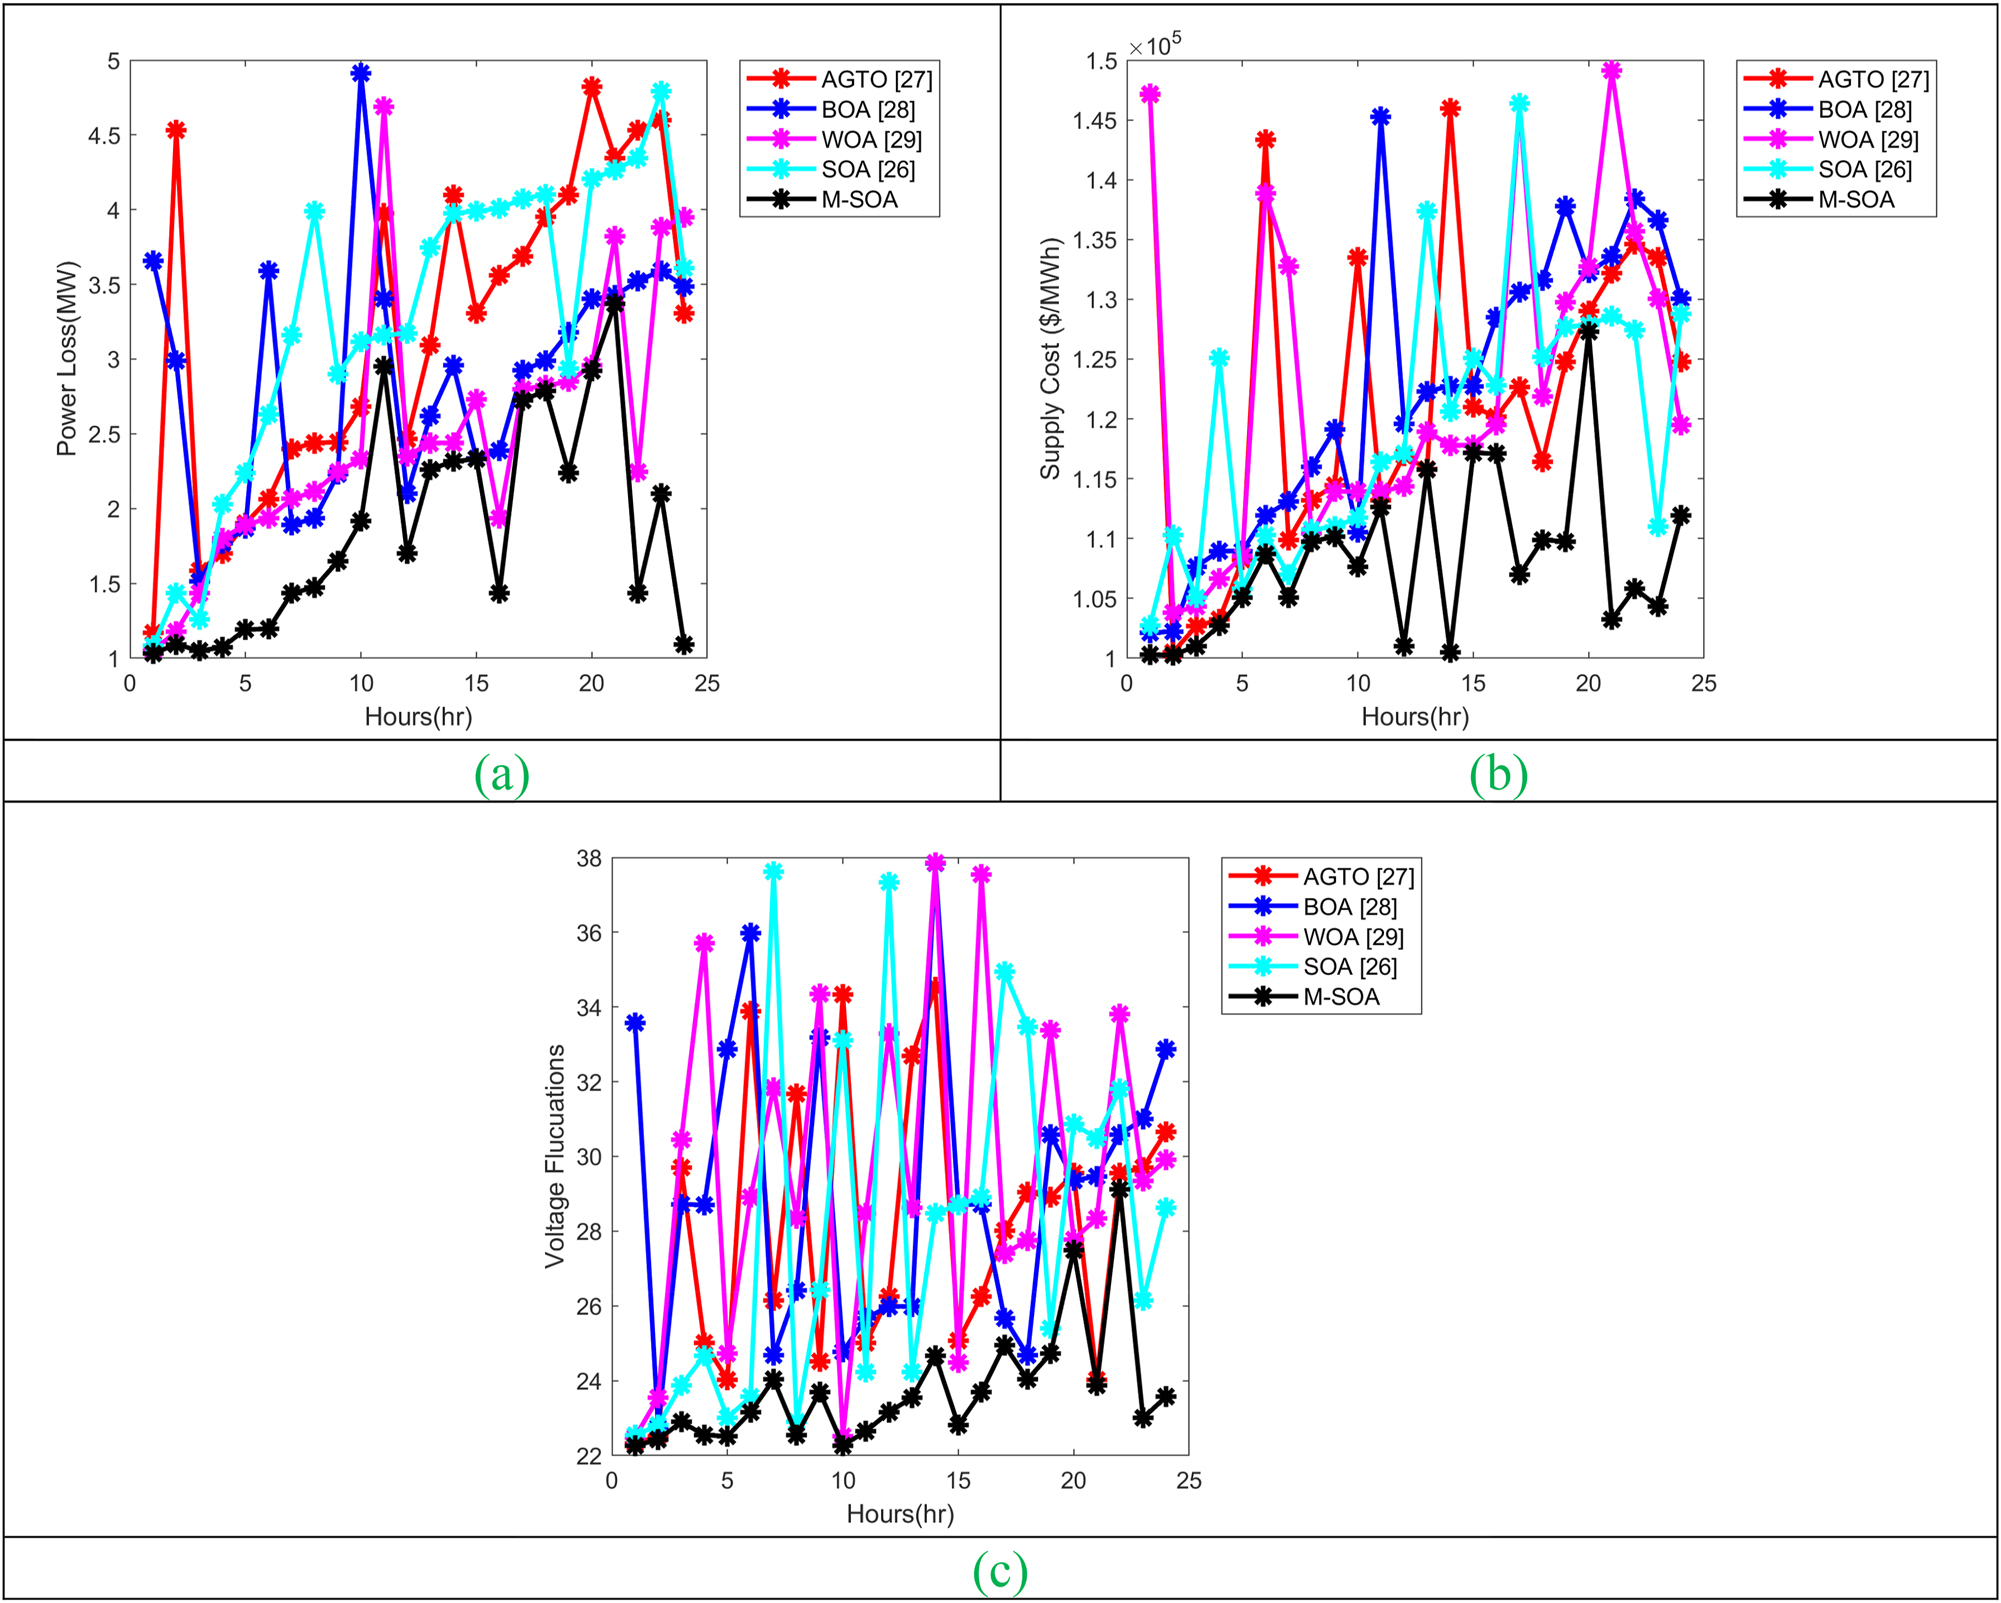
Multi-objective analysis on developed techno-economic optimization in microgrid with demand side management model in terms of (a) power loss, (b) supply costs, and (c) voltage fluctuations.
6.5 Different Scenarios-based power loss, supply cost, and voltage fluctuations analysis
The three constraints like power loss, supply cost, and voltage fluctuations are considered individually in the first three scenarios, and in the fourth scenario, all three objective constraints are combined and involved for the analysis of developed techno-economic optimization in microgrid with demand side management model as in Figure 7. From this analysis, it is shown that minimum rate of power loss and supply costs that are achieved through the developed M-SOA when compared to the conventional heuristic strategies.

Different scenarios-based power loss, supply cost, and voltage fluctuations analysis on developed techno-economic optimization in microgrid with demand side management model.
6.7 Statistical analysis of implemented model
The implemented techno-economic optimization in microgrid with demand side management model is taken for the statistical analysis based on statistical measures like best, worst, mean, median, and standard deviation as given in Table 6. The developed model secures minimum mean cost function when compared to the conventional techniques AGTO, BOA, WOA, and SOA, respectively that is customer’s expenses on the operational cost have been reduced through the developed model based on the proposed M-SOA.
Statistical Analysis of Developed techno-economic Optimization in Microgrid with demand side management.
| Analysis constraints | AGTO (Singh et al. 2022) | BOA (Qazani et al. 2020) | WOA (Zhai et al. 2020) | SOA (Kaur, Jain, and Goel 2020) | M-SOA |
|---|---|---|---|---|---|
| Analysis of 3 h | |||||
|
|
|||||
| Best | 1.10 × 10+05 | 1.08 × 10+05 | 1.11 × 10+05 | 1.02 × 10+05 | 99,371 |
| Worst | 1.22 × 10+05 | 1.22 × 10+05 | 1.26 × 10+05 | 1.21 × 10+05 | 1.14 × 10+05 |
| Mean | 1.12 × 10+05 | 1.11 × 10+05 | 1.12 × 10+05 | 1.09 × 10+05 | 1.02 × 10+05 |
| Median | 1.12 × 10+05 | 1.10 × 10+05 | 1.11 × 10+05 | 1.10 × 10+05 | 99,371 |
| Standard deviation | 2898.2 | 3429.7 | 3058.1 | 2972.6 | 4643.2 |
|
|
|||||
| Analysis of 6 h | |||||
|
|
|||||
| Best | 1.13 × 10+05 | 1.06 × 10+05 | 1.06 × 10+05 | 1.02 × 10+05 | 97,157 |
| Worst | 1.25 × 10+05 | 1.10 × 10+05 | 1.18 × 10+05 | 1.14E × 10+05 | 1.18 × 10+05 |
| Mean | 1.15 × 10+05 | 1.08 × 10+05 | 1.07 × 10+05 | 1.04 × 10+05 | 1.01 × 10+05 |
| Median | 1.13 × 10+05 | 1.09 × 10+05 | 1.06 × 10+05 | 1.03 × 10+05 | 99,066 |
| Standard deviation | 2938.7 | 1330.6 | 3476.6 | 3874.1 | 5101.2 |
|
|
|||||
| Analysis of 9 h | |||||
|
|
|||||
| Best | 1.18 × 10+05 | 1.18 × 10+05 | 1.18 × 10+05 | 1.18 × 10+05 | 1.17 × 10+05 |
| Worst | 1.18 × 10+05 | 1.18 × 10+05 | 1.18 × 10+05 | 1.18 × 10+05 | 1.18 × 10+05 |
| Mean | 1.18 × 10+05 | 1.18 × 10+05 | 1.18 × 10+05 | 1.18 × 10+05 | 1.17 × 10+05 |
| Median | 1.18 × 10+05 | 1.18 × 10+05 | 1.18 × 10+05 | 1.18 × 10+05 | 1.17 × 10+05 |
| Standard deviation | 39.323 | 8.9 | 18.139 | 15.177 | 61.661 |
|
|
|||||
| Analysis of 12 h | |||||
|
|
|||||
| Best | 1.18 × 10+05 | 1.18 × 10+05 | 1.18 × 10+05 | 1.18 × 10+05 | 1.17 × 10+05 |
| Worst | 1.18 × 10+05 | 1.18 × 10+05 | 1.18 × 10+05 | 1.18 × 10+05 | 1.18 × 10+05 |
| Mean | 1.18 × 10+05 | 1.18 × 10+05 | 1.18 × 10+05 | 1.18 × 10+05 | 1.17 × 10+05 |
| Median | 1.18 × 10+05 | 1.18 × 10+05 | 1.18 × 10+05 | 1.18 × 10+05 | 1.17 × 10+05 |
| Standard deviation | 95.558 | 19.785 | 77.854 | 42.515 | 15.92 |
6.8 Time analysis of implemented model
The developed techno-economic optimization in microgrid with demand side management model is evaluated based on the time analysis as displayed in Table 7. The developed M-SOA obtains 3.84 %, 0.98 %, 5.72 %, and 4.63 % better performance with less latency than the AGTO, BOA, WOA, and SOA, respectively. This shows that the developed model has scored a better performance rate on reducing the objective constraints with less time consumption.
Time Analysis on developed techno-economic optimization in microgrid with demand side management.
| Hours | AGTO (Singh et al. 2022) (sec) | BOA (Qazani et al. 2020) (sec) | WOA (Zhai et al. 2020) (sec) | SOA (Kaur, Jain, and Goel 2020) (sec) | M-SOA (sec) |
|---|---|---|---|---|---|
| 3 | 3.5774 | 3.7498 | 3.5755 | 3.5641 | 3.5562 |
| 6 | 3.8133 | 3.7033 | 3.8893 | 3.8449 | 3.6668 |
| 9 | 3.6393 | 3.6308 | 3.6186 | 3.6538 | 3.6133 |
| 12 | 3.6852 | 3.7931 | 3.7064 | 3.6553 | 3.6287 |
6.9 Power loss, supply cost, and voltage fluctuations analysis on implemented model
The developed techno-economic optimization in microgrid with demand side management model is analyzed based on power loss, supply cost, and voltage fluctuations are mentioned in Table 8.
Power Loss, Supply Cost, And Voltage Fluctuations-based Analysis on developed techno-economic optimization in microgrid with demand side management.
| Hours | AGTO (Singh et al. 2022) | BOA (Qazani et al. 2020) | WOA (Zhai et al. 2020) | SOA (Kaur, Jain, and Goel 2020) | M-SOA |
|---|---|---|---|---|---|
| Power loss | |||||
|
|
|||||
| 1 | 1.1709 | 3.6558 | 1.0502 | 1.083 | 1.0313 |
| 2 | 4.5303 | 2.987 | 1.1788 | 1.4368 | 1.0927 |
| 3 | 1.5854 | 1.5146 | 1.4343 | 1.2578 | 1.0496 |
| 4 | 1.7012 | 1.7692 | 1.8027 | 2.0276 | 1.073 |
| 5 | 1.9012 | 1.8691 | 1.8901 | 2.24 | 1.1933 |
| 6 | 2.0631 | 3.5914 | 1.9365 | 2.6319 | 1.1945 |
| 7 | 2.3986 | 1.8921 | 2.0649 | 3.1603 | 1.4345 |
| 8 | 2.4397 | 1.9352 | 2.1142 | 3.9899 | 1.4735 |
| 9 | 2.444 | 2.2291 | 2.2449 | 2.8992 | 1.6478 |
| 10 | 2.6818 | 4.9138 | 2.3311 | 3.1164 | 1.9156 |
| 11 | 3.9732 | 3.4042 | 4.6879 | 3.1603 | 2.9501 |
| 12 | 2.4653 | 2.0983 | 2.3504 | 3.1719 | 1.7012 |
| 13 | 3.0949 | 2.6179 | 2.4396 | 3.7457 | 2.2616 |
| 14 | 4.0982 | 2.9576 | 2.4396 | 3.9754 | 2.3156 |
| 15 | 3.3063 | 2.3353 | 2.7319 | 3.9899 | 2.3311 |
| 16 | 3.5597 | 2.3865 | 1.9352 | 4.0071 | 1.4343 |
| 17 | 3.6869 | 2.9243 | 2.8002 | 4.0736 | 2.7244 |
| 18 | 3.9538 | 2.987 | 2.8229 | 4.1001 | 2.7874 |
| 19 | 4.0982 | 3.1785 | 2.849 | 2.9371 | 2.24 |
| 20 | 4.823 | 3.4042 | 2.9576 | 4.2046 | 2.9214 |
| 21 | 4.3442 | 3.4246 | 3.8216 | 4.2655 | 3.3693 |
| 22 | 4.5303 | 3.5227 | 2.2449 | 4.3455 | 1.4345 |
| 23 | 4.5975 | 3.5914 | 3.882 | 4.793 | 2.0983 |
| 24 | 3.3063 | 3.4845 | 3.9496 | 3.6098 | 1.0927 |
|
|
|||||
| Supply cost | |||||
|
|
|||||
| 1 | 147,110 | 1.02 × 10+05 | 1.47 × 10+05 | 1.03 × 10+05 | 1.00 × 10+05 |
| 2 | 1.01 × 10+05 | 1.02 × 10+05 | 1.04 × 10+05 | 1.10 × 10+05 | 1.00 × 10+05 |
| 3 | 1.03 × 10+05 | 1.08 × 10+05 | 1.04 × 10+05 | 1.05 × 10+05 | 1.01 × 10+05 |
| 4 | 1.03 × 10+05 | 1.09 × 10+05 | 1.07 × 10+05 | 1.25 × 10+05 | 1.03 × 10+05 |
| 5 | 1.08 × 10+05 | 1.09 × 10+05 | 1.09 × 10+05 | 1.06 × 10+05 | 1.05 × 10+05 |
| 6 | 1.43 × 10+05 | 1.12 × 10+05 | 1.39 × 10+05 | 1.10 × 10+05 | 1.09 × 10+05 |
| 7 | 1.10 × 10+05 | 1.13 × 10+05 | 1.33 × 10+05 | 1.07 × 10+05 | 1.05 × 10+05 |
| 8 | 1.13 × 10+05 | 1.16 × 10+05 | 1.10 × 10+05 | 1.11 × 10+05 | 1.10 × 10+05 |
| 9 | 1.14 × 10+05 | 1.19 × 10+05 | 1.14 × 10+05 | 1.11 × 10+05 | 1.10 × 10+05 |
| 10 | 1.34 × 10+05 | 1.11 × 10+05 | 1.14 × 10+05 | 1.12 × 10+05 | 1.08 × 10+05 |
| 11 | 1.13 × 10+05 | 1.45 × 10+05 | 1.14 × 10+05 | 1.16 × 10+05 | 1.13 × 10+05 |
| 12 | 1.17 × 10+05 | 1.20 × 10+05 | 1.14 × 10+05 | 1.17 × 10+05 | 1.01 × 10+05 |
| 13 | 1.16 × 10+05 | 1.22 × 10+05 | 1.19 × 10+05 | 1.37 × 10+05 | 1.16 × 10+05 |
| 14 | 1.46 × 10+05 | 1.23 × 10+05 | 1.18 × 10+05 | 1.21 × 10+05 | 1.01 × 10+05 |
| 15 | 1.21 × 10+05 | 1.23 × 10+05 | 1.18 × 10+05 | 1.25 × 10+05 | 1.17 × 10+05 |
| 16 | 1.20 × 10+05 | 1.28 × 10+05 | 1.19 × 10+05 | 1.23 × 10+05 | 1.17 × 10+05 |
| 17 | 1.23 × 10+05 | 1.31 × 10+05 | 1.46 × 10+05 | 1.46 × 10+05 | 1.07 × 10+05 |
| 18 | 1.16 × 10+05 | 1.32 × 10+05 | 1.22 × 10+05 | 1.25 × 10+05 | 1.10 × 10+05 |
| 19 | 1.25 × 10+05 | 1.38 × 10+05 | 1.30 × 10+05 | 1.28 × 10+05 | 1.10 × 10+05 |
| 20 | 1.29 × 10+05 | 1.32 × 10+05 | 1.33 × 10+05 | 1.28 × 10+05 | 1.27 × 10+05 |
| 21 | 1.32 × 10+05 | 1.34 × 10+05 | 1.49 × 10+05 | 1.29 × 10+05 | 1.03 × 10+05 |
| 22 | 1.35 × 10+05 | 1.38 × 10+05 | 1.36 × 10+05 | 1.27 × 10+05 | 1.06 × 10+05 |
| 23 | 1.34 × 10+05 | 1.37 × 10+05 | 1.30 × 10+05 | 1.11 × 10+05 | 1.04 × 10+05 |
| 24 | 1.25 × 10+05 | 1.30 × 10+05 | 1.19 × 10+05 | 1.29 × 10+05 | 1.12 × 10+05 |
|
|
|||||
| Voltage fluctuations | |||||
|
|
|||||
| 1 | 22.317 | 33.572 | 22.492 | 22.545 | 22.266 |
| 2 | 22.518 | 22.75 | 23.551 | 22.809 | 22.42 |
| 3 | 29.696 | 28.721 | 30.445 | 23.881 | 22.901 |
| 4 | 25.009 | 28.704 | 35.711 | 24.667 | 22.547 |
| 5 | 24.029 | 32.871 | 24.724 | 23.004 | 22.516 |
| 6 | 33.881 | 35.976 | 28.916 | 23.574 | 23.158 |
| 7 | 26.141 | 24.677 | 31.841 | 37.616 | 24.034 |
| 8 | 31.676 | 26.419 | 28.342 | 22.901 | 22.547 |
| 9 | 24.512 | 33.184 | 34.35 | 26.426 | 23.699 |
| 10 | 34.33 | 24.776 | 22.516 | 33.114 | 22.266 |
| 11 | 25.009 | 25.671 | 28.47 | 24.227 | 22.65 |
| 12 | 26.253 | 25.987 | 33.287 | 37.328 | 23.158 |
| 13 | 32.683 | 25.987 | 28.626 | 24.227 | 23.551 |
| 14 | 34.531 | 37.843 | 37.854 | 28.47 | 24.667 |
| 15 | 25.069 | 28.702 | 24.49 | 28.704 | 22.809 |
| 16 | 26.253 | 28.721 | 37.55 | 28.916 | 23.699 |
| 17 | 28.017 | 25.671 | 27.394 | 34.938 | 24.951 |
| 18 | 29.047 | 24.677 | 27.762 | 33.473 | 24.034 |
| 19 | 28.909 | 30.587 | 33.377 | 25.394 | 24.724 |
| 20 | 29.549 | 29.356 | 27.781 | 30.863 | 27.484 |
| 21 | 24.029 | 29.466 | 28.342 | 30.482 | 23.881 |
| 22 | 29.549 | 30.587 | 33.814 | 31.803 | 29.122 |
| 23 | 29.696 | 30.998 | 29.345 | 26.141 | 23.004 |
| 24 | 30.66 | 32.871 | 29.91 | 28.626 | 23.574 |
7 Conclusions
This paper has investigated the problem of demand-side management in microgrids by performing techno-economic optimization over the parameters of microgrids. A new enhanced heuristic algorithm named M-SOA has been developed for optimizing the parameters like PV capacity, wind turbine capacity, ESS capacity, PV bus location, wind turbine bus location, and ESS bus location of the microgrid. This was done for attaining the objectives of reducing the constraints like network power losses, voltage fluctuations, electricity supply costs, initial costs, operation costs, and fuel costs in the microgrid system. With the consideration of power loss analysis, the proposed model sudden variations in the power loss between 10 and 20 h and finally, get reduced the power loss. Through the experimental analysis, the developed M-SOA has secured a better performance rate in reducing the voltage fluctuations, power losses, and electricity supply costs of the microgrid system.
Acknowledgements
I would like to express my very great appreciation to the co-authors of this manuscript for their valuable and constructive suggestions during the planning and development of this research work.
-
Research ethics: Not Applicable.
-
Informed consent: Not Applicable.
-
Author contribution: All authors have made substantial contributions to conception and design, revising the manuscript, and the final approval of the version to be published. Also, all authors agreed to be accountable for all aspects of the work in ensuring that questions related to the accuracy or integrity of any part of the work are appropriately investigated and resolved.
-
Competing interest: The authors declare no conflict of interest.
-
Research funding: This research did not receive any specific funding.
-
Data availability: No new data were generated or analysed in support of this research.
References
Alhasawi, F. B., and J. V. Milanovic. 2012. “Techno-Economic Contribution of FACTS Devices to the Operation of Power Systems with High Level of Wind Power Integration.” IEEE Transactions on Power Systems 27 (3): 1414–21. https://doi.org/10.1109/tpwrs.2012.2186594.Search in Google Scholar
Abedini, M., M. H. Moradi, and S. M. Hosseinian. 2016. “Optimal Management of Microgrids Including Renewable Energy Sources Using GPSO-GM Algorithm.” Renewable Energy 90: 430–9. https://doi.org/10.1016/j.renene.2016.01.014.Search in Google Scholar
Atia, R., and N. Yamada. 2016. “Sizing and Analysis of Renewable Energy and Battery Systems in Residential Microgrids.” IEEE Transactions on Smart Grid 7 (3): 1204–13. https://doi.org/10.1109/tsg.2016.2519541.Search in Google Scholar
Amini, M. H., and M. P. Moghaddam. 2013. “Probabilistic Modelling of Electric Vehicles’ Parking Lots Charging Demand.” In Iranian Conference on Electrical Engineering (ICEE), 1–4.10.1109/IranianCEE.2013.6599716Search in Google Scholar
Bandyopadhyay, S., G. R. C. Mouli, Z. Qin, L. R. Elizondo, and P. Bauer. 2020. “Techno-Economical Model-Based Optimal Sizing of PV-Battery Systems for Microgrids.” IEEE Transactions on Sustainable Energy 11 (3): 1657–68. https://doi.org/10.1109/tste.2019.2936129.Search in Google Scholar
Bourhim, F.-A., S. Berrhazi, A. Ouammi, and R. Benchrifa. 2021. “Decision Support Model for Optimal Design of Wind Technologies Based Techno–Economic Approach.” IEEE Access 9: 148264–76. https://doi.org/10.1109/access.2021.3123561.Search in Google Scholar
Cai, G., and L. Kong. 2017. “Techno-economic Analysis of Wind Curtailment/hydrogen Production/fuel Cell Vehicle System with High Wind Penetration in China.” CSEE Journal of Power and Energy Systems 3 (1): 44–52. https://doi.org/10.17775/cseejpes.2017.0007.Search in Google Scholar
Delfino, F., G. Ferro, R. Minciardi, M. Robba, M. Rossi, and M. Rossi. 2019. “Identification and Optimal Control of an Electrical Storage System for Microgrids with Renewables.” Sustainable Energy, Grids and Networks 17: 100183. https://doi.org/10.1016/j.segan.2018.100183.Search in Google Scholar
Dey, B., S. Dutta, and F. P. G. Marquez. 2023a. “Intelligent Demand Side Management for Exhaustive Techno-Economic Analysis of Microgrid System.” Sustainability 15 (3): 1795. https://doi.org/10.3390/su15031795.Search in Google Scholar
Dey, B., S. Basak, and B. Bhattacharyya. 2023b. “Demand-Side-Management-Based Bi-level Intelligent Optimal Approach for Cost-Centric Energy Management of a Microgrid System.” Arabian Journal for Science and Engineering 48: 6819–30. https://doi.org/10.1007/s13369-022-07546-2.Search in Google Scholar
Domínguez-García, A., G. Heydt, and S. Suryanarayanan. 2011. Implications of the Smart Grid Initiative on Distribution Engineering (Final Project Report-Part2), 11–50. PSERC Doc.Search in Google Scholar
Erdogan, N., S. Kucuksari, and U. Cali. 2022. “Co-Simulation of Optimal EVSE and Techno-Economic System Design Models for Electrified Fleets.” IEEE Access 10: 18988–97. https://doi.org/10.1109/access.2022.3150359.Search in Google Scholar
Gao, S., H. Jia, and C. Marnay. 2019. “Techno-Economic Evaluation of Mixed AC and DC Power Distribution Network for Integrating Large-Scale Photovoltaic Power Generation.” IEEE Access 7: 105019–29. https://doi.org/10.1109/access.2019.2931985.Search in Google Scholar
Ganjeh, G. H., H. Niaei, A. Jafari, D. O. Aroko, M. Marzband, T. Fernando, M. Marzband, and T. Fernando. 2020. “A Novel Techno-Economic Multi-Level Optimization in Home-Microgrids with Coalition Formation Capability.” Sustainable Cities and Society 60: 102241, https://doi.org/10.1016/j.scs.2020.102241.Search in Google Scholar
Ishraque, Md. F., Sk. A. Shezan, M. M. Rashid, A. B. Bhadra, Md. Alamgir Hossain, and R. K. Chakrabortt. 2021. “Techno-Economic and Power System Optimization of a Renewable Rich Islanded Microgrid Considering Different Dispatch Strategies.” IEEE Access 9: 77325–40. https://doi.org/10.1109/access.2021.3082538.Search in Google Scholar
Jahid, A., M. S. Hossain, M. K. H. Monju, M. F. Rahman, and M. F. Hossain. 2020. “Techno-Economic and Energy Efficiency Analysis of Optimal Power Supply Solutions for Green Cellular Base Stations.” IEEE Access 8: 43776–95. https://doi.org/10.1109/access.2020.2973130.Search in Google Scholar
Jarraya, I., F. Masmoudi, M. H. Chabchoub, and H. Trabelsi. 2019. “An Online State of Charge Estimation for Lithium-Ion and Supercapacitor in Hybrid Electric Drive Vehicle.” Journal of Energy Storage 26: 100946. https://doi.org/10.1016/j.est.2019.100946.Search in Google Scholar
Kaur, A., S. Jain, and S. Goel. 2020. “Sandpiper Optimization Algorithm: A Novel Approach for Solving Real-Life Engineering Problems.” Applied Intelligence 50 (2): 582–619. https://doi.org/10.1007/s10489-019-01507-3., issue.Search in Google Scholar
Kolhe, M. 2009. “Techno-Economic Optimum Sizing of a Stand-Alone Solar Photovoltaic System.” IEEE Transactions on Energy Conversion 24 (2): 511–9. https://doi.org/10.1109/tec.2008.2001455.Search in Google Scholar
Lopez-Lorente, J., X. A. Liu, R. J. Best, G. Makrides, and D. J. Morrow. 2021. “Techno-Economic Assessment of Grid-Level Battery Energy Storage Supporting Distributed Photovoltaic Power.” IEEE Access 9: 146256–80. https://doi.org/10.1109/access.2021.3119436.Search in Google Scholar
Martínez Ceseña, E. A., E. Loukarakis, N. Good, and P. Mancarella. 2020. “Integrated Electricity– Heat–Gas Systems: Techno–Economic Modeling, Optimization, and Application to Multienergy Districts.” Proceedings of the IEEE 108 (9): 1392–410. https://doi.org/10.1109/jproc.2020.2989382.Search in Google Scholar
Mathiesen, P., M. Stadler, K. Jan, and Z. Pecenak. 2021. “Techno-economic Optimization of Islanded Microgrids Considering Intra-hour Variability.” Applied Energy 304: 117777, https://doi.org/10.1016/j.apenergy.2021.117777.Search in Google Scholar
Mbungu, N. T., A. A. Ismail, M. AlShabi, R. C. Bansal, and A. Elnady, A. K. Hamid. 2023. “Control and Estimation Techniques Applied to Smart Microgrids: A Review.” Renewable and Sustainable Energy Reviews 179: 113251. https://doi.org/10.1016/j.rser.2023.113251.Search in Google Scholar
Mozafara, M. R., M. Hadi Amini, and M. Hasan Moradi. 2018. “Innovative Appraisement of Smart Grid Operation Considering Large-Scale Integration of Electric Vehicles Enabling V2G and G2V Systems.” Electric Power Systems Research 154: 245–56. https://doi.org/10.1016/j.epsr.2017.08.024.Search in Google Scholar
Mohamed, A. A. R., R. J. Best, X. Liu, and D. J. Morrow. 2022. “A Comprehensive Robust Techno-Economic Analysis and Sizing Tool for the Small-Scale PV and BESS.” IEEE Transactions on Energy Conversion 37 (1): 560–72. https://doi.org/10.1109/tec.2021.3107103.Search in Google Scholar
Murty, V. V. V. S. N., and A. Kumar. 2020a. “Optimal Energy Management and Techno-Economic Analysis in Microgrid with Hybrid Renewable Energy Sources.” Journal of Modern Power Systems and Clean Energy 8 (5): 929–40. https://doi.org/10.35833/mpce.2020.000273.Search in Google Scholar
Murty, V. V. V. S. N., and A. Kumar. 2020b. “Optimal Energy Management and Techno-Economic Analysis in Microgrid with Hybrid Renewable Energy Sources.” Journal of Modern Power Systems and Clean Energy 8 (5): 929–40. https://doi.org/10.35833/mpce.2020.000273.Search in Google Scholar
Nagapurkar, P., and J. D. Smith. 2019. “Techno-Economic Optimization and Environmental Life Cycle Assessment (LCA) of Microgrids Located in the US Using Genetic Algorithm.” Energy Conversion and Management 181: 272–91. https://doi.org/10.1016/j.enconman.2018.11.072.Search in Google Scholar
Qazani, M. R. C., S. M. J. Jalali, H. Asadi, and S. Nahavandi. 2020. “Optimising Control and Prediction Horizons of a Model Predictive Control-Based Motion Cueing Algorithm Using Butterfly Optimization Algorithm.” IEEE Congress on Evolutionary Computation (CEC) 1–8.10.1109/CEC48606.2020.9185842Search in Google Scholar
Queen, H. J., J. J., D. T. J., K. V. S. Moses Babu, and S. P. Thota. 2021. “Machine Learning-Based Predictive Techno-Economic Analysis of Power System.” IEEE Access 9: 123504–16. https://doi.org/10.1109/access.2021.3110774.Search in Google Scholar
Rahbari, O., M. Vafaeipour, N. Omar, M. A. Rosen, O. Hegazy, J.-M. Timmermans, S. Heibati, and P. Van Den Bossche. 2017. “An Optimal Versatile Control Approach for Plug-In Electric Vehicles to Integrate Renewable Energy Sources and Smart Grids.” Energy 134: 1053–67. https://doi.org/10.1016/j.energy.2017.06.007.Search in Google Scholar
Rezaeimozafar, M., M. Eskandari, M. Hadi Amini, M. H. Moradi, and P. Siano. 2020. “A Bi-layer Multi-Objective Techno-Economical Optimization Model for Optimal Integration of Distributed Energy Resources into Smart/Micro Grids.” Energies 13 (1706): 1706, https://doi.org/10.3390/en13071706.Search in Google Scholar
Rodezno, D. A. Q., M. Vahid-Ghavidel, M. Sadegh Javadi, A. P. Feltrin, and J. Catalão. 2023. A Price-Based Strategy to Coordinate Electric Springs for Demand Side Management in Microgrids. In 2023 IEEE Power & Energy Society Innovative Smart Grid Technologies Conference (ISGT).Search in Google Scholar
Roe, C., A. P. Meliopoulos, J. Meisel and T. Overbye. 2008. “Power System Level Impacts of Plug-In Hybrid Electric Vehicles Using Simulation Data.” IEEE Energy 2030 Conference, 1–6.10.1109/ENERGY.2008.4781048Search in Google Scholar
Rizvi, M., B. Pratap, and S. B. Singh. 2023. “Demand-side Management in Microgrid Using Novel Hybrid Metaheuristic Algorithm.” Electrical Engineering 105: 1867–81. https://doi.org/10.1007/s00202-023-01778-7.Search in Google Scholar
Shaheen, A. M., and R. A. El-Sehiemy. 2021. “A MultiobjectiveSalp Optimization Algorithm for Techno-Economic-Based Performance Enhancement of Distribution Networks.” IEEE Systems Journal 15 (1): 1458–66. https://doi.org/10.1109/jsyst.2020.2964743.Search in Google Scholar
Shekari, T., S. Golshannavaz, and F. Aminifar. 2017. “Techno-Economic Collaboration of PEV Fleets in Energy Management of Microgrids.” IEEE Transactions on Power Systems 32 (5): 3833–41. https://doi.org/10.1109/tpwrs.2016.2644201.Search in Google Scholar
Singh, N. K., S. Gope, C. Koley, S. Dawn, and H. H. Alhelou. 2022. “Optimal Bidding Strategy for Social Welfare Maximization in Wind Farm Integrated Deregulated Power System Using Artificial Gorilla Troops Optimizer Algorithm.” IEEE Access 10: 71450–61. https://doi.org/10.1109/access.2022.3186519.Search in Google Scholar
Taheri, M. 2022. “Techno-economical Aspects of Electrocoagulation Optimization in Three Acid Azo Dyes’ Removal Comparison.” Cleaner Chemical Engineering 2: 100007, https://doi.org/10.1016/j.clce.2022.100007.Search in Google Scholar
Tsai, C.-T., E. M. Ocampo, T. M. Beza, and C.-C. Kuo. 2020. “Techno-Economic and Sizing Analysis of Battery Energy Storage System for Behind-The-Meter Application.” IEEE Access 8: 203734–46. https://doi.org/10.1109/access.2020.3036660.Search in Google Scholar
Venkatasubramanian, B. V., V. Jately, and B. Azzopardi. 2021. “Techno-Economic Framework for Optimal Capacity Expansion of Active Microgrid in the Mediterranean: A Case Study of MCAST.” IEEE Access 9: 120451–63. https://doi.org/10.1109/access.2021.3108959.Search in Google Scholar
Yu, Z.-X., M.-S. Li, Y.-P. Xu, S. Aslam, and Y.-K. Li. 2021. “Techno-Economic Planning and Operation of the Microgrid Considering Real-Time Pricing Demand Response Program.” Energies 14: 4597, https://doi.org/10.3390/en14154597.Search in Google Scholar
Zakariazadeh, A., S. Jadid, and P. Siano. 2014. “Smart Microgrid Energy and Reserve Scheduling with Demand Response Using Stochastic Optimization.” International Journal of Electrical Power & Energy Systems 63: 523–33. https://doi.org/10.1016/j.ijepes.2014.06.037.Search in Google Scholar
Zhai, Q., X. Xia, S. Feng, and M. Huang. 2020. “Optimization Design of LQR Controller Based on Improved Whale Optimization Algorithm.” International Conference on Information and Computer Technologies (ICICT), 380–4.10.1109/ICICT50521.2020.00067Search in Google Scholar
© 2024 the author(s), published by De Gruyter, Berlin/Boston
This work is licensed under the Creative Commons Attribution 4.0 International License.
Articles in the same Issue
- Solar photovoltaic-integrated energy storage system with a power electronic interface for operating a brushless DC drive-coupled agricultural load
- Analysis of 1-year energy data of a 5 kW and a 122 kW rooftop photovoltaic installation in Dhaka
- Reviews
- Real yields and PVSYST simulations: comparative analysis based on four photovoltaic installations at Ibn Tofail University
- A comprehensive approach of evolving electric vehicles (EVs) to attribute “green self-generation” – a review
- Exploring the piezoelectric porous polymers for energy harvesting: a review
- A strategic review: the role of commercially available tools for planning, modelling, optimization, and performance measurement of photovoltaic systems
- Comparative assessment of high gain boost converters for renewable energy sources and electrical vehicle applications
- A review of green hydrogen production based on solar energy; techniques and methods
- A review of green hydrogen production by renewable resources
- A review of hydrogen production from bio-energy, technologies and assessments
- A systematic review of recent developments in IoT-based demand side management for PV power generation
- Research Articles
- Hybrid optimization strategy for water cooling system: enhancement of photovoltaic panels performance
- Solar energy harvesting-based built-in backpack charger
- A power source for E-devices based on green energy
- Theoretical and experimental investigation of electricity generation through footstep tiles
- Experimental investigations on heat transfer enhancement in a double pipe heat exchanger using hybrid nanofluids
- Comparative energy and exergy analysis of a CPV/T system based on linear Fresnel reflectors
- Investigating the effect of green composite back sheet materials on solar panel output voltage harvesting for better sustainable energy performance
- Electrical and thermal modeling of battery cell grouping for analyzing battery pack efficiency and temperature
- Intelligent techno-economical optimization with demand side management in microgrid using improved sandpiper optimization algorithm
- Investigation of KAPTON–PDMS triboelectric nanogenerator considering the edge-effect capacitor
- Design of a novel hybrid soft computing model for passive components selection in multiple load Zeta converter topologies of solar PV energy system
- A novel mechatronic absorber of vibration energy in the chimney
- An IoT-based intelligent smart energy monitoring system for solar PV power generation
- Large-scale green hydrogen production using alkaline water electrolysis based on seasonal solar radiation
- Evaluation of performances in DI Diesel engine with different split injection timings
- Optimized power flow management based on Harris Hawks optimization for an islanded DC microgrid
- Experimental investigation of heat transfer characteristics for a shell and tube heat exchanger
- Fuzzy induced controller for optimal power quality improvement with PVA connected UPQC
- Impact of using a predictive neural network of multi-term zenith angle function on energy management of solar-harvesting sensor nodes
- An analytical study of wireless power transmission system with metamaterials
- Hydrogen energy horizon: balancing opportunities and challenges
- Development of renewable energy-based power system for the irrigation support: case studies
- Maximum power point tracking techniques using improved incremental conductance and particle swarm optimizer for solar power generation systems
- Experimental and numerical study on energy harvesting performance thermoelectric generator applied to a screw compressor
- Study on the effectiveness of a solar cell with a holographic concentrator
- Non-transient optimum design of nonlinear electromagnetic vibration-based energy harvester using homotopy perturbation method
- Industrial gas turbine performance prediction and improvement – a case study
- An electric-field high energy harvester from medium or high voltage power line with parallel line
- FPGA based telecommand system for balloon-borne scientific payloads
- Improved design of advanced controller for a step up converter used in photovoltaic system
- Techno-economic assessment of battery storage with photovoltaics for maximum self-consumption
- Analysis of 1-year energy data of a 5 kW and a 122 kW rooftop photovoltaic installation in Dhaka
- Shading impact on the electricity generated by a photovoltaic installation using “Solar Shadow-Mask”
- Investigations on the performance of bottle blade overshot water wheel in very low head resources for pico hydropower
- Solar photovoltaic-integrated energy storage system with a power electronic interface for operating a brushless DC drive-coupled agricultural load
- Numerical investigation of smart material-based structures for vibration energy-harvesting applications
- A system-level study of indoor light energy harvesting integrating commercially available power management circuitry
- Enhancing the wireless power transfer system performance and output voltage of electric scooters
- Harvesting energy from a soldier's gait using the piezoelectric effect
- Study of technical means for heat generation, its application, flow control, and conversion of other types of energy into thermal energy
- Theoretical analysis of piezoceramic ultrasonic energy harvester applicable in biomedical implanted devices
- Corrigendum
- Corrigendum to: A numerical investigation of optimum angles for solar energy receivers in the eastern part of Algeria
- Special Issue: Recent Trends in Renewable Energy Conversion and Storage Materials for Hybrid Transportation Systems
- Typical fault prediction method for wind turbines based on an improved stacked autoencoder network
- Power data integrity verification method based on chameleon authentication tree algorithm and missing tendency value
- Fault diagnosis of automobile drive based on a novel deep neural network
- Research on the development and intelligent application of power environmental protection platform based on big data
- Diffusion induced thermal effect and stress in layered Li(Ni0.6Mn0.2Co0.2)O2 cathode materials for button lithium-ion battery electrode plates
- Improving power plant technology to increase energy efficiency of autonomous consumers using geothermal sources
- Energy-saving analysis of desalination equipment based on a machine-learning sequence modeling