Effects of Ag contents on the microstructure and SERS performance of self-grown Ag nanoparticles/Mo–Ag alloy films
-
Xinxin Lian
 ,
David Hui
,
David Hui

Abstract
Ag nanoparticles/Mo–Ag alloy films with different Ag contents were prepared on polyimide by magnetron sputtering. The effects of Ag contents on the microstructure of self-grown Ag nanoparticles/Mo–Ag alloy films were investigated using XRD, FESEM, EDS and TEM. The Ag content plays an important role in the size and number of uniformly distributed Ag nanoparticles spontaneously formed on the Mo–Ag alloy film surface, and the morphology of the self-grown Ag nanoparticles has changed significantly. Additionally, it is worth noting that the Ag nanoparticles/Mo–Ag alloy films covered by a thin Ag film exhibits highly sensitive surface-enhanced Raman scattering (SERS) performance. The electric field distributions were calculated using finite-difference time-domain analysis to further prove that the SERS enhancement of the films is mainly determined by “hot spots” in the interparticle gap between Ag nanoparticles. The detection limit of the Ag film/Ag nanoparticles/Mo–Ag alloy film for Rhodamine 6G probe molecules was 5 × 10⁻¹⁴ mol/L. Therefore, the novel type of the Ag film/Ag nanoparticles/Mo–Ag alloy film can be used as an ideal SERS-active substrate for low-cost and large-scale production.
1 Introduction
Surface-enhanced Raman scattering (SERS) technique, a highly sensitive fingerprint identification tool [1], has shown enormous application potential in various fields such as biomedical science [2], environmental monitoring [3], food and drug safety [4,5,6], catalysis [7], etc. Due to the localized surface plasmonic resonance effect, SERS provides a large Raman signal enhancement for molecules close to the plasma nanostructures [8,9]. SERS technology has been proved as a promising method for the rapid and sensitive detection of chemicals and biochemicals [10,11,12]. At the same time, it is crucial to prepare high-performance SERS substrates in order to achieve an efficient SERS detection.
The size, morphology and the composition of various kinds of nanoparticles can be controlled by physical and chemical methods in order to prepare SERS substrates with excellent properties [13,14,15]. Metal colloids are the first type of commonly used SERS substrates, mainly because of its effortless preparation and large SERS signals enhancement [16]. However, avoiding the spontaneous aggregation of colloidal metal nanoparticles is still a challenging problem. Nowadays, this challenge can be solved using some novel techniques, including inkjet printing [17], oblique angle deposition [18], lithography [19], vacuum thermal evaporation [20] and self-assembly techniques [21]. Researchers generally use these technologies to uniformly distribute metal nanoparticles on specific support substrates. In comparison with the brittle silicon and glass SERS substrates, it is worth noting that the flexible SERS substrates are easy to cut and suitable for test objects with complex shape surface [22]. Therefore, it is urgent to develop a sensitive, uniform and low-cost flexible SERS substrate, which can promote the practical application of SERS substrate. The commercial tape with colloidal gold nanoparticles can be used as a novel flexible and adhesive SERS substrate to effectively extract objects from complex surfaces [23], which is expected to bring the SERS technology closer to real applications. The Au@Ag/PMM/qPCR-PET film chip was applied as a stable and high-performance SERS chip for highly sensitive sensing of thiabendazole residues in fruit juices [24]. The flexible SERS substrates can be integrated into portable Raman spectroscopes for point-of-care diagnostics [25], which are conceivable to penetrate global markets and have important economic value and social significance.
A uniform, stable, highly ordered and controllable nanoparticle film can be prepared by self-assembly method [26], which can improve the reproducibility and sensitivity of SERS detection. A previous study reported that the annealed Ag–Zr film deposited on polyimide (PI) can produce a new type of particle/film structure [27], which is significantly different from the traditional granular film [28,29,30,31]. Considering that the Ag nanoparticles spontaneously formed on the surface of the annealed Ag–Zr alloy films and the nanophase effects in copper alloys [27,32,33,34,35,36,37], we attempt to self-grown Ag nanoparticles with different morphologies on the surface of the deposited Mo–Ag alloy films by adjusting the Ag content at room temperature. If this purpose can be achieved, a new type of SERS substrate with excellent performance can be obtained by combining the Ag nanoparticles with high SERS sensitivity and the Mo–Ag alloy films with good repeatability at room temperature. The SERS enhancement was characterized using Rhodamine 6G (R6G) probe molecule on the Ag nanoparticle/Mo–Ag alloy film. The effects of Ag contents on the microstructure and SERS performance of the Ag nanoparticles/Mo–Ag alloy film were investigated.
2 Experiment
2.1 Fabrication of the Ag nanoparticles/Mo–Ag alloy film
Mo–Ag alloy films with different Ag contents were deposited on flexible PI using JCP-350M2 high-vacuum multitarget magnetron sputtering. The sputtering target composed of a 99.99 at% molybdenum (Mo) target (Ø 50 mm × 4 mm) overlaid with several 99.99 at% silver (Ag) plates (5 mm × 5 mm × 1 mm). The Ag contents in the Ag nanoparticles/Mo–Ag alloy films were determined by the number of Ag plates placed on Mo target.
The PI substrate was cleaned with acetone, deionized water and alcohol for 10 min, respectively, and the PI substrate was fixed on the substrate holder after drying. In order to reduce the influence of impurity gas in the chamber, the vacuum degree of the chamber is pumped to 5 × 10⁻⁴ Pa. The argon flow rate, sputtering power and sputtering pressure were adjusted to 40 sccm, 100 W and 0.4 Pa, respectively. The impurities on the target surface were removed by presputtering for 5 min and then sputtered for 10 min to prepare Mo–Ag alloy films. Unless otherwise mentioned, all experiments were carried out at room temperature.
2.2 Characterization of the Ag nanoparticles/Mo–Ag alloy film
X-ray diffractometer (Bruker-AXS D8 Advance) and transmission electron microscopy (TEM, JEM-2100) were used to characterize the phase structure and the crystal structure of the Ag nanoparticles/Mo–Ag alloy films. X-ray diffractometer uses a Cu target (λ = 0.1541 nm), and the voltage and current parameters are set at 40 kV and 40 mA, respectively. The scanning speed is 6°/min, the step size is 0.02° and the range of angle is 20°–90°. The high voltage of the TEM is 200 kV. The surface morphology and the composition of the Ag nanoparticles/Mo–Ag alloy films were observed and confirmed using a field emission scanning electron microscope (FESEM, JSM-7800F) with energy dispersive spectroscopy (EDS). The electric field distributions were calculated using finite-difference time-domain (FDTD) analysis. The number and average size of the nanoparticles on the surface of the Mo–Ag alloy films were measured by ImageJ software.
2.3 Preparation and measurement of SERS substrate
Figure 1 shows the schematic diagram of the Ag film/Ag nanoparticles/Mo–Ag alloy film formation and the detection process of SERS performance. The Mo–Ag alloy films were deposited on flexible PI substrate by DC magnetron sputtering (Figure 1-I). Considering that the Mo and Ag are immiscible at room temperature [38] and the initial Mo–Ag alloy film will be in a metastable state, the Mo–Ag alloy films form a stable structure through atoms diffusion along the surface and grain boundaries under the relaxation of residual stress and distortion energy [39]. As a result, a large amount of the Ag nanoparticles were self-formed on the surface of the Mo–Ag alloy film by adjusting the Ag content. Subsequently, a pure Ag target (99.99 %, Ø 50 mm × 4 mm) was used to further sputter a layer of Ag film on the surface of the Ag nanoparticles/Mo–Ag alloy films under the same sputtering parameters as the preparation of the Mo–Ag alloy film (Figure 1-II). The most common probe molecule, R6G, was selected to measure the performance of the SERS substrate [40]. The Ag film/Ag nanoparticles/Mo–Ag alloy films were tailored into 5 × 5 mm pieces (Figure 1-III) and soaked in different concentrations of R6G in aqueous solutions (20 mL) for 60 min (Figure 1-IV). After the droplet has been evaporated naturally, samples were characterized using the laser wavelength 532 nm Raman spectrometer (Invia, Renishaw, UK) with 50× objective lens (N.A. = 0.80) (Figure 1-V). The laser excitation energy and spot, respectively, were 5 mW and 2 µm, respectively. The diffraction grid was 1,200 g/mm. The Raman spectra were collected in the range of 200–2,000 cm−1 with the acquisition time of 1 s.
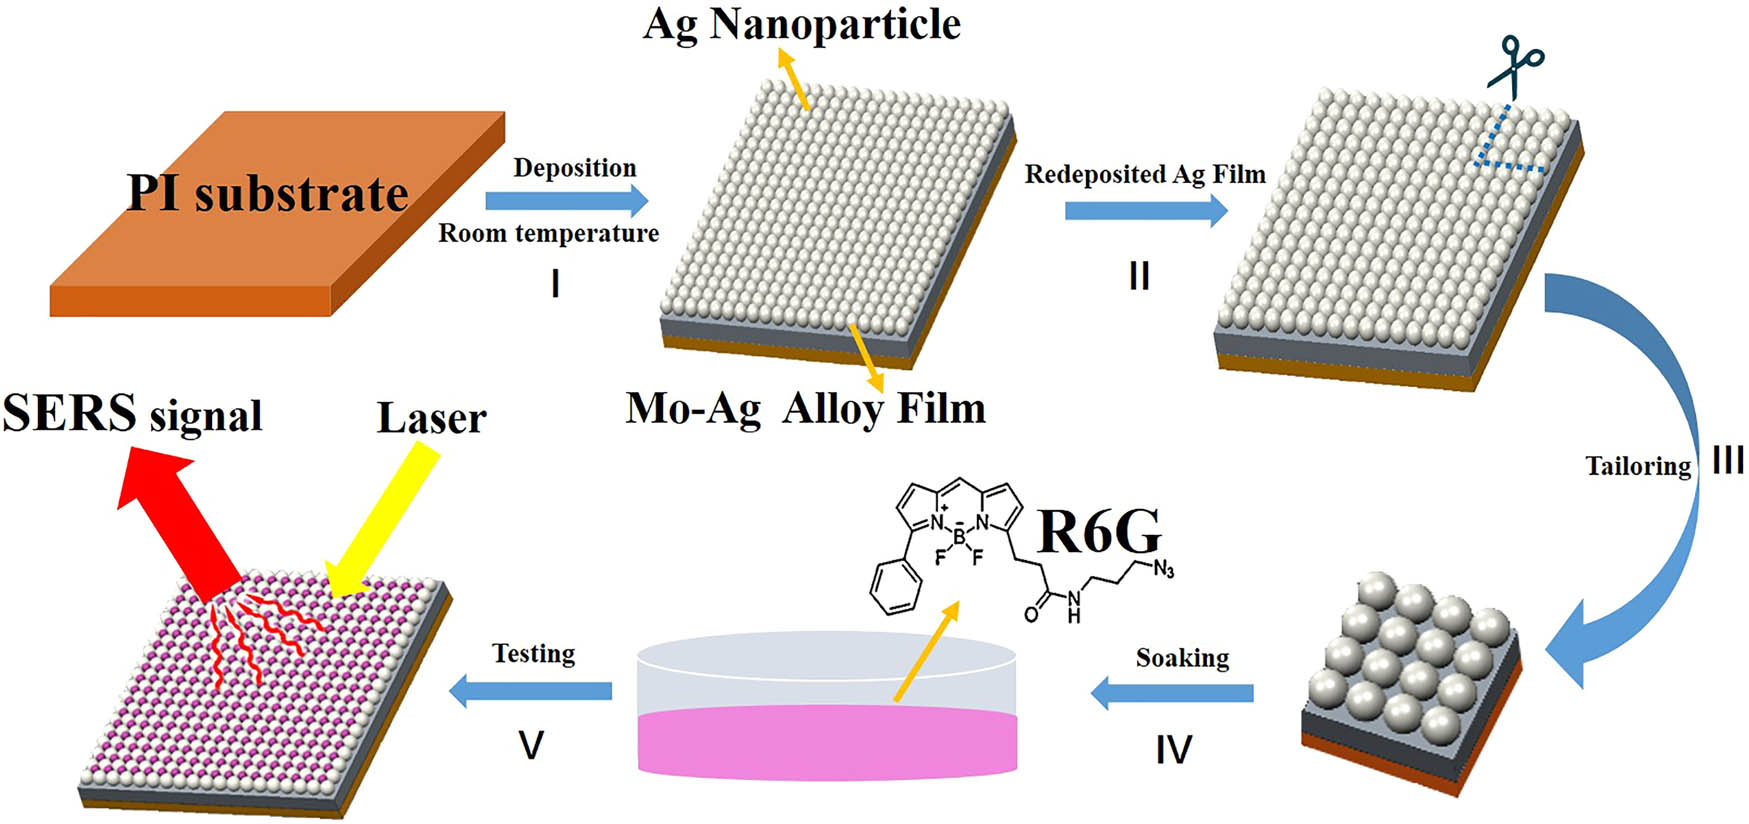
Schematic diagram of the Ag film/Ag nanoparticles/Mo–Ag alloy film formation and detection process of SERS performance: (I) the Mo–Ag alloy films were deposited on the flexible PI substrate at room temperature. (II) A layer of Ag film was further sputtered on the surface of the Ag nanoparticles/Mo–Ag alloy films. (III) The Ag film/Ag nanoparticles/Mo–Ag alloy film was tailored into 5 × 5 mm pieces. (IV) The Ag film/Ag nanoparticles/Mo–Ag alloy films were soaked in R6G solutions. (V) Using Raman spectrometer to test the SERS performance of the Ag film/Ag nanoparticles/Mo–Ag alloy films.
3 Results and discussions
3.1 Surface morphology of the Ag nanoparticles/Mo–Ag alloy films
Figure 2 shows the surface morphology of the pure Ag film, the pure Mo film and the Mo–Ag alloy films with different Ag contents. The surfaces of the Ag film and the Mo film are smooth without defects and cracks, as shown in Figure 2(a) and (b). However, a large amount of nanoparticles with different shapes are spontaneously formed on the surface of the Mo–Ag alloy films, as shown in Figure 2(c–f). This is different from the surface morphology of pure Ag film and pure Mo film. According to the EDS spectra in Figure 2(c1–f1), the Ag contents of the Mo–Ag alloy films in Figure 2(c–f) are 18.0, 25.5, 38.5 and 51.2 at%, respectively. The cross-sectional morphology of the Mo–Ag alloy films is shown in Figure 2(c2–f2), and the relative position relationship between the self-formed particles and the film is obviously different from the particles embedded in the traditional film [26]. As shown in Figure 2(c), some fine nanoparticles self-grow on the surface of the Mo-18.0 at% Ag film. Comparing with the Mo-18.0 at% Ag film, the number of nanoparticles on the surface of the Mo-25.5 at% Ag films has increased and distributed evenly as shown in Figure 2(d). More importantly, the morphology of the nanoparticle on the surface of the Mo-25.5 at% Ag film is irregular “worm-like,” which is different from the regular nanoparticles obtained on the surface of the annealed Ag–Zr alloy films [27]. The average nanoparticle size on the surface of the Mo-38.5 at% Ag film is increased by 43 nm compared with the nanoparticle size on the surface of the Mo-25.5 at% Ag film. However, the number of the nanoparticles on the Mo-38.5 at% Ag film is significantly lower than on the 25.5 at% film. Moreover, it is worth noting that some nanoparticles on the surface of the Mo-38.5 at% Ag film have changed from irregular “worm-like” to polyhedron as shown in Figure 2(e). This is significantly different from the morphological transformation from flower-shaped particles to polyhedral particles on the surface of the annealed Mo–Cu alloy film observed previously [41]. The driving force for the formation of the Ag nanoparticles decreases with the increase of Ag content, resulting in a decrease in the number and particle size of the Ag nanoparticles in the Mo-51.2 at% Ag film compared with the Mo-38.5 at% Ag film. Furthermore, the morphology of the nanoparticles on the surface of the Mo-51.2 at% Ag film has completely been changed into polyhedron as shown in Figure 2(f). The number and average size of the nanoparticles on the surface of the Mo–Ag alloy films were measured by ImageJ software, as shown in Figure 2(g) and (h). The nanoparticles were taken from the surface of the Mo-51.2 at% Ag films and proved to be single-crystal Ag nanoparticle by TEM characterization as shown in Figure 2(i) and (j), respectively. Based on the above analysis, the Ag atoms on and near the film surface can easily diffuse along the grain boundaries to the triple junctions and the vacancies to aggregate and nucleate continuously with the increase of the Ag content in the Mo–Ag alloy films. Meanwhile, the adjacent Ag nanoparticles may contact with each other and grow into one Ag nanoparticle on the surface of the Mo–Ag alloy film.
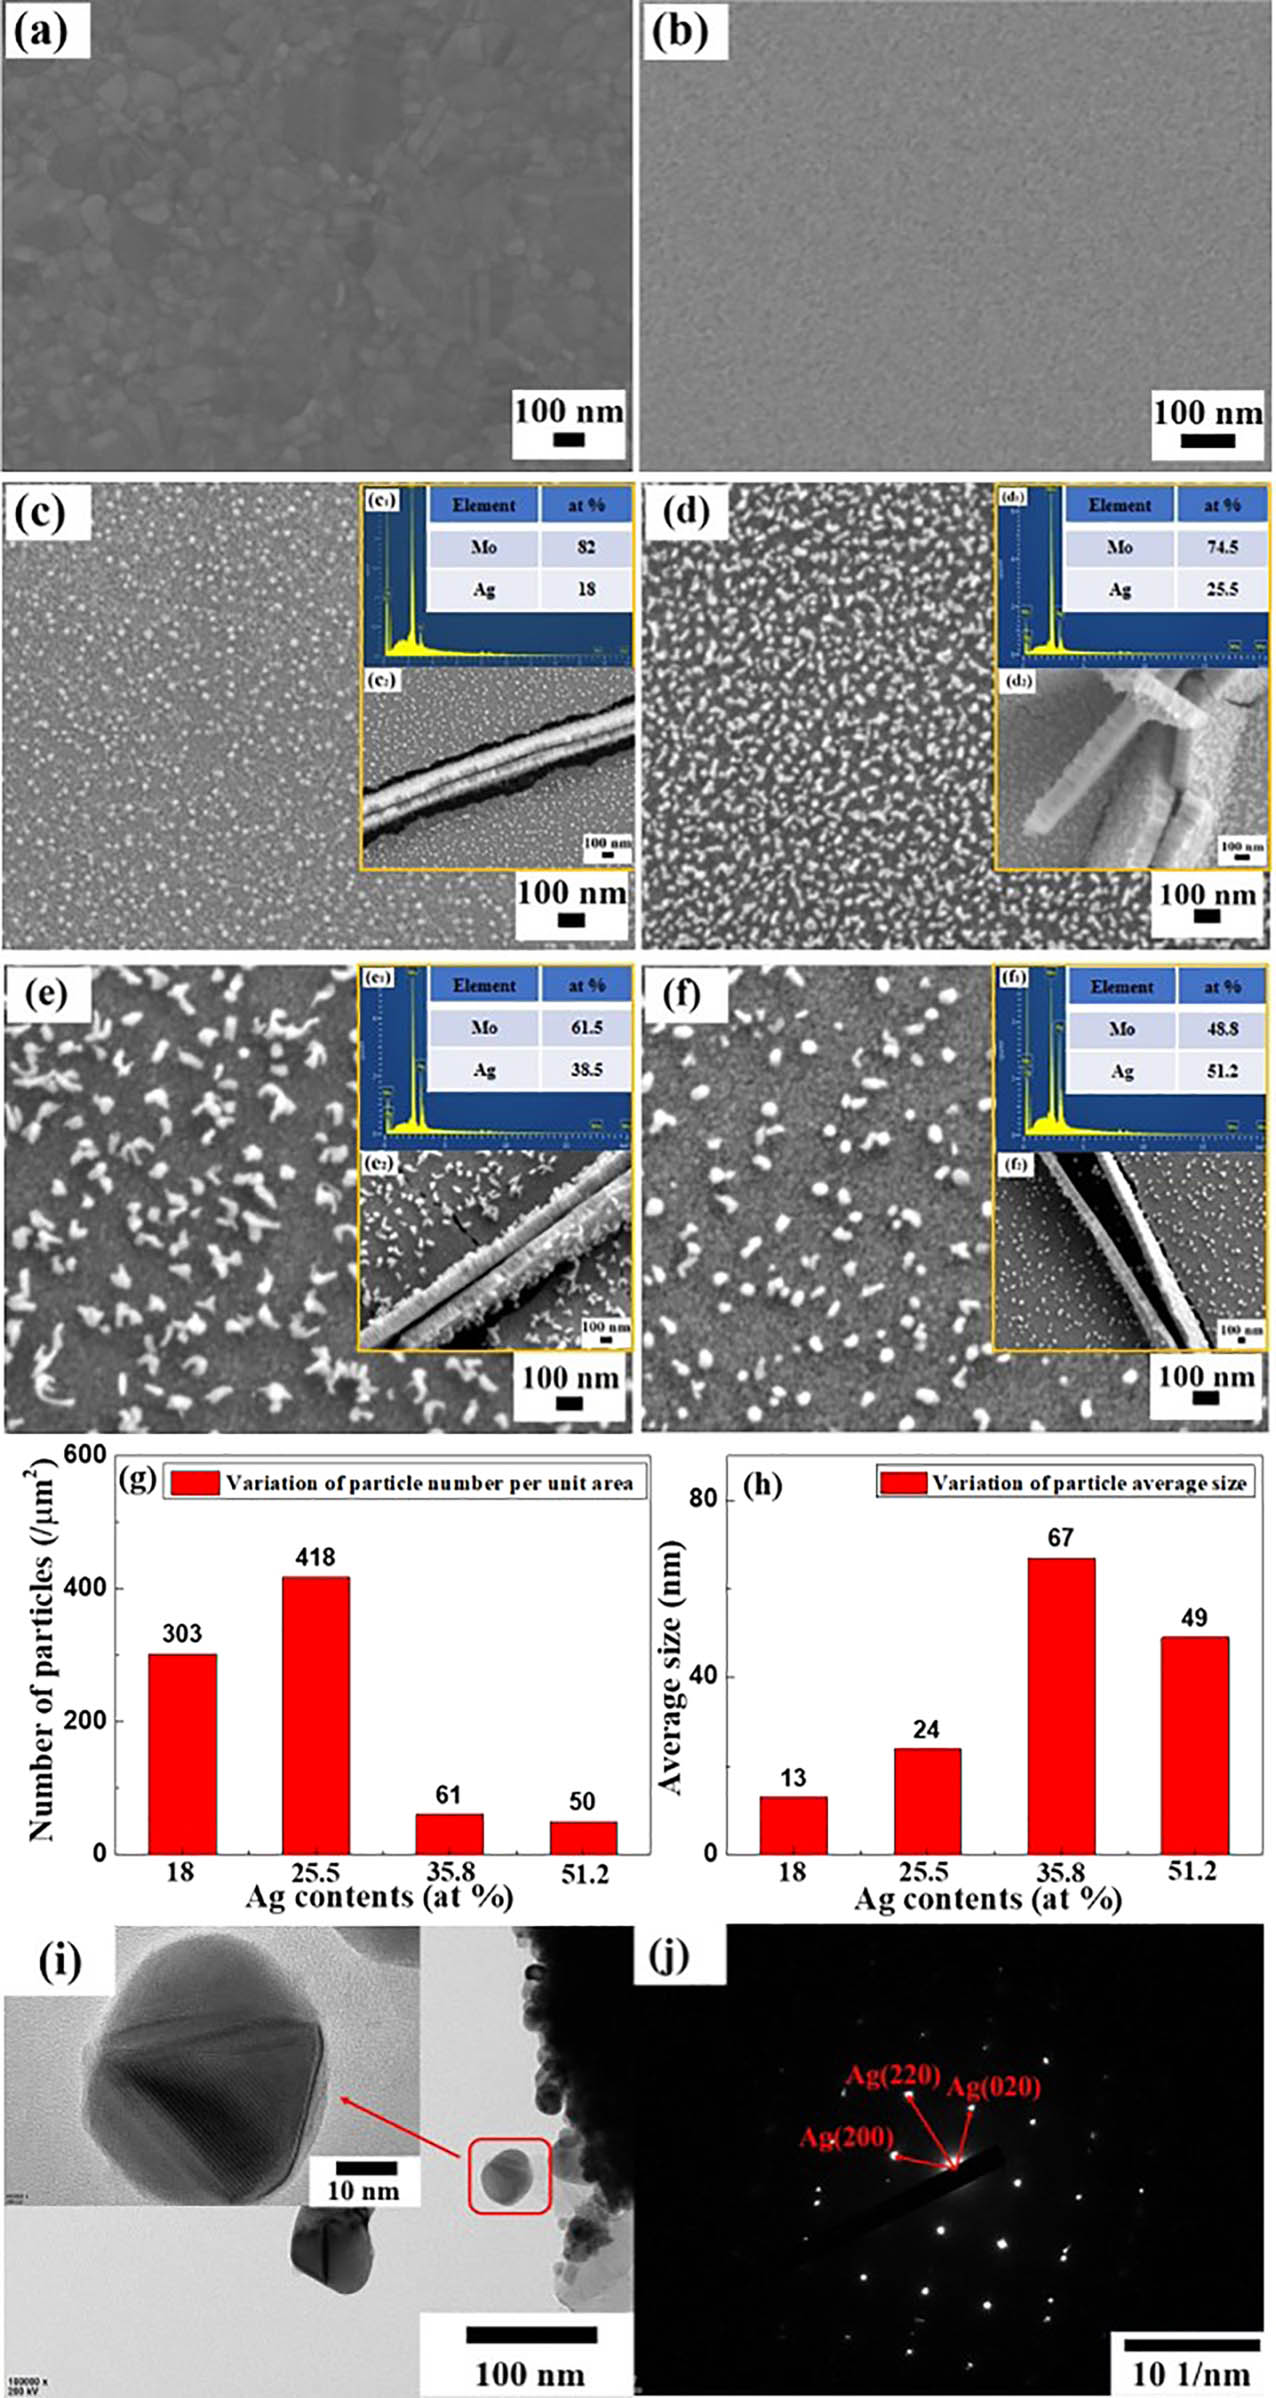
(a) Surface morphology of the Ag film. (b) Surface morphology of the Mo film. (c) SEM image, (c1) EDS spectrum and (c2) cross-sectional morphology of the Mo-18.0 at% Ag films. (d) SEM image, (d1) EDS spectrum and (d2) cross-sectional morphology of the Mo-25.5 at% Ag films. (e) SEM image, (e1) EDS spectrum and (e2) cross-sectional morphology of the Mo-38.5 at% Ag films. (f) SEM image, (f1) EDS spectrum and (f2) cross-sectional morphology of the Mo-51.2 at% Ag films. (g) Variation of the nanoparticle number per unit area on the film surface with Ag content. (h) Variation of the average particle size on the film surface with Ag content. (i) The TEM pattern of the nanoparticles/Mo–Ag alloy film and nanoparticle magnification. (j) The SAED pattern of the nanoparticle in (i).
3.2 XRD patterns of the Ag nanoparticles/Mo–Ag alloy films
Figure 3 shows the XRD patterns of the as-deposited Ag nanoparticles/Mo–Ag alloy film with different Ag contents. The diffraction peaks at 40.5° and 73.6° on the XRD pattern of the Mo-18.0 at% Ag films correspond to Mo(110) and Mo(211) (JCPDS No. 42-1120). Comparison with the Mo-18.0 at% Ag films, the intensity of the Mo(110) diffraction peaks of the Mo-25.5 at% Ag films and the Mo-38.5 at% Ag films decreased gradually, indicating that Ag grains have an inhibition effect on the growth of Mo grains. Furthermore, referring to Bragg formula (2d sin θ = kλ), the increase in the crystal surface spacing leads to the shift in the Mo(110) diffraction peak which moves toward smaller angle as the increase in Ag content in the Mo–Ag films. This can be attributed to the distortion energy caused by the residual tensile stress between the Mo and the Ag grains. The Mo(110) diffraction peaks on the XRD pattern of the Mo-51.2 at% Ag films almost disappeared, and the Ag(222) diffraction peaks’ intensity has increased. This also indicated that the Ag grains have an inhibitory effect on the growth of Mo grains. Meanwhile, the XRD patterns of the Mo-75 at% Ag films have a conspicuous peak at 38.1° corresponding to the (111) plane of Ag (JCPDS No. 04-0783). The Ag grains preferentially grow along (111) plane in the Mo-75 at% Ag films due to its low surface energy. The relatively weak diffraction peaks of the Ag nanoparticles/Mo–Ag alloy films can be ascribed to the very fine Mo and Ag grains in the alloy films.
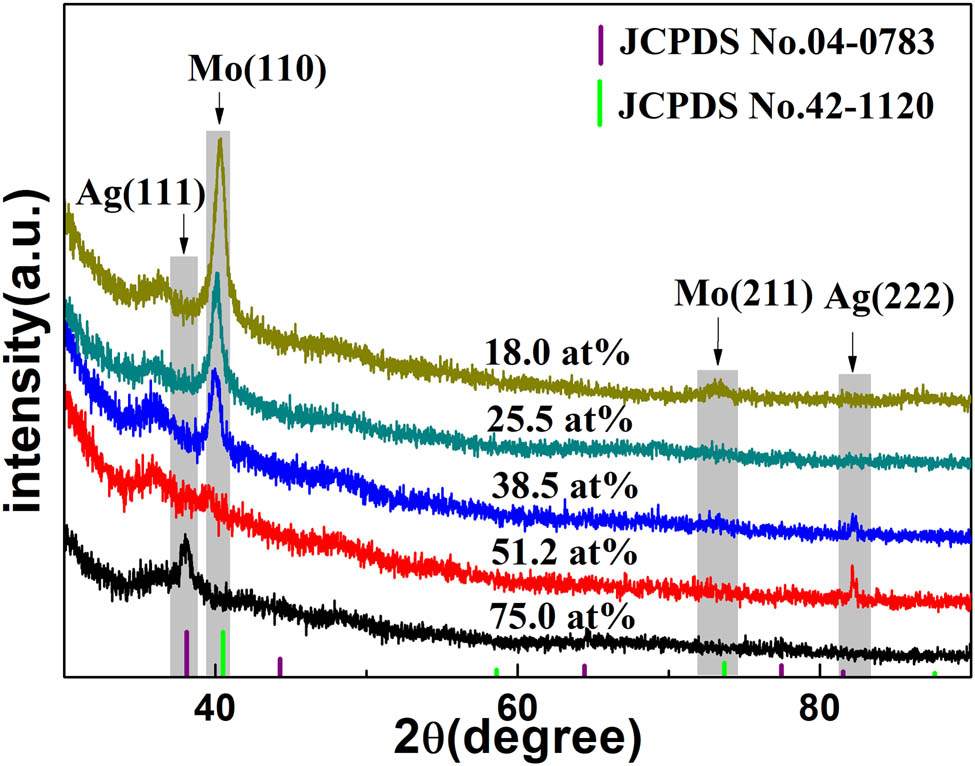
XRD patterns of the Ag nanoparticles/Mo–Ag alloy films with different Ag contents.
4 Ag nanoparticles/Mo–Ag alloy films as SERS substrate
The surface morphology and Raman spectra of the Ag nanoparticles/Mo–Ag alloy films are shown in Figure 4. Despite the large number of Ag nanoparticles formed on the surface of the Mo–Ag alloy films, the SERS performance of the Ag nanoparticles/Mo–Ag alloy film is still not efficient due to the small size of the Ag nanoparticles [42,43]. Therefore, a 23-nm Ag film was further sputtered on the surface of the Ag nanoparticles/Mo-25.5 at% Ag film, and its surface morphology is shown in Figure 4(a). The Ag nanoparticles/Mo-25.5 at% Ag film and the Ag film/Ag nanoparticles/Mo-25.5 at% Ag film were soaked in the 5 × 10⁻⁶ mol/L R6G solution for 60 min and tested after air-dried naturally to compare the Raman intensity. As shown in Figure 4(b), the SERS performance of the Ag nanoparticles/Mo-25.5 at% Ag film after sputtering of Ag film is significantly enhanced. In order to better understand the enhancement mechanism of the Ag film/Ag nanoparticles/Mo–Ag film as an efficient SERS substrate, we have calculated the electric field distributions of the Ag nanoparticles/Mo–Ag film and the Ag film/Ag nanoparticles/Mo–Ag film using FDTD analysis, as shown in Figure 4(c) and (d). It obviously shows that smaller gaps between adjacent nanoparticles on the surface of the Ag film/Ag nanoparticles/Mo–Ag alloy film can increase the amount of “hot spots” and improve the sensitivity of the SERS substrate [44]. Thence, a thin Ag film was further sputtered on the surface of the Ag nanoparticles/Mo–Ag alloy films with different Ag contents. The intensity of the Raman peaks increases and then decreases with the increase in the Ag content as shown in Figure 4(e). This is closely related to the number, size and shape of Ag particles. Moreover, the SERS performance of the Ag film/Ag nanoparticles/Mo-25.5 at% Ag film as SERS substrate is excellent. This can be ascribed to the small gaps between adjacent nanoparticles, the irregular nanoparticle shapes and the rough surface of the films. It is worth noting that the maximum number of particles on the surface of the Mo-25.5 at% Ag alloy film leads to the best SERS performance among Mo–Ag alloy films with different Ag content. This is consistent with the largest number of Ag particles on the annealed Ag–Zr alloy film surface leading to the strongest SERS enhancement [27]. The previous studies have also indicated that the particle shape of the annealed Mo–Cu alloy film surface is crucial for the SERS enhancement [41]. The Ag film/Ag nanoparticles/Mo-25.5 at% Ag films were tailored into 5 × 5 mm pieces and soaked in the R6G solutions of 5 × 10⁻⁶, 5 × 10⁻⁸, 5 × 10⁻¹⁰, 5 × 10⁻¹² and 5 × 10⁻¹⁴ mol/L, respectively. As can be seen from Figure 4(f) that the intensity of characteristic peaks of the SERS spectra decreased with the concentration of R6G solution decreases. As the concentration of R6G solution is 5 × 10⁻¹⁴ mol/L, weak characteristic peaks can be observed in the Raman spectra of the Mo-25.5 at% Ag films, which is enough to identify the existence of R6G probe molecules. Therefore, the number of particles per unit area and the particle average size on the surface of the Mo-25.5 at% Ag films are 418/µm2 and 24 nm, respectively, and it can be applied as highly effective SERS substrates for the detection of 10−14 mol/L R6G solution due to its abundant active “hot spots.” To some extent, a large number of high-density “hot spots” are generated due to the small gap between adjacent particles, resulting in the SERS enhancement with good uniformity and reproducibility [45].
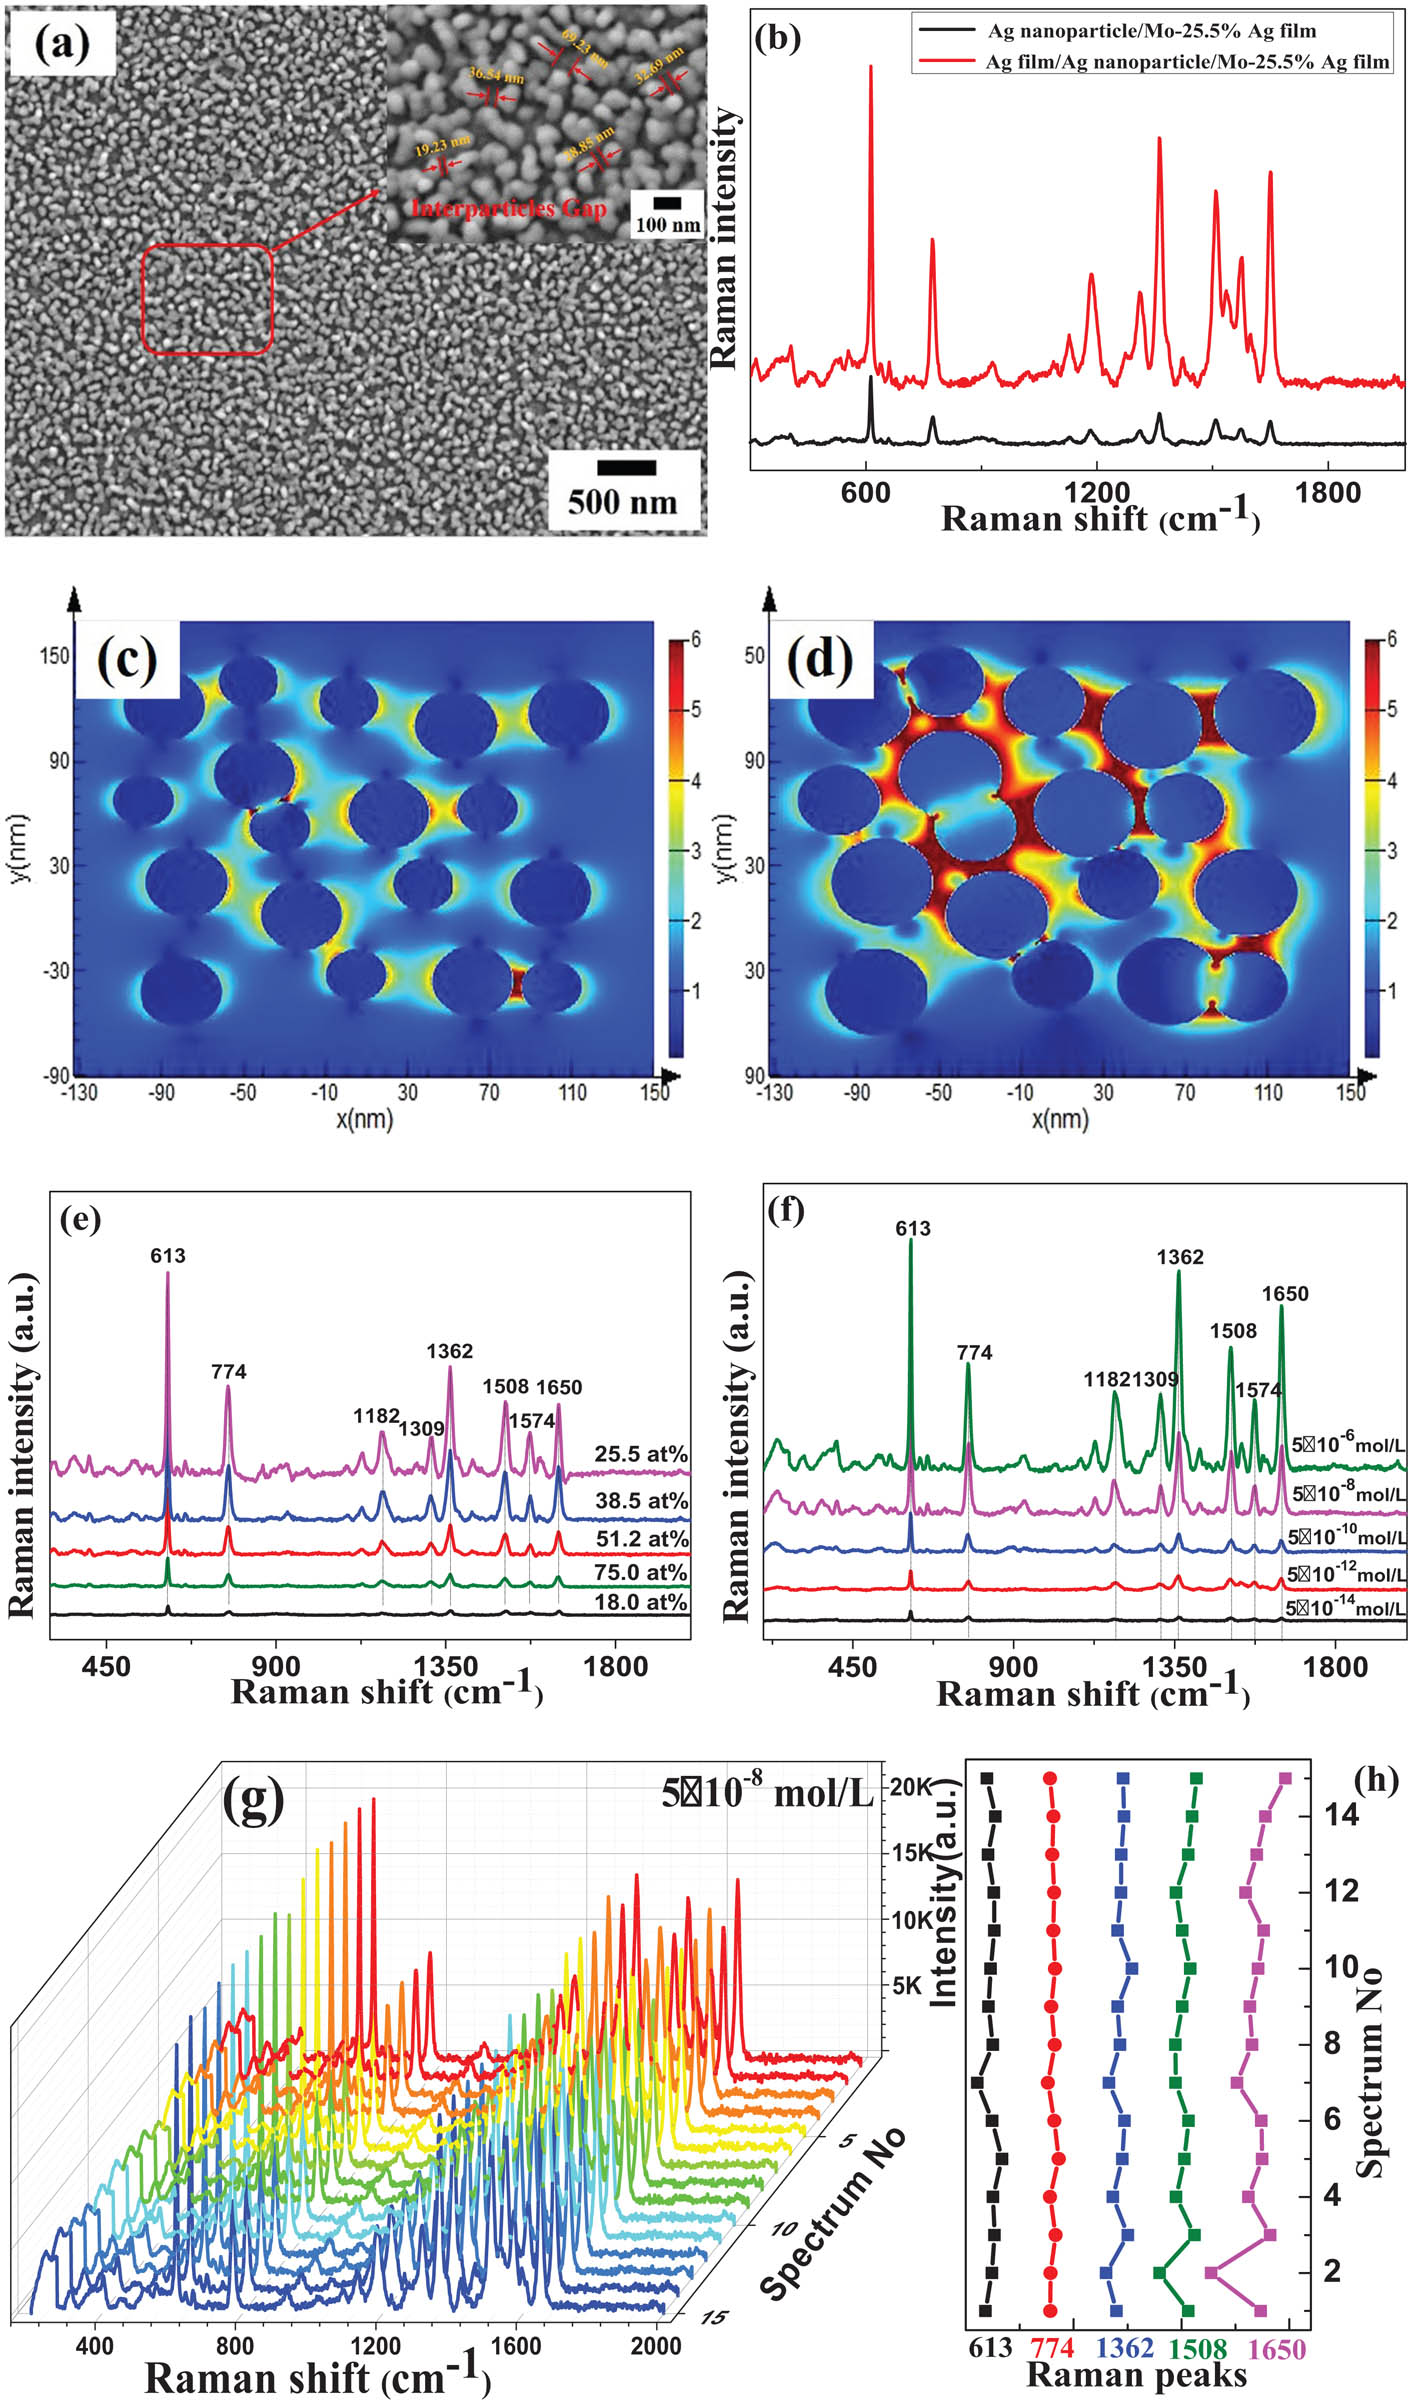
(a) Surface morphology of the Ag film/Ag nanoparticles/Mo-25.5 at% Ag films. (b) SERS spectra of the Ag nanoparticles/Mo-25.5 at% Ag films and Ag film/Ag nanoparticles/Mo-25.5 at% Ag films. (c) FDTD simulations of the EM field intensity of the Ag nanoparticles/Mo–Ag films and distribution of the Ag nanogaps structure. (d) FDTD simulations of the EM field intensity of the Ag film/Ag nanoparticles/Mo–Ag films and distribution of the Ag nanogaps structure. (e) SERS spectra of the Ag film/Ag nanoparticles/Mo–Ag alloy films with different Ag contents. (f) SERS spectra of the Ag film/Ag nanoparticles/Mo-25.5 at% Ag films with different concentrations of R6G solution. (g) SERS spectra of 15 randomly selected locations in the Ag film/Ag nanoparticles/Mo-25.5 at% Ag films. (h) Variation of the Raman spectra intensity at 613, 774, 1,362, 1,508 and 1,650 cm−1 peaks in (g), respectively.
To evaluate the enhancement factor (EF) of the Ag film/Ag nanoparticles/Mo-25.5 at% Ag alloy films as SERS substrate, the average EF of the characteristic peak of 613 cm−1 for the R6G solution on the SERS substrates was calculated according to the following formula:
where I SERS and I RS represent the peak intensity of the SERS signal and the normal Raman signal, respectively. N SERS and N RS are the numbers of R6G molecules in the SERS measurement and in the normal Raman measurement, respectively. Hence, the EF of the Ag film/Ag nanoparticles/Mo-25.5 at% Ag alloy films is estimated:
where N
A is Avogadro’s constant, A
laser is the area of laser spot,
For practical applications, an efficient SERS substrate should possess not only a large number of “hot spots” to ensure high sensitivity but also the uniform distribution of “hots pots” to achieve good signal reproducibility [46,47]. Therefore, as shown in Figure 4(g), the 15 randomly selected locations on the Ag film/Ag nanoparticles/Mo-25.5 at% Ag films immersed in the 5 × 10⁻⁸ mol/L R6G solution and naturally air-dried were measured to evaluate the uniformity and reproducibility of the SERS substrate. The strongest characteristic peaks of R6G are the 613 cm−1 peaks (C–C–C in-plane bending), the 774 cm−1 peaks (C–H out-plane bending), and the C–C stretching of 1,362, 1,508, and 1,650 cm−1 peaks [48]. The estimation results of the deviation of the Raman characteristic peaks of the Ag film/Ag nanoparticles/Mo-25.5 at% Ag films were shown in Figure 4(h), indicating that the films have good uniformity and reproducible SERS performance.
5 Conclusion
Mo–Ag alloy films with different Ag contents were fabricated on flexible PI substrate by DC magnetron sputtering. The addition of Ag can inhibit the growth of Mo grains in the Mo–Ag alloy films and can result in a large amount of Ag nanoparticles with different morphologies spontaneously formed on the surface of as-deposited Mo–Ag alloy films. Moreover, as the Ag content increases, the number of the Ag nanoparticles significantly increases first and then decreases, and the morphology of Ag nanoparticles has gradually evolved in the following way: spherical → “worm-like” → “worm-like” + polyhedral → polyhedral. Interestingly, the “worm-like” Ag nanoparticles/Mo-25.5 at% Ag films have abundant active “hot spots,” and further sputtering of the Ag film can be used as high-efficient SERS substrates. The detection limit of the Ag film/Ag nanoparticles/Mo-25.5 at% Ag film as SERS substrate for R6G probe molecule is 10−14 mol/L, and the EF is 2.69 × 10¹². Therefore, the Ag film/Ag nanoparticles/Mo-25.5 at% Ag film can be used as an efficient SERS substrate for low-cost and large-scale production.
Acknowledgments
This work was financially supported by the National Natural Science Foundation of China (Grant No. U12041869), the Chinese 02 Special Fund (Grant No. 2017ZX02408003) and the Chinese 1000 Plan for High Level Foreign Experts (Grant No. WQ20154100278).
-
Conflict of interest: The authors declare no conflict of interest regarding the publication of this paper.
References
[1] Langer J, Aberasturi DJd, Aizpurua J, Alvarez-Puebla RA, Auguie B, Baumberg JJ, et al. Present and future of surface enhanced Raman scattering. ACS Nano. 2020;14:28–117.10.1021/acsnano.9b04224Search in Google Scholar PubMed PubMed Central
[2] Jung GB, Bae YM, Lee YJ, Ryu SH, Park H-K. Nanoplasmonic Au nanodot arrays as an SERS substrate for biomedical applications. Appl Surf Sci. 2013;282:161–4.10.1016/j.apsusc.2013.05.093Search in Google Scholar
[3] An Q, Zhang P, Li JM, Ma WF, Guo J, Hu J, et al. Silver-coated magnetite–carbon core–shell microspheres as substrate-enhanced SERS probes for detection of trace persistent organic pollutants. Nanoscale. 2012;4:5210–6.10.1039/c2nr31061aSearch in Google Scholar PubMed
[4] Giovannozzi AM, Rolle F, Sega M, Abete MC, Marchis D, Rossi AM. Rapid and sensitive detection of melamine in milk with gold nanoparticles by surface enhanced Raman scattering. Food Chem. 2014;159:250–6.10.1016/j.foodchem.2014.03.013Search in Google Scholar PubMed
[5] Zhu YQ, Li MQ, Yu DY, Yang LB. A novel paper rag as ‘D-SERS’ substrate for detection of pesticide residues at various peels. Talanta. 2014;128:117–24.10.1016/j.talanta.2014.04.066Search in Google Scholar PubMed
[6] Naseer B, Srivastava G, Qadri OS, Faridi SA, Islam R, Younis K. Importance and health hazards of nanoparticles used in the food industry. Nanotechnol Rev. 2018;7(6):623–41.10.1515/ntrev-2018-0076Search in Google Scholar
[7] van Schrojenstein Lantman EM, Deckert-Gaudig T, Mank AJG, Deckert V, Weckhuysen BM. Catalytic processes monitored at the nanoscale with tip-enhanced Raman spectroscopy. Nat Nanotechnol. 2012;7(9):131.10.1038/nnano.2012.131Search in Google Scholar PubMed
[8] Gabudean AM, Biro D, Astilean S. Localized surface plasmon resonance (LSPR) and surface-enhanced Raman scattering (SERS) studies of 4-aminothiophenol adsorption on gold nanorods. J Mol Struct. 2011;993:420–4.10.1016/j.molstruc.2010.11.045Search in Google Scholar
[9] Wang Z, Cai K, Lu Y, Wu HN, Li Y, Zhou QG. Insight into the working wavelength of hotspot effects generated by popular nanostructures. Nanotechnol Rev. 2019;8:24–34.10.1515/ntrev-2019-0003Search in Google Scholar
[10] Sailor MJ, Park JH. Hybrid nanoparticles for detection and treatment of cancer. Adv Mater. 2012.10.1002/adma.201200653Search in Google Scholar PubMed PubMed Central
[11] Graham D, Goodacre R. Chemical and bioanalytical applications of surface enhanced Raman scattering spectroscopy. Chem Soc Rev. 2008;37:883–4.10.1039/b804297gSearch in Google Scholar PubMed
[12] Zhang XG, Zhang XL, Luo CL, Liu ZQ, Chen YY, Dong SL, et al. Volume-enhanced Raman scattering detection of viruses. Small. 2019;1805516.10.1002/smll.201805516Search in Google Scholar PubMed
[13] Cheng ZQ, Li ZW, Xu JH, Yao R, Li ZL, Liang S, et al. Morphology-controlled fabrication of large-scale dendritic silver nanostructures for catalysis and SERS applications. Nanoscale Res Lett. 2019;14:89.10.1186/s11671-019-2923-0Search in Google Scholar PubMed PubMed Central
[14] Kolataj K, Krajczewski J, Kudelski A. Silver nanoparticles with many sharp apexes and edges as efficient nanoresonators for shell-isolated nanoparticle-enhanced Raman spectroscopy. J Phys Chem C. 2017;121:12383–91.10.1021/acs.jpcc.7b02695Search in Google Scholar
[15] He RX, Liang R, Peng P, Zhou YN. Effect of the size of silver nanoparticles on SERS signal enhancement. J Nanopart Res. 2017;19:267.10.1007/s11051-017-3953-0Search in Google Scholar
[16] Lee CH, Hankus ME, Tian LM, Pellegrino PM, Singamaneni S. Highly sensitive surface enhanced Raman scattering substrates based on filter paper loaded with plasmonic nanostructures. Anal Chem. 2011;83:8953–8.10.1021/ac2016882Search in Google Scholar PubMed
[17] Eshkeiti A, Narakathu BB, Reddy ASG, Moorthi A, Atashbar MZ, Rebrosova E, et al. Detection of heavy metal compounds using a novel inkjet printed surface enhanced Raman spectroscopy (SERS) substrate. Sens Actuators B. 2012;171–2:705–11.10.1016/j.snb.2012.05.060Search in Google Scholar
[18] Singh JP, Chu HY, Abell J, Tripp RA, Zhao YP. Flexible and mechanical strain resistant large area SERS active substrates. Nanoscale. 2012;4:3410–4.10.1039/c2nr00020bSearch in Google Scholar PubMed
[19] Aksu S, Huang M, Artar A, Yanik AA, Selvarasah S, Dokmeci MR, et al. Flexible plasmonics on unconventional and nonplanar substrates. Adv Mater. 2011;23:4422–30.10.1002/adma.201102430Search in Google Scholar PubMed
[20] Xu WG, Ling X, Xiao JQ, Dresselhaus MS, Kong J, Xu HX, et al. Surface enhanced Raman spectroscopy on a flat graphene surface. Proc Natl Acad Sci U S A. 2012;109:9281–6.10.1073/pnas.1205478109Search in Google Scholar PubMed PubMed Central
[21] Chen HJ, Wang YL, Dong SJ, Wang E. An approach for fabricating self-assembled monolayer of Ag nanoparticles on gold as the SERS-active substrate. Spectrochim Acta Part A. 2006;64:343–8.10.1016/j.saa.2005.07.058Search in Google Scholar PubMed
[22] Polavarapu L, Liz-Marzan LM. Towards low-cost flexible substrates for nanoplasmonic sensing. Phys Chem Chem Phys. 2013;15:5288–300.10.1039/c2cp43642fSearch in Google Scholar PubMed
[23] Chen JM, Huang YJ, Kannan P, Zhang L, Lin ZY, Zhang JW, et al. Flexible and adhesive surface enhance Raman scattering active tape for rapid detection of pesticide residues in fruits and vegetables. Anal Chem. 2016;88:2149–55.10.1021/acs.analchem.5b03735Search in Google Scholar PubMed
[24] Wang KQ, Sun DW, Pu HB, Wei QY, Huang LJ. A stable, flexible and high performance SERS chip enabled by a ternary film-packaged plasmonic nanoparticle array. ACS Appl Mater Interfaces. 2019;11(32):29177–86.10.1021/acsami.9b09746Search in Google Scholar PubMed
[25] Xu KC, Zhou R, Takei K, Hong MH. Toward flexible surface-enhanced Raman scattering (SERS) sensors for point-of-care diagnostics. Adv Sci. 2019;1900925.10.1002/advs.201900925Search in Google Scholar PubMed PubMed Central
[26] Lian XX, Sun HL, Lv YJ, Wang GX. Room temperature self-assembled Ag nanoparticles/Mo-37.5% Ag film as efficient flexible SERS substrate. Mater Lett. 2020;275:128164.10.1016/j.matlet.2020.128164Search in Google Scholar
[27] Huang XX, Sun HL, Wang GX, Stock HR. Self-formation of Ag particles/Ag-Zr alloy films on flexible polyimide as SERS substrates. Appl Surf Sci. 2019;487:1341–57.10.1016/j.apsusc.2019.05.181Search in Google Scholar
[28] Zada N, Khan I, Shah T, Gul T, Khan N, Saeed K. Ag-Co oxides nanoparticles supported on carbon nanotubes as an effective catalyst for the photodegradation of Congo red dye in aqueous medium. Inorg Nano-Met Chem. 2020;50.10.1080/24701556.2020.1713159Search in Google Scholar
[29] Zhang XH, Zhang Y, Tian BH, Song KX, Liu P, Jia YL, et al. Review of nano-phase effects in high strength and conductivity copper alloys. Nanotechnol Rev. 2019;8:383–95.10.1515/ntrev-2019-0034Search in Google Scholar
[30] Feng J, Song KX, Liang SH, Guo XH, Jiang YH. Electrical wear of TiB2 particle-reinforced Cu and Cu–Cr composites prepared by vacuum arc melting. Vacuum. 2020;175:109295.10.1016/j.vacuum.2020.109295Search in Google Scholar
[31] Li SL, Guo XH, Zhang SL, Feng J, Song KX, Liang SH. Arc erosion behavior of TiB2/Cu composites with single-scale and dual-scale TiB2 particles. Nanotechnol Rev. 2019;8(1):619–27.10.1515/ntrev-2019-0054Search in Google Scholar
[32] Zhang XH, Zhang Y, Tian BH, Jia YL, Liu Y, Song KX, et al. Cr effects on the electrical contact properties of the Al2O3-Cu/15W composites. Nanotechnol Rev. 2019;8:128–35.10.1515/ntrev-2019-0012Search in Google Scholar
[33] Feng J, Liang SH, Guo XH, Zhang Y, Song KX. Electrical conductivity anisotropy of copper matrix composites reinforced with SiC whiskers. Nanotechnol Rev. 2019;8:285–92.10.1515/ntrev-2019-0027Search in Google Scholar
[34] Zhang XH, Zhang Y, Tian BH, Jia YL, Liu Y, Song KX, et al. Thermal deformation behavior of the Al2O3-Cu/(W, Cr) electrical contacts. Vacuum. 2019;164(6):361–6.10.1016/j.vacuum.2019.03.054Search in Google Scholar
[35] Long F, Guo XH, Song KX, Jia SG. Enhanced arc erosion resistance of TiB2/Cu composites reinforced with the carbon nanotube network structure. Mater Des. 2019;108136.10.1016/j.matdes.2019.108136Search in Google Scholar
[36] Zhang XH, Zhang Y, Tian BH, An JC, Zhao Z, Volinsky AA, et al. Arc erosion behavior of the Al2O3-Cu/(W, Cr) electrical contacts. Composites Part B. 2019;160(3):110–8.10.1016/j.compositesb.2018.10.040Search in Google Scholar
[37] Zhang XH, Zhang Y, Tian BH, Jia YL, Fu M, Liu Y. Graphene oxide effects on the properties of Al2O3-Cu/35W5Cr composite. J Mater Sci Technol. 2020;37(1):185–99.10.1016/j.jmst.2019.08.014Search in Google Scholar
[38] Sarakinos K, Greczynski G, Elofsson V, Magnfalt D, Hogberg H, Alling B. Theoretical and experimental study of metastable solid solutions and phase stability within the immiscible Ag-Mo binary system. J Appl Phys. 2016;119:095303.10.1063/1.4942840Search in Google Scholar
[39] Ossai CI, Raghavan N. Nanostructure and nanomaterial characterization, growth mechanisms, and applications. Nanotechnol Rev. 2018;7(2):209–31.10.1515/ntrev-2017-0156Search in Google Scholar
[40] Gao T, Wang YQ, Wang K, Zhang XL, Dui JN, Li GM, et al. Controlled synthesis of homogeneous Ag nanosheet-assembled film for effective SERS substrate. ACS Appl Mater Interfaces. 2013;5:7308–14.10.1021/am401552xSearch in Google Scholar PubMed
[41] Sun HL, Huang XX, He MJ, Lian XX, Wang GX. Preparation and controllability of Cu particles on annealed Mo-Cu alloy films. Mater Lett. 2019.10.1016/j.matlet.2019.07.044Search in Google Scholar
[42] Quan JM, Zhu Y, Zhang J, Li JY, Wang N. High-performance surface-enhanced Raman scattering substrate prepared by self-assembling of silver nanoparticles into the nanogaps of silver nanoislands. Appl Opt. 2017;56:5751–60.10.1364/AO.56.005751Search in Google Scholar PubMed
[43] Kalwar K, Shen M. Electrospun cellulose acetate nanofibers and Au@AgNPs for antimicrobial activity – a mini review. Nanotechnol Rev. 2019;8:246–57.10.1515/ntrev-2019-0023Search in Google Scholar
[44] Tang J, Guo H, Zhao MM, Liu WY, Chou XJ, Zhang BZ, et al. Ag nanoparticles cladded with parylene for high-stability microfluidic surface-enhanced Raman scattering (SERS) biochemical sensing. Sens Actuators B. 2017.10.1016/j.snb.2016.09.125Search in Google Scholar
[45] Zhang KB, Zeng TX, Tan XL, Wu WD, Tang YJ, Zhang HB. A facile surface-enhanced Raman scattering (SERS) detection of rhodamine 6G and crystal violet using Au nanoparticle substrates. Appl Surf Sci. 2015;347:569–73.10.1016/j.apsusc.2015.04.152Search in Google Scholar
[46] Li XX, Lin X, Liu BK, Zhao XL, Zhao HY, Wang L, et al. Citrate-assisted galvanic replacement for fabrication of homogeneous Ag nanosheets as high performance SERS substrate. Appl Phys A. 2019;125:492.10.1007/s00339-019-2786-3Search in Google Scholar
[47] Zhang R, Xu BB, Liu XQ, Zhang YL, Xu Y, Chen QD, et al. Highly efficient SERS test strips. Chem Commun. 2012;48:5913–5.10.1039/c2cc31604hSearch in Google Scholar PubMed
[48] Wang YQ, Ma S, Yang QQ, Li XJ. Size-dependent SERS detection of R6G by silver nanoparticles immersion-plated on silicon nanoporous pillar array. Appl Surf Sci. 2012;258:5881–5.10.1016/j.apsusc.2012.02.129Search in Google Scholar
© 2020 Xinxin Lian et al., published by De Gruyter
This work is licensed under the Creative Commons Attribution 4.0 International License.
Articles in the same Issue
- Research Articles
- Generalized locally-exact homogenization theory for evaluation of electric conductivity and resistance of multiphase materials
- Enhancing ultra-early strength of sulphoaluminate cement-based materials by incorporating graphene oxide
- Characterization of mechanical properties of epoxy/nanohybrid composites by nanoindentation
- Graphene and CNT impact on heat transfer response of nanocomposite cylinders
- A facile and simple approach to synthesis and characterization of methacrylated graphene oxide nanostructured polyaniline nanocomposites
- Ultrasmall Fe3O4 nanoparticles induce S-phase arrest and inhibit cancer cells proliferation
- Effect of aging on properties and nanoscale precipitates of Cu-Ag-Cr alloy
- Effect of nano-strengthening on the properties and microstructure of recycled concrete
- Stabilizing effect of methylcellulose on the dispersion of multi-walled carbon nanotubes in cementitious composites
- Preparation and electromagnetic properties characterization of reduced graphene oxide/strontium hexaferrite nanocomposites
- Interfacial characteristics of a carbon nanotube-polyimide nanocomposite by molecular dynamics simulation
- Preparation and properties of 3D interconnected CNTs/Cu composites
- On factors affecting surface free energy of carbon black for reinforcing rubber
- Nano-silica modified phenolic resin film: manufacturing and properties
- Experimental study on photocatalytic degradation efficiency of mixed crystal nano-TiO2 concrete
- Halloysite nanotubes in polymer science: purification, characterization, modification and applications
- Cellulose hydrogel skeleton by extrusion 3D printing of solution
- Crack closure and flexural tensile capacity with SMA fibers randomly embedded on tensile side of mortar beams
- An experimental study on one-step and two-step foaming of natural rubber/silica nanocomposites
- Utilization of red mud for producing a high strength binder by composition optimization and nano strengthening
- One-pot synthesis of nano titanium dioxide in supercritical water
- Printability of photo-sensitive nanocomposites using two-photon polymerization
- In situ synthesis of expanded graphite embedded with amorphous carbon-coated aluminum particles as anode materials for lithium-ion batteries
- Effect of nano and micro conductive materials on conductive properties of carbon fiber reinforced concrete
- Tribological performance of nano-diamond composites-dispersed lubricants on commercial cylinder liner mating with CrN piston ring
- Supramolecular ionic polymer/carbon nanotube composite hydrogels with enhanced electromechanical performance
- Genetic mechanisms of deep-water massive sandstones in continental lake basins and their significance in micro–nano reservoir storage systems: A case study of the Yanchang formation in the Ordos Basin
- Effects of nanoparticles on engineering performance of cementitious composites reinforced with PVA fibers
- Band gap manipulation of viscoelastic functionally graded phononic crystal
- Pyrolysis kinetics and mechanical properties of poly(lactic acid)/bamboo particle biocomposites: Effect of particle size distribution
- Manipulating conductive network formation via 3D T-ZnO: A facile approach for a CNT-reinforced nanocomposite
- Microstructure and mechanical properties of WC–Ni multiphase ceramic materials with NiCl2·6H2O as a binder
- Effect of ball milling process on the photocatalytic performance of CdS/TiO2 composite
- Berberine/Ag nanoparticle embedded biomimetic calcium phosphate scaffolds for enhancing antibacterial function
- Effect of annealing heat treatment on microstructure and mechanical properties of nonequiatomic CoCrFeNiMo medium-entropy alloys prepared by hot isostatic pressing
- Corrosion behaviour of multilayer CrN coatings deposited by hybrid HIPIMS after oxidation treatment
- Surface hydrophobicity and oleophilicity of hierarchical metal structures fabricated using ink-based selective laser melting of micro/nanoparticles
- Research on bond–slip performance between pultruded glass fiber-reinforced polymer tube and nano-CaCO3 concrete
- Antibacterial polymer nanofiber-coated and high elastin protein-expressing BMSCs incorporated polypropylene mesh for accelerating healing of female pelvic floor dysfunction
- Effects of Ag contents on the microstructure and SERS performance of self-grown Ag nanoparticles/Mo–Ag alloy films
- A highly sensitive biosensor based on methacrylated graphene oxide-grafted polyaniline for ascorbic acid determination
- Arrangement structure of carbon nanofiber with excellent spectral radiation characteristics
- Effect of different particle sizes of nano-SiO2 on the properties and microstructure of cement paste
- Superior Fe x N electrocatalyst derived from 1,1′-diacetylferrocene for oxygen reduction reaction in alkaline and acidic media
- Facile growth of aluminum oxide thin film by chemical liquid deposition and its application in devices
- Liquid crystallinity and thermal properties of polyhedral oligomeric silsesquioxane/side-chain azobenzene hybrid copolymer
- Laboratory experiment on the nano-TiO2 photocatalytic degradation effect of road surface oil pollution
- Binary carbon-based additives in LiFePO4 cathode with favorable lithium storage
- Conversion of sub-µm calcium carbonate (calcite) particles to hollow hydroxyapatite agglomerates in K2HPO4 solutions
- Exact solutions of bending deflection for single-walled BNNTs based on the classical Euler–Bernoulli beam theory
- Effects of substrate properties and sputtering methods on self-formation of Ag particles on the Ag–Mo(Zr) alloy films
- Enhancing carbonation and chloride resistance of autoclaved concrete by incorporating nano-CaCO3
- Effect of SiO2 aerogels loading on photocatalytic degradation of nitrobenzene using composites with tetrapod-like ZnO
- Radiation-modified wool for adsorption of redox metals and potentially for nanoparticles
- Hydration activity, crystal structural, and electronic properties studies of Ba-doped dicalcium silicate
- Microstructure and mechanical properties of brazing joint of silver-based composite filler metal
- Polymer nanocomposite sunlight spectrum down-converters made by open-air PLD
- Cryogenic milling and formation of nanostructured machined surface of AISI 4340
- Braided composite stent for peripheral vascular applications
- Effect of cinnamon essential oil on morphological, flammability and thermal properties of nanocellulose fibre–reinforced starch biopolymer composites
- Study on influencing factors of photocatalytic performance of CdS/TiO2 nanocomposite concrete
- Improving flexural and dielectric properties of carbon fiber epoxy composite laminates reinforced with carbon nanotubes interlayer using electrospray deposition
- Scalable fabrication of carbon materials based silicon rubber for highly stretchable e-textile sensor
- Degradation modeling of poly-l-lactide acid (PLLA) bioresorbable vascular scaffold within a coronary artery
- Combining Zn0.76Co0.24S with S-doped graphene as high-performance anode materials for lithium- and sodium-ion batteries
- Synthesis of functionalized carbon nanotubes for fluorescent biosensors
- Effect of nano-silica slurry on engineering, X-ray, and γ-ray attenuation characteristics of steel slag high-strength heavyweight concrete
- Incorporation of redox-active polyimide binder into LiFePO4 cathode for high-rate electrochemical energy storage
- Microstructural evolution and properties of Cu–20 wt% Ag alloy wire by multi-pass continuous drawing
- Transparent ultraviolet-shielding composite films made from dispersing pristine zinc oxide nanoparticles in low-density polyethylene
- Microfluidic-assisted synthesis and modelling of monodispersed magnetic nanocomposites for biomedical applications
- Preparation and piezoresistivity of carbon nanotube-coated sand reinforced cement mortar
- Vibrational analysis of an irregular single-walled carbon nanotube incorporating initial stress effects
- Study of the material engineering properties of high-density poly(ethylene)/perlite nanocomposite materials
- Single pulse laser removal of indium tin oxide film on glass and polyethylene terephthalate by nanosecond and femtosecond laser
- Mechanical reinforcement with enhanced electrical and heat conduction of epoxy resin by polyaniline and graphene nanoplatelets
- High-efficiency method for recycling lithium from spent LiFePO4 cathode
- Degradable tough chitosan dressing for skin wound recovery
- Static and dynamic analyses of auxetic hybrid FRC/CNTRC laminated plates
- Review articles
- Carbon nanomaterials enhanced cement-based composites: advances and challenges
- Review on the research progress of cement-based and geopolymer materials modified by graphene and graphene oxide
- Review on modeling and application of chemical mechanical polishing
- Research on the interface properties and strengthening–toughening mechanism of nanocarbon-toughened ceramic matrix composites
- Advances in modelling and analysis of nano structures: a review
- Mechanical properties of nanomaterials: A review
- New generation of oxide-based nanoparticles for the applications in early cancer detection and diagnostics
- A review on the properties, reinforcing effects, and commercialization of nanomaterials for cement-based materials
- Recent development and applications of nanomaterials for cancer immunotherapy
- Advances in biomaterials for adipose tissue reconstruction in plastic surgery
- Advances of graphene- and graphene oxide-modified cementitious materials
- Theories for triboelectric nanogenerators: A comprehensive review
- Nanotechnology of diamondoids for the fabrication of nanostructured systems
- Material advancement in technological development for the 5G wireless communications
- Nanoengineering in biomedicine: Current development and future perspectives
- Recent advances in ocean wave energy harvesting by triboelectric nanogenerator: An overview
- Application of nanoscale zero-valent iron in hexavalent chromium-contaminated soil: A review
- Carbon nanotube–reinforced polymer composite for electromagnetic interference application: A review
- Functionalized layered double hydroxide applied to heavy metal ions absorption: A review
- A new classification method of nanotechnology for design integration in biomaterials
- Finite element analysis of natural fibers composites: A review
- Phase change materials for building construction: An overview of nano-/micro-encapsulation
- Recent advance in surface modification for regulating cell adhesion and behaviors
- Hyaluronic acid as a bioactive component for bone tissue regeneration: Fabrication, modification, properties, and biological functions
- Theoretical calculation of a TiO2-based photocatalyst in the field of water splitting: A review
- Two-photon polymerization nanolithography technology for fabrication of stimulus-responsive micro/nano-structures for biomedical applications
- A review of passive methods in microchannel heat sink application through advanced geometric structure and nanofluids: Current advancements and challenges
- Stress effect on 3D culturing of MC3T3-E1 cells on microporous bovine bone slices
- Progress in magnetic Fe3O4 nanomaterials in magnetic resonance imaging
- Synthesis of graphene: Potential carbon precursors and approaches
- A comprehensive review of the influences of nanoparticles as a fuel additive in an internal combustion engine (ICE)
- Advances in layered double hydroxide-based ternary nanocomposites for photocatalysis of contaminants in water
- Analysis of functionally graded carbon nanotube-reinforced composite structures: A review
- Application of nanomaterials in ultra-high performance concrete: A review
- Therapeutic strategies and potential implications of silver nanoparticles in the management of skin cancer
- Advanced nickel nanoparticles technology: From synthesis to applications
- Cobalt magnetic nanoparticles as theranostics: Conceivable or forgettable?
- Progress in construction of bio-inspired physico-antimicrobial surfaces
- From materials to devices using fused deposition modeling: A state-of-art review
- A review for modified Li composite anode: Principle, preparation and challenge
- Naturally or artificially constructed nanocellulose architectures for epoxy composites: A review