An era of Sentinels in flood management: Potential of Sentinel-1, -2, and -3 satellites for effective flood management
-
Sai Kiran Kuntla


Abstract
The repetitive and destructive nature of floods across the globe causes significant economic damage, loss of human lives, and leaves the people living in flood-prone areas with fear and insecurity. With enough literature projecting an increase in flood frequency, severity, and magnitude in the future, there is a clear need for effective flood management strategies and timely implementation. The earth observatory satellites of the European Space Agency’s Sentinel series, Sentinel-1, Sentinel-2, and Sentinel-3, have a great potential to combat these disastrous floods by their peerless surveillance capabilities that could assist in various phases of flood management. In this article, the technical specifications and operations of the microwave synthetic aperture radar (SAR) onboard Sentinel-1, optical sensors onboard Sentinel-2 (Multispectral Instrument) and Sentinel-3 (Ocean and Land Color Instrument), and SAR altimeter onboard Sentinel-3 are described. Moreover, the observational capabilities of these three satellites and how these observations can meet the needs of researchers and flood disaster managers are discussed in detail. Furthermore, we reviewed how these satellites carrying a range of technologies that provide a broad spectrum of earth observations stand out among their predecessors and have bought a step-change in flood monitoring, understanding, and management to mitigate their adverse effects. Finally, the study is concluded by highlighting the revolution this fleet of Sentinel satellites has brought in the flood management studies and applications.
1 Introduction
Floods are among earth’s most widespread and recurrent disasters that is causing loss of human life, destruction of the environment, damage to infrastructure, deterioration of health conditions, loss of livelihood, and leaves the people living in flood-prone areas with fear and insecurity. Per the Emergency Events Database (EM-DAT) [1], a report compiled by the Centre for Research on Epidemiology of Disasters (CRED), Figure 1(a) shows the total number of flood events that occurred across the world per year between 1970 and 2020. There is an evident rise in the number of flood events over the years, especially the last two decades have witnessed a significant number of floods. Consequently, the damage caused due to the floods also has an increasing trend, as seen in Figure 1(b). The changing climate and human-induced global warming may not instigate floods directly. Still, they affect several variables that trigger floods such as precipitation, sea-level rise, increase in temperature, the intensity and the range of cyclones, snow melt, glacial retreat [2], which would eventually lead to continuing the increasing trend of the number of flood events in a year and their associated damage. Similarly, the severity of floods is also showing an upward trend and is expected to continue to increase in the future due to climate change [3]. Considering the adverse impacts of floods on people, wildlife, the environment, the economy, and its increasing trends, effective flood management is vital for a sustainable future.
![Figure 1
(a) Total number of flood events across the globe per year (1970–2020) based on the EM-DAT database. A flood event is reported in the EM-DAT database only if one of the following conditions is met: (1) ten or more people die, (2) hundred or more people are affected, (3) an appeal for international assistance, and (4) a declaration of a state of emergency [1]. (b) A current value of all damages and economic losses due to the floods across the globe per year (1970–2020) based on the EM-DAT database.](/document/doi/10.1515/geo-2020-0325/asset/graphic/j_geo-2020-0325_fig_001.jpg)
(a) Total number of flood events across the globe per year (1970–2020) based on the EM-DAT database. A flood event is reported in the EM-DAT database only if one of the following conditions is met: (1) ten or more people die, (2) hundred or more people are affected, (3) an appeal for international assistance, and (4) a declaration of a state of emergency [1]. (b) A current value of all damages and economic losses due to the floods across the globe per year (1970–2020) based on the EM-DAT database.
As flood is uncertain, powerful, and a phenomenon of multidimensional interrelated factors, it cannot always be avoided entirely. Nevertheless, its adverse impacts can be minimized by appropriate flood management measures. In general, flood management aspires to reduce or prevent the prospective losses from flood hazards, assure prompt and proper assistance to the victims, and achieve rapid and effective recovery. Different flood types (riverine floods, flash floods, coastal floods, ice jam floods, and glacial lake outbursts) may demand different approaches to policy making, strategic planning, and implementation technique for an effective management as their physical characteristics viz size, severity, time, and location vary widely. Size: generally termed as magnitude, size is usually classified by the water level. It can be major, moderate, or minor as defined by the Bureau of Meteorology [4]; severity: flood volume, rate of rising, the velocity, duration, and areal extent are the characteristics of floods that contribute to their severity [5]; time: few floods can occur rapidly in minutes to hours like flash floods, whereas few floods can result from consistent rains for days in large catchments; location: it describes the geographical location of the occurrence. For instance, coastal floods are encountered along the coasts, and riverine floods occur along the rivers. Riverine floods are observed to be, significantly, the most frequent and destructive overall compared to other flood types, as shown in Figure 2 that presents the total number of times each flood type has occurred (Figure 2(a)), the total damage (billion US$) in current values (Figure 2(b)), and a total number of people affected (Figure 2(c)) as a result of those respective flood types over the period 1970–2020 across the globe based on the records of the CRED [1]. Hence, we discussed flood management in the context of riverine floods in this article. Efficacious flood management at various phases – mitigation and preparedness (before the flood), rescue and relief (during the flood), and recovery (after the flood) – demand reliable and timely information associated with floods and other accompanying information, as listed in Figure 3. Per Figure 3 and additional secondary information mentioned in Sections 4–6, most primary informational requirements are complex and sometimes impossible to procure in conventional ways. Moreover, it will be an expensive and tedious task even for limited spatial coverage, making it unreliable for flood management and hindering research and applications in this field. However, with its near-real-time (NRT) monitoring, coverage of transboundary and otherwise inaccessible areas, high spatial resolution, ability to capture in different spectral radiances, high accuracy, and other such characteristics, the satellite remote sensing technology has paved an excellent scope for flood-related research and efficient management. Moreover, an open access option for most of the data makes it even more feasible. Besides, high-orbit geostationary communication and meteorological satellites also provide a tremendous opportunity for flood research and management. For instance, meteorological satellites are helpful in flood preparedness through early warning by continuous tracking of weather and cyclones that trigger the floods and may eventually lead to a disaster. In contrast, communication satellites are helpful in rescue and relief operations during floods by facilitating satellite communication in inaccessible areas.
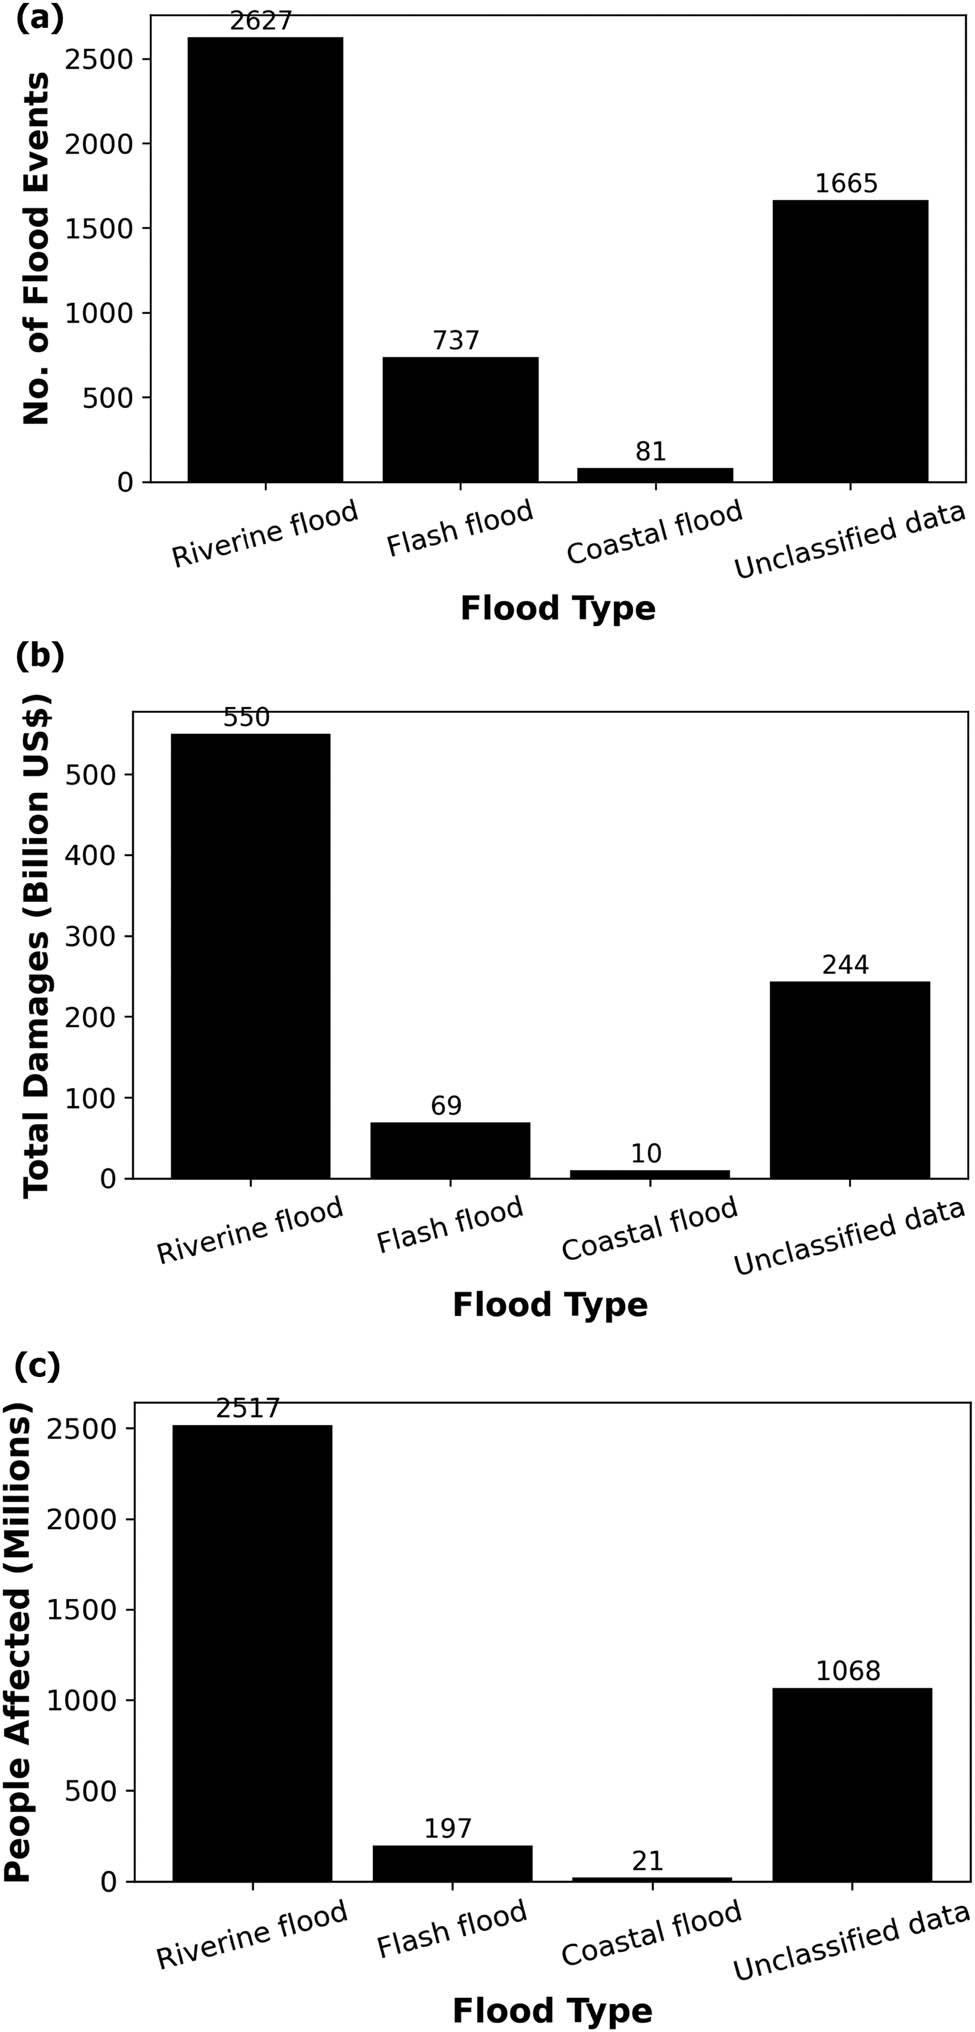
(a) Classification of floods based on their type that occurred across the globe between the years 1970 and 2020 based on the EM-DAT database. (b) A current value of all damages and economic losses across the globe due to each flood type between the years 1970 and 2020 based on the EM-DAT database. (c) Total number of people affected across the globe due to each flood type between the years 1970 and 2020 based on the EM-DAT database.
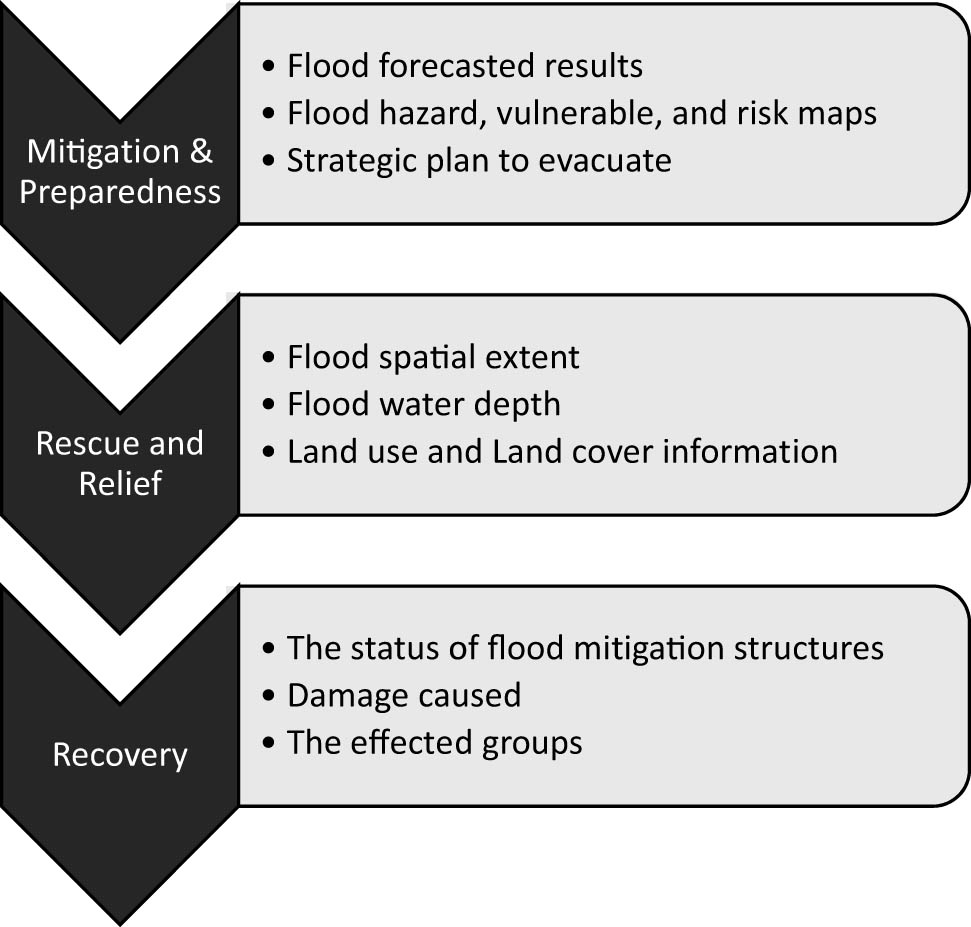
Necessary information at various phases of flood management. Note: a few of the information can be helpful at one or more phases.
The application of remote sensing in flood management is not new. A brief history of this technology in flood management is discussed in Section 2. With time the number of remote sensing satellites and their technologies with varying characteristics has significantly improved, leading to more options for the users to choose for retrieving information that is crucial at the three stages of flood management mentioned above. This article reviews the scope of a wealth of data provided by the European Space agency’s (ESA) fleet of Sentinel satellites for an efficient flood management. First, a detailed overview of the Sentinel-1, Sentinel-2, and Sentinel-3 satellites is presented in Section 3. Second, these missions’ distinctive features, advantages over their predecessors, and potential application at various stages of flood management are discussed in detail in Sections 4–6. Finally, Section 7 provides concluding remarks highlighting the revolution these satellites have bought in flood management studies and application.
2 History of remote sensing in flood management
The application of remote sensing in flood management commenced after the launch of Landsat-1 in 1972. Multispectral scanner (MSS), an optical sensor onboard Landsat-1 satellite, was successfully used for delineating floods [6,7,8,9,10], flood monitoring [11,12], flood damage assessment [9,13], break-up of river ice [14,15], and for preparing flood hazard maps [16]. Subsequently, it has become an established practice to use optical sensors of varying spatial resolutions (high, medium, and coarser) for flood mapping and monitoring, damage assessment, and for generating flood hazard maps across the globe over time. For instance, some of the notable optical sensors used are Landsat – Thematic Mapper (TM) [17,18], National Ocean and Atmospheric Administration very high-resolution radiometer (NOAA VHRR) [14], advanced very high-resolution radiometer (AVHRR) [19,20], the Satellite Pour l’Observation de la Terre (SPOT) [21], Nimbus-7 coastal zone color scanner (CZCS) [22], moderate resolution imaging spectroradiometer (MODIS) sensor onboard Terra satellite [23,24], linear imaging self-scanning sensor (LISS)-III onboard Indian Remote Sensing (IRS) satellite [25], Enhanced Thematic Mapper Plus (ETM+), Operational Land Imager (OLI) sensors of Landsat-7 and Landsat-8 [24,26], and Multispectral Instrument (MSI) of Sentinel-2 [27,28] (see Table A1 in Appendix for the overview of these satellites). Further applications of the optical sensor data in the context of high-resolution Sentinel-2 satellite data and coarser-resolution Sentinel-3 satellite data in various phases of flood management are discussed in Sections 5 and 6.
Despite the wide range of applications, due to unfavorable weather conditions and the high probability of cloud coverage during or immediately after a flood, it is difficult for optical sensors to capture the ground, making them unsuitable most of the time for mapping and monitoring the floods. Hence, as an alternative, microwave synthetic aperture radar (SAR) sensors are preferred as they have cloud penetrating capability and capture images effectively during rain and other adverse weather conditions both day and night. Moreover, water appears to be dark due to low backscatter from its smooth surface, whereas its surrounding terrain appears bright as they are assumed to be rough for the same waves resulting in moderate backscatter. This property of SAR images makes it more effective to distinguish water from surrounding surfaces even by visual interpretation under steady conditions [29]. Although the capability of SAR sensors for flood mapping and monitoring are addressed in the late 1970s [30,31,32], it was not operationally popular in the scientific community until the launch of European Remote Sensing (ERS)-1 and ERS-2 active SAR satellites that operate in C-band of the microwave spectrum with single VV polarization [33,34,35,36]. Besides, flood mapping with airborne radars was also attempted and found success in a few studies before the launch of ERS SAR satellites. Lowry et al. made an initial attempt to map the floods utilizing side-looking airborne radar that operates in X-band and L-band [37]. Also, soil moisture estimation was in operational use from the very beginning using the SAR data. Ormsby et al. used L-band data acquired by Seasat-A radar and Shuttle Imaging Radar-A (SIR-A) combined with aircraft X-band and C-band radar data to illustrate radar capability low land flooding under forest canopies [38]. Pope et al. used airborne high-resolution L-band, C-band, and X-band multipolarization SAR data for detecting flooded dambos [39]. Currently, with the launch of many SAR satellites with different configurations over the period and improved techniques, as listed in Table A2 in Appendix, SAR technology is widely used in various aspects that contribute to flood management including, but not limited to, flood forecasting and early warning system [40,41], flood mapping [42,43,44], NRT flood monitoring [29,41,45,46], damage assessment [47], and soil moisture estimation to predict the flood [30,32,48]. More details on SAR applications in various phases of flood management can be found in Section 4. Besides, combined use of data acquired from both optical sensors and active SAR is also successfully implemented for a few of the applications mentioned earlier [13,35,36,39,47].
Considering the importance of flood depth information that could be useful directly or indirectly at various phases of flood management, as explained in detail in Section 6, both optical and active microwave remote sensing images were successfully used in combination with topographical data or digital elevation model (DEM) data or Interferometric SAR (InSAR) to compute the flood depths [34,46,47,49,50,51,52,53]. However, these methods are not popular and limited to few case studies as it is indirect, complex, demand collation of multiple high-end datasets and incompetent to generalize the operational use at a large scale (continental or global) for continuous monitoring. In contrast, satellite radar altimetry emerged as a promising tool and is widely used as it facilitates direct measurements of inland water levels with great accuracy. Radar altimetry was originally designed for oceanography studies. However, Miller and Brooks studies at the initial stage using GEOS-3 and Seatsat satellite data, respectively, on inland water bodies, show that radar altimetry is reliable for monitoring water levels over lakes [54,55]. At the same time, the first study on river network was studied by Koblinsky et al. on the Amazon river at four different locations, where satellite observations and river gauge station measurements overlap, which gave promising results [56]. The improvement in the precision of altimetry observations and technologies over time from the launch of the first satellite altimeter GEOS-3 in 1975 to Sentinel-3B in 2018 has led to better measurements with greater accuracy and increased coverage of inland water bodies at a high resolution. Consequently, many water-level monitoring algorithms and databases have also evolved over time: “River&Lake” [57], “Hydro-web” [58], “USDA Lake database” [59], “DAHITI” [60], “G-REALM” (https://ipad.fas.usda.gov/cropexplorer/global_reservoir/) [61], “Lakes” (https://climate.esa.int/en/projects/lakes/data/) [62], and “Copernicus Global Land Services” (https://land.copernicus.eu/global/products/wl) [63]. The list of all the satellite altimeters and a few of their characteristics are listed in Table A3 in Appendix. All the applications of radar altimetry in flood management and the technological improvements built in Sentinel-3, which makes it advantageous over its predecessors, are explained in Section 6.
3 Missions overview
The Sentinel fleet of earth observation satellites under the Copernicus programme is headed by the European Commission (EC) in collaboration with the ESA. A detailed overview of the Sentinel-1, Sentinel-2, and Sentinel-3 satellites is provided in the following subsections.
3.1 Sentinel-1 mission overview
Sentinel-1 is the first mission under Copernicus Programme. It is composed of a constellation of two identical satellites, Sentinel-1A (S-1A) and Sentinel-1B (S-1B), on the same orbit. S-1A was launched in April 2014, whereas its companion S-1B was launched in April 2016. Each satellite is equipped with a C-band advanced radar instrument that operates at 5.405 GHz frequency, making it capable of capturing the Earth’s surface day and night regardless of the weather. As a constellation of two satellites orbiting 180° apart, the mission covers the whole globe in 6 days. The constellation has a coverage frequency (ascending/descending and overlap) not considering the repetitiveness of relative orbits is within 1–6 days with higher coverage frequency over higher latitudes as per Figure 4(a), which illustrates the Sentinel-1 constellation revisit and coverage frequency of observations [64]. Sentinel-1C (S-1C) and Sentinel-1D (S-1D) identical satellites under the same mission are currently under development and expected to be launched in the near future (2022 and ≥2023, respectively), which would continue providing data in place of the existing satellites [65].
![Figure 4
Sentinel-1 constellation observation scenarios: (a) revisit and coverage frequency and (b) mode, polarization, and observation geometry [64].](/document/doi/10.1515/geo-2020-0325/asset/graphic/j_geo-2020-0325_fig_004.jpg)
Sentinel-1 constellation observation scenarios: (a) revisit and coverage frequency and (b) mode, polarization, and observation geometry [64].
Sentinel-1 radar operates in four exclusive acquisition modes [66] viz strip map (SM): it provides coverage at 5 m × 5 m resolution along a narrow swath width of 80 km. The area of interest for SM acquisition is limited to small islands as shown in Figure 4(b) and to support emergency management upon request; interferometric wide (IW) swath: it is the default acquisition mode over land (Figure 4(b)) with a spatial resolution of 5 m × 20 m along a 250 km large swath width; extra wide (EW) swath: it acquires data over a wider swath width of 400 km at a spatial resolution of 20 m × 40 m. The EW acquisition mode is primarily for use over sea-ice, polar zones, and certain maritime areas where wide coverage and continuous monitoring is necessary; and wave (WV): It is the default acquisition mode over open ocean with a spatial resolution of 5 m × 5 m in vignettes of 20 km by 20 km for every 100 km. WV vignettes are acquired alternatively on two different incidence angles. SM, IW, and EW products are available in both single (HH, VV) and dual polarization (HH + HV, VV + VH), whereas WV is single polarization only (HH, VV). Sentinel-1 data acquired in SM, IW, and EW mode are processed by Payload Data Ground Segment (PDGS) and distributed at three levels to the public, viz Level-0: The raw product is compressed and unfocused. The following high-level products are processed from Level-0 products: Level-1 Single Look Complex (SLC), Level-1 Ground Range Detected (GRD), and Level-2 Ocean (OCN). The SLC products are available in slant-range geometry, whereas the GRD products are projected to ground range using the Earth ellipsoid model WGS84. Based on the amount of multilooking performed, GRD products can either be full resolution (FR) or high-resolution (HR), or medium resolution (MR). SM mode has all three resolutions. In contrast, IW and EW modes have MR and HR, and WV has MR only. The OCN products contain the Ocean Wind field (OWI), Ocean Swell spectra (OSW), and Surface Radial Velocity (RVL) geo-physical components derived from Level-1 products. These are systematically distributed ocean products for wind, wave, and currents applications. OSW provides continuity with ERS and advanced synthetic aperture radar (ASAR) WV, whereas OWI and RVL are exclusive products of Sentinel-1. More details about the product types and their processing can be found at ESA [67]. All the SAR data acquired are systematically processed to predefined product types and are made available globally, regionally, and locally at a defined timeline. Global products, including Level-0, Level-1, and Level-2 Ocean products, are made available within 1 h of observation across NRT areas with a subscription or provided after 24 h from observation to all the users across the globe from free online archive. Level-1 SLC products are made available at a regional scale (within the station coverage), a subset of the total acquired data, within 1 h of observation across NRT areas and within 24 h over other specified regions. At the same time, it is made free online access in its archive to all the users after 24 h of observation. In addition, for critical Global Monitoring for Environment and Security and national service over NRT areas that require data in quasi RT, data are transmitted in real time to the local collaborative ground stations that support these services and are processed under high priority for disseminating data systematically locally within 10 min [68].
3.2 Sentinel-2 mission overview
Sentinel-2 satellites, Sentinel-2A (S-2A) and Sentinel-2B (S-2B) were launched in the same orbit on 23 June 2015 and 7 March 2017. Together, they cover all land surface on the earth between 56° S and 82.8° N latitude, all islands greater than 100 km2 in area, all islands in European Union, all coastal oceans up to 20 km from the shoreline, all closed sea, and the Mediterranean Sea with a revisit coverage frequency of fewer than 5 days [69]. Each of the twin satellites is designed to provide HR optical images using an advanced MSI that captures the earth’s surface with a radiometric resolution of 12 bit in 13 spectral channels. The central wavelength, bandwidth, and spatial resolution of these 13 spectral bands are provided in Table 1. MSI uses the push-broom concept to scan the ground along its path with a large swath width of 290 km.
Spectral bands for the Sentinel-2 Multispectral Instrument (MSI) sensors [131]
| Band | S-2A central wavelength (nm) | S-2B central wavelength (nm) | Bandwidth (nm) | Spatial resolution (m) |
|---|---|---|---|---|
| Band 1 | 442.7 | 442.3 | 21 | 60 |
| Band 2 | 492.4 | 492.1 | 66 | 10 |
| Band 3 | 559.8 | 559.0 | 36 | 10 |
| Band 4 | 664.6 | 665.0 | 31 | 10 |
| Band 5 | 704.1 | 703.8 | 16 | 20 |
| Band 6 | 740.5 | 739.1 | 15 | 20 |
| Band 7 | 782.8 | 779.7 | 20 | 20 |
| Band 8 | 832.8 | 833.0 | 106 | 10 |
| Band 8a | 864.7 | 864.0 | 22 | 20 |
| Band 9 | 945.1 | 943.2 | 21 | 60 |
| Band 10 | 1373.5 | 1376.9 | 30 | 60 |
| Band 11 | 1613.7 | 1610.4 | 94 | 20 |
| Band 12 | 2202.4 | 2185.7 | 185 | 20 |
MSI only acquires data in a single observational mode that is systematically processed by PDGS from unconsolidated Level-0 to Level-1C and Level-2A products and made available to the users [69]. Sentinel-2 images in both Level-1C and Level-2A are available in 100 × 100 km2 granules, also referred to as tiles. Level-1C data product features top of atmosphere (TOA) reflectance in cartographic geometry with UTM/WGS84 projection. Level-1 processing includes radiometric and geometric corrections, including orthorectification and spatial registration on a global reference system with subpixel accuracy. In addition, it also involves cloud and land/water masks generation. In comparison, the Level-2A processing includes an atmospheric correction and a scene classification applied to Level-1C orthoimage products resulting in bottom of the atmosphere (BOA) reflectance product in cartographic geometry together with aerosol optical thickness map, a water vapor map, and a scene classification map with quality indicators (QI; e.g., defective pixels mask, cloud masks, online quality control reports, etc.) for cloud and snow probabilities [69]. Level-2A products are either generated by the Sen2Cor processor of PDGS or on the user side using Sentinel-2 Toolbox [69]. The QI information available with the product helps to determine the suitability of a product for the intended use or application. More details about the physical data format delivered to the users are available in an earlier study [69]. The products of Sentinel-2 data are available to the users in three timelines: RT, features availability of product within 100 min after data sensing; NRT, features availability of product between 100 min and 3 h after data sensing; and nominal, features availability of product systematically in online archive between 3 and 24 h after sensing [69]. The users are advised to choose the data product timeline based on the application as it is a compromise between the time and quality.
3.3 Sentinel-3 mission overview
The Sentinel-3 mission is currently composed of two satellites in its constellation, Sentinel-3A (S-3A) and Sentinel-3B (S-3B), launched on 16 February 2016 and 25 April 2018. The other two sisters of this mission, Sentinel-3C (S-3C) and Sentinel-3D (S-3D), are about to be launched in the coming years to accompany the existing two, thereby helping to increase the revisit time, coverage, and extend the operational measurements further. The orbits of Sentinel-3A and 3B are identical but have an in-plane separation of 140°. ESA and Eumetsat are jointly responsible for the smooth running of this mission and delivering its products. ESA manages land products and their improvement, whereas Eumetsat provides marine products and satellite operation. This mission is designed to provide data for services relevant to the ocean, land, atmospheric, emergency, security, and cryosphere applications with its wide range of primary payload instruments: Sea and Land Surface Temperature Radiometer (SLSTR), SAR altimeter (SRAL), Ocean and Land Colour Instrument (OLCI), and Microwave Radiometer (MWR). These primary instruments are complemented by three instruments for Precise Orbit Determination (POD) that includes a global navigation satellite systems (GNSS) receiver that is capable of tracking multiple GNSS satellites simultaneously to provide precise orbit information, a Doppler Orbitography and Radio-positioning Integrated on Satellite (DORIS) instrument, and a Laser Retro reflector (LRR) to know the actual location of the satellite in its orbit. In the following subsections, we will describe the SRAL and OLCI instruments in detail because only these two instruments are under the scope of this study.
3.3.1 Sentinel-3 SRAL overview
SRAL is a nadir-looking altimeter instrument operated in dual-frequency, Ku-band (13.575 GHz) and C-band (5.41 GHz), and the core topographic instrument to provide accurate topography measurements over ocean and inland waterbodies. Also, the SRAL instrument is supported by a dual-channel (23.8 and 36.5 GHz) MWR that measures water vapor, cloud water content, and thermal radiation emitted by the Earth, which is used to derive atmospheric correction and atmospheric column water vapor measurements thereby improving the performance of altimeter. Moreover, the three secondary instruments onboard Sentinel-3, including GNSS, DORIS, and LRR, mentioned earlier, supplement high accuracy radial orbit information to the SRAL instrument that helps to meet its operational requirements. The pair of altimeters onboard S-3A and S-3B, flying on two identical orbits providing a 140° in-plane separation, does not improve the repeat cycle keeping it the same 27 days with single and both together but increases the coverage [70]. For instance, the ground track separation of the adjacent SRAL tracks is 104 km at the equator with S-3A alone, whereas it is 52 km with S-3A and S-3B together. The ground tracks of the S-3A and S-3B satellites covering a part of the North Sea, United Kingdom, Denmark, and the Netherlands in Europe is presented in Figure 5. The SRAL instrument is characterized by two measurement modes, calibration modes, and support modes. The measurement modes comprise two radar modes: low resolution mode (LRM) and SAR mode (SARM). LRM refers to the conventional altimeter pulse-limited resolution mode, whereas SARM is a high along-track resolution mode comprising bursts of 64 Ku-band pulses surrounded by two C-band pulses. The along-track and across-track spatial resolution in LRM mode is 164 km, whereas the SARM mode gives a high resolution of 300 m along the track. In association with these measurement modes, two tracking modes exist: closed-loop mode, which uses a median algorithm to position the range window autonomously and an open-loop mode, which uses prior knowledge of the surface elevations based on a DEM available on-board to position the range window accurately. The operational measurement mode of the instrument is based on the surface types, as listed in Table 2.
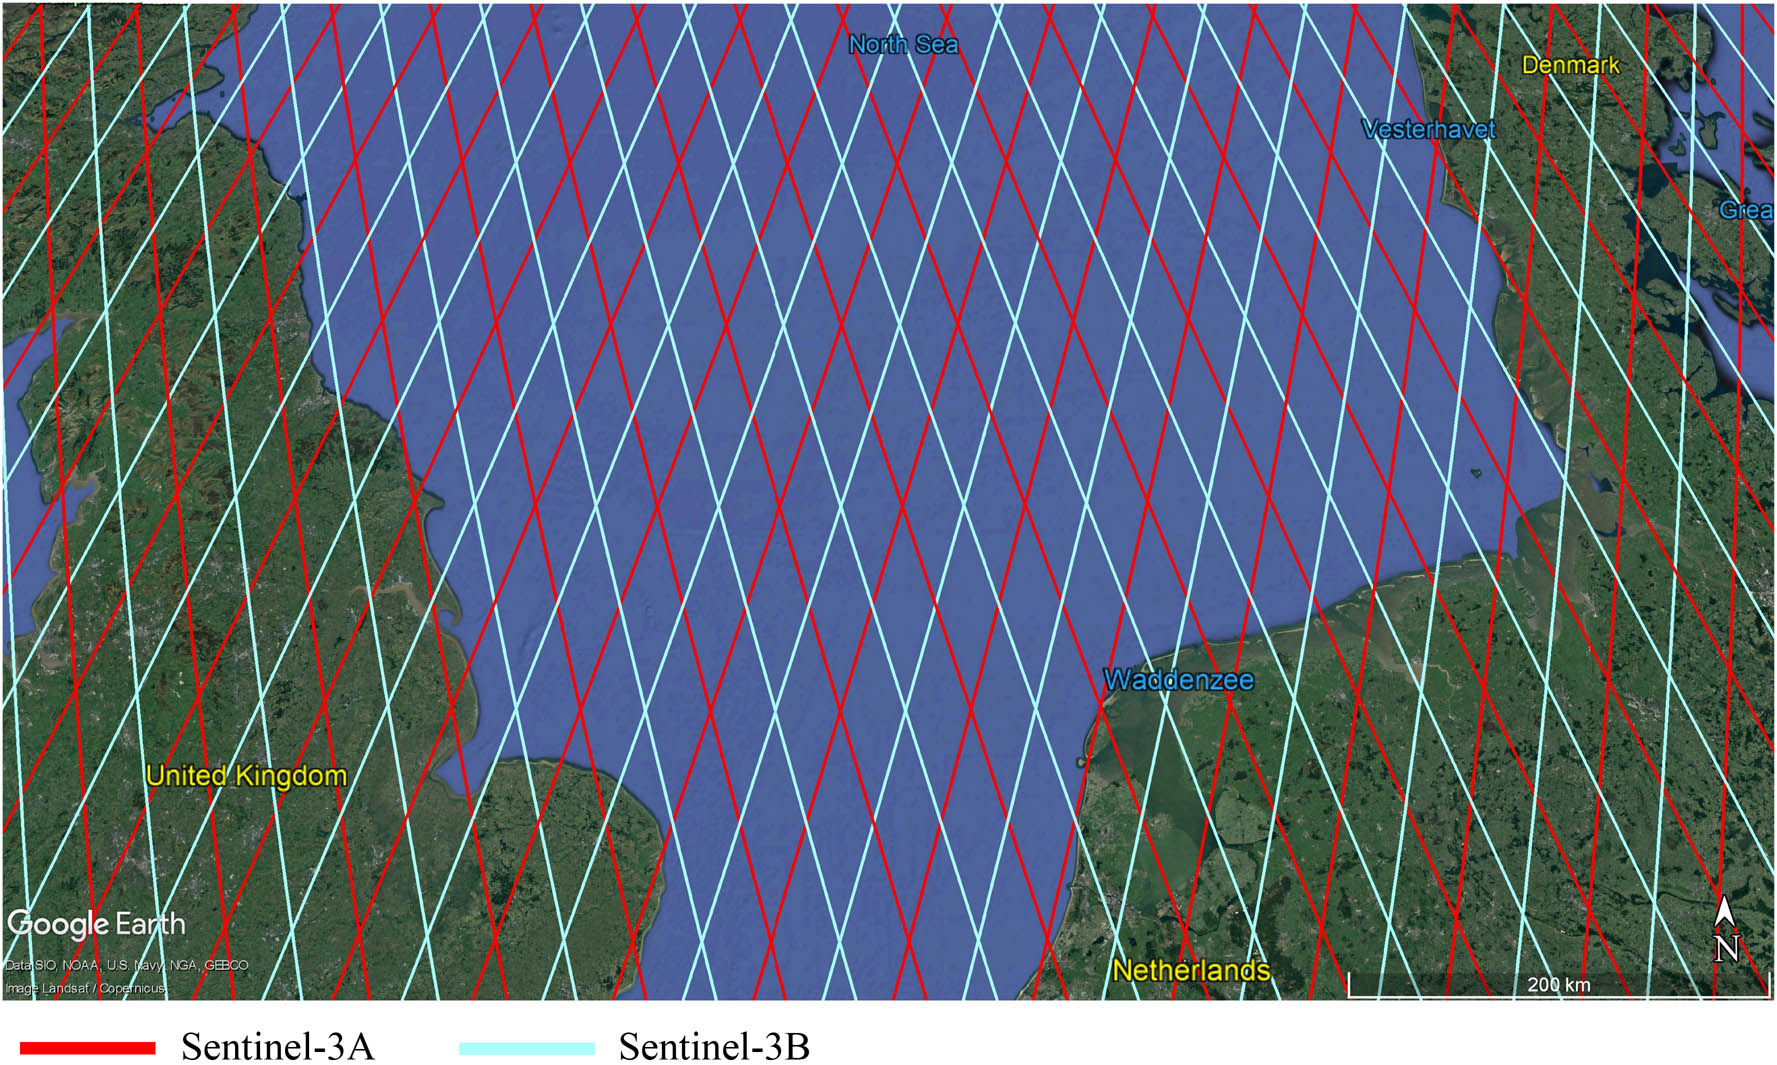
A snapshot of Sentinel-3 constellation altimeters ground tracks over the North Sea near Europe.
Summary of SRAL support modes [133]
| Surface type | SRAL operation | |
|---|---|---|
| Measurement mode | Tracking mode | |
| Open ocean | LRM | Closed-loop |
| Coastal ocean | SARM | Open-loop |
| Sea-ice | SARM | Closed-loop |
| Ice sheet interiors | LRM | Closed-loop |
| Ice sheet margins | SARM | Open-loop |
| Land: Rivers/lakes | SARM | Open-loop |
| Measurement mode | Spatial Resolution | |
|---|---|---|
| Along-track | Across-track | |
| SRM | 300 m | 164 km |
| LRM | 164 km | 164 km |
The processing chain of SRAL data through different processing levels is shown in Figure 6. Level-1 data features various 20 Hz Ku-band and C-band products corrected for instrumental effects, whereas Level-2 land and marine data feature various 1 and 20 Hz Ku-band and C-band parameters retracking estimates over land, coastal areas, sea-ice, land ice, inland water, and open ocean, coastal regions, sea-ice, corrected for geophysical effects, respectively. The summary of data products of SRAL Level-2 Land and Marine is listed in Table 3. A Level-2 SRAL complete product contains three data files in NetCDF format: one reduced (Red) file, including a subset of the leading 1 Hz Ku-band parameters, a standard (Std) file containing the standard 1 and 20 Hz Ku-band and C-band parameters, and an enhanced (Enh) file containing the standard 1 and 20 Hz Ku-band and C-band parameters, along with the waveforms and the associated parameters necessary to reprocess the data. For further information on Level-1 and Level-2 products and their processing, refer to an earlier study [71]. The SRAL data is delivered to the users in three different timelines: NRT, slow time critical (STC), and nontime critical (NTC). NRT implies data provided within 3 h after data acquisition. The length of the ground track of data (both Level-1 and Level-2) available in the NRT timeline will be approximately 10 min in length. The data with NRT timeline found its usage mainly in RT operational oceanography, marine meteorology, marine nowcasting, and functional wave forecasting. STC implies data delivered within 48 h after data acquisition, and it found its usage mainly in geophysical studies, operational oceanography, and seasonal forecasting. Datasets in the STC timeline have an improved accuracy compared to NRT products due to consolidated additional auxiliary and ancillary data made available during the STC processing time window. Data in the NTC timeline are the most accurate among others with low errors than in STC products. These products are available within 1 month after data acquisition and incorporated with further auxiliary and ancillary information for more precise orbit determination and lower errors. NTC data is widely used in sea level monitoring, climatology, and geophysical studies [72]. Both the STC and NTC products, either Level-1 or Level-2, correspond to half-orbit (pole-to-pole) in length. Hence, selecting a product type in terms of delivery time (NRT, STC, and NTC) is a trade-off between RT needs and the final accuracy needed. Also, some Level-2 parameters depend on consolidating data such as orbit, platform, or wet and dry tropospheric corrections.
![Figure 6
SRAL processing chain [72].](/document/doi/10.1515/geo-2020-0325/asset/graphic/j_geo-2020-0325_fig_006.jpg)
SRAL processing chain [72].
Summary of SRAL level-2 core products parameters
| Marine | Land |
|---|---|
| 1/20 Hz Ku/C-band waveforms and parameters | 1/20 Hz Ku/C-band waveforms and parameters |
| Surface backscatter | Surface backscatter |
| Sea surface heights | Surface height |
| Significant wave height | Altimeter range |
| Ocean depth | Snow density |
| Tides height | Snow depth |
| Sea ice concentration | Sea ice freeboard |
| Sea ice freeboard | Sea ice concentration |
| Sea surface wind speed | Coastal sea surface height |
| Rain rate | Coastal significant wave height |
3.3.2 Sentinel-3 OLCI Overview
OLCI is a push-broom type multispectral imaging spectrometer that records reflected solar radiations from the Earth in 21 spectral bands in the visible to near infrared (400–1,020 nm) spectral region as listed in Table 4 at a spatial resolution of 300 m (FR). The distinct spectral bands of the OLCI primarily help in extracting vital information on ocean and land surface biology. Nevertheless, it serves as an excellent resource for a few flood management activities highlighted in Section 6. At a swath width of 1,270 km, the pair of OLCI instruments cover the entire globe in less than 2 days. The three main products of OLCI data available to the users are Level-1B that features calibrated, orthorectified, and spatially regridded TOA radiances along with its associated annotation data, Level-2 land products that feature land and atmospheric geophysical parameters generated using Level-1B data, and Level-2 water products that provide water and atmospheric parameters. All the data products mentioned above are available at FR and reduced resolutions (RR). A pixel in RR data corresponds to 1.2 km spatial resolution obtained by averaging the grid of 16 FR pixels. The OLCI products are combined with SLSTR products to get Sentinel-3 SYN products, whose details can be found at ESA [73]. Finally, the OLCI data is delivered to the users in two different timelines: NRT and NTC. NRT implies data delivery within 3 h of data acquisition. In comparison, NTC denotes data delivery within a month of data acquisition, consolidating additional ancillary/auxiliary data. Based on the application of the user, data in either of the timelines can be preferred.
Spectral bands for the OLCI instrument onboard Sentinel-3 [132]
| Band | Central wavelength (nm) | Width (nm) |
|---|---|---|
| Oa1 | 400 | 15 |
| Oa2 | 412.5 | 10 |
| Oa3 | 442.5 | 10 |
| Oa4 | 442 | 10 |
| Oa5 | 510 | 10 |
| Oa6 | 560 | 10 |
| Oa7 | 620 | 10 |
| Oa8 | 665 | 10 |
| Oa9 | 673.75 | 7.5 |
| Oa10 | 681.25 | 7.5 |
| Oa11 | 708.75 | 10 |
| Oa12 | 753.75 | 7.5 |
| Oa13 | 761.25 | 2.5 |
| Oa14 | 764.375 | 3.75 |
| Oa15 | 767.5 | 2.5 |
| Oa16 | 778.75 | 15 |
| Oa17 | 865 | 20 |
| Oa18 | 885 | 10 |
| Oa19 | 900 | 10 |
| Oa20 | 940 | 20 |
| Oa21 | 1,020 | 40 |
4 Advantages and uses of Sentinel-1 for flood management
Sentinel-1 continues the C-band viewing heritage of previous ESA’s (ERS-1, ERS-2, and Environmental Satellite [Envisat]) and Canada’s SAR missions (Radar Satellite [RADARSAT]-1 and RADARSAT-2) with improvements in the form of reliability, revisit time, geographical coverage, and rapid data delivery as mentioned in Section 3.1. Currently, Sentinel-1 is the only active SAR mission whose data with global coverage are provided on an open and free basis to all its users (general public, scientific, and commercial) irrespective of their country. Hence, it is considered a game changer ever since the first satellite of its constellation was launched. It became a primary dominant source for all kinds of studies involving spaceborne SAR imagery of the earth’s surface. Especially for the flood management studies, the unique abilities of SAR sensors and characteristics of its images, as discussed in Section 2, that helps the inundated areas stand out from their surroundings, has convincingly resulted in the wide usage of Sentinel-1 data for mapping and monitoring of floods with a high spatial resolution at all the scales ranging from regional [29,42,74] to global [75]. In addition, the high-revisit coverage frequency provided by the two twin satellites (S-1A and S-1B) constellation, as discussed in Section 3.1, has made it possible for an NRT monitoring of the floods, thus becoming a crucial set of information for rescue and relief operations. Furthermore, the addition of S-1C and S-1D satellites in the near future (more details in Section 3.1) complements the existing Sentinel-1 constellation by further improving its repetitivity and coverage frequency. Besides, it helps to continue the systematic acquisition and archive Sentinel-1 data over a more extended period. Moreover, S-1C and S-1D are expected to have better radiometric performance, design robustness, and carry an Automatic Identification System (AIS) instrument and Optical Communication Payload (OCP) in addition to the conventional payload on its preceded satellites (S-1A and S-1B) payload [76]. The AIS and OCP onboard S-1C and S-1D make them outperform in marine traffic application, especially for early warning and route changes in the sea, and more convenient data transfer thereby providing data at much faster rates.
Sentinel-1 constellations’ InSAR observations with a swath width of 250 km in IW mode (standard mode on land) provide an unprecedented opportunity for relatively high spatio-temporal resolution water level mapping directly from its interferograms [77]. In addition, its InSAR observations help in generating a detailed DEM (of 10 m spatial resolution) compared to other openly accessible DEMs (SRTM, ASTER, and AW3D30) [78], which can be used to assess flood depths with spatial flood extent maps [46,52,79]. Besides, the generated topographic information/DEM can be used to find flood vulnerable areas and feed flood-inundation models along with SAR-derived flood extents for better modeling and predictions [51,80]. Furthermore, the Sentinel-1 SAR-derived high spatio-temporal flood extents and depths provide a potential to understand the hydraulic functioning of a river or flood plain for better designing and building of model structures [81], calibration, and evaluation [82] of hydraulic/hydrological models, sequential assimilation in flood forecasting systems for regular forecasts with sufficient quality, and to find an optimal estimate of the water surface line [83] in conjunction with hydrodynamic model. Besides, as backscattered radar energy have a significant influence on moisture content (indeed, dielectric constant) of the surface with which it interacts, it provides an excellent opportunity for SAR to derive the spatial information of soil moisture. The derived soil moisture information using Sentinel-1 SAR data [84,85] could help predict the flood characteristics and as a valid primary input in flood forecasting models because the floods have a considerable influence on its corresponding ground soil moisture conditions [86,87,88,89]. The resulting long archives of detailed flood extents and depths [74], and better model performances and forecasted results in combination with other thematic maps, including land use and land cover (LULC) map as discussed in Section 5, helps in precise predictions and generation of flood hazard and risk maps in advance. These maps become a crucial source of information for flood managers, disaster response teams, and planners at flood mitigation and preparedness phase of flood management by helping in early warning, identifying the high-risk areas where early evacuation and other preparedness action must be taken, and in finding the prospect areas where construction of flood mitigation structures must be considered to mitigate the possible flood risk.
The Sentinel-1 SAR-derived HR flood inundation extent in combination with other thematic maps and geographic information system, as a tool, can be used for locating embankment breach locations even under a thick green cover [42] and for detailed rapid damage assessment [90,91]. Moreover, since Sentinel-1 InSAR observations are sensitive to minor changes, it helps to identify small-scale damages in infrastructure, including buildings that are difficult to capture through amplitude and intensity images when predisaster and postdisaster images [91] are compared. Thus, it assists in damage assessment and rehabilitation during the recovery phase (after floods) of the flood management. Besides, although coastal flood management is out of the scope of this study, in brief, Sentinel-1 InSAR observations and intensity images in WV mode that resembles ERS and ENVISAT mode, but with improved spatial resolution, larger vignettes, and a “leap frog” acquisition pattern, have a potential to provide information that is crucial for managing coastal floods and their drivers. For example, precise coastal line, land subsidence information, detailed land topography over intertidal environments, the water level at shore lines and at land and water interference zone, coastal erosion, swells location, and in determining the direction, wavelength, and heights of waves on the open oceans in conjunction with global wave models [49,92,93,94].
5 Advantages and uses of Sentinel-2 for flood management
MSI onboard Sentinel-2 mission is superlative in revisit frequency, geometrical, and spectral performance compared to other active and antecedent multispectral optical remote sensing satellite missions that are openly and freely accessible to all the users. A high spatial resolution (of 10 m) in the visible (Band 2–4) and NIR (Band 8) wavelengths, as listed in Table 1, provides an unprecedented level of detailed information. In addition, the other characteristics including large swath width of 290 km, high radiometric resolution of 12 bit, rapid data dissemination capability that corresponds to data delivery within 100 min to 24 h after data sensing based on its timeline as mentioned in Section 3.2, and high revisit coverage frequency of fewer than 5 days across the globe makes it superior for flood management applications. Moreover, the optimum ranges and widths of spectral bands (listed in Table 1) in the atmospheric windows limit the influence of atmospheric constituents, including water vapor, and enables precise aerosol and cirrus correction, providing true ground images with less contamination [69]. Although the characteristics mentioned above of the Sentinel-2 mission and its imagery make it highly suitable for flood mapping and monitoring, the thick cloud coverage during flood events makes its usage difficult and limited in the same application as discussed in Section 2. Nevertheless, if the multispectral optical images of the Sentinel-2 have considerably low or no cloud coverage during the flood events, the likelihood of which is relatively high in Sentinel-2 imagery due to its high revisit coverage, they can be effectively used for mapping and monitoring of the floods [27,28]. The flood extent can be delineated at much higher accuracy from Sentinel-2 multispectral optical data compared to the Sentinel-1 SAR at scenes where there is no cloud coverage, or negligible and have significant hilly complex terrain, or/and high raised buildings, or/and flat highly reflective surfaces that appear dark in the SAR image resulting in high omission/commission errors in the classification of flood inundation. Besides, various techniques and tools are available for applying atmospheric corrections to diminish the clouds and detect and mask out the clouds and their shadows from multispectral images for better results [95,96]. Sen2Cor of ESA’s SNAP software (https://step.esa.int/main/toolboxes/snap/) is one such processor that is specially designed to perform the atmospheric, terrain, and cirrus correction of Sentinel-2 Level-1C TOA products to generate Level-2A BOA reflectance products based on users’ interest [28,97]. Similar to the applications of Sentinel-1 SAR-derived flood extents as discussed in Section 4, the high spatio-temporal Sentinel-2-derived flood extents can be competitively used to understand the hydraulic functioning of a flood plain and to extract features within the river or flood plain that helps in understanding, designing, and building model structures [81]. In addition, the flood extents find its usage in calibration and evaluation of hydraulic/hydrological models, sequential assimilation of flood forecasting systems, and to find an optimal estimate of the water surface line [83] in conjunction with hydrodynamic models. Moreover, the Sentinel-2 multispectral optical data can also be used to estimate soil moisture [98,99] at a high resolution. As mentioned in Section 4, the soil moisture information could feed flood forecasting models and predict the flood characteristics as antecedent soil moisture conditions would considerably influence it [86,87,88,89].
The high spatio-temporal resolution of Sentinel-2 multispectral imagery and these datasets’ free data distribution policy have paved roads for generating and updating cloud-free, detailed LULC maps with 10 m resolution even at continental [100] and global scales [101]. The LULC maps can be one of the vital sources of information that could be useful at all the phases of flood management: in the preparedness and mitigation phase, the LULC map would also contribute toward understanding, designing, and building models, assimilate hydraulic/hydrologic, flood forecasting, and inundation models for appropriate simulation results because the capacity and intensity of infiltration and runoff generation on the ground surface is dependent on its corresponding land use or land cover as observed in a significant number of studies where the impact of change in LULC on its hydrology and characteristics of floods over those areas is described in detail [102,103,104,105]. Thus, helping for modeling better forecasting of floods and developing flood hazard and risk maps as presented in Figure 7, which could be useful in preparedness and early warning before/during the floods. The foreseen model results, hazard and risk maps, and past archives of flood inundation extents with their return period information, along with LULC and thematic maps that describes the geographical features of the earth, such as DEM, lineament, geomorphology, slope, river channel network, route networks, would be helpful in wide application. For instance, it could be a crucial reference material for spatial land use planning, finding suitable locations for setting up relief camps before an anticipated disaster, and flood management policy making for disaster preparedness and mitigation, including finding the prospect areas were flood mitigation structures and their type that are necessary and suits the area of interest [106]. Moreover, the HR and optimum spectral configuration of Sentinel-2 multispectral data has the potential to derive various thematic maps, including a few geographical features mentioned earlier based on multiple techniques and complex interpretation skills [107]. In the rescue and relief phase, up-to-date time-series flood inundation and their associated depths along with route network vector layers overlayed on the true earth Sentinel-2 imagery or on the derived detailed LULC map as illustrated in Figures 8, 9 and 10 can be effectively used to find and prioritize evacuation sites based on its associated risk and population. It also helps to identify the nearest potential relief staging areas and other critical areas such as hospitals and the status of supply routes for rapid rescue and relief operations; In the recovery phase, the Sentinel-2 based detailed LULC plays a vital role in damage assessment and rehabilitation even at highly dense urban areas. The preflood and postflood detailed LULC maps that includes multiple subclasses of the very general LULC classes (e.g., agriculture land, built-up area, forest area, barren land, and water bodies), as shown in Figures 9 and 10, can be used as a great tool for change detection to spot the damaged sites in flood plain and enable quick rehabilitation activities. In addition, prioritizing rehabilitation is also possible because damaged critical areas, including hospitals and other areas of great importance, should be prioritized. Moreover, it helps in quantifying the damaged sites by type, as presented in Figure 8, which could assist in assessing the economic loss caused. Furthermore, the detailed spatial damage information from LULC would also assist in the quantitative assessment of the number of people affected, thereby assessing the full impact of the flood disaster over the area of interest, as shown in Figures 8 and 10. The estimation of the number of people affected by floods is done by the density of land use class or other indirect methods, including a residence count method, area (density) method, and model method proposed by Zhang [108].
![Figure 7
Flood risk-assessment map over a part of Vratsa, Bulgaria. Source: Copernicus Emergency Management Service (© European Union, 2012–2021) [130].](/document/doi/10.1515/geo-2020-0325/asset/graphic/j_geo-2020-0325_fig_007.jpg)
Flood risk-assessment map over a part of Vratsa, Bulgaria. Source: Copernicus Emergency Management Service (© European Union, 2012–2021) [130].
![Figure 8
Temporal analysis of the February 2021 flood event at Münster, Germany. Source: Copernicus Emergency Management Service (© European Union, 2012–2021) [130].](/document/doi/10.1515/geo-2020-0325/asset/graphic/j_geo-2020-0325_fig_008.jpg)
Temporal analysis of the February 2021 flood event at Münster, Germany. Source: Copernicus Emergency Management Service (© European Union, 2012–2021) [130].
![Figure 9
Detailed Flood inundation delineation over Salzburg, Austria. Source: Copernicus Emergency Management Service (© European Union, 2012–2021) [130].](/document/doi/10.1515/geo-2020-0325/asset/graphic/j_geo-2020-0325_fig_009.jpg)
Detailed Flood inundation delineation over Salzburg, Austria. Source: Copernicus Emergency Management Service (© European Union, 2012–2021) [130].
![Figure 10
Flood impact-assessment map over Montereau-Fault-Yonne, France. Source: Copernicus Emergency Management Service (© European Union, 2012–2021) [130].](/document/doi/10.1515/geo-2020-0325/asset/graphic/j_geo-2020-0325_fig_010.jpg)
Flood impact-assessment map over Montereau-Fault-Yonne, France. Source: Copernicus Emergency Management Service (© European Union, 2012–2021) [130].
Besides, the Sentinel-2-captured imagery helps track potential areas such as waterlogged and contaminated places after flood events that have favorable conditions associated with the breeding of mosquitoes and the spread of diseases such as malaria. Moreover, Sentinel-2 is the first multispectral mission to have three bands in the red edge area as listed in Table 1 (Band 5–7), which provide crucial information on vegetation state and subclassify different crop types allowing a detailed impact assessment on agriculture after the floods [109].
6 Advantages and uses of Sentinel-3 for flood management
6.1 Advantages and uses of Sentinel-3 SRAL for flood management
The Sentinel-3 topography package is an evolution in satellite altimetry for topographic measurements over inland water bodies, including rivers, lakes, and reservoirs. SRAL onboard Sentinel-3 is the first satellite altimeter to provide 100% coverage over the land surface on Earth in SARM, resulting in enhanced along-track resolution of 300 m. Although the altimeter onboard CryoSat-2 also operates in SARM, its acquisition in the same mode is limited to only a few portions of the Earth, as presented here [110]. Moreover, SRAL is the first satellite altimeter to use an open-loop tracking system over the entire land surface on Earth, which uses a prior along-track surface elevation available on-board to position the range window accurately over the inland water bodies, as mentioned in Section 3.3.1. Thus, it provides an excellent potential for the altimeter to deliver authoritative measurements even over inhomogeneous or rough topography. The secondary onboard instruments MWR, GNSS, DORIS, and LRR contribute toward precise measurements as described in Section 3.3.1. In addition, the C-band allows for ionospheric correction by determining the electron content in the atmosphere that affects the radar signal path delay, whereas the Ku-band enables range measurements. Thus, encompassing all these advanced technologies and techniques, the Sentinel-3 altimeter assists in obtaining accurate water level measurements, which could be a highly reliable source of information at various phases of flood management. A significant number of studies have already successfully proved the potential of Sentinel-3 altimeter data for precise water level measurements over major rivers [111,112,113]. Besides, the 300 m along-track resolution of SRAL in SARM facilitates the measurements of a vast number of narrow rivers and small lakes or inundated footprints across the globe for detailed information compared to other satellite altimeters. Moreover, discharge estimates from altimetry-based water depths have been in practice for a long time now. Popular approaches include utilizing rating curves developed between altimeter-derived water depths and gauge-based discharge measurements, using empirical equations if cross-sectional geometry and or roughness of the channel is available or can be estimated, and utilizing hydraulic and hydrologic models. Moreover, the optical/NIR bands of the optical sensors (OLCI, SLSTR) on board Sentinel-3 can be combined with the SRAL altimeter data for river discharge estimation using either empirical formulae, simplified hydraulic models, or machine learning, as explained in detail in an earlier study [114]. In conclusion, three primary sensors (SLSTR, SRAL, and OLCI) colocated on the same platform of Sentinel-3 are an added advantage providing a broad scope for river discharge monitoring [114]. Besides, the open and free data distribution policy of Sentinel-3 altimeter data to all the users provides scope for wide usage in research and continuous operational use, including initiation and expansion of water-level databases at a global scale as listed in Section 2. With two satellites (S-3A and S-3B) in the current constellation of Sentinel-3 mission, it provides the intertrack distance of 52 km at 27 days repeat cycle, one of the best available optimum combinations listed in Table A3 in Appendix. Furthermore, the addition of two more satellites (S-3C and S-3D) in the constellation in the near future, as mentioned in Section 3.3, would further increase its coverage and also provide long-term operational measurements of at least two decades, which would make this mission much more felicitous in the field of hydrological studies, including flood management. Besides, the Sentinel-3 HR altimeter-derived heights can be used to synergistically merge with the existing DEMs globally, such as Shuttle Radar Topography Mission (SRTM) DEM, to improve their accuracy further since the nature of instruments used in the generation of those DEMs has some issues with areas such as rainforests and inland water bodies [115]. Consequently, it results in a comprehensive and accurate DEM as Altimeter Corrected Elevations, Version 2. These improved DEM products can be helpful in some of the applications mentioned in Section 4.
In the mitigation and preparedness phase of flood management, the long-term archives of past flood water depths help in the preparation of flood hazard maps. At the same time, the same information along with the vulnerable population information as discussed earlier in Section 5 would assist in identifying flood risk associated. Also, the continuous monitoring of water levels and or their associated discharge in rivers from radar altimeter would help in an early warning because the water levels can be effectively used as flood thresholds that define the starting stage of floods [116,117]. Moreover, the time series of SRAL-derived flood water depth information provides a great potential to understand the hydraulic functioning and physical process of rivers and flood plains that helps understand, design, and build model structures [81]. In addition, it could also be helpful in calibration and evaluation of hydraulic, hydrological, and hydrodynamic models, sequential assimilation in hydrodynamic models to find an optimal estimate of the water surface line, river discharge, and depths [83] and for stream flow modeling and forecasting at regular intervals [118,119,120]. The generated hazard and risk maps would help to find the prospect areas where flood disaster is most likely to occur along with its associated risk, thus helping find the locations where mitigation structures and other mitigation strategies are necessary. At the same time, the predictions of stream flow discharge and water depths from models would help identify and design the suitable mitigation structure that can withstand the anticipated floods to mitigate the disaster effectively. Moreover, the reliable forecasted stream flow discharges and water depths resulting from models would assist in preparedness by early warning, evacuation of people living in the prone areas, and emptying of reservoirs to accommodate the forecasted water flow, thereby reducing its impact. In the rescue and relief phase, the SRAL-derived flood water depth information with wide coverage and reasonable temporal resolution provides an opportunity to monitor the flood situation, whether rising, stable, or declining. Also, the spatial flood water depth information overlayed on true-earth image or LULC map along with route networks, as shown in Figures 8 and 9, would be a great asset in strategic planning for efficient rescuing and relief management. It includes prioritizing areas for rescuing based on the depth of flooded water, and its associated land use/population because regions with more flood water depths and the likelihood of more population need quick attention and prompt response due to more associated risk. In addition, it helps in identifying efficient relief camp locations and finding the best possible routes to reach the needy people and move them to relief camps. The rapid data dissemination facility of SRAL can provide data in the NRT timeline that corresponds to data delivery within 3 h of data acquisition, as mentioned in Section 3.3.1. It is an added advantage for rapid rescue and relief operations during the disaster without any delay. In the recovery phase, the flood inundation depths can infer damage caused based on the underneath land use or land cover, assisting in damage assessment. In addition, postflood, using flood depth information, the size of the flood that occurred: major, moderate, or minor, as mentioned in Section 1, can be deduced. Moreover, the time-series information of its evolution, along with other physical characteristics of the corresponding ground, helps to expand the knowledge on the physical process of the floods based on how it evolved, which allows researchers to improve the models. Furthermore, flood extents and depths and damage assessment reports help evaluate various flood statistics and the performance assessment of mitigation structures, which allows for improved planning and implementation for mitigation next time. This postflood knowledge contributes to floods policy making.
6.2 Advantages and uses of Sentinel-3 OLCI for flood management
The OLCI is designed to provide continuity to Envisat’s Medium Resolution Imaging Spectrometer (MERIS) with enhancements in the form of an increase in the number of spectral bands (from 15 to 21), improved long-term radiometric stability and performance, wide geographical coverage, quick revisit frequency, rapid data delivery, and ability to facilitate synergistic usage of OLCI and SLSTR products due to 100% overlap and simultaneous acquisition. The OLCI onboard Sentinel-3 constellation with a spatial resolution of 300 m in FR mode and revisit coverage frequency of fewer than 2 days over any land surface on the earth provides a compromise between spatial resolution of HR imaging optical sensors, such as MSI onboard Sentinel-2, LISS-IV onboard ResourceSat-2, and revisit coverage of optical sensors, such as MODIS, making it suitable for a wide range of applications in flood management. Although the coarser spatial resolution imagery may not be ideal for small-scale floods at a small/microwatershed level, its characteristics of higher revisit frequency and wide synoptic coverage that allows it to capture the larger area at once makes it stand out to consider as an option to serve their intended purpose efficiently for large-scale floods [22,23,24]. Also, as mentioned in Section 3.3, the two more identical satellites under this mission, Sentinel-3C and Sentinel-3D, which are about to be launched in the coming years, would further increase the revisit frequency for any given land surface on earth to less than 1 day and provide a scope to monitor floods rapidly on a RT basis at a continental and global scale [121,122]. In addition, the capability of the mission to deliver OLCI data in the NRT timeline, which implies data delivery within 3 h of acquisition, as mentioned in Section 3.3.2, makes it a predominant choice for rapid emergency responses. The RT flood extents would be a crucial source of information for rescue and relief operations. In addition, they provide capability to characterize inundation as it occurs, which is an important and economical enhancement to flood warning and flood response [23].
Same as flood extents derived from Sentinel-1 and Sentinel-2, the sequential delineation of flood extents from OLCI imagery will help in deriving large basin-scale flood inundation patterns, understanding, designing, and building model structures, providing information for flood forecasting systems and hydrodynamic models [123], and calibration and evaluation of hydraulic/hydrological models [81]. In addition, OLCI multispectral imagery can also be effectively used to retrieve soil moisture information such as Sentinel-2 MSI imagery. The retrieved soil moisture could be used as another input for flood forecasting models and helps in foreseeing flood characteristics as antecedent soil moisture conditions would have a considerable influence on it [86,87,88,89], as mentioned in Section 5. Besides, OLCI-derived LULC has fewer applications than Sentinel-2-derived LULC (see Section 5) due to its coarser spatial resolution resulting in fewer details. In the preparedness and mitigation phase, the OLCI-derived LULC maps at 300 m resolution have potential toward broader understanding, consequently designing and building large scale models to assimilate flood inundation forecasting models and hydraulic/hydrologic models since the different LULC classes have different runoff generation properties [102,103,104,105]. Eventually, long archives of flood spatial extents over an area, forecasted model results help generate flood hazard maps. The flood hazard maps in conjunction with OLCI-derived LULC and other thematic maps describing the geographical features of the earth, including DEM, lineament, geomorphology, slope, river channel network, route networks, can be used for flood risk assessment, spatial land use planning, and flood management policy making. Thus, helping in disaster preparedness and mitigation, including finding the prospect areas where flood mitigation structures are necessary and the type that suits the area of interest [106]. In the recovery phase, because LULC maps with a coarser resolution mostly contain the general and dominant classes, such as agricultural area, built-up area, barren land, and forest areas, the damage assessment in those particular classes can be done efficiently [124]. For instance, a substantial number of studies exist where coarser images are successfully used for damage assessment of crops [24,124,125] caused due to the floods. Moreover, the spectral definition of OLCI allows mapping a set of biophysical variables. Copernicus Global Land Service (https://land.copernicus.eu/global/themes/Vegetation) provides these products, including the Normalized Difference Vegetation Index (NDVI) that directly gives information on the vegetation coverage and health condition, at a global scale to all the users free of cost. These datasets are updated at regular intervals, dynamics of these products before the flood and after the flood help in the assessment of the effects of floods on vegetation. Similarly, the LULC-generated preflood and postflood would help in change detection to find the damaged areas for rapid rescue and rehabilitation operations and find the overall impact on various classes of the map.
However, due to the coarser resolution of 300 m, the derived flood extent, soil moisture information, and LULC map may not be accurate relative to the one derived from HR images due to higher omission and commission errors. For instance, its inability to capture small patches of flood inundation or, in fact, any other small features on the earth’s surface that are smaller than the size of the pixel results in more mixed pixels developing omission and commission errors in their respective maps. Nevertheless, a few techniques can be used to improve the resolution, including blending of Sentinel-3 OLCI images with HR images such as those acquired by Sentinel-2 MSI using data fusion models such as spatial and temporal adaptive reflectance fusion model and enhanced spatial and temporal adaptive reflectance fusion model to generate images with enhanced spatial, spectral, and temporal performance benefiting from the both [126,127]. Moreover, as discussed earlier, the cloud coverage may limit the optical sensors’ acquisition of true ground images, including floods on the earth’s surface in general. But due to the high revisit coverage frequency of the OLCI, this may not be a significant issue or relatively less compared to other optical sensors, including Sentinel-2. Hence, OLCI imagery can be used to complement Sentinel-2 imagery when they are not available due to relatively narrow swath width/ground coverage and less temporal resolution. Furthermore, the mixed-use of multiple time-series images of OLCI alone can be used to generate a cloud-free image as provided by NASA for MODIS products with 8 or 16 day composites images [128] as noted by many researchers [123,128].
7 Perspectives and conclusions
The fleet of Sentinel satellites began a new era in remote sensing technology by bringing a paradigm shift in the quality and quantity of Earth observations. For the first time in history, Sentinel-1, Sentinel-2, and Sentinel-3 satellites, under a single program (Copernicus), serving as a unified system carrying a range of state-of-the-art technologies for providing broad spectrum of earth observations globally and became a one-stop solution for most of the informational requirements in flood management as discussed in Sections 4, 5 and 6. Two satellites in all the above-mentioned mission constellations facilitate wide coverage and quick revisit times. Being active missions and plans to extend the same by addition of satellites in their respective constellations in the near future, these missions would continue to provide crucial information at an unprecedented level compared to its predecessors globally in the coming decades and dominate in various applications of flood management with further improvement in the coverage and revisit time. The rapid data dissemination ability of these satellites to provide data within hours of acquisition is another added advantage over its predecessors to aid emergency response during and immediately after a disaster. Besides, the open and free access of Sentinel-1, Sentinel-2, and Sentinel-3 data products to all its users (general public, scientific, and commercial) irrespective of their country has paved the roads for the researchers and flood managers, especially in low-income countries, lower-middle-income countries, and other places where acquiring HR data would have become an expensive affair and consequently hindered research and applications in the disaster management. Furthermore, open and free access to the complete long archives of this wealth of data has made machine learning and deep learning techniques popular and resulted in an escalation of big data inclusion in multiple aspects of disaster management studies and applications. Moreover, it is geared toward advancing web-based computing techniques and provided an excellent opportunity for research and applications on a continental and global scale at a higher resolution, including the generation of various HR thematic maps that are crucial at different phases of flood management. Overall, it built an immense scope for broad application and transferability, developing new techniques and methodologies bringing a step change in monitoring and understanding, thereby supporting effective policy making and management of the environment, including floods, to mitigate its adverse effects.
To summarize the distinctive features of the three Sentinels that make them advantageous in various flood management applications compared to its predecessors: Sentinel-1 is the only active SAR mission whose data is provided free of cost to all the users. With two satellites (S-1A and S-1B) working in its constellation, the Sentinel-1 has a high revisit frequency with a period of fewer than 6 days. Moreover, it attributes high spatial resolution, high spatio-temporal InSAR observations, global coverage, high reliability and operational stability, long-term observations (since the mission is planned to extend with two more satellites (S-1C and S-1D) soon), detailed DEM generation capability, and potential to disseminate data rapidly within 10 min to 24 h of observation based on the timeline chosen, which makes it advantageous and results in a high-end performance at various phases of flood management, as discussed in Section 4; Sentinel-2 characterizes global coverage and exhibits high-end performance with a high spatial resolution of 10 m in the visible (Band 2–4) and NIR (Band 8) spectral regions. It is the highest spatial resolution among all the multispectral satellite images that are freely available to the users. Sentinel-2 also has a high radiometric performance and a high revisit coverage frequency of fewer than 5 days. To add to it, the data is made available relatively quickly with rapid data dissemination within 100 min to 24 h after sensing based on the timeline opted. Its optimum spectral regions and widths in the atmospheric windows limit the influence of atmospheric constituents and enable aerosol and cirrus correction to produce true earth surface observations with less contamination. It is also the first mission to have bands in the red edge area to provide crucial information on the vegetation state; Sentinel-3 OLCI, unlike its counterparts 1 and 2, has a rational compromise between the spatial and temporal resolutions. It means, although Sentinel 3 provides data at a coarser resolution (300 m), it has a better revisit period of fewer than 2 days. As an added advantage, it provides data within 3 h of data acquisition in the NRT timeline. The Sentinel-3 SRAL, the first satellite altimeter to provide global land surface coverage in SARM, comes with an open-loop tracking system resulting in enhanced along-track resolution and accurate positioning of the range windows. In addition, a less inter-track distance of 52 km with 27 days repeat cycle by the two-satellite constellation makes it advantageous along with enhanced range measurements due to the complementary C-band measurements and other secondary instruments (MWR, GNSS, DORIS, and LRR). Both the OLCI and SRAL instruments have a potential for long-term observations and enhancement in the form of revisit coverage frequency with the Sentinel-3 mission planning to add two more satellites (S-3C and S-3D) in its constellation in the near future.
It is noted that some of the flood information can be obtained by two or more Sentinel satellites as in the case of flood extent and water depths, where the former can be obtained either using Sentinel-1 SAR or Sentinel-2 MSI or Sentinel-3 OLCI multispectral data, and the latter can be either retrieved using Sentinel-3 altimeter or Sentinel-1 InSAR data. However, all the three satellites have their authenticity and provide highly reliable performance concerning some of the applications. For instance, the primary authentic and widespread application of Sentinel-1 SAR data in flood management is mapping and monitoring floods. At the same time, Sentinel-2 multispectral images are widely in demand for flood risk and damage assessment, development of mitigation strategies, and preparation of various thematic layers, including a detailed LULC, as discussed in Section 5. At the same time, the Sentinel-3 altimeter is superior for flood water depths retrieval and monitoring. While the Sentinel-3 OLCI, with its high repetitive coverage, would complement both the Sentinel-1 and Sentinel-2 in various applications, as discussed in Section 6. Thus, the three satellites carrying different technologies are equally important for successful all-around reliable flood management, contributing in their ways and complementing each other at various phases of flood management, as discussed in Sections 4–6. Another notable effort of the EC as part of the Copernicus programme is establishing the Copernicus Emergency Management Service (CEMS; https://emergency.copernicus.eu/), which provides timely and accurate information for emergency response and disaster risk management. On-demand mapping, and early warning and monitoring are the two components of CEMS. In the context of floods, the former provides on-demand detailed geospatial information, including rapid mapping and risk and recovery mapping, which support flood management activities, including prevention, preparedness, risk reduction, and recovery phases. At the same time, the latter provides critical geospatial information at the European and global levels through continuous monitoring and flood forecasts for flood risk management using Global and European Flood Awareness Systems (GloFAS; EFAS). Moreover, ESA developed Sentinel Application Platform (SNAP) and Broadview Radar Altimetry Toolbox (jointly with French Space Agency [CNES]). These two toolboxes are open source and freely available to the users, providing a simple and ideal environment for Sentinel data processing and analysis. Furthermore, SNAP facilitates SAR and optical data processing automation as per the user commands either by using Graph Builder, Graph Processing Tool, or SNAP APIs, as explained in detail in an earlier study [129]. Thus, it gives an immense opportunity for rapid data processing that is crucial for NRT applications, including rapid disaster response as utilized by Kuntla and Manjusree [29]. Besides, a few future Sentinel missions under the Copernicus programme, LSTM, and ROSE-L [130] can contribute to flood-related research and management with their unique contributions and complement the existing one. For instance, ROSE-L, an L-band SAR, has the potential to provide all the information that Sentinel-1 C-band SAR does at various phases of flood management, as mentioned in this article, with a major additional capability to penetrate through vegetation that helps in accurate mapping of inundation underneath the foliage. Hence, it becomes advantageous in vegetation-dominated areas.
Acknowledgements
The author highly appreciates the European Commission and European Space Agency (ESA) for initiating the ambitious Earth observation programme “Copernicus”. At the same time, the author would like to thank the handling editors and the anonymous reviewers for providing valuable comments, which significantly improved the quality of this manuscript.
-
Funding information: This research received no external funding.
-
Conflict of interest: The author declares that there is no conflict of interest.
-
Data availability statement: The datasets analyzed during the current study are openly available in: (i) Emergency Events Database (EM-DAT) at https://public.emdat.be/ (ii) Copernicus Emergency Management Service at https://emergency.copernicus.eu/.
Appendix
Characteristics of selected satellite microwave SARs
| Satellite mission/SAR | Space agency | Active lifetime | Swath width (km) | Repeat cycle (nadir) (days) | Altitude (km) | Operational frequency | Polarization | Spatial resolution (Azimuth × Range res.) (m) |
|---|---|---|---|---|---|---|---|---|
| SEASAT | NASA | Jun 1978–Oct 1978 | 100 | 17 | 800 | L-band | SP (HH) | 25 × 25 |
| SIR-A | NASA | Nov 1981 (3 days) | 50 | — | 260 | L-band | SP (HH) | 40 × 40 |
| SIR-B | NASA | Oct 1984 (8 days) | 10–60 | — | 225 & 350 | L-band | SP (HH) | 17–58 × 25 |
| SIR-C/X-SAR | NASA | Apr 1994 and Sep 1994 (11 days each) | 15–90 | — | 225 | X-band | FP for L-band and C-band; SP (VV) for X-band | 30 × 10–30 |
| C-band | ||||||||
| L-band | ||||||||
| ERS-1, 2 | ESA | Jul 1991–Mar 2000, April 1995–Sep 2011 | 100 | 35 | 782 | C-band | SP (VV) | 30 × 26 |
| JERS-1 | JAXA | Feb 1992–Oct 1998 | 75 | 44 | 568 | L-band | SP (HH) | 18 × 18 |
| RADARSAT-1 | CSA | Nov 1995–Mar 2013 | 50–500 | 24 | 798 | C-band | SP (HH) | 8–100 × 8–100 |
| SRTM | NASA and NIIM | Feb 2000 (11 days) | X-50, C-225 | — | 225 | X-band | SP | 30 × 30 |
| C-band | ||||||||
| ENVISAT /ASAR | ESA | Mar 2002–Apr 2012 | 5–405 | 35 | 800 | C-band | SP/DP | 30–1,000 × 30–,1000 |
| ALOS-1/PALSAR-1 | JAXA | Jan 2006–May 2011 | 30–350 | 46 | 692 | L-band | SP/DP/FP | 10–100 × 7–100 |
| RADARSAT-2 | CSA | Dec 2007–Present | 20–500 | 24 | 798 | C-band | FP | 3–100 × 2.4–100 |
| COSMO-SkyMed-1, -2, -3, -4 | ASI | Jun 2007, Dec 2007, Oct 2008, Nov 2010 till Present | 10–200 | 16 | 620 | X-band | SP/DP | ≤1–100 × ≤1–100 |
| TerraSAR-X, TanDEM-X | DLR | Jun 2007, Jun 2010 till Present | 5–260 | 11 | 514 | X-band | SP/DP | 0.2–18 × 1–40 |
| Risat-1 | ISRO | Apr 2012–Mar 2017 | 10–225 | 25 | 536 | C-band | SP/DP/FP | 1–50 × 0.67–8 |
| KOMPSat-5 | KARI | Aug 2013 | 5–100 | 28 | 550 | X-band | FP | 1–20 × 1–20 |
| S-1A, S-1B | ESA | Apr 2014, Apr 2016–Present | 20–400 | 12 | 693 | C-band | SP/DP | 5–20 × 5–40 |
| ALOS-2/PALSAR-2 | JAXA | May 2014–Present | 25–490 | 14 | 628 | L-band | SP/DP/FP | 1–100 × 3–100 |
| PAZ | INTA and Hisdesat | Feb 2018–Present | 5–100 | 11 | 514 | X-band | SP/DP | ≤1–16 × ≤ 1–6 |
| SOACOM-1A, -1B | CONAE | Oct 2018, Aug 2020 till Present | 30–350 | 16 | 620 | L-band | SP/DP/FP | 10–100 × 10–100 |
Swath width, spatial resolution, and polarization will depend on its respective acquisition modes, due to which these parameters are not definite corresponding to few satellites. SP, single polarization; DP, dual polarization; and FP, full/quad polarization.
Characteristics of selected satellite multispectral optical sensors
| Satellite mission | Optical sensor | Space agency | Active lifetime | Altitude (km) | Repeat cycle (nadir) (days) | No. of spectral bands/spectral range (µm) | Spatial resolution (m) |
|---|---|---|---|---|---|---|---|
| Landsat-1, -2, -3 | MSS | NASA | Jul 1972–Jan 1978, Jan 1975–Feb 1982, and Mar 1978–Mar 1983 | 907, 908, 915 | 18 | 4/(0.5–1.1) | 80 |
| Landsat-4, -5 | TM | NASA, NOAA | Jul 1982–Jun 2001, Mar 1984–Jan 2013 | 705 | 16 | 6/(0.45–12.5) | 30 |
| ERS-1, -2 | ERS-1: ATSR-1 | ESA | Jul 1991–Mar 2000, Apr 1995–Jul 2011 | 782 | 35 | ATSR-1: 4/(1.6–12) | 1,000 |
| ERS-2: ATSR-2 | ATSR-2: 7/(0.55–12) | ||||||
| ENVISAT | MERIS | ESA | Mar 2002–Apr 2012 | 800 | 35 | 15/(0.412–0.9) | 300/1,200 |
| ALOS | AVNIR-2 | JAXA | Jan 2006–May 2011 | 692 | 46 | 4/(0.42–0.89) | 10 |
| WorldView-2 | WorldView-110 | Digital Globe | Oct 2009 till Present | 700 | 14 | 8/(0.4–1.04) | 1.8 |
| WorldView-4 | SpaceView-110 | Digital Globe | Nov 2016–Jan 2019 | 617 | — | 4/(0.45–0.92) | 1.24 |
| Landsat-7 | ETM+ | NASA, USGS | Apr 1999 till Present | 705 | 16 | 8/(0.45–2.35) | 15, 30 |
| Landsat-8 | OLI, TIRS | NASA, USGS | May 2013 till Present | 705 | 16 | OLI: 9/(0.43–2.29) | OLI: 15, 30 |
| TIRS: 2/(10.6–12.51) | TIRS: 100 | ||||||
| IRS-P6/ResourceSat-1, -2, -2A | LISS-III, LISS-IV, AWiFS | Indian Space Research Organisation (ISRO) | Oct 2003, Apr 2011, Dec 2016 till Present | 817 | 24 | LISS-III: 4/(0.52–1.70) | LISS-III: 23.5 |
| LISS-IV: 3/(0.52–0.86) | LISS-IV: 5.8 | ||||||
| AWiFS: 4/(0.52–1.70) | AWiFS: 56 | ||||||
| Cartosat-2C, -2D, -2E, -2F | HRMX | ISRO | Jun 2016, Feb 2017, Jun 2017, Jan 2018 till Present | 505 | — | 4/(0.47–0.9) | 2 |
| NOAA-6 to -19 POES | AVHRR | NOAA | Launch: 1979 to 2009 | 804–870 | — | NOAA-6, -8, -10: 4/(0.58–11.5) | 1,000 |
| Currently Active: NOAA-15, -18, -19 | NOAA-7, -9, -11, -12, -14: 5/(0.58–12.5) | ||||||
| NOAA-15, -16, -17, -18, -19: 6/(0.58–12.5) | |||||||
| SPOT-1, -2, -3 | HRV | CNES | Feb 1986–Nov 2003, Jan 1990–Jul 2009, Sep 1993–Nov 1996 | 832 | 26 | 3/(0.50–0.89) | 20 |
| SPOT-6, -7 | NAOMI | CNES | Sep 2012, Jun 2014 till Present | 694 | 26 | 4/(0.45–0.89) | 6 |
| Nimbus-7 | CZCS | NASA | Oct 1978–Aug 1994 | 947 | — | 6/(0.433–12.5) | 825 |
| Terra | MODIS | NASA, Japan | Dec 1999 till Present | 705 | 16 | MODIS: 36/(0.405–14.385) | MODIS: 250, 500, 1,000 |
| ASTER | ASTER: 14/(0.520–11.650) | ASTER:15, 30, 90 | |||||
| S-2A, S-2B | MSI | ESA | Jun 2015, Mar 2017 till Present | 786 | 10 | 13/(0.442–2.202) | 10, 20, 60 |
Characteristics of satellite altimetry missions
| Satellite mission | Altimeter | Space agency | Active lifetime | Altitude (km) | Operational frequency | Repeat cycle (days) | Equatorial intertrack distance (km) |
|---|---|---|---|---|---|---|---|
| Skylab | S193 | NASA | May 1973–Feb 1974 | 435 | Ku-band | — | — |
| GEOS 3 | ALT | NASA | Apr 1975–Jul 1979 | 843 | Ku and C-band | — | — |
| SeaSat | ALT | NASA | Jun 1978–Oct 1978 | 800 | Ku-band | 17 | — |
| Geosat | GRA | US Navy | Mar 1985–Jan 1990 | 800 | Ku-band | 17 | 165 |
| ERS-1 | RA | ESA | Jul 1991–Mar 2000 | 782 | Ku-band | 35 | 80 |
| Topex | Poseidon | NASA and CNES | Aug 1992–Oct 2005 | 1,336 | Ku-band and C-band | 10 | 315 |
| ERS-2 | RA | ESA | Apr 1995–Jul 2011 | 782 | Ku-band | 35 | 80 |
| GFO | GFO-RA | US Navy and NOAA | Feb 1998–Oct 2008 | 800 | Ku-band | 17 | 165 |
| Jason-1 | Poseidon-2 | CNES and NASA | Dec 2001–Jun 2013 | 1,336 | Ku-band and C-band | 10 | 315 |
| ENVISAT | RA-2 | ESA | Mar 2002–Apr 2012 | 800 | Ku-band and S-band | 35 | 80 |
| Jason-2 | Poseidon-3 | CNES, NASA, Eumetsat and NOAA | Jun 2008 till Present | 1,336 | Ku-band and C-band | 10 | 315 |
| CryoSat-2 | SIRAL | ESA | Apr 2010 till Present | 720 | Ku-band | 369 | 7.5 |
| HY-2A | RA | CNSA | Aug 2011 till Present | 971 | Ku-band and C-band | 14, 168 | — |
| SARAL | AltiKa | ISRO and CNES | Feb 2013 till Present | 800 | Ka-band | 35 | 80 |
| Jason-3 | Poseidon-3B | CNES, NASA, Eumetsat, and NOAA | Jan 2016 till Present | 1,336 | Ku-band and C-band | 10 | 315 |
| Sentinel-3A, -3B Constellation | SRAL | ESA | Feb 2016, Apr 2018 till Present | 814 | Ku-band and C-band | 27 | 52 |
| HY-2B | RA | CNSA | Oct 2018 till Present | 971 | Ku-band and C-band | 14, 168 | 207.6, 17.3 |
| HY-2C | RA | CNSA | Sep 2020 till Present | 1,336 | Ku-band and C-band | 10, 400 | 292.5, 7.3 |
| HY-2D | RA | CNSA | May 2021till Present | 1,336 | Ku-band and C-band | 10, 400 | 292.5, 7.3 |
References
[1] CRED. EM-DAT n.d. https://public.emdat.be/ (accessed May 18, 2021).Search in Google Scholar
[2] Seneviratne SI, Nicholls N, Easterling D, Goodess CM, Kanae S, Kossin J, et al. Changes in climate extremes and their impacts on the natural physical environment. In Field CB, Barros V, Stocker TF, Dahe Q, editors. Managing the Risks of Extreme Events and Disasters to Advance Climate Change Adaptation. Cambridge: Cambridge University Press; 2012. p. 109–230. 10.1017/CBO9781139177245.006.Search in Google Scholar
[3] World Health Organization. Floods n.d. https://www.who.int/westernpacific/health-topics/floods (accessed May 17, 2021).Search in Google Scholar
[4] Bureau of Meteorology AG. National Weather and Warnings Information n.d. http://www.bom.gov.au/australia/warnings/#PreviousFlooding (accessed May 19, 2021).Search in Google Scholar
[5] Office of the Queensland Chief Scientist QG. What is a flood? 2018. https://www.chiefscientist.qld.gov.au/publications/understanding-floods/what-is-a-flood (accessed May 19, 2021).Search in Google Scholar
[6] Deutsch M. Optical processing of ERTS data for determining extent of 1973 Mississippi River flood. ERTS-1 a new window on our planet. U. S. Geological Survey. United States Government Printing Office. Washington; 1976. p. 209–14. https://pubs.usgs.gov/pp/0929/report.pdf (accessed May 29, 2021).Search in Google Scholar
[7] Deutsch M, Ruggles FH, Guss P, Yost E. Mapping the 1973 mississippi river floods from the earth resource technology satellites. Proceedings of International Symposium on Remote Sensing and Water Resource Management. Burlington, Ontario: American Water Resources Association; 1973. p. 39–55.Search in Google Scholar
[8] Hallberg GR, Hoyer BE, Rango A. Application of ERTS-1 imagery to flood inundation mapping. Symposium on Significant Results Obtained from the Earth Resources Technology Satellite-1. Vol. 1. Maryland: NASA; March 1973. p. 745–53.Search in Google Scholar
[9] Morrison RB, Cooley ME. Assessment of flood damage in Arizona by means of ERTS-1 imagery. Symposium on Significant Results obtained from the Earth Resources Technology Satellite-1. Vol. 1. Maryland: NASA; March 1973. p. 755–60.Search in Google Scholar
[10] Rango A, Salomonson VV. Regional flood mapping from space. Water Resour Res. 1974;10:473–84. 10.1029/WR010i003p00473.Search in Google Scholar
[11] McGinnis DF, Rango A. Earth resources satellite systems for flood monitoring. Geophys Res Lett. 1975;2:132–5. 10.1029/GL002i004p00132.Search in Google Scholar
[12] Morrison RB, White PG. Monitoring flood inundation. ERTS-1 a new window on our planet. U. S. Geological Survey. United States Government Printing Office. Washington; 1976. p. 196–208. https://pubs.usgs.gov/pp/0929/report.pdf (accessed May 29, 2021).Search in Google Scholar
[13] Imhoff ML, Vermillion C, Story MH, Choudhury AM, Gafoor A, Polcyn F. Monsoon flood boundary delineation and damage assessment using space borne imaging radar and Landsat data. Photogramm Eng Remote Sens. 1987;53:405–13.Search in Google Scholar
[14] Dey B, Moore H, Gregory AF. The use of satellite imagery for monitoring ice break-up along the mackenzie river, NWT. Arctic. 1977;30:234–42.10.14430/arctic2704Search in Google Scholar
[15] Sherstone KC, Arnold KC, Mackay DK. Limits of ERTS imagery as a tool for studying the break-up of the Mackenzie River, NWT: experiences in 1973 and 1974. Proceedings of Symposium on Remote Sensing Photo Interpretation. Banff, Alberta: Canadian Institute of Surveying; 1974. p. 403–16.Search in Google Scholar
[16] Rango A, Anderson AT. Flood hazard studies in the mississippi river basin using remote sensing1. JAWRA J Am Water Resour Assoc. 1974;10:1060–81. 10.1111/j.1752-1688.1974.tb00625.x.Search in Google Scholar
[17] Edwardo HA, Moulis FR, Merry CJ, McKim HL, Kerber AG, Miller MA. Ohio River main stem study – The role of geographic information systems and remote sensing in flood damage assessments. Eighteenth International Symposium on Remote Sensing of Environment. Vol. 1. Paris, France: Environmental Research Institute of Michigan; 1984. p. 265–81.Search in Google Scholar
[18] Kerber AG, Gervin JC, Lu Y-C, Ryerson W, Marcell R. Floodplain land cover mapping using Thematic Mapper data. Proceedings of US Army Corps Engineering IV Remote Sensing Symposium. Reston, VA: 1983. p. 421–8.Search in Google Scholar
[19] Barton IJ, Bathols JM. Monitoring floods with AVHRR. Remote Sens Environ. 1989;30:89–94. 10.1016/0034-4257(89)90050-3.Search in Google Scholar
[20] Islam MM, Sado K. Development of flood hazard maps of Bangladesh using NOAA-AVHRR images with GIS. Hydrol Sci J. 2000;45:337–55. 10.1080/02626660009492334.Search in Google Scholar
[21] Chidley TRE, Drayton RS. The use of SPOT-simulated imagery in hydrological mapping. Int J Remote Sens. 1986;7:791–9. 10.1080/01431168608954735.Search in Google Scholar
[22] Wiesnet DR, Deutsch M. Flood monitoring in South America from the Landsat NOAA and nimbus satellites. Adv Space Res. 1987;7:77–84. 10.1016/0273-1177(87)90127-X.Search in Google Scholar
[23] Brakenridge R, Anderson E. Modis-based flood detection, mapping and measurement: the potential for operational hydrological applications. In Marsalek J, Stancalie G, Balint G, editors. Transboundary Floods: Reducing Risks Through Flood Management. Dordrecht: Springer Netherlands; 2006. p. 1–12. 10.1007/1-4020-4902-1_1.Search in Google Scholar
[24] Dao PD, Liou Y-A. Object-based flood mapping and affected rice field estimation with landsat 8 OLI and MODIS data. Remote Sens. 2015;7:5077–97. 10.3390/rs70505077.Search in Google Scholar
[25] Jain SK, Singh RD, Jain MK, Lohani AK. Delineation of flood-prone areas using remote sensing techniques. Water Resour Manag. 2005;19:333–47. 10.1007/s11269-005-3281-5.Search in Google Scholar
[26] Wang Y. Using Landsat 7 TM data acquired days after a flood event to delineate the maximum flood extent on a coastal floodplain. Int J Remote Sens. 2004;25:959–74. 10.1080/0143116031000150022.Search in Google Scholar
[27] Caballero I, Ruiz J, Navarro G. Sentinel-2 satellites provide near-real time evaluation of catastrophic floods in the west mediterranean. Water. 2019;11:2499. 10.3390/w11122499.Search in Google Scholar
[28] Goffi A, Stroppiana D, Brivio PA, Bordogna G, Boschetti M. Towards an automated approach to map flooded areas from Sentinel-2 MSI data and soft integration of water spectral features. Int J Appl Earth Obs Geoinformation. 2020;84:101951. 10.1016/j.jag.2019.101951.Search in Google Scholar
[29] Kuntla SK, Manjusree P. Development of an automated tool for delineation of flood footprints from sar imagery for rapid disaster response: a case study. J Indian Soc Remote Sens. 2020;48:935–44. 10.1007/s12524-020-01125-4.Search in Google Scholar
[30] Calla OPN. Microwave sensors (present and future). Proc Indian Acad Sci Sect C Eng Sci. 1983;6:109–19. 10.1007/BF02842928.Search in Google Scholar
[31] Hall DK. A review of the utility of remote sensing in alaskan permafrost studies. IEEE Trans Geosci Remote Sens. 1982;GE-20:390–4. 10.1109/TGRS.1982.350460.Search in Google Scholar
[32] Skolnik MI. A perspective of synthetic aperture radar for remote sensing. Washington, DC: Naval Research Lab; 1978.Search in Google Scholar
[33] Bonansea E. Mapping of 1994 flood in piedmonte region: an example of remote sensing and GIS application. Frascati – Italy: ESRIN, ESA; 1995.Search in Google Scholar
[34] Oberstadler R, Hönsch H, Huth D. Assessment of the mapping capabilities of ERS-1 SAR data for flood mapping: a case study in Germany. Hydrol Process. 1997;11:1415–25. 10.1002/(SICI)1099-1085(199708)11:10<1415: AID-HYP532 > 3.0.CO;2-2.Search in Google Scholar
[35] Profeti G, Macintosh H. Flood management through LANDSAT TM and ERS SAR data: a case study. Hydrol Process. 1997;11:1397–408. 10.1002/(SICI)1099-1085(199708)11:10<1397:AID-HYP530>3.0.CO;2-Y.Search in Google Scholar
[36] Wang Y, Koopmans BN, Pohl C. Cover The 1995 flood in The Netherlands monitored from space – a multi-sensor approach. Cover The 1995 flood in The Netherlands monitored from space – a multi-sensor approach. Int J Remote Sens. 1995;16:2735–9. 10.1080/01431169508956399.Search in Google Scholar
[37] Lowry RT, Langham EJ, Mudry N. A preliminary analysis of SAR mapping of the Manitoba Flood, May 1979. 5th William T. Pecora Memorial. Remote Sensing Symposium. Sioux Falls, South Dakota: American Water Resources Association; 1981. p. 316–23.Search in Google Scholar
[38] Ormsby JP, Blanchard BJ, Blanchard AJ. Detection of lowland flooding using active microwave systems. Photogramm Eng Remote Sens. 1985;51:317–28.Search in Google Scholar
[39] Pope KO, Sheffner EJ, Linthicum KJ, Bailey CL, Logan TM, Kasischke ES, et al. Identification of central Kenyan Rift Valley Fever virus vector habitats with landsat TM and evaluation of their flooding status with airborne imaging radar. Remote Sens Environ. 1992;40:185–96. 10.1016/0034-4257(92)90002-2.Search in Google Scholar
[40] Limlahapun P, Fukui H. Flood monitoring and early warning system integrating object extraction tool on web-based. 2009 ICCAS-SICE; 2009. p. 2639–43.Search in Google Scholar
[41] Matgen P, Schumann G, Henry J-B, Hoffmann L, Pfister L. Integration of SAR-derived river inundation areas, high-precision topographic data and a river flow model toward near real-time flood management. Int J Appl Earth Obs Geoinformation. 2007;9:247–63. 10.1016/j.jag.2006.03.003.Search in Google Scholar
[42] Borah SB, Sivasankar T, Ramya MNS, Raju PLN. Flood inundation mapping and monitoring in Kaziranga National Park, Assam using Sentinel-1 SAR data. Environ Monit Assess. 2018;190:520. 10.1007/s10661-018-6893-y.Search in Google Scholar PubMed
[43] Henry J-B, Chastanet P, Fellah K, Desnos Y-L. Envisat multi-polarized ASAR data for flood mapping. Int J Remote Sens. 2006;27:1921–9. 10.1080/01431160500486724.Search in Google Scholar
[44] Martinis S, Twele A. A hierarchical spatio-temporal markov model for improved flood mapping using multi-temporal X-band SAR data. Remote Sens. 2010;2:2240–58. 10.3390/rs2092240.Search in Google Scholar
[45] Bonn F, Dixon R. Monitoring flood extent and forecasting excess runoff risk with RADARSAT-1 data. Nat Hazards. 2005;35:377–93. 10.1007/s11069-004-1798-1.Search in Google Scholar
[46] Brakenridge GR, Tracy BT, Knox JC. Orbital SAR remote sensing of a river flood wave. Int J Remote Sens. 1998;19:1439–45. 10.1080/014311698215559.Search in Google Scholar
[47] Havivi S, Rotman SR, Blumberg DG, Maman S. Damage assessment mapping of rural environments; integration of SAR and Optical data. Copernicus Meetings; 2021. 10.5194/egusphere-egu21-9202.Search in Google Scholar
[48] Balenzano A, Mattia F, Satalino G, Davidson MWJ. Dense temporal series of C- and L-band SAR data for soil moisture retrieval over agricultural crops. IEEE J Sel Top Appl Earth Obs Remote Sens. 2011;4:439–50. 10.1109/JSTARS.2010.2052916.Search in Google Scholar
[49] Chen Z, Banks S, Behnamian A, White L, Montpetit B, Pasher J, et al. Characterizing the great lakes coastal wetlands with InSAR observations from X-, C-, and L-band sensors. Can J Remote Sens. 2020;46:765–83. 10.1080/07038992.2020.1867974.Search in Google Scholar
[50] Currey DT. Identifying flood water movement. Remote Sens Environ. 1977;6:51–61. 10.1016/0034-4257(77)90019-0.Search in Google Scholar
[51] Matgen P, Schumann G, Pappenberger F, Pfister L. Sequential assimilation of remotely sensed water stages in flood inundation models. Proceedings of IAHS Symposium Sensing for Environmental Monitoring and Change Detection. Perugia, Italy: IAHS Press; 2007. p. 78–88.Search in Google Scholar
[52] Schumann G, Hostache R, Puech C, Hoffmann L, Matgen P, Pappenberger F, et al. High-resolution 3-D flood information from radar imagery for flood hazard management. IEEE Trans Geosci Remote Sens. 2007;45:1715–25. 10.1109/TGRS.2006.888103.Search in Google Scholar
[53] Wdowinski S, Kim S-W, Amelung F, Dixon TH, Miralles-Wilhelm F, Sonenshein R. Space-based detection of wetlands’ surface water level changes from L-band SAR interferometry. Remote Sens Environ. 2008;112:681–96. 10.1016/j.rse.2007.06.008.Search in Google Scholar
[54] Brooks RL. Lake elevation from satellite radar altimetry from a validation area in Canada. Salibury, Maryland, USA: GeoScience Research Corporation; 1982.Search in Google Scholar
[55] Miller LS. Topographic and backscatter characteristics of Geos 3 overland data. J Geophys Res Solid Earth. 1979;84:4045–54. 10.1029/JB084iB08p04045.Search in Google Scholar
[56] Koblinsky CJ, Clarke RT, Brenner AC, Frey H. Measurement of river level variations with satellite altimetry. Water Resour Res. 1993;29:1839–48. 10.1029/93WR00542.Search in Google Scholar
[57] Berry PAM, Wheeler JL. Development of algorithms for the exploitation of JASON2-ENVISAT altimetry for the generation of a river and lake product. Leicester, UK: De Montfort University; 2009.Search in Google Scholar
[58] Crétaux J-F, Arsen A, Calmant S, Kouraev A, Vuglinski V, Bergé-Nguyen M, et al. SOLS: a lake database to monitor in the Near Real Time water level and storage variations from remote sensing data. Adv Space Res. 2011;47:1497–507. 10.1016/j.asr.2011.01.004.Search in Google Scholar
[59] Birkett C, Reynolds C, Beckley B, Doorn B. From research to operations: The USDA global reservoir and lake monitor. In Vignudelli S, Kostianoy AG, Cipollini P, Benveniste J, editors. Coast. Altimetry, Berlin, Heidelberg: Springer; 2011. p. 19–50. 10.1007/978-3-642-12796-0_2. Search in Google Scholar
[60] Schwatke C, Dettmering D, Bosch W, Seitz F. DAHITI – an innovative approach for estimating water level time series over inland waters using multi-mission satellite altimetry. Hydrol Earth Syst Sci. 2015;19:4345–64. 10.5194/hess-19-4345-2015.Search in Google Scholar
[61] Birkett CM, Ricko M, Beckley BD, Yang X, Tetrault RL. G-REALM: a lake/reservoir monitoring tool for drought monitoring and water resources management. AGU Fall Meet. 2017. New Orleans: American Geophysical Union; 2017.Search in Google Scholar
[62] Woolway RI, Kraemer BM, Lenters JD, Merchant CJ, O’Reilly CM, Sharma S. Global lake responses to climate change. Nat Rev Earth Environ. 2020;1:388–403. 10.1038/s43017-020-0067-5.Search in Google Scholar
[63] CGLS. Copernicus Global Land Operational Service. Water Level n.d. https://land.copernicus.eu/global/products/wl (accessed June 14, 2021).Search in Google Scholar
[64] ESA. Sentinel-1- Observation Scenario. Sentinel n.d. https://sentinel.esa.int/web/sentinel/missions/sentinel-1/observation-scenario (accessed June 4, 2021).Search in Google Scholar
[65] Sentinel-1C radar antenna has spread its wings for the first time. Airbus 2020. https://www.airbus.com/newsroom/press-releases/en/2020/08/sentinel1c-radar-antenna-has-spread-its-wings-for-the-first-time.html (accessed June 29, 2021).Search in Google Scholar
[66] ESA. User Guides – Sentinel-1 SAR – Acquisition Modes. Sentin Online – Sentin n.d. https://sentinel.esa.int/web/sentinel/user-guides/sentinel-1-sar/acquisition-modes (accessed June 6, 2021).Search in Google Scholar
[67] ESA. Products and Algorithms – Sentinel-1 SAR Technical Guide. Sentin Online – Sentin n.d. https://sentinel.esa.int/web/sentinel/technical-guides/sentinel-1-sar/products-algorithms (accessed June 8, 2021).Search in Google Scholar
[68] ESA. Sentinel-1 – Data Distribution Schedule – Missions. Sentin Online – Sentin n.d. https://sentinel.esa.int/web/sentinel/missions/sentinel-1/data-distribution-schedule (accessed June 28, 2021).Search in Google Scholar
[69] SUHET. Sentinel-2 User Handbook 2015.Search in Google Scholar
[70] ESA. Orbit – Sentinel-3 – Mission. Sentin Online – Sentin n.d. https://sentinels.copernicus.eu/web/sentinel/missions/sentinel-3/satellite-description/orbit (accessed June 26, 2021).Search in Google Scholar
[71] ESA. Products and Algorithms – Sentinel-3 Altimetry Technical Guide. Sentin Online – Sentin n.d. https://sentinels.copernicus.eu/web/sentinel/technical-guides/sentinel-3-altimetry/products-algorithms (accessed June 26, 2021).Search in Google Scholar
[72] EUMETSAT. Sentinel-3 SRAL Marine User Handbook 2017.Search in Google Scholar
[73] ESA. User Guides – Sentinel-3 Synergy – Sentinel Online – Sentinel. Sentin Online – Sentin n.d. https://sentinel.esa.int/web/sentinel/user-guides/sentinel-3-synergy (accessed June 24, 2021).Search in Google Scholar
[74] Qiu J, Cao B, Park E, Yang X, Zhang W, Tarolli P. Flood monitoring in rural areas of the pearl river basin (China) using sentinel-1 SAR. Remote Sens. 2021;13:1384. 10.3390/rs13071384.Search in Google Scholar
[75] Matgen P, Martinis S, Wagner W, Freeman V, Zeil P, McCormick N. Feasibility assessment of an automated, global, satellite-based flood monitoring product for the Copernicus Emergency Management Service. Luxembourg: Publications Office of the European Union; 2020.Search in Google Scholar
[76] Torres R, Lokas S, Di Cosimo G, Geudtner D, Bibby D. Sentinel 1 evolution: Sentinel-1C and -1D models. 2017 IEEE International Geoscience and Remote Sensing Symposium, IGARSS; 2017. p. 5549–50. 10.1109/IGARSS.2017.8128261.Search in Google Scholar
[77] Liao H, Wdowinski S, Li S. Regional-scale hydrological monitoring of wetlands with Sentinel-1 InSAR observations: case study of the South Florida Everglades. Remote Sens Environ. 2020;251:112051. 10.1016/j.rse.2020.112051.Search in Google Scholar
[78] Braun A. Retrieval of digital elevation models from Sentinel-1 radar data – open applications, techniques, and limitations. Open Geosci. 2021;13:532–69. 10.1515/geo-2020-0246.Search in Google Scholar
[79] Cohen S, Brakenridge GR, Kettner A, Bates B, Nelson J, McDonald R, et al. Estimating floodwater depths from flood inundation maps and topography. JAWRA J Am Water Resour Assoc. 2018;54:847–58. 10.1111/1752-1688.12609.Search in Google Scholar
[80] Shastry A, Durand M. Utilizing flood inundation observations to obtain floodplain topography in data-scarce regions. Front Earth Sci. 2019;6:243. 10.3389/feart.2018.00243.Search in Google Scholar
[81] Schumann G, Bates PD, Horritt MS, Matgen P, Pappenberger F. Progress in integration of remote sensing–derived flood extent and stage data and hydraulic models. Rev Geophys. 2009;47:47. 10.1029/2008RG000274.Search in Google Scholar
[82] Surwase T, Manjusree P, Prakash S, Kuntla S. Development of algorithms for evaluating performance of flood simulation models with satellite-derived flood. H2Open J. 2020;3:222–35. 10.2166/h2oj.2020.117.Search in Google Scholar
[83] Andreadis KM, Clark EA, Lettenmaier DP, Alsdorf DE. Prospects for river discharge and depth estimation through assimilation of swath-altimetry into a raster-based hydrodynamics model. Geophys Res Lett. 2007;34:34. 10.1029/2007GL029721.Search in Google Scholar
[84] Benninga H-JF, van der Velde R, Su Z. Sentinel-1 soil moisture content and its uncertainty over sparsely vegetated fields. J Hydrol X. 2020;9:100066. 10.1016/j.hydroa.2020.100066.Search in Google Scholar
[85] Mirsoleimani HR, Sahebi MR, Baghdadi N, El Hajj M. Bare soil surface moisture retrieval from sentinel-1 SAR data based on the calibrated IEM and dubois models using neural networks. Sensors. 2019;19:3209. 10.3390/s19143209.Search in Google Scholar PubMed PubMed Central
[86] Basara JB. Soil moisture observations for flash flood research and prediction. In Gruntfest E, Handmer J, editors. Coping Flash Floods. Dordrecht: Springer Netherlands; 2001. p. 231–41. 10.1007/978-94-010-0918-8_22.Search in Google Scholar
[87] Grillakis MG, Koutroulis AG, Komma J, Tsanis IK, Wagner W, Blöschl G. Initial soil moisture effects on flash flood generation – A comparison between basins of contrasting hydro-climatic conditions. J Hydrol. 2016;541:206–17. 10.1016/j.jhydrol.2016.03.007.Search in Google Scholar
[88] Nied M. The role of soil moisture and weather patterns for flood occurrence and characteristics at the river basin scale. Potsdam: Universität Potsdam; 2016.Search in Google Scholar
[89] Zepp H. The significance of soil moisture in forecasting characteristics of flood events. A statistical analysis in two nested catchments. J Hydrol Hydromech. 2017;66:1–11. 10.1515/johh-2017-0037.Search in Google Scholar
[90] Dadhich G, Miyazaki H, Babel M. Applications of SENTINEL-1 synthetic aperture radar imagery for floods damage assessment: a case study of nakhon SI Thammarat, Thailand. ISPRS – Int Arch Photogramm Remote Sens Spat Inf Sci. 2019;4213:1927–31. 10.5194/isprs-archives-XLII-2-W13-1927-2019.Search in Google Scholar
[91] Plank S. Rapid damage assessment by means of multi-temporal sar – a comprehensive review and outlook to Sentinel-1. Remote Sens. 2014;6:4870–906. 10.3390/rs6064870.Search in Google Scholar
[92] Kim S-W, Hong S-H, Won J-S. An application of L-band synthetic aperture radar to tide height measurement. IEEE Trans Geosci Remote Sens. 2005;43:1472–8. 10.1109/TGRS.2005.846857.Search in Google Scholar
[93] Marfai MA, King L. Coastal flood management in Semarang, Indonesia. Environ Geol. 2008;55:1507–18. 10.1007/s00254-007-1101-3.Search in Google Scholar
[94] Melet A, Teatini P, Le Cozannet G, Jamet C, Conversi A, Benveniste J, et al. Earth observations for monitoring marine coastal hazards and their drivers. Surv Geophys. 2020;41:1489–534. 10.1007/s10712-020-09594-5.Search in Google Scholar
[95] Wieland M, Li Y, Martinis S. Multi-sensor cloud and cloud shadow segmentation with a convolutional neural network. Remote Sens Environ. 2019;230:111203. 10.1016/j.rse.2019.05.022.Search in Google Scholar
[96] Hagolle O, Huc M, Villa Pascual D, Dedieu G. A multi-temporal and multi-spectral method to estimate aerosol optical thickness over land, for the atmospheric correction of FormoSat-2, LandSat, VENμS and Sentinel-2 images. Remote Sens. 2015;7:2668–91. 10.3390/rs70302668.Search in Google Scholar
[97] Main-Knorn M, Pflug B, Louis J, Debaecker V, Müller-Wilm U, Gascon F. Sen2Cor for Sentinel-2. Proceedings of SPIE. Image and Signal Processing for Remote Sensing XXIII. Vol. 10427. Poland. SPIE; 2017. p. 1042704. 10.1117/12.2278218.Search in Google Scholar
[98] Ambrosone M, Matese A, Di Gennaro SF, Gioli B, Tudoroiu M, Genesio L, et al. Retrieving soil moisture in rainfed and irrigated fields using Sentinel-2 observations and a modified OPTRAM approach. Int J Appl Earth Obs Geoinformation. 2020;89:102113. 10.1016/j.jag.2020.102113.Search in Google Scholar
[99] Sadeghi M, Babaeian E, Tuller M, Jones SB. The optical trapezoid model: a novel approach to remote sensing of soil moisture applied to Sentinel-2 and Landsat-8 observations. Remote Sens Environ. 2017;198:52–68. 10.1016/j.rse.2017.05.041.Search in Google Scholar
[100] Pan-European. Copernic Land Monit Serv n.d. https://land.copernicus.eu/pan-european (accessed July 28, 2021).Search in Google Scholar
[101] Karra K, Kontgis C, Statman-Weil Z, Mazzariello J, Mathis M, Brumby S. Global land use/land cover with Sentinel-2 and deep learning. Esri 2020 Land Cover; 2021. https://www.arcgis.com/home/item.html?id=d6642f8a4f6d4685a24ae2dc0c73d4ac (accessed July 28, 2021).Search in Google Scholar
[102] Sai Kiran K, Bhuvaneswari Devi A, Nair AM. Impact of land use changes in a micro watershed using remote sensing and gis: a case study of IIT Guwahati Watershed, Guwahati, Assam. 7th International Ground Water Conference (IGWC-2017). New Delhi, India: National Institute of Hydrology, Roorkee, India; 2017.Search in Google Scholar
[103] Apollonio C, Balacco G, Novelli A, Tarantino E, Piccinni AF. Land use change impact on flooding areas: the case study of cervaro basin (Italy). Sustainability. 2016;8:996. 10.3390/su8100996.Search in Google Scholar
[104] Tollan A. Land-use change and floods: what do we need most, research or management? Water Sci Technol. 2002;45:183–90. 10.2166/wst.2002.0176.Search in Google Scholar
[105] Zope PE, Eldho TI, Jothiprakash V. Impacts of land use–land cover change and urbanization on flooding: A case study of Oshiwara River Basin in Mumbai, India. CATENA. 2016;145:142–54. 10.1016/j.catena.2016.06.009.Search in Google Scholar
[106] Kuntla SK, Kandadai S. Identification of suitable sites for construction of check dams. 5th International Conference on Hydrology and Watershed Management. Hyderabad, India: BS Publications; 2019.Search in Google Scholar
[107] Jensen JR. Remote Sensing of the Environment: An Earth Resource Perspective. 2nd edn. Pearson; 2006.Search in Google Scholar
[108] Zhang B. Application of remote sensing technology to population estimation. Chin Geogr Sci. 2003;13:267–71. 10.1007/s11769-003-0029-0.Search in Google Scholar
[109] ESA. Plant health n.d. http://www.esa.int/Applications/Observing_the_Earth/Copernicus/Sentinel-2/Plant_health (accessed June 15, 2021).Search in Google Scholar
[110] SIRAL Overview – Earth Online. CryoSat n.d. https://earth.esa.int/eogateway/instruments/siral/description (accessed August 6, 2021).Search in Google Scholar
[111] Zaidi AZ, Vignudelli S, Khero Z, Ghauri BMK, Muzaffer R, Naeem B, et al. Indus river water level monitoring using satellite radar altimetry. Adv Space Res. 2021;68:641–51. 10.1016/j.asr.2020.03.044.Search in Google Scholar
[112] Kittel CMM, Jiang L, Tøttrup C, Bauer-Gottwein P. Sentinel-3 radar altimetry for river monitoring – a catchment-scale evaluation of satellite water surface elevation from Sentinel-3A and Sentinel-3B. Hydrol Earth Syst Sci. 2021;25:333–57. 10.5194/hess-25-333-2021.Search in Google Scholar
[113] Jiang L, Nielsen K, Dinardo S, Andersen OB, Bauer-Gottwein P. Evaluation of Sentinel-3 SRAL SAR altimetry over Chinese rivers. Remote Sens Environ. 2020;237:111546. 10.1016/j.rse.2019.111546.Search in Google Scholar
[114] Tarpanelli A, Camici S, Nielsen K, Brocca L, Moramarco T, Benveniste J. Potentials and limitations of Sentinel-3 for river discharge assessment. Adv Space Res. 2021;68:593–606. 10.1016/j.asr.2019.08.005.Search in Google Scholar
[115] ACE2. Earth Planet Remote Sens Lab n.d. http://www.cse.dmu.ac.uk/EAPRS/projects_ace2.html (accessed August 12, 2021).Search in Google Scholar
[116] Kuntla SK, Pandey A, Saharia M. Developing a flood severity index over India. AGU Fall Meet. 2020, American Geophysical Union; 2020, p. H203-06.Search in Google Scholar
[117] Gourley JJ, Hong Y, Flamig ZL, Arthur A, Clark R, Calianno M, et al. A unified flash flood database across the United States. Bull Am Meteorol Soc. 2013;94:799–805. 10.1175/BAMS-D-12-00198.1.Search in Google Scholar
[118] Michailovsky CI, Milzow C, Bauer-Gottwein P. Assimilation of radar altimetry to a routing model of the Brahmaputra River. Water Resour Res. 2013;49:4807–16. 10.1002/wrcr.20345.Search in Google Scholar
[119] Paiva RCD, Collischonn W, Bonnet M-P, de Gonçalves LGG, Calmant S, Getirana A, et al. Assimilating in situ and radar altimetry data into a large-scale hydrologic-hydrodynamic model for streamflow forecast in the Amazon. Hydrol Earth Syst Sci. 2013;17:2929–46. 10.5194/hess-17-2929-2013.Search in Google Scholar
[120] Liang C, Li Y, Luo J. A promising radar altimetry satellite system for operational flood forecasting in flood-prone bangladesh. IEEE Geosci Remote Sens Mag. 2014;2:27–36. 10.1109/MGRS.2014.2345414.Search in Google Scholar
[121] Ahamed A, Bolten JD. A MODIS-based automated flood monitoring system for southeast asia. Int J Appl Earth Obs Geoinformation. 2017;61:104–17. 10.1016/j.jag.2017.05.006.Search in Google Scholar
[122] NASA. NRT Global Flood Mapping n.d. https://floodmap.modaps.eosdis.nasa.gov// (accessed August 4, 2021).Search in Google Scholar
[123] Ticehurst CJ, Chen Y, Karim F, Dutta D, Gouweleeuw B. Using MODIS for mapping flood events for use in hydrological and hydrodynamic models: Experiences so far. 20th International Congress on Modelling and Simulation, Adelaide, Australia: MSSANZ; 2013. 10.36334/modsim.2013.h5.ticehurst.Search in Google Scholar
[124] Ibrahim AT. Use of MERIS data to detect the impact of flood inundation on land cover changes in the Lake Chad Basin. The Hong Kong Polytechnic University; 2009. https://theses.lib.polyu.edu.hk/handle/200/5210 (accessed August 8, 2021).Search in Google Scholar
[125] Di L, Yu EG, Kang L, Shrestha R, Bai Y. RF-CLASS: a remote-sensing-based flood crop loss assessment cyber-service system for supporting crop statistics and insurance decision-making. J Integr Agric. 2017;16:408–23. 10.1016/S2095-3119(16)61499-5.Search in Google Scholar
[126] Zhang F, Zhu X, Liu D. Blending MODIS and Landsat images for urban flood mapping. Int J Remote Sens. 2014;35:3237–53. 10.1080/01431161.2014.903351.Search in Google Scholar
[127] Mileva N, Mecklenburg S, Gascon F. New tool for spatio-temporal image fusion in remote sensing: a case study approach using Sentinel-2 and Sentinel-3 data. Proceedings of SPIE. Image Signal Processing Remote Sensing. Vol. 10789. Germany: SPIE; 2018. p. XXIV–9. 10.1117/12.2327091.Search in Google Scholar
[128] Chen Y, Huang C, Ticehurst C, Merrin L, Thew P. An evaluation of MODIS daily and 8-day composite products for floodplain and wetland inundation mapping. Wetlands. 2013;33:823–35. 10.1007/s13157-013-0439-4.Search in Google Scholar
[129] Kiran KS, Manjusree P, Viswanadham M. Sentinel-1 SAR data preparation for extraction of flood footprints- a case study. Disaster Adv. 2019;12:10–20.Search in Google Scholar
[130] Copernicus Emergency Management Service n.d. https://emergency.copernicus.eu/ (accessed July 31, 2021).Search in Google Scholar
[131] ESA. MSI Instrument – Sentinel-2 MSI Technical Guide. Sentinel n.d. https://sentinel.esa.int/web/sentinel/technical-guides/sentinel-2-msi/msi-instrument (accessed June 15, 2021).Search in Google Scholar
[132] ESA. User Guides – Sentinel-3 OLCI – Radiometric Resolution. Sentin Online – Sentin n.d. https://sentinel.esa.int/web/sentinel/user-guides/sentinel-3-olci/resolutions/radiometric (accessed June 23, 2021).Search in Google Scholar
[133] Copernicus: Sentinel-3. ESA Earth Obs Portal n.d. https://directory.eoportal.org/web/eoportal/satellite-missions/c-missions/copernicus-sentinel-3#foot64%29 (accessed June 24, 2021).Search in Google Scholar
© 2021 Sai Kiran Kuntla, published by De Gruyter
This work is licensed under the Creative Commons Attribution 4.0 International License.
Articles in the same Issue
- Regular Articles
- Lithopetrographic and geochemical features of the Saalian tills in the Szczerców outcrop (Poland) in various deformation settings
- Spatiotemporal change of land use for deceased in Beijing since the mid-twentieth century
- Geomorphological immaturity as a factor conditioning the dynamics of channel processes in Rządza River
- Modeling of dense well block point bar architecture based on geological vector information: A case study of the third member of Quantou Formation in Songliao Basin
- Predicting the gas resource potential in reservoir C-sand interval of Lower Goru Formation, Middle Indus Basin, Pakistan
- Study on the viscoelastic–viscoplastic model of layered siltstone using creep test and RBF neural network
- Assessment of Chlorophyll-a concentration from Sentinel-3 satellite images at the Mediterranean Sea using CMEMS open source in situ data
- Spatiotemporal evolution of single sandbodies controlled by allocyclicity and autocyclicity in the shallow-water braided river delta front of an open lacustrine basin
- Research and application of seismic porosity inversion method for carbonate reservoir based on Gassmann’s equation
- Impulse noise treatment in magnetotelluric inversion
- Application of multivariate regression on magnetic data to determine further drilling site for iron exploration
- Comparative application of photogrammetry, handmapping and android smartphone for geotechnical mapping and slope stability analysis
- Geochemistry of the black rock series of lower Cambrian Qiongzhusi Formation, SW Yangtze Block, China: Reconstruction of sedimentary and tectonic environments
- The timing of Barleik Formation and its implication for the Devonian tectonic evolution of Western Junggar, NW China
- Risk assessment of geological disasters in Nyingchi, Tibet
- Effect of microbial combination with organic fertilizer on Elymus dahuricus
- An OGC web service geospatial data semantic similarity model for improving geospatial service discovery
- Subsurface structure investigation of the United Arab Emirates using gravity data
- Shallow geophysical and hydrological investigations to identify groundwater contamination in Wadi Bani Malik dam area Jeddah, Saudi Arabia
- Consideration of hyperspectral data in intraspecific variation (spectrotaxonomy) in Prosopis juliflora (Sw.) DC, Saudi Arabia
- Characteristics and evaluation of the Upper Paleozoic source rocks in the Southern North China Basin
- Geospatial assessment of wetland soils for rice production in Ajibode using geospatial techniques
- Input/output inconsistencies of daily evapotranspiration conducted empirically using remote sensing data in arid environments
- Geotechnical profiling of a surface mine waste dump using 2D Wenner–Schlumberger configuration
- Forest cover assessment using remote-sensing techniques in Crete Island, Greece
- Stability of an abandoned siderite mine: A case study in northern Spain
- Assessment of the SWAT model in simulating watersheds in arid regions: Case study of the Yarmouk River Basin (Jordan)
- The spatial distribution characteristics of Nb–Ta of mafic rocks in subduction zones
- Comparison of hydrological model ensemble forecasting based on multiple members and ensemble methods
- Extraction of fractional vegetation cover in arid desert area based on Chinese GF-6 satellite
- Detection and modeling of soil salinity variations in arid lands using remote sensing data
- Monitoring and simulating the distribution of phytoplankton in constructed wetlands based on SPOT 6 images
- Is there an equality in the spatial distribution of urban vitality: A case study of Wuhan in China
- Considering the geological significance in data preprocessing and improving the prediction accuracy of hot springs by deep learning
- Comparing LiDAR and SfM digital surface models for three land cover types
- East Asian monsoon during the past 10,000 years recorded by grain size of Yangtze River delta
- Influence of diagenetic features on petrophysical properties of fine-grained rocks of Oligocene strata in the Lower Indus Basin, Pakistan
- Impact of wall movements on the location of passive Earth thrust
- Ecological risk assessment of toxic metal pollution in the industrial zone on the northern slope of the East Tianshan Mountains in Xinjiang, NW China
- Seasonal color matching method of ornamental plants in urban landscape construction
- Influence of interbedded rock association and fracture characteristics on gas accumulation in the lower Silurian Shiniulan formation, Northern Guizhou Province
- Spatiotemporal variation in groundwater level within the Manas River Basin, Northwest China: Relative impacts of natural and human factors
- GIS and geographical analysis of the main harbors in the world
- Laboratory test and numerical simulation of composite geomembrane leakage in plain reservoir
- Structural deformation characteristics of the Lower Yangtze area in South China and its structural physical simulation experiments
- Analysis on vegetation cover changes and the driving factors in the mid-lower reaches of Hanjiang River Basin between 2001 and 2015
- Extraction of road boundary from MLS data using laser scanner ground trajectory
- Research on the improvement of single tree segmentation algorithm based on airborne LiDAR point cloud
- Research on the conservation and sustainable development strategies of modern historical heritage in the Dabie Mountains based on GIS
- Cenozoic paleostress field of tectonic evolution in Qaidam Basin, northern Tibet
- Sedimentary facies, stratigraphy, and depositional environments of the Ecca Group, Karoo Supergroup in the Eastern Cape Province of South Africa
- Water deep mapping from HJ-1B satellite data by a deep network model in the sea area of Pearl River Estuary, China
- Identifying the density of grassland fire points with kernel density estimation based on spatial distribution characteristics
- A machine learning-driven stochastic simulation of underground sulfide distribution with multiple constraints
- Origin of the low-medium temperature hot springs around Nanjing, China
- LCBRG: A lane-level road cluster mining algorithm with bidirectional region growing
- Constructing 3D geological models based on large-scale geological maps
- Crops planting structure and karst rocky desertification analysis by Sentinel-1 data
- Physical, geochemical, and clay mineralogical properties of unstable soil slopes in the Cameron Highlands
- Estimation of total groundwater reserves and delineation of weathered/fault zones for aquifer potential: A case study from the Federal District of Brazil
- Characteristic and paleoenvironment significance of microbially induced sedimentary structures (MISS) in terrestrial facies across P-T boundary in Western Henan Province, North China
- Experimental study on the behavior of MSE wall having full-height rigid facing and segmental panel-type wall facing
- Prediction of total landslide volume in watershed scale under rainfall events using a probability model
- Toward rainfall prediction by machine learning in Perfume River Basin, Thua Thien Hue Province, Vietnam
- A PLSR model to predict soil salinity using Sentinel-2 MSI data
- Compressive strength and thermal properties of sand–bentonite mixture
- Age of the lower Cambrian Vanadium deposit, East Guizhou, South China: Evidences from age of tuff and carbon isotope analysis along the Bagong section
- Identification and logging evaluation of poor reservoirs in X Oilfield
- Geothermal resource potential assessment of Erdaobaihe, Changbaishan volcanic field: Constraints from geophysics
- Geochemical and petrographic characteristics of sediments along the transboundary (Kenya–Tanzania) Umba River as indicators of provenance and weathering
- Production of a homogeneous seismic catalog based on machine learning for northeast Egypt
- Analysis of transport path and source distribution of winter air pollution in Shenyang
- Triaxial creep tests of glacitectonically disturbed stiff clay – structural, strength, and slope stability aspects
- Effect of groundwater fluctuation, construction, and retaining system on slope stability of Avas Hill in Hungary
- Spatial modeling of ground subsidence susceptibility along Al-Shamal train pathway in Saudi Arabia
- Pore throat characteristics of tight reservoirs by a combined mercury method: A case study of the member 2 of Xujiahe Formation in Yingshan gasfield, North Sichuan Basin
- Geochemistry of the mudrocks and sandstones from the Bredasdorp Basin, offshore South Africa: Implications for tectonic provenance and paleoweathering
- Apriori association rule and K-means clustering algorithms for interpretation of pre-event landslide areas and landslide inventory mapping
- Lithology classification of volcanic rocks based on conventional logging data of machine learning: A case study of the eastern depression of Liaohe oil field
- Sequence stratigraphy and coal accumulation model of the Taiyuan Formation in the Tashan Mine, Datong Basin, China
- Influence of thick soft superficial layers of seabed on ground motion and its treatment suggestions for site response analysis
- Monitoring the spatiotemporal dynamics of surface water body of the Xiaolangdi Reservoir using Landsat-5/7/8 imagery and Google Earth Engine
- Research on the traditional zoning, evolution, and integrated conservation of village cultural landscapes based on “production-living-ecology spaces” – A case study of villages in Meicheng, Guangdong, China
- A prediction method for water enrichment in aquifer based on GIS and coupled AHP–entropy model
- Earthflow reactivation assessment by multichannel analysis of surface waves and electrical resistivity tomography: A case study
- Geologic structures associated with gold mineralization in the Kirk Range area in Southern Malawi
- Research on the impact of expressway on its peripheral land use in Hunan Province, China
- Concentrations of heavy metals in PM2.5 and health risk assessment around Chinese New Year in Dalian, China
- Origin of carbonate cements in deep sandstone reservoirs and its significance for hydrocarbon indication: A case of Shahejie Formation in Dongying Sag
- Coupling the K-nearest neighbors and locally weighted linear regression with ensemble Kalman filter for data-driven data assimilation
- Multihazard susceptibility assessment: A case study – Municipality of Štrpce (Southern Serbia)
- A full-view scenario model for urban waterlogging response in a big data environment
- Elemental geochemistry of the Middle Jurassic shales in the northern Qaidam Basin, northwestern China: Constraints for tectonics and paleoclimate
- Geometric similarity of the twin collapsed glaciers in the west Tibet
- Improved gas sand facies classification and enhanced reservoir description based on calibrated rock physics modelling: A case study
- Utilization of dolerite waste powder for improving geotechnical parameters of compacted clay soil
- Geochemical characterization of the source rock intervals, Beni-Suef Basin, West Nile Valley, Egypt
- Satellite-based evaluation of temporal change in cultivated land in Southern Punjab (Multan region) through dynamics of vegetation and land surface temperature
- Ground motion of the Ms7.0 Jiuzhaigou earthquake
- Shale types and sedimentary environments of the Upper Ordovician Wufeng Formation-Member 1 of the Lower Silurian Longmaxi Formation in western Hubei Province, China
- An era of Sentinels in flood management: Potential of Sentinel-1, -2, and -3 satellites for effective flood management
- Water quality assessment and spatial–temporal variation analysis in Erhai lake, southwest China
- Dynamic analysis of particulate pollution in haze in Harbin city, Northeast China
- Comparison of statistical and analytical hierarchy process methods on flood susceptibility mapping: In a case study of the Lake Tana sub-basin in northwestern Ethiopia
- Performance comparison of the wavenumber and spatial domain techniques for mapping basement reliefs from gravity data
- Spatiotemporal evolution of ecological environment quality in arid areas based on the remote sensing ecological distance index: A case study of Yuyang district in Yulin city, China
- Petrogenesis and tectonic significance of the Mengjiaping beschtauite in the southern Taihang mountains
- Review Articles
- The significance of scanning electron microscopy (SEM) analysis on the microstructure of improved clay: An overview
- A review of some nonexplosive alternative methods to conventional rock blasting
- Retrieval of digital elevation models from Sentinel-1 radar data – open applications, techniques, and limitations
- A review of genetic classification and characteristics of soil cracks
- Potential CO2 forcing and Asian summer monsoon precipitation trends during the last 2,000 years
- Erratum
- Erratum to “Calibration of the depth invariant algorithm to monitor the tidal action of Rabigh City at the Red Sea Coast, Saudi Arabia”
- Rapid Communication
- Individual tree detection using UAV-lidar and UAV-SfM data: A tutorial for beginners
- Technical Note
- Construction and application of the 3D geo-hazard monitoring and early warning platform
- Enhancing the success of new dams implantation under semi-arid climate, based on a multicriteria analysis approach: Case of Marrakech region (Central Morocco)
- TRANSFORMATION OF TRADITIONAL CULTURAL LANDSCAPES - Koper 2019
- The “changing actor” and the transformation of landscapes