Gas Desorption of Low-Maturity Lacustrine Shales, Trassic Yanchang Formation, Ordos Basin, China
-
Bojiang Fan


Abstract
Recent exploration activities on Triassic Yan-chang Formation has indicated significant potential for shale-gas resources. Even though some areas have been put into pilot production, challenge exists in effectively determining shale-gas content, whichmake it difficult to estimate reserve and forecast production. This is primarily due to the low maturity of the shale and complicated relationships between oil, water and gas. However, studies on the gas generation and accumulation of low-maturity shales are lacking in the literature and previous desorption experiments did not consider the effects of oil and water. In this study, eight core samples are used to run the gas-desorption experiment. Shale-gas composition and isotopic fractionation data are analyzed to provide insights on gas adsorption, expulsion and accumulation processes in the Yanchang Formation. The experiment results indicate that the overall methane content decreases (from 68.8% to 58.9%), heavy hydrocarbon-gas content (from 20.30% to 36.12%) and δ13C1 increase (from -51.43% to - 34.63%) during the desorption process. Gas yield reached up to 3.89 m3/t shale, and the content of lost gas can account for more than 20% of total desorbed gas during the coring process. The recoverable shale gas content is estimated to be 80% of the total gas-desorption volume. Desorbing the rest 20% requires extra heating under much higher temperature.
1 Introduction
With the successful development of shale gas in the United States, geologists and engineers have realized the importance of gas sorption in forming effective shale-gas systems [1, 2]. Successful desorption of shale gas plays an important role in maintaining a long-term stable production. Some wells that have penetrated the sweet spots are reported to have produced shale gas for over 30 years [3]. Better understanding the shale-gas sorption process and mechanism, gas adsorption and desorption experiments have been widely carried out [4, 5, 6]. Chemical and isotopic composition analysis, which are commonly used research methods for conventional natural gas have also been introduced into shale gas researches [7, 8, 9].
Using chemical and isotope composition analysis, previous researchers have primarily focused on investigating the shale-gas origin [10, 11], detecting shale-gas types [12, 13] and shale-gas sorption mechanisms [8, 14, 15, 16]. Studies on the shale-gas expulsion and accumulation processes are comparatively lacking. This is especially true for low-maturity shales such as the Yanchang Formation, which faces a huge challenge considering its complicated oil, water and gas relationship [17, 18].
Gas content is an important parameter in calculating gas resources. Currently it is mostly measured in the laboratory through gas adsorption experiments, in which only one type of gas (e.g. methane) is used to estimate the shale adsorption capacity. Knowing that there is a mixing different gases in the actual expulsion process, neither the impact of other hydrocarbon gases nor non-hydrocarbon gases are considered in these experiments. In addition, the co-existence of oil, water and gas in real reservoir conditions and its impact on gas adsorption capacity are too complicated to be included in these experiments. Consequently, the gas content values acquired from these experiments are not accurate.
This study is primarily based on shale-gas desorption experiments using fresh core samples, in which oil, water and gas were kept at best in their original state. By analyzing the chemical and isotopic composition data obtained from these experiments, this study try to provide some insights on shale-gas expulsion and accumulation processes as well as methods in improving shale gas content calculation.
2 Geological Setting
The Ordos Basin is located in the central part of the North China Block. As the second largest sedimentary basin, it has an approximate area of 37×104 km2 [17, 19, 20]. It is bounded by the Helanshan and Liupanshan on the west, by the Qinling Mountains on the south, by the Yinshan and Langshan on the north and by the Shanxi Plateau on the east [19]. It is a typical cratonic basin developed on the Archean granulites and lower Proterozoic greenschists and filled with middle-upper Proterozoic to Meso-Cenozoic sediments [21, 22, 23]. The evolution of the Ordos Basin can be divided into four stages: the Early Paleozoic cratonic basin with divergent margins, the Middle Ordovician-Middle Triassic cratonic basin with conversant margins, the Mesozoic intracontinental remnant cratonic basin and the Cenozoic faulting and subsidence [23, 24].
The Triassic Yanchang Formation consists of predominantly lacustrine deposits ranging from 100-300 m in thickness [11]. It is overlain by the Lower Jurassic Fuxian Formation and underlain by the Middle Triassic Zhifang Formation [24]. The Yanchang Formation is subdivided into 10 members, which are named Chang 1-10 in descending order [21, 25] (Fig. 1). The Chang-7 and Chang-9 members consists of dominantly deep-lacustrine dark shale, which are the main targets for shale-gas exploration and development in the basin.
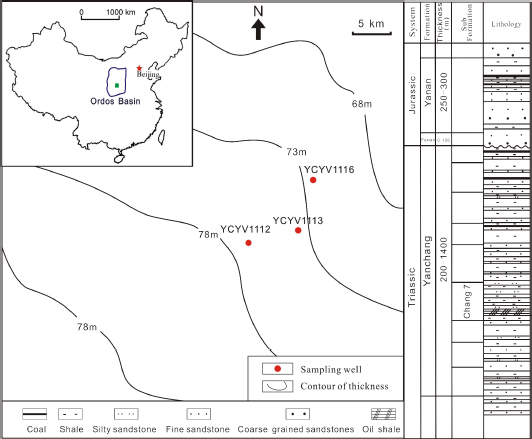
The sampling location and thickness of shale in Yanchang Formation
This study will focus on the deep lake facies of Yan-chang Formation, which has a shale thickness ranging 60-80 m and burial depth ranging 1100-1700 m TVD. The average content of total organic carbon (TOC) is greater than 2% [26, 27, 28].
Even though the Yanchang shale-gas field has been put into pilot production and a few wells are producing economic gas flows, there are many challenges in successful development of the field. These are; (i) low porosity and low permeability of gas reservoir, (ii) negative pressure system with reservoir pressure coefficient ranging 0.43-0.65. Futhermore, the low maturity (Ro<0.9) of the Yan-chang shale source rock, which is in oil window and makes a complicated oil, water gas system is another significant challenge.
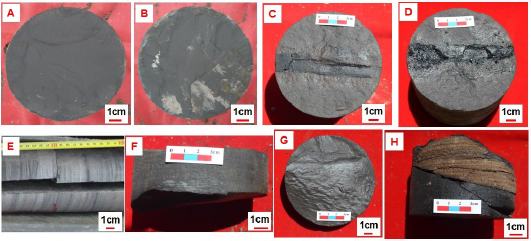
Photos of the core samples used for the gas desorption
2.1 Experimental Samples
Eight core samples (A-H) from the Yanchang Formation are used for the gas desorption experiment(Fig. 2). Fresh cores are sealed by a canister as quickly as possible at the wellsite to prevent evaporative losses. Basic information of these cores including lithology, well name, burial depth, average TOC, S1 and S2 is shown in Table 1. All the eight cores are black shale in lithology, except sample E which is sandy shale. TOC varies from 2.5% to 5.4% in a burial depth range of 1310.2-1608.4 m TVD.
Basic parameters of the eight shale core samples, including lithology, well name, formation, burial depth, TOC (%), S1 and S2.
| Sample | Lithology | Well | Buraial depth (m) | Total organic carbon (%) | Pyrolysis hydrocarbons (mg HC /g rock) | Cracking hydrocarbons (mg HC /g rock) |
|---|---|---|---|---|---|---|
| A | Dark shale | YCYV1112 | 1322.1 | 2.5 | 4.3 | 9.5 |
| B | Dark shale | YCYV1112 | 1348.4 | 4.2 | 5.2 | 7.4 |
| C | Dark shale | YCYV1113 | 1310.2 | 3.3 | 3.5 | 8.9 |
| D | Dark shale | YCYV1113 | 1313.7 | 4.6 | 5.6 | 16.4 |
| E | Sandy shale | YCYV1113 | 1315.4 | 3.4 | 2.1 | 4.4 |
| F | Dark shale | YCYV1116 | 1603.8 | 5.6 | 3.9 | 0.3 |
| G | Dark shale | YCYV1116 | 1604.6 | 5.6 | 4.1 | 0.3 |
| H | Dark shale | YCYV1113 | 1340.8 | 3.6 | 4.5 | 12.1 |
| Parts of data was calculated using well logging data, or was obtained by referring neighboring samples | ||||||
2.2 Experimental Methods and procedures
Eight core samples of the Yanchang Formation from four wells were analyzed through two types (I and II) of desorption experiments in this study. In the type-I experiment, temperature was kept constant at 25°C through the entire desorption process. In the type-II experiment, temperature was kept constant at 20-25°C in the beginning and then increased overtime to 90°C. Samples A-E went through the type-I experiment, while samples F-H went through the type-II experiment. In the desorption experiments, the procedures is as follows:
1) put the samples in the airtight container; 2) put the airtight container in the water kettle (the water can be heated by connecting electricity); 3) in different heating times or different temperatures, pump the released gas out to measure their quantity, composition and carbon isotope; 4) repeat above process until nearly no gas can be released out.
The composition and content of desorbed gas were measured using a Gas Chromatograph (Agilent 6890N), with a flame ionization detector (FID) and a thermal conductivity detector (TCD). Poly Tetra Fluoroethylene (PTFE) bore and length were 3 mm×4 m and 3 mm×2.4 m for the chromatographic column (GDX-502) and the mesoporous molecular sieve, respectively. The capillary chromatogram-column bore and length were 0.5 mm× 50 m. Column temperature was elevated from 30°C to 160°C at a heating rate of 70°C/min. Column pressure was 200 kPa. The carrier gas was helium and the inlet temperature of the chromatographic column was 120°C. TCD and FID was heated to 180°C. The volume of the injected sample gas was 1 ml. The measure limit ranged from 0.1 to 10 ppm with absolute error of ±5%.
The carbon isotope ratio was measured using a Gas Chromatography Combustion Isotope Ratio Mass Spectrometry. The model of the Gas Chromatograph was HP 6890I. The model of the isotopic mass spectrometer was Finigan Delta plus XP. The carrier gas was helium. Desorbed gas was firstly divided into separate compounds using the Gas Chromatograph. Each compound was then burned in a combustion furnace and converted into carbon dioxide, which was used for carbon isotopic composition analysis using the Isotope Ratio Mass Spectrometry. The chromatographic column used in the study is a CP-CarboBOND with a length, bore and film thickness of 25 m×0.53 mm×10 μm. Chromatography heating was performed by keeping the initial temperature at 30°C for 5 minutes, then increasing the temperature to 240°C at a heating rate of 15°C/min, and maintaining a temperature of 240°C for 10 minutes. The flow rate of the carrier gas was kept at 6.2 ml/min. The measuring error of carbon isotopes was ±0.3%ffl.
2.3 Experimental Results
Desorbed gas compositions were measured for all the eight samples. Only samples F-G were tested for the carbon isotopic ratios. The data obtained from the experiments are shown in Tables 2 and 3. The experimental results indicate that the desorption rate was relatively high at the early stage of the desorption process, with a large volume of gas being released from the shale samples. After a certain period of time(48 hours and/or 96 hours for the three samples), desorption rate slowed down and the volume of newly desorbed gas reduced significantly. However, if the sample is heated to a higher temperature at this time, the volume of newly desorbed gas increased rapidly again. After 280 to 300 hours of desorption, very little gas were released out of the shale samples, even with an abrupt increase in heating temperature. The extremely low desorption rate indicates that the quantity of residual gas in the shale is negligible at this stage.
Gas compositions and content measured overtime for five samples (A-E) through the isothermal desorption experiment (25°C.
| Sample | Desorption time (minutes) | C1 | C2 | C3 | iC4 | nC4 | iC5 | nC5 | CO2 | N2 | C3/nC4 | C2/C3 |
|---|---|---|---|---|---|---|---|---|---|---|---|---|
| A | 30 | 73.77 | 11.82 | 4.33 | 1.48 | 1.36 | 1.12 | 0.68 | 1.14 | 4.29 | 3.18 | 2.73 |
| A | 60 | 67.46 | 12.87 | 6.26 | 1.75 | 2.37 | 1.43 | 0.89 | 1.77 | 5.22 | 2.64 | 2.06 |
| A | 150 | 65.55 | 15.52 | 7.12 | 2.36 | 2.45 | 1.67 | 0.93 | 1.57 | 2.82 | 2.91 | 2.18 |
| A | 240 | 61.08 | 16.25 | 7.79 | 3.25 | 3.06 | 1.78 | 1.12 | 2.35 | 2.63 | 2.55 | 2.09 |
| A | 450 | 52.36 | 17.96 | 9.84 | 4.75 | 4.88 | 2.87 | 2.41 | 3.06 | 1.86 | 2.02 | 1.83 |
| B | 30 | 66.78 | 15.53 | 7.05 | 2.25 | 2.65 | 1.58 | 1.18 | 0.87 | 2.13 | 2.66 | 2.2 |
| B | 90 | 66.36 | 15.38 | 6.57 | 2.89 | 2.44 | 1.45 | 1.57 | 0.67 | 2.68 | 2.69 | 2.34 |
| B | 240 | 63.36 | 17.22 | 7.24 | 3.12 | 2.45 | 1.94 | 1.61 | 1.03 | 2.04 | 2.96 | 2.38 |
| B | 480 | 47.35 | 20.34 | 11.37 | 4.38 | 5.26 | 3.27 | 3.18 | 2.11 | 2.73 | 2.16 | 1.79 |
| C | 30 | 58.29 | 8.83 | 3.54 | 1.21 | 1.36 | 0.75 | 0.62 | 2.26 | 23.14 | 2.61 | 2.49 |
| C | 60 | 70.36 | 12.29 | 5.14 | 1.85 | 2.08 | 1.15 | 0.91 | 1.28 | 4.95 | 2.48 | 2.39 |
| C | 120 | 67.73 | 13.77 | 6.06 | 2.28 | 2.48 | 1.39 | 1.08 | 0.61 | 4.60 | 2.45 | 2.27 |
| C | 240 | 65.51 | 15.57 | 7.25 | 2.72 | 2.93 | 1.58 | 1.20 | 0.70 | 2.53 | 2.47 | 2.15 |
| C | 420 | 57.01 | 17.25 | 9.48 | 3.86 | 4.14 | 2.30 | 1.61 | 1.81 | 2.54 | 2.29 | 1.82 |
| D | 30 | 67.52 | 9.59 | 3.59 | 0.64 | 1.53 | 0.44 | 0.52 | 2.08 | 14.09 | 2.34 | 2.67 |
| D | 90 | 72.00 | 10.04 | 3.56 | 0.62 | 1.49 | 0.42 | 0.51 | 1.25 | 10.11 | 2.39 | 2.82 |
| D | 150 | 76.98 | 10.92 | 3.83 | 0.67 | 1.61 | 0.45 | 0.55 | 1.01 | 3.98 | 2.38 | 2.85 |
| D | 390 | 77.03 | 11.27 | 3.98 | 0.69 | 1.67 | 0.46 | 0.55 | 0.88 | 3.47 | 2.38 | 2.83 |
| D | 450 | 75.78 | 11.69 | 4.33 | 0.77 | 1.93 | 0.58 | 0.75 | 2.16 | 2.00 | 2.24 | 2.70 |
| E | 30 | 76.60 | 10.38 | 3.87 | 0.94 | 1.45 | 0.61 | 0.58 | 1.58 | 4.00 | 2.67 | 2.68 |
| E | 60 | 77.75 | 10.75 | 3.88 | 0.93 | 1.46 | 0.60 | 0.57 | 0.88 | 3.17 | 2.66 | 2.77 |
| E | 240 | 76.84 | 11.82 | 4.38 | 1.05 | 1.64 | 0.66 | 0.63 | 0.95 | 2.03 | 2.67 | 2.70 |
| E | 480 | 61.78 | 15.24 | 7.52 | 2.00 | 3.42 | 1.58 | 1.62 | 5.80 | 1.04 | 2.20 | 2.03 |
Gas compositions, content, volume and carbon isotope ratios measured overtime for three samples (F-H) under desorption experiment with increasing temperature conditions.
| Sample | Temperature | Heating | Gas | Dryness | δ13C (%fh) | ||||
|---|---|---|---|---|---|---|---|---|---|
| (°C) | time (hours) | quantity (L) | (C1/C1−5) | C 1 | C2 | C3 | nC4 | CO2 | |
| 20 | 48 | 0.377 | 0.79 | -51.6 | -37.8 | -32.1 | -30 | -16.1 | |
| 20 | 48 | 0.177 | 0.78 | -49.3 | -37.3 | -32.4 | -30.3 | -17.9 | |
| 20 | 48 | 0.099 | 0.77 | -50.1 | -37.4 | -32 | -29.8 | -18.9 | |
| F | 40 | 48 | 0.255 | 0.74 | -50.2 | -37.7 | -32.4 | -30.2 | -15.3 |
| 60 | 48 | 0.221 | 0.65 | -48.1 | -37 | -32.3 | -31.1 | -14.6 | |
| 70 | 48 | 0.158 | 0.61 | -42.4 | -34.8 | -31.1 | -30.1 | -20.7 | |
| 80 | 48 | 0.077 | 0.54 | -40.9 | -35.2 | -31.7 | -30.7 | -17.1 | |
| 90 | 48 | 0.05 | 0.45 | -33.9 | -33.5 | -31.1 | -30.3 | -18.4 | |
| 20 | 48 | 0.264 | 0.8 | -51.6 | -37.7 | -32.1 | -36.7 | -14.5 | |
| 20 | 48 | 0.136 | 0.79 | -51.3 | -37.8 | -32.4 | -28.9 | -19 | |
| 20 | 48 | 0.081 | 0.79 | -51 | -37.5 | -32.3 | -30.4 | -16.9 | |
| G | 40 | 48 | 0.215 | 0.75 | -51.3 | -37.9 | -32.7 | -31.5 | -15.7 |
| 60 | 48 | 0.358 | 0.7 | -49.7 | -37.8 | -32.8 | -31.5 | -16.2 | |
| 70 | 48 | 0.189 | 0.65 | -45.2 | -36.4 | -31.8 | -30.1 | -17.2 | |
| 80 | 48 | 0.125 | 0.59 | -41.9 | -35.6 | -31.8 | -30.1 | -23.3 | |
| 90 | 48 | 0.066 | 0.5 | -36 | -34 | -31.2 | -30.4 | -19.1 | |
| 25 | 48 | 0.313 | 0.82 | -51.1 | -37.2 | -32.5 | -33.4 | -14.5 | |
| 25 | 48 | 0.145 | 0.81 | -50.8 | -37.1 | -32.4 | -33.3 | -19 | |
| 25 | 48 | 0.079 | 0.8 | -50.1 | -36.8 | -32.5 | -33.3 | -16.9 | |
| H | 40 | 48 | 0.221 | 0.78 | -49.7 | -36.8 | -32.2 | -32.9 | -15.7 |
| 60 | 48 | 0.248 | 0.71 | -48.5 | -36.3 | -32.2 | -32.4 | -16.2 | |
| 70 | 48 | 0.176 | 0.62 | -42.5 | -36.1 | -32.1 | -30.7 | -17.2 | |
| 80 | 48 | 0.097 | 0.55 | -37.4 | -35.7 | -31.9 | -30.8 | -23.3 | |
| 90 | 48 | 0.046 | 0.43 | -34 | -33.8 | -31.9 | -30.7 | -19.1 | |
The contents of different components of desorbed gas changed significantly throughout the entire desorption experiment. Most obviously, the content of methane decreased over time, while the heavy hydrocarbon gases (e.g., ethane and propane) increased, which led to a decrease in the volume ratio of methane to all gases (gas dryness) (Tables 2 and 3). The observed facts described above indicate that molecules with smaller diameter (e.g., methane) are easier to be desorbed from the shale samples(Fig. 3). In contrast, desorption of heavy hydrocarbon gases (e.g., ethane), which have larger molecule diameters, are more difficult (Fig. 3).
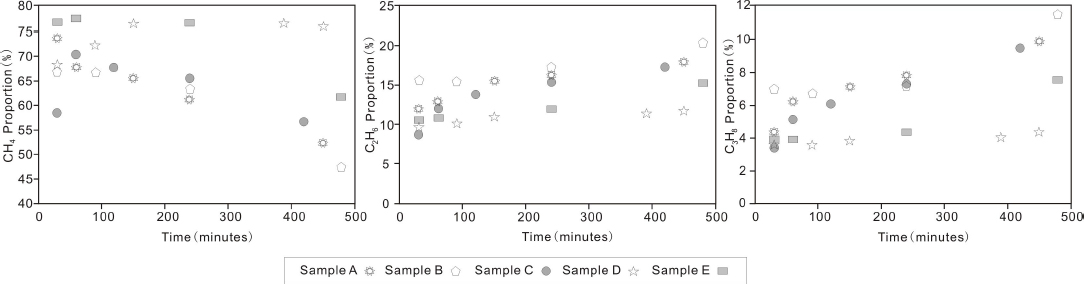
Plots of the proportion of volumes for CH4, C2H6 and C3H8 to the total gas volume overtime during the desorption experiment
The carbon isotope ratios of different gas components also changed during the desorption process. For example, methane became significantly heavier overtime, with the carbon isotope ratio (δ13C1) increasing from -51.6%ffl to -33.9%ffl (Table 3). Carbon isotope ratios for samples F, G and H reached -33.9%ffl, -36.0%ffl and -34.0%ffl at 90°C (Table 3), respectively, which are very heavy. This is probably due to the selective adsorption characteristic of shale. Shale has a stronger adsorption capacity to 13C-methane than 12C-methane. Similar characteristic has been widely tested and verified in coal-bed methane studies [20]. In contrast, heavy hydrocarbon gases such as ethane, propane and propane have shown only a slight trend of getting heavier through the desorption process. This trend became ambiguous and negligible at the later stage of the desorption experiment, which indicates that isotopic composition has no distinctive impact on the shale’s desorption capacity of heavy hydrocarbon gases. Carbon isotopic compositions for carbon dioxide did not change much during the experiment and showed no obvious trend (Table 2). H sample, as the only one that has been weighed, is the heaviest and weighs 0.34 kg (Table 3). The content of desorbed gas is calculated to be 3.89 m3 per ton of shale, using the volume of the desorbed gas from the experiment divided by it weight. The value is relatively higher than that of 1.17-3.68m3 per ton of shale, whichwere reported by Wang et al. (2014) based on six samples from the same formation but different wells [9].
3 Geological Significance
3.1 Gas adsorption capacity of shale
During the desorption experiments, the volumetric proportions of N2 and CH4 to the overall desorbed gas decreased overtime, with the former faster than the later. In contrast, the volumetric proportion increased for CO2 (Table 2 and Fig. 4). The experiment results indicate that desorption capability of the Yanchang Formation shale for individual gas components follows the sequence of N2>CH4>CO2.
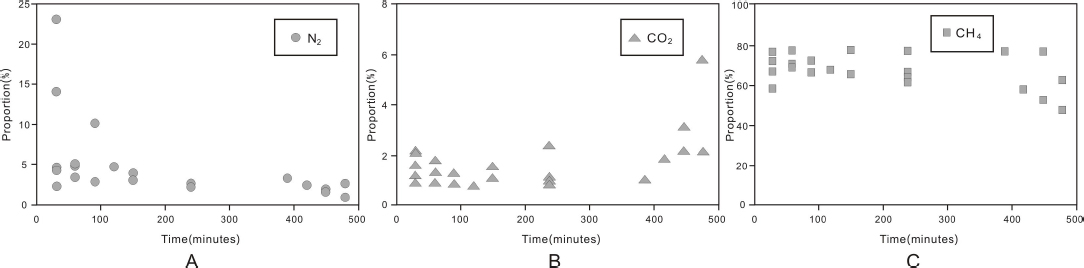
Plots of the proportion of volumes for N2 (A), CO2 (B) and CH4 (C) to the total gas volume overtime during the desorption experiment
Gas adsorption of shale is a physical progress, which is similar to that of coal [29, 30]. We interpret the gas adsorption as a reverse process to the desorption process. For individual gas components, the adsorption capacity follows the opposite sequence for desorption as CO2 >CH4>N2, which is consistent with the gas adsorption experiment result getting from marine shale in Sichuan Basin, China [31].
3.2 Calculation of lost shale gas
A certain amount of gas was lost during the drilling and sampling processes. Firstly, the temperature-pressure balance of the oil-gas-water system is damaged when the drilling bit penetrate the shale, leading to gas leak even though the borehole is filled with drilling fluids to compensate pressure. Secondly, decrease in temperature and pressure when the core is pulled up to the surface could also result in losing some free gas, as well as exsolution of dissolved gas. Consequently, the amount of lost gas should be taken into consideration in order to accurately calculate the total gas content in the sample shales.
Many methods have been developed and put into practice for calculating lost coal-bed methane. Mostly applied ones include calculating lost methane by combining test results and the gas diffusion theory [32], the United States Bureau of Mine (USBM) method [33] and polynomial curve fitting method [29]. USBM method is mainly applicable to the recovery of lost coalbed methane, and it is one of the mature and widely used methods. As the geological condition of shale in Trassic Yanchang Formation has a certain degree of similarity with that of coal, including high abundance of total organic carbon, shallow burial depth with low temperature and low pressure, thus, USBM method is adopted to recover the lost shale gas. In this study, we will try to use the USBM method to do the calculation following the steps below (Fig. 5):
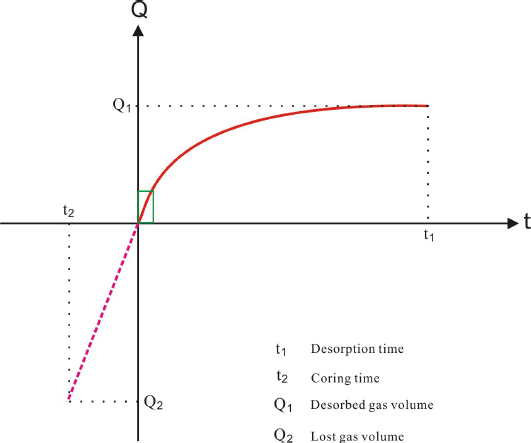
Schematic diagram illustrating the method for calculating the volume of lost shale gas
1) measure and record the time used to pull the core from underground to the surface (t2); 2) plot a coordinate diagram as the red solid curve with time as X-axis and desorption gas volume as Y-axis; 3) determine the approximately straight and linear section in the initial desorption stage on the coordinate diagram; 4) extend the straight line to t2 as the pink dash curve; 5) the lost shale-gas volume is determined as the absolute Y value (Q2) corresponding to t2. The volume of lost shale gas is calculated for samples A and B that have been through the isothermal desorption experiment using this method. The results are 0.46 and 0.83 m3 per ton of shale for A and B, respectively, which are 0.21 times and 0.32 times of their measured desorbed gas contents (2.19m3 and 2.57 m3 for A and B respectively). The contents of lost gas can account for 17.4% and 24.4% for A and B, with an average value of 20.9%.
3.3 Mixing process of shale gas
The carbon isotope of alkane clearly demonstrates kinetic fractionation in the geological history. Due to the differences in physical and chemical properties, the12C-12C bonds are easier to cleave than the 13C-12C bonds and the 13C-13C bonds, which leads to the enrichment of isotopically lighter alkanes. Because the carbon isotope compositions of hydrocarbon gases are controlled by the kinetic fractionation process, synchronous and isogenous alkanes of organic origin are characterized by a normal carbon isotope series, which is δ13C1 < δ13C2 < δ13C3 < δ13C4 [25, 34]. In addition, the δ13Cn and 1/n (n is the carbon number of gas molecule) is characterized by a linear correlation if the alkane were generated through a single exogenous thermal event [35].However, the normal carbon isotope series of alkanes will alter when there is a mixing gases of different sources or biodegradation. Mixing gases of different sources includes the mixing of organic gas and inorganic gas, oil-type gas and coal-bed methane, isogenous gases at different maturation stages, and homologous gases with different origins. Consequently, the isotope series help to determine whether the gas mixing and biodegradation occurred or not.
The experiment results in this study shows that there is a normal carbon isotope series for methane, ethane and propane as δ13C1 < δ13C2 < δ13C3 and there is a good linear correlation between δ13Cn and 1/n (Fig. 6). However, δ13C4became lower than δ13C3 for samples G and H, indicating a slight isotopic reversal (Fig. 6).
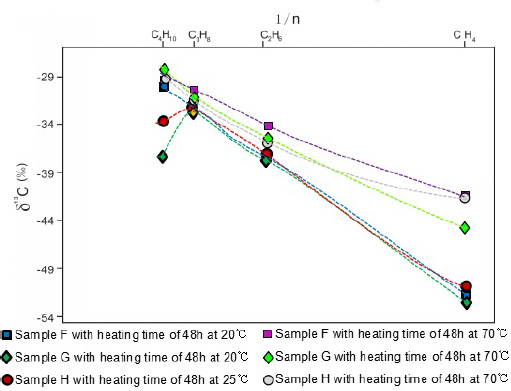
Cross-plot of 1/n vs. δ13C (%fh). A normal carbon isotope series is shown for methane, ethane and propane. A slight reverse is shown for butane.
The carbon isotope of ethane is an excellent indicator of the kerogen type in the source rock, which thus can be used to determine the gas type [25]. Ethane with δ13C2< -29%ffl is classified as generated by sapropelic-humic kerogen. The experiment results show that δ13C2 ranges from -33%ffl to -37%ffl in this study, indicating a typical sapropelic-humic kerogen, which is consistent with the Type II1 kerogen in the study area. Regionally, the Yanchang shale is the only source rock in the study area and the Yanchang shale-gas system is a relatively stable and closed, which makes it very difficult to mix with gases of other sources[36]. Gas composition and stable isotope analysis indicate that the Yanchang shale gas is purely thermogenic origin without any mixing of biogenic gas or coal gas. Furthermore, the carbon isotope of heavy hydrocarbon gas is not subject to the influence of migration. Consequently, the only possible source of mixing gas was from gases generated from the Yanchang shale but at different maturation phases [37].
Another possible interpretation is that the isotope reversal is caused by measurement error. Since the content of butane was very low and close to the accuracy limit of the equipment, it makes the results less reliable.
3.4 Shale gas hosting model
Shale gas has three phases within the shale system, i.e., adsorbed gas, free gas and dissolved gas. The relative content of each phase is affected by geological factors including temperature, pressure, oil and water distribution. For Yanchang Formation lacustrine shale gas, the main phases of lacustrine shale gas are adsorbed gas and free gas [20]. Due to the limitation of present experimental technologies, the three phases in the formation state cannot be simulated in the laboratory. There is still lack of exploration for showing how the gas phases co-exist within the shale. However, according to the contents of gases in three phases, combining with physical and chemical properties of the shale, the hosting model of gases can be inferred.
Due to the difference of wettability, some mineral components within the rock show the lipophilic characteristics, and some mineral components also show hydrophilic characteristics. For example, clay minerals such as illite, kaolinite, montmorillonite, chlorite and mica exhibit hydrophilic characteristics; the surface of these these minerals is always covered with water film. The organic components generating oil within the shale usually show the lipophilic characteristics, and the surface of these minerals is always covered with oil film. Yanchang Formationshale, which is still in the oil window, generated a lot of oil and gas. Thus, it can be inferred that a large quantity of water and oil films exist within the shale. As the shale has strong adsorbing ability to gas, a lot of gas have priority to adsorb on the organic matter and mineral particles, and exists as the adsorbing gas. Some gas can be dissolved in the oil film or water film and exists as dissolving gas. As the three phases within the shale are controlled by temperature, pressure and volume, which is known as PVT equation, some gas occurs as free gas. The hosting models of gases with three phases is shown in Figure 7.
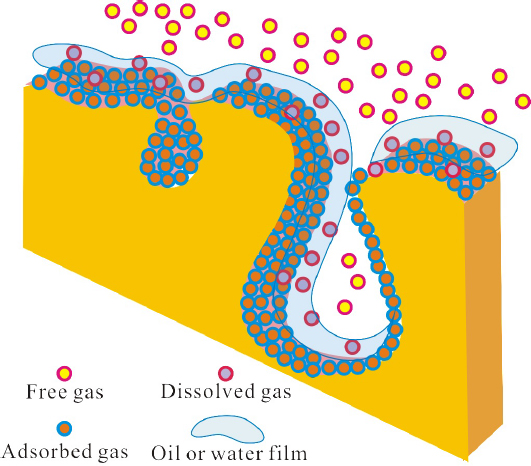
Hosting model of oil, gas and water within shale
3.5 Shale gas accumulation
According to the results of the gas desorption experiment, we inferred the hydrocarbon accumulation process for the Yanchang shale-gas systems.
Before the Yanchang Shale source rock passing the hydrocarbon generation window, only a small amount of oil and heavy hydrocarbon gas were generated and expulsed. The oil would occupied the pores inside and adjacent to the organic matter. The heavy hydrocarbon gas would be adsorbed on the surface of organic matter. When the Yanchang shale source rock in the study area entered hydrocarbon generation window during Late Jurassic and Early Cretaceous [38, 39], a large amount of methane and heavy hydrocarbon gases were generated. At this stage, 13C1-methane was absorbed in prior to 12C1- methane and heavy hydrocarbon gases were absorbed in prior to methane.
In a shale-gas system, gases present in three different phases including adsorbed, free and dissolved gases, which are in a state of dynamic balance. However, the relative amount of gases in different phases varies along with the accumulation process as summarize in the following model in the early accumulation stage (it is also the early burial stage and early hydrocarbon generation stage) in which the independent temperature and pressure system within shale has not formed. Along with the increasing thermal maturation of the shale source rock, the amount of hydrocarbon gas generated also increase. In the beginning stage, only a small amount of shale gas was generated, which would be preferentially adsorbed by the organic matter (Fig. 8A), with only a small amount migrating away from the organic matter and existing in other phases. After the organic matter is completely or for the most part saturated with gas, a certain amount of hydrocarbon gas could migrate out of the organic matter and get adsorbed on the surface of clay minerals. After the organic matter and clay mineral are completely or mostly saturated with gas, a large amount of hydrocarbon gas could get dissolved into oil and water (Fig. 8B). Filling the pores and fractures with significant amount of free gas occurs in the later stage of gas accumulation after the organic matter, clay mineral, oil and water are all saturated with gas (Fig. 8C). The independent shale system may formed when the early accumulation stage finished, for the burial depth is large, the volumeof generated hydrocarbon is plenty, and the formation pressure and temperature is high during this period.
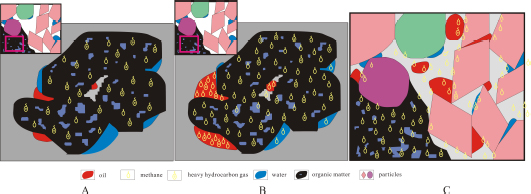
Schematic diagrams showing the shale gas accumulation processes in different stages of thermal maturation. (A) Hydrocarbon gas is absorbed by organic matters in the early stage; (B) hydrocarbon gas is dissolved in oil and water after the organic matter is saturated with gas; (C) free hydrocarbon gas is charging the pores after the organic matter, water and oil are saturated with gas
3.6 Content of recoverable shale gas
The desorption results of shale samples F, G and H show that δ13C1 increased and gas dryness decreased during the desorption process (Table 2 and Fig. 9). A cross-plot of δ13C1 and gas dryness with the percentile of desorbed gas for samples F, G and H shows that the curves for δ13C1 and gas dryness cross with each other at ~80% percentage of total ultimate desorbed gas (Fig. 9). Before the desorbed gas reached 80%, the desorption efficiency was relatively high in terms of quantity per certain amount of time. In contrast, the desorption efficiency dropped abruptly after 80% of gas has been released. In addition, extremely high temperature through more intense heating was required to desorb the rest 20% gas.
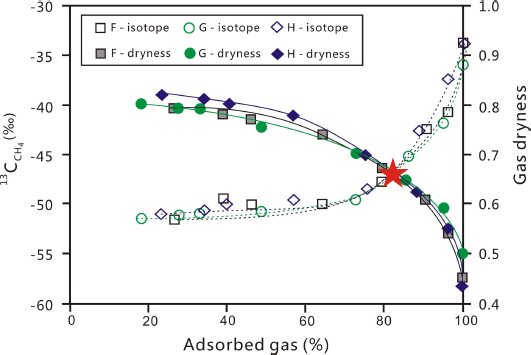
Cross-plot of δ13C1 (%fh) and gas dryness with percentile of desorbed gas overtime for samples F, G, and H
The reason for the abrupt change in desorption efficiency at ~80% percentage is probably related to the existence of oil and water in the pores. As discussed before, hydrocarbon gases occur in a dynamically balanced state in three phases: absorbed, dissolved and free. When the free gas was released and pressure dropped, dissolved gas will be partially transferred into free gas. Similarly, absorbed gas will also be partially dissolved into oil and water. The dynamic balance will be gradually restored at new temperature and pressure conditions. After a large amount of gas being released from the shale, the balance between gas, oil and water is greatly damaged and require a long time to restore, which could have resulted in difficulty in desorbing the rest 20% gas.
When the desorbed gas reached 80%, gas dryness was ~65% and the content of heavy hydrocarbon gas was ~35%, which is too high for economic development natural gas. The formation temperature in the study area is between 60°C and 70°C, which matches roughly with the temperature when ~80% of gas was desorbed. Consequently, we conclude that ~80% of the adsorbed shale gas in the study area can be desorbed under the geological conditions. This percentage should be taken into consideration in calculating shale gas resources. The content of recoverable shale gas is defined as 0.8 times the desorption gas obtained in the laboratory. The formula for calculating recoverable shale gas resources is as follows:
In the formula: Qr-recoverable shale gas (m3); Qe-average desorbed gas from experiment (m3/t shale); Ql-average lost gas during coring process (m3/t shale); W-weight of shale (t).
4 Conclusions
The gas desorption capacity of the Yanchang shale follows the sequence of N2> CH4>CO2, which is opposite to its adsorption capacity. For individual hydrocarbon gas components, small molecules desorbed easier and faster than large molecules, indicating that organic matters have a higher adsorption capacity for large molecules than small molecules. δ12C1-methane desorbs easier and faster than δ13C1-methane, suggesting that organic matters have a higher adsorption capacity for δ13C1-methane.
The hosting process of different gases in the early accumulation stage follows the priority sequence: adsorbing, dissolving, and free charging.
Gas yield reached up to 3.89 m3/t shale, and the content of lost gas can account for more than 20% of total desorbed gas. Only about 80% of the shale gas in the study area can be desorbed under the geological conditions because extremely high temperature is needed for desorbing the rest 20% shale gas. The percentages of lost gas and recoverable gas must be taken into consideration in calculating the gas resources for the Yanchang Formation shale.
Acknowledgement
Iwould like to express my gratitude to Yanchang Petroleum Corporation for agreeing publishing this paper.
References
[1] Ross, D.J., Marc Bustin, R., The importance of shale composition and pore structure upon gas storage potential of shale gas reservoirs. Marine Petroleum Geology, 2009, 26, 916–92710.1016/j.marpetgeo.2008.06.004Suche in Google Scholar
[2] Heller, R., Zoback, M., Adsorption of methane and carbon dioxide on gas shale and pure mineral samples. Journal of unconventional oil and gas resources, 2014, 8, 14–2410.1016/j.juogr.2014.06.001Suche in Google Scholar
[3] Curtis, J.B., Fractured shale-gas systems. AAPG Bulletin, 2002, 86, 1921–193810.1306/61EEDDBE-173E-11D7-8645000102C1865DSuche in Google Scholar
[4] Weniger, P.W., Kalkreuth, A., Busch, B., Krooss, M., High-pressure methane and carbon dioxide sorption on coal and shale samples from the Paraná Basin, Brazil. International Journal of Coal Geology, 2010, 84, 190–20510.1016/j.coal.2010.08.003Suche in Google Scholar
[5] Gasparik, M.A., Ghanizadeh, P., Bertier, Y., Gensterblum, S., et al. High pressure methane sorption isotherms of black shales from the Netherlands. Energy Fuels, 2012, 26, 4995–500410.1021/ef300405gSuche in Google Scholar
[6] Sigal, R.F., The effect of gas adsorption on storage and transport of methane in organic shales. SPWLA 54th Annual Logging Symposium, New Orleans, Louisiana, 2013Suche in Google Scholar
[7] Zumberge, J., Ferworn, K., Brown, S., Isotopic reversal (rollover) in shale gases produced from the Mississippian Barnett and Fayetteville formations. Marine & Petroleum Geology, 2012, 31, 43–5210.1016/j.marpetgeo.2011.06.009Suche in Google Scholar
[8] Osborn, S.G., Mcintosh, J.C., Chemical and isotopic tracers of the contribution of microbial gas in Devonian organic-rich shales and reservoir sandstones, northern Appalachian Basin. Applied Geochemistry, 2010, 25, 456–47110.1016/j.apgeochem.2010.01.001Suche in Google Scholar
[9] Wang, X.Z., Gao, S.L., Gao, C., Geological features of Mesozoic continental shale gas in south of Ordos Basin, NW China. Petroleum Exploration and Development, 2014, 41, 294–30410.1016/S1876-3804(14)60037-9Suche in Google Scholar
[10] Claypool, G.E., Kerogen conversion in fractured shale petroleum systems: 1998 Annual Meeting Expanded Abstracts, American Association of Petroleum Geologists.1998Suche in Google Scholar
[11] Wang, Z., Xiao, Z., Yang, R., Huang, Y., et al. A Study on Carboniferous Ceshui Formation Shale Gas Generation Material Basis in Central Hunan. Coal Geology of China, 2013, 15, 1511–1516 (in Chinese with English abstract)Suche in Google Scholar
[12] Jarvie, D.M., Unconventional shale-gas systems; the Mississippian Barnett Shale of north-central Texas as one model for thermogenic shale-gas assessment. AAPG Bulletin, 2007, 91, 475–49910.1306/12190606068Suche in Google Scholar
[13] Guo, S., Shale gas accumulation conditions and exploration potential of Carboniferous Benxi Formation in Ordos Basin. Acta Petrolei Sinica, 2013, 209, 247–250 (in Chinese with English abstract)Suche in Google Scholar
[14] Berner, U., Faber, E., Empirical carbon isotope/maturity relationships for gases from algal kerogen and terrigenous organic matter, based on dry, open-system pyrolysis. Organic Geochemistry, 1996, 24,947–95510.1016/S0146-6380(96)00090-3Suche in Google Scholar
[15] Fathi, E., Akkutlu, I.Y., Matrix Heterogeneity Effects on Gas Transport and Adsorption in Coalbed and Shale Gas Reservoirs. Transport in Porous Media, 2009, 80, 281–30410.1007/s11242-009-9359-4Suche in Google Scholar
[16] Li, X.Q., Zhao, P., Sun, J., Fu, T. X., et al. Study on the accumulation conditions of shale gas from the Lower Paleozoic in the south region of Sichuan Basin. Meitan Xuebao/journal of the China, 2013, 38, 864–869 (in Chinese with English abstract)Suche in Google Scholar
[17] Zhang, L.X., Jiang, C.F., Guo, C., Exploration potential of Upper Paleozoic shale gas in the eastern Ordos Basin. Journal of Xi’an Shiyou University (Natural Science Edition), 2012, 27, 23–26 (in Chinese with English abstract)Suche in Google Scholar
[18] Hao, F., Zou, H., Cause of shale gas geochemical anomalies and mechanisms for gas enrichment and depletion in high-maturity shales. Marine & Petroleum Geology, 2013, 44, 1–1210.1016/j.marpetgeo.2013.03.005Suche in Google Scholar
[19] Ulmishek, G., Geology and Hydrocarbon Resources of Onshore Basins in Eastern China. USGS Open-File Report 92–4, 199210.3133/ofr934Suche in Google Scholar
[20] Wang, X.Z., Zhang, J.C., Cao, J.Z., Preliminary discussion on evaluation of continental shale gas resources: A case study of Chang 7 of Mesozoic Yanchang Formation in Zhiluo-Xiasiwan area of Yanchang. Earth Science Frontiers, 2012, 19, 192–197 (in Chinese with English abstract)Suche in Google Scholar
[21] Yang, H., Deposition system and accumulation research of Yan-chang Formation in Triassic, Ordos Basin. PhD thesis, Chengdu University of Technology, China, 2004 (in Chinese with English abstract)Suche in Google Scholar
[22] Yang, H., Fu, S.T., Wei, X.S., Geology and Exploration of Oil and Gas in the Ordos Basin. Applied Geophysics, 2004, 1, 103–10910.1007/s11770-004-0011-3Suche in Google Scholar
[23] Yang, Y.T., Li, W., Ma, L., Tectonic and stratigraphic controls of hydrocarbon systems in the Ordos Basin: A multicycle cratonic basin in central China. AAPG Bulletin, 2005, 89, 255–26910.1306/10070404027Suche in Google Scholar
[24] Tang, X., Zhang, J.C., Jin, Z.J., Xiong, J.Y., et al. Experimental investigation of thermal maturation on shale reservoir properties from hydrous pyrolysis of Chang 7 shale, OrdosBasin. Marine and Petroleum Geology, 2015, 64, 165–17210.1016/j.marpetgeo.2015.02.046Suche in Google Scholar
[25] Dai, J.X., Xia, X.Y., Qin, S.F., Causation of partly reversed orders of δ13C in biogenic alkane gas in China. Oil and Gas Geology, 2003, 24, 1–6 (in Chinese with English Abstract)Suche in Google Scholar
[26] Kong, Q.F., The organic maceral characteristic of Yanchang source rock in Ordos Basin. Xinjiang Petroleum Geology, 2007, 28, 163–166 (in Chinese with English abstract)Suche in Google Scholar
[27] Jiang, C.F., Wang, X.Z., Zhang, L.X., Wan, Y.P., et al. The geological characteristics of shale and exploration potential of continental shale gas of 7th member, Yanchang Fm in Southeast Ordos Basin. Geology in China, 2013, 40, 1880–1888 (in Chinese with English abstract)Suche in Google Scholar
[28] Er, C., Li, Y., Zhao, J.Z., Wang, R., et al. Characteristics of lacustrine organic-rich shale: A case study of the Chang 7 Member, Triassic Yanchang Formation, Ordos Basin, China. Journal of Natural Gas Geoscience, 2016, 1, 173–185 (in Chinese with English abstract)10.1016/j.jnggs.2016.04.001Suche in Google Scholar
[29] Yee, D., John, P. S., William, B. H., Gas sorption on coal and measurement of gas content. In: Law B. E. and Rice D. D. (eds.). Hydrocarbons from Coal: American Association of Petroleum Geologists. Studies in Geology, 1993Suche in Google Scholar
[30] Hildenbrand, A., Krooss, B.M., Busch, A., Gaschnitz, R., Evolution of methane sorption capacity of coal seams as a function of burial history—a case study from the Campine Basin, NE Belgium. International journal of coal geology, 2006, 66, 179–20310.1016/j.coal.2005.07.006Suche in Google Scholar
[31] Han, H., Li, D.H., Ma, Y., Cheng, L.J., The origin of marine shale gas in the northeastern Sichuan Basin, China: implications from chemical composition and stable carbon isotope of desorbed gas. Acta Petrolei Sinica, 2013, 34, 453–459 (in Chinese with English abstract)Suche in Google Scholar
[32] Bertard, C., Bruyet, B., Gunther, J., Determination of desorbable gas concentration of coal (direct method) International Journal of Rock. Mechanics and Mining Sciences & Geomechanics Abstracts, 1970, 7, 43–5010.1016/0148-9062(70)90027-6Suche in Google Scholar
[33] Kissell, F.N., Meculloch, C.M., Elder, C.H., The Direct Method of Determining Methane Content of Coalbeds for Ventilation Design. U.S. Bureau of Mines Report of Investigations, Report Number BM-RI-7767, 1973Suche in Google Scholar
[34] Fuex, A.N., The use of stable carbon isotoper in hydrocarbon exploration. Joural of Geochemical Exploration, 1977, 7, 155–18810.1016/0375-6742(77)90080-2Suche in Google Scholar
[35] Chung, H.M., Gormly, J.R., Squires, R.M., Origin of gaseous hydrocarbons in subsurface environment: theoretical considerations of carbon isotope distribution. Chemical Geology, 1988, 1, 97–10410.1016/0009-2541(88)90108-8Suche in Google Scholar
[36] Jiang, C.F., Cheng, Y.Q., Fan, B.J., Progress and challenges to geologic research of terrestrial shale in China: A case study from the 7th member of the Upper Triassic Yanchang Fm in the yanchang exploration block, Ordos Basin. Natural Gas Industry, 2014, 34, 27–33 (in Chinese with English abstract)Suche in Google Scholar
[37] Wang, X.Z., Zhang, L.X., Jiang, C.F., Fan, J.B. Hydrocarbon storage space within lacustrine gas shale of the Triassic Yanchang Formation, Ordos Basin, China. Interpretation, 2015, 3, SJ15–SJ2310.1190/INT-2014-0125.1Suche in Google Scholar
[38] Hua, Y., Liu, X.S., Yan, X.X., Zhang, H., Discovery and reservoir-forming geological characteristics of the Shenmu Gas Field in the Ordos Basin. Natural Gas Industry, 2015, 2, 295–306 (in Chinese with English abstract)10.1016/j.ngib.2015.09.002Suche in Google Scholar
[39] Li, H.B., Guo, H.K., Yang, X.W., Wang, Z.M., Tight oil occurrence space of Triassic Chang 7 Member in Northern Shaanxi Area, Ordos Basin, NW China. Petroleum xxploration and development, 2015, 42, 434–438 (in Chinese with English abstract)10.1016/S1876-3804(15)30036-7Suche in Google Scholar
© 2018 Bojiang Fan et al., published by De Gruyter
This work is licensed under the Creative Commons Attribution-NonCommercial-NoDerivatives 4.0 License.
Artikel in diesem Heft
- Regular Articles
- Spatio-temporal monitoring of vegetation phenology in the dry sub-humid region of Nigeria using time series of AVHRR NDVI and TAMSAT datasets
- Water Quality, Sediment Characteristics and Benthic Status of the Razim-Sinoie Lagoon System, Romania
- Provenance analysis of the Late Triassic Yichuan Basin: constraints from zircon U-Pb geochronology
- Historical Delineation of Landscape Units Using Physical Geographic Characteristics and Land Use/Cover Change
- ‘Hardcastle Hollows’ in loess landforms: Closed depressions in aeolian landscapes – in a geoheritage context
- Geostatistical screening of flood events in the groundwater levels of the diverted inner delta of the Danube River: implications for river bed clogging
- Utilizing Integrated Prediction Error Filter Analysis (INPEFA) to divide base-level cycle of fan-deltas: A case study of the Triassic Baikouquan Formation in Mabei Slope Area, Mahu Depression, Junggar Basin, China
- Architecture and reservoir quality of low-permeable Eocene lacustrine turbidite sandstone from the Dongying Depression, East China
- Flow units classification for geostatisitical three-dimensional modeling of a non-marine sandstone reservoir: A case study from the Paleocene Funing Formation of the Gaoji Oilfield, east China
- Umbrisols at Lower Altitudes, Case Study from Borská lowland (Slovakia)
- Modelling habitats in karst landscape by integrating remote sensing and topography data
- Mineral Constituents and Kaolinite Crystallinity of the <2 μm Fraction of Cretaceous-Paleogene/Neogene Kaolins from Eastern Dahomey and Niger Delta Basins, Nigeria
- Construction of a dynamic arrival time coverage map for emergency medical services
- Characterizing Seismo-stratigraphic and Structural Framework of Late Cretaceous-Recent succession of offshore Indus Pakistan
- Geosite Assessment Using Three Different Methods; a Comparative Study of the Krupaja and the Žagubica Springs – Hydrological Heritage of Serbia
- Use of discriminated nondimensionalization in the search of universal solutions for 2-D rectangular and cylindrical consolidation problems
- Trying to underline geotourist profile of National park visitors: Case study of NP Fruška Gora, Serbia (Typology of potential geotourists at NP Fruška Gora)
- Fluid-rock interaction and dissolution of feldspar in the Upper Triassic Xujiahe tight sandstone, western Sichuan Basin, China
- Calcified microorganisms bloom in Furongian of the North China Platform: Evidence from Microbialitic-Bioherm in Qijiayu Section, Hebei
- Spatial predictive modeling of prehistoric sites in the Bohemian-Moravian Highlands based on graph similarity analysis
- Geotourism starts with accessible information: the Internet as a promotional tool for the georesources of Lower Silesia
- Models for evaluating craters morphology, relation of indentation hardness and uniaxial compressive strength via a flat-end indenter
- Geotourism in an urban space?
- The first loess map and related topics: contributions by twenty significant women loess scholars
- Modeling of stringer deformation and displacement in Ara salt after the end of salt tectonics
- A multi-criteria decision analysis with special reference to loess and archaeological sites in Serbia (Could geosciences and archaeology cohabitate?)
- Speleotourism in Slovenia: balancing between mass tourism and geoheritage protection
- Attractiveness of protected areas for geotourism purposes from the perspective of visitors: the example of Babiogórski National Park (Poland)
- Implementation of Heat Maps in Geographical Information System – Exploratory Study on Traffic Accident Data
- Mapping War Geoheritage: Recognising Geomorphological Traces of War
- Numerical limitations of the attainment of the orientation of geological planes
- Assessment of runoff nitrogen load reduction measures for agricultural catchments
- Awheel Along Europe’s Rivers: Geoarchaeological Trails for Cycling Geotourists
- Simulation of Carbon Isotope Excursion Events at the Permian-Triassic Boundary Based on GEOCARB
- Morphometry of lunette dunes in the Tirari Desert, South Australia
- Multi-spectral and Topographic Fusion for Automated Road Extraction
- Ground-motion prediction equation and site effect characterization for the central area of the Main Syncline, Upper Silesia Coal Basin, Poland
- Dilatancy as a measure of fracturing development in the process of rock damage
- Error-bounded and Number-bounded Approximate Spatial Query for Interactive Visualization
- The Significance of Megalithic Monuments in the Process of Place Identity Creation and in Tourism Development
- Analysis of landslide effects along a road located in the Carpathian flysch
- Lithological mapping of East Tianshan area using integrated data fused by Chinese GF-1 PAN and ASTER multi-spectral data
- Evaluating the CBM reservoirs using NMR logging data
- The trends in the main thalweg path of selected reaches of the Middle Vistula River, and their relationships to the geological structure of river channel zone
- Lithostratigraphic Classification Method Combining Optimal Texture Window Size Selection and Test Sample Purification Using Landsat 8 OLI Data
- Effect of the hydrothermal activity in the Lower Yangtze region on marine shale gas enrichment: A case study of Lower Cambrian and Upper Ordovician-Lower Silurian shales in Jiangye-1 well
- Modified flash flood potential index in order to estimate areas with predisposition to water accumulation
- Quantifying the scales of spatial variation in gravel beds using terrestrial and airborne laser scanning data
- The evaluation of geosites in the territory of National park „Kopaonik“(Serbia)
- Combining multi-proxy palaeoecology with natural and manipulative experiments — XLII International Moor Excursion to Northern Poland
- Dynamic Reclamation Methods for Subsidence Land in the Mining Area with High Underground Water Level
- Loess documentary sites and their potential for geotourism in Lower Silesia (Poland)
- Equipment selection based on two different fuzzy multi criteria decision making methods: Fuzzy TOPSIS and fuzzy VIKOR
- Land deformation associated with exploitation of groundwater in Changzhou City measured by COSMO-SkyMed and Sentinel-1A SAR data
- Gas Desorption of Low-Maturity Lacustrine Shales, Trassic Yanchang Formation, Ordos Basin, China
- Feasibility of applying viscous remanent magnetization (VRM) orientation in the study of palaeowind direction by loess magnetic fabric
- Sensitivity evaluation of Krakowiec clay based on time-dependent behavior
- Effect of limestone and dolomite tailings’ particle size on potentially toxic elements adsorption
- Diagenesis and rock properties of sandstones from the Stormberg Group, Karoo Supergroup in the Eastern Cape Province of South Africa
- Using cluster analysis methods for multivariate mapping of traffic accidents
- Geographic Process Modeling Based on Geographic Ontology
- Soil Disintegration Characteristics of Collapsed Walls and Influencing Factors in Southern China
- Evaluation of aquifer hydraulic characteristics using geoelectrical sounding, pumping and laboratory tests: A case study of Lokoja and Patti Formations, Southern Bida Basin, Nigeria
- Petrography, modal composition and tectonic provenance of some selected sandstones from the Molteno, Elliot and Clarens Formations, Karoo Supergroup, in the Eastern Cape Province, South Africa
- Deformation and Subsidence prediction on Surface of Yuzhou mined-out areas along Middle Route Project of South-to-North Water Diversion, China
- Abnormal open-hole natural gamma ray (GR) log in Baikouquan Formation of Xiazijie Fan-delta, Mahu Depression, Junggar Basin, China
- GIS based approach to analyze soil liquefaction and amplification: A case study in Eskisehir, Turkey
- Analysis of the Factors that Influence Diagenesis in the Terminal Fan Reservoir of Fuyu Oil Layer in the Southern Songliao Basin, Northeast China
- Gravity Structure around Mt. Pandan, Madiun, East Java, Indonesia and Its Relationship to 2016 Seismic Activity
- Simulation of cement raw material deposits using plurigaussian technique
- Application of the nanoindentation technique for the characterization of varved clay
- Verification of compressibility and consolidation parameters of varved clays from Radzymin (Central Poland) based on direct observations of settlements of road embankment
- An enthusiasm for loess: Leonard Horner in Bonn and Liu Tungsheng in Beijing
- Limit Support Pressure of Tunnel Face in Multi-Layer Soils Below River Considering Water Pressure
- Spatial-temporal variability of the fluctuation of water level in Poyang Lake basin, China
- Modeling of IDF curves for stormwater design in Makkah Al Mukarramah region, The Kingdom of Saudi Arabia