Analysis of landslide effects along a road located in the Carpathian flysch
-
Janusz P. Kogut
 ,
Elżbieta Pilecka
,
Elżbieta Pilecka

Abstract
Landslides in the Carpathian flysch have a peculiar susceptibility to activation. This is due to the geological structure of the flysch. This study addresses analysing the effects of a landslide, particularly in regards to the operation of a transportation route that runs through the Carpathian flysch. The studies include both field work and laboratory testing of basic geotechnical parameters. The field work comprises surveys made by a terrestrial laser scanner. The study also includes a number of 2–D and 3–D numerical models. Subsequently, survey results and an analysis of the effects of landslide susceptibility and the behaviour of the road and terrain surface, due to the different loading conditions, are shown.
1 Introduction
Several problems related to the construction and functioning of roads in the Carpathians have been revealed. This is due to the significant role of the noticeable development in transportation routes running from the north to the south of central Europe. The recent climate changes cause areas, where transport routes are particularly exposed to hazards, to succumb to technical exploitation and degradation. The elimination of the threats related to the activation of landslide phenomena becomes particularly costly. Old roads, which were once designed for significantly lower axle loads and less traffic, are the most at risk. At present, these roads are heavily exploited and have become overloaded. According to the infrastructure authorities, traffic has increased more than 20% in last ten years, while the axle load has changed from 80 kN per axle to 115 kN. As a result, both the roadway and the subgrade have undergone damage, which causes an increase in dynamic loads. Furthermore, in potentially endangered areas, it can cause the activation of landslides. Surface and subsurface soil mass movements pose a serious threat to economic activity and, often, to the health and life of people. The main natural cause of activating landslides are meteorological and hydrological phenomena. For example, intense or prolonged rainfalls in the summer and autumn periods and the rapid melting of the snow and ice cover in early spring can trigger landslides. In Poland, the region that is the most predisposed to the formation of landslides is the Carpathians. This region has valleys with high and steep slopes and its geological structure is composed of alternating layers of water-permeable sandstones and poorly permeable slate, clay and marl called flysch. This region also exhibits pits of lighter vulnerable and susceptible to landslide processes, as well as tectonic construction (rock laying, cracks, faults). In the Carpathians, which cover about 6% of Poland, about 95% of all landslides registered in Poland were identified and are being recorded. In the most susceptible regions of the Carpathians, about 40% of the area is covered by landslides or other forms of soil mass movements. It is estimated that, in this region of Poland, for every square kilometre of area and for 5 km of the road infrastructure network, there is an average of one landslide [1]. In the development of the road network in the Carpathians, one of the barriers is the high cost of development. Unfortunately, there is a great number of old roads, which have not been renovated. This also contributes to their reduced design parameters. As a result of the changes related to the increase of the traffic and the loading, carried by the axles of heavy vehicles, the risk related to the loss of stability of the routes and their sub–bases has increased. In addition, climate change contributes to the initiation and extension of Carpathian landslides.
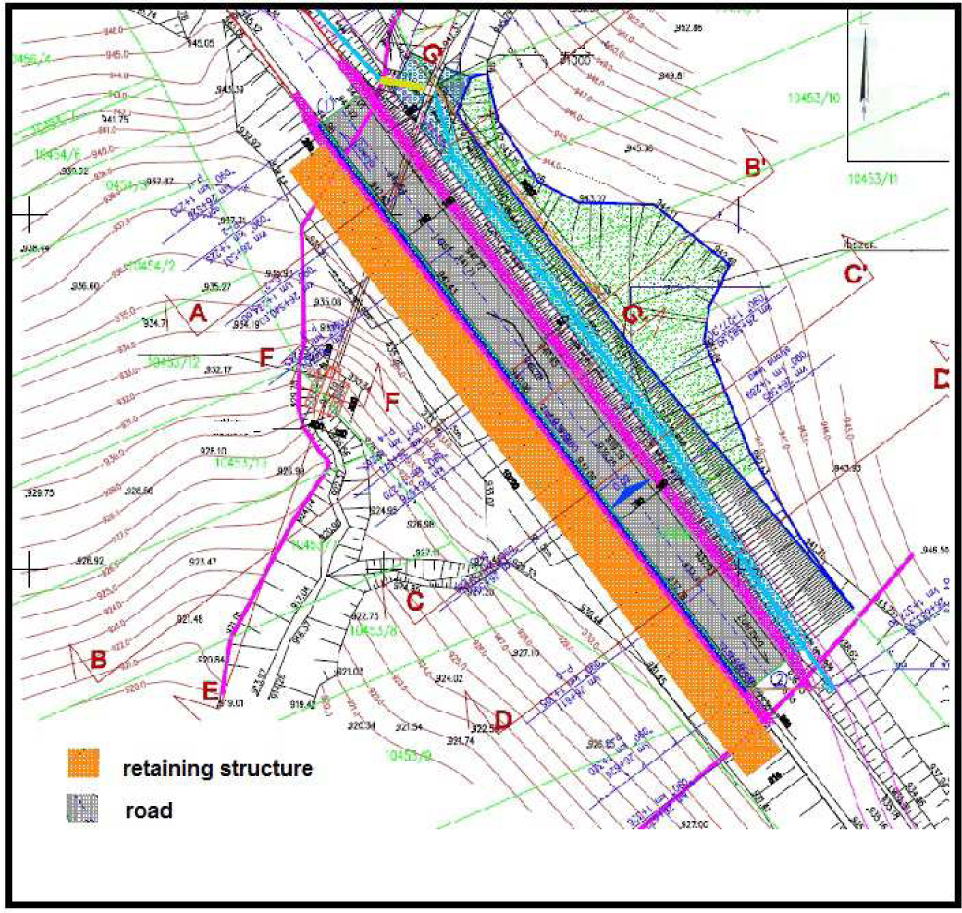
This study addresses analysing the effects of a landslide, particularly in regards to the operation of a transportation route that runs through the Carpathian flysch. The geographical area discussed here is classified as the Beskid Wysoki mountain range. The average slope of its mountains ranges from 15 to 35%, and the deep slots of the area with valleys and significant differences in height are conducive to the formation or the activation of landslides. The area of the landslide in question is located in the vicinity of Babiogórski National Park (Figure 1) and its active part has a width of about 500 m.
![Figure 1 Landslide location [2].](/document/doi/10.1515/geo-2018-0041/asset/graphic/j_geo-2018-0041_fig_001.jpg)
Landslide location [2].
2 Methods
The studies include both field work and laboratory testing of basic geotechnical parameters. The parameters obtained during the geotechnical investigations, conducted for the purpose of building a numerical model, have been completed. The field work comprises surveys made by a terrestrial laser scanner. The study also includes a number of 2–D and 3–D numerical models. These models, along with the substrate parameters, have been introduced into a Finite Element Analysis (FEA) package and then calibrated. Subsequently, survey results and an analysis of the effects of landslide susceptibility and the behaviour of the road and terrain surface, due to the different loading conditions, are shown.
3 Landslides in the Outer Carpathian flysch
Landslides in the Outer Carpathian flysch are characterised by a particular susceptibility to activation, due to their geological structure. There are several types of mass movements in the highly anisotropic flysch massifs: lateral spreading and rock flow, topple, translational, rotational and compound sliding and complex type of mass movements [3]. The Carpathian flysch is described, in a simplified way, as alternating layers of sandstone and clayey shales. In the Polish Outer Carpathians, lithologically diversified flysch rocks strongly jointed and faulted, create advantageous conditions for mass movements to develop. Human activity is also responsible for accelerating mass movements by stimulating the instability of the slopes [4]. It is in the layers of the clayey shales that the slip surface may be activated due to the high susceptibility for shale to absorb water and to soften [5] . Another feature of the geological structure of the Carpathian flysch is the existence, beneath the humus, of a weathered basement rocks. This is characterised by a large gradation of rock material. Such a weathered layer of debris laid on the bedrock also has a high susceptibility to landslide. Then the slip surface is between the weathered area and the bedrock. The greatest probability of a slip surface being formed on the contact of the weathering and rock layers of the Carpathian flysch is when the flysch layers are parallel to the potential direction of slip.
The layer of debris is also formed in other geological conditions of the Carpathian flysch sequences. As a result of the movement of the rock, a landslide is created when the direction of movement is oriented obliquely to existing surfaces. Subsequent landslides occur, when the stratification of the substrate is close to perpendicular, in relation to the slope surface. Complex landslides are a combination of the three factors mentioned above and take place in complex and heterogeneous geological structures. This type of landslide, in contrast to the previous ones (structural landslides), occurs in homogeneous (non–stratified) substrates such as silts, clays, loess, and sands. Earth masses turn around a regular circular slip surface (rotational movement). In the Outer Carpathians, such landslides are relatively rare and do not reach significant sizes. Most of the Outer Carpathian landslides have developed as compound type (with non-circular sliding zones) representing complex movements, combined with various types of displacement: rotation, translation and/or topple [3].
The landslide analysed here is defined as sub-compact and complex. From the geological and engineering documentation from 2010 and from a drilled inspection hole to a depth of about 17 m, one can clearly see the border between the zone of clayey soil and sandstone. As mentioned above, this is a typical slip surface in flysch formations. Usually, it is the highest or first slip surface from the surface. However, the thickness of the sludge deposits is quite large in this case, amounting to 5-6 meters. The slip surface may, therefore, be expected to be located in this weathered layer, depending on the condition and the water content of the soil.
3.1 Determining of the minimum slope stability factors
The Regulation of the Polish Ministry of Transportation of March 2, 1999 (Polish Journal of Laws No. 43, item 430), regarding technical conditions that should be followed by public roads and their location, also defines the concept of earth structure [6]. In paragraph 144 (2), it requires that “slope stability factors determined individually by the methods given in Polish Standards should not be less than 1.5”. This is generally accepted in road design. In section 2.2 of Annex No. 4 to the above-mentioned Regulation, the requirement to check the stability of slopes and slopes in accordance with Polish Standard PN-B-03010: 1983 [7] is repeated. While considering the possible forms of destruction of free-free and supported slopes, one should accept:
for homogeneous soil in terms of compliance – circular–cylindrical slip surfaces,
for slopes made of several layers of soil, differing in shear strength – non–circular slip surfaces,
on fractured rocks – the shape of the slip surface depends on the occurring discontinuities; the balance of the solid limited by each of the possible slip surfaces is checked, for the calculation values of forces and geotechnical parameters, by the strip method; the permissible values of stability factors should not be less than 1.5,
loading from vehicles evenly distributed, of a value of 25 kPa [6].
The other aspect of checking the stability of landslides is the uncertainty related to the soil parameters. The soil parameters used to make the necessary calculations may come from in situ tests, laboratory tests of the soil samples, and from writings related to similar cases. They may differ significantly, on a case-to-case basis. In order to verify the correctness of the determination of the soil parameters, it was decided to drill two holes in the analysed cross-section of the road discussed. One of them is 17 m deep and the other one is 1 m deep. The safety and stability of the road excavation slopes are determined by local factors, such as the discontinuities of layers. In particular, layers of rock, surfaces of fuzzing caused by, for example, earlier landslides, and many other possible geological disturbances (e.g., soil lenses) can contribute to the safety and stability. Sometimes, these factors are difficult to detect in substrate studies, especially if substrate tests are made pointwise (e.g., in the form of boreholes or soundings). Soil samples for macroscopic and laboratory tests are collected and then analysed, as well. Care should be taken when estimating soil cohesion values. The PNB-03010:1983 standard [7], for example, required that the cohesion value should to be reduced by as much as 50%, in some cases. The use of shallow geophysical methods is very desirable in the case of roads on landslides. They allow us to determine local discontinuities and loosening of some layers. The appropriate methods are various types of seismic methods, electro-resistance or ground penetrating radar (GPR) methods.
The results of the slope stability analysis are also influenced by the calculation method. It is possible to apply computational techniques based on analytical and numerical methods. The analytical methods include the methods of Felleniuss [8], Bishop [9], Morgenstern-Price [10], Sarma [11] and others. The numerical methods are based on approximation algorithms, where the space is divided into a finite number of discrete elements. The Finite Element Method (FEM) is a method based on the discretization of a physical model [12, 13]. The discretization of the model replaces the medium (i.e., the continuum), which is actually a physical model in a discrete model. Physical quantities are not distributed continuously, but they are concentrated in elements resulting from discretization. Discretization dividing of the continuum into a finite number of elements is a simplification of the physical model that facilitates much of the computations. The computations check the convergence of the process and estimate the errors of the mesh. FEM is used worldwide in well-known FEA packages such as ADINA, ABAQUS, DIANA, MIDAS and others.
The calculation method used in this study is called Strength Reduction Method (SRM). This is non-linear method based on the limit equilibrium theory [14]. The method analyses the minimum safety factor and failure behaviour using various shapes, loads, and boundary conditions. The SRM method may be used to simulate the failure process without any previous assumptions and may be applied both to 2–D and 3–D problems. The method gradually decreases the shear strength and internal friction angle until the calculation does not converge. Hence, the obtained point is considered to be the failure point of the slope. The iteration starts with the factor of safety Fos = 1 unless otherwise specified by the user and subsequently Fos is incremented. With the updates of Fos the cohesion and the tangent value of internal friction angle are scaled down. The maximum shear strength reduction ratio at that point is used to calculate the minimum safety factor of the slope. Stability by SRM is achieved by weakening the soil in an elastic-plastic discrete analysis until the slope fails. The Factor of Safety (Fos) is considered as the factor by which the soil strength is to be reduced to reach failure [15].
3.2 Road stabilization project
The research area is located in the active part of the landslide. Therefore, the section of the provincial road located along this section is at risk. The landslide card, developed in 2009, classifies the entire landslide as an old slumbering landslide, which activates during periods of adequate hydro-meteorological conditions. The activation before 2009 damaged the local road and increased the risk of rupturing the road surface over a hundred meters. Therefore, the embankment of the road was protected in this section. The landslide was reported to the Verification and Evaluation Commission as caused by natural disasters. According to the landslide card [2], it is sub–compact–complex, rock–like wasteland, the colluvium material is detritally blocky. The types of material are identified as Magura sandstones with Quaternary colluvium forms over them.
Figure 1 shows the range of the landslide and comes from the landslide registration card. The landslide consists of a main slope of about 4 m high. In the upper part of the colluvium, there is a local road exposed to soil mass movements. On the asphalt surface, despite the renovation works, one may see the contour of a landslide niche. Above the local road, under the secondary escarpment (about 943 m above sea level), there is a zone of large wetlands. It is additionally supplied with a stream flowing periodically. The road surface is within the range of this zone, where the active part of the landslide is located. The landslide descends to the stream and it has a height of about 5 m there. The landslide has formed on the lower slope of the Sylec stream valley, and the direction of sliding off the soil masses runs from NE to SW. The colluvium area is regularly drained by a surface stream flowing through the culvert under the road, and at the foot of the slope.
There was no regulated drainage system along the road. The roadside drainage ditch did not fulfil its task, especially during periods of heavy rainfall and spring thaws. The culvert existing in the landslide was damaged, which, in turn, led to the collapse of the colluvium and the formation of wetness at its outflow.
As part of construction works, a project to stabilize the landslide and the road was carried out within the 100.0 m long road project. The reinforcement of the existing pavement structure at a width of 7.00 m, with both sides of the road paved with width of 1.60 m and 1.85 m, was made. The rainwater was drained, in a controlled manner, to two wells and further by the road to the roadside ditches.
Within the project framework, geological engineering documentation was prepared. On the basis of this documentation, it was found that the existing pavement structure in the upper 20 cm layer are bituminous layers. Below, to the depth of 2.00 m to 2.50 m, there is a road embankment composed of clayey sandstone particles. Under the road structure, there is natural soil of semi stiff and plastic texture. At the depths of 3.0 m and 6.0 m, groundwater filtration occurred. On the basis of the traffic measurements and geological engineering documentation, the required thickness of the pavement structure was assumed, taking into account the frost resistance condition. Taking the above conditions into consideration, the following pavement structure was used for the road system:
wearing layer made of asphalt concrete AC 11 with 5 cm of modified bitumen,
basic foundation made of asphalt concrete caliber 0/20 mm, 13 cm thick,
auxiliary foundation made of broken aggregate mechanically stabilized caliber 0/31.5 mm, 20 cm thick, layer of crushed aggregate 0/63 mm 35 cm thick,
geotextile with the following parameters: tensile strength (length/width) min. 80/80 kN/m, elongation (length/width) max. 12.5/12.5 %, and water permeability (perpendicular/in the plane) 50/30 l/m2s.
The total thickness of the renovated road was equal to 73 cm. The ordinates of the area covered by surface mass movements range from 965 m above sea level, in the upper edge of the main embankment, up to 880.0 m above sea level, in the area of the front of the landslide. There is no continuous aquifer in the quaternary area formations; however, the occurrence of water flow within the sandstone clayey deposits was identified. The water is coming from surface water infiltration. The intensity of the filtration is largely dependent on the amount of precipitation.
Several steps were taken in order to limit the inflow of water from the area above the road:
modernization and reinforcement with a reinforced concrete slab of the existing culvert of 1000,
strengthening the inlet to the road culvert,
strengthening and modernization of the outlet from the culvert.
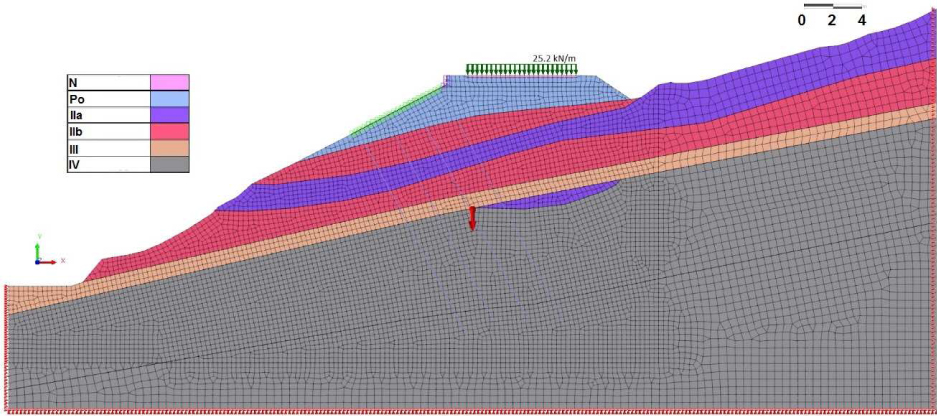
The regulation of the water management of the entire landslide area by capturing the surface waters was not possible due to the terrain and its afforestation. After the drainage was installed, the current water flow protection is fulfilling its task. The retaining structure is located along the road below its edge. It was built in the form of a 20 cm thick reinforced concrete slab. The slab is fixed to the subsoil with ground anchors 40/16. For the purpose of calculations, it was assumed that the probable slip surface is located at a depth of about 7.0 m, but the anchoring was assumed to be in the layer of fine sandstone under the deepest slip surface specified by geological documentation. The length of ground anchors was 15.0 m and 17.0 m. The anchors were spaced 2.0 m in both directions and finished with 4.0 m long concrete bond. The tendons were fixed in a reinforced concrete slab with steel plates 20 × 20 cm. The retaining structure is divided by 5 cm wide dilatations into separate segments. Along the road, due to the need to widen the shoulder, the upper edge of each section was finished with a vertical wall thickness of 20 cm. The wall height of 0.60-0.74 m was adjusted to the slope of the longitudinal road. In a reinforced concrete slab, horizontally mounted filters 10 cm were placed at a distance of 2.0 m in both directions. Figure 2 presents the land development within the landslide and road, while Figure 3 shows the cross-section through the reinforced concrete slab with the reinforcement and schematically marked ground anchors.
Plan of development within the landslide and the local road.
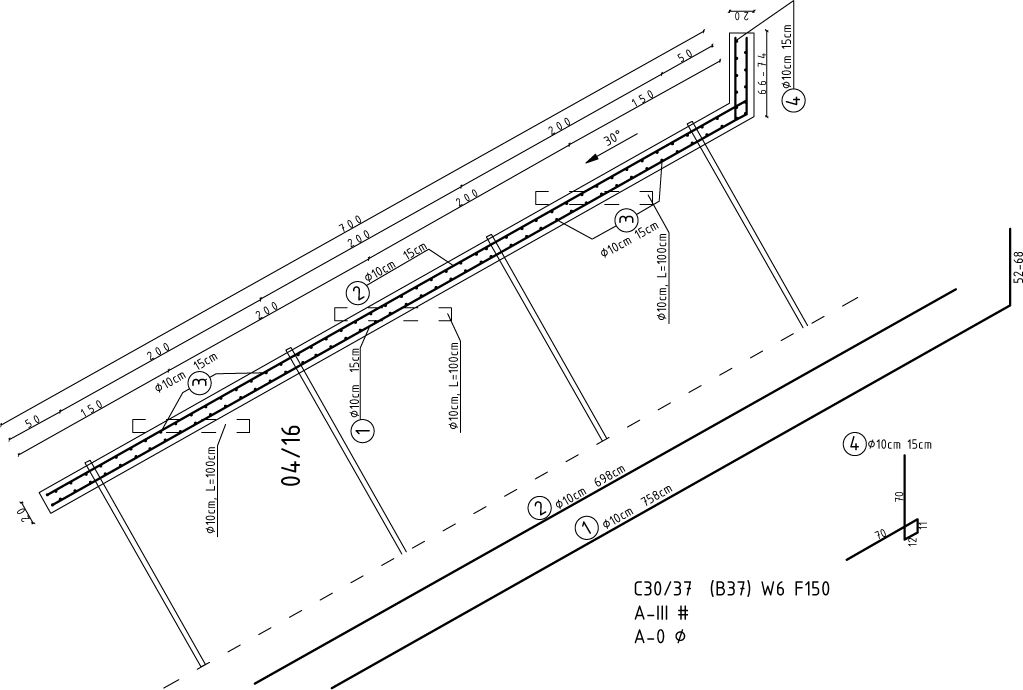
Design of road protection against the landslide. Cross-section through a reinforced concrete slab with reinforcement and schematically marked ground anchors.
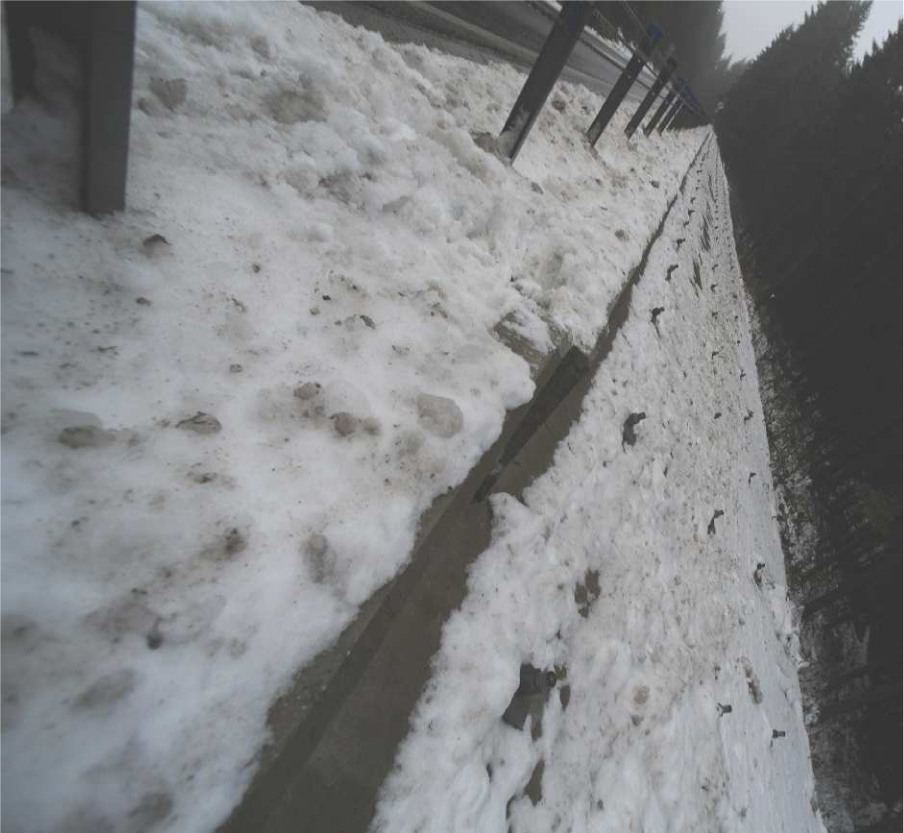
After the work to stabilize the landslide, in accordance with the design that was approved for implementation, a new road surface was made in this section and the road was re-opened. After a couple of years, considerable displacements were observed from the third, counting from the pass side, a section of the retaining structure. The as-built inventory shows that the sections of the retaining structure has been visibly dislocated. The displacement is clearly visible in the upper part of the plate and measures 8 cm horizontally and 3 cm vertically. There are several reasons for this:
water accumulation in the road body,
incorrectly made anchoring of a part of the plate,
soil quality locally poorer than shown in the design.
3.3 Field and laboratory tests results
The necessary field and laboratory steps were carried out to identify the cause for the excessive displacements of the reinforced concrete slab section. Among others, two boreholes were drilled together with the collection of the samples for laboratory tests. One borehole, marked in Figure 4 as OT-A, was made using the mechanical and rotary method, on the water scrubber, a double core machine with 116.95 millimetres drill. The drilling depth was 17 m in cross-section through the road corresponding to the third section of the retaining structure.
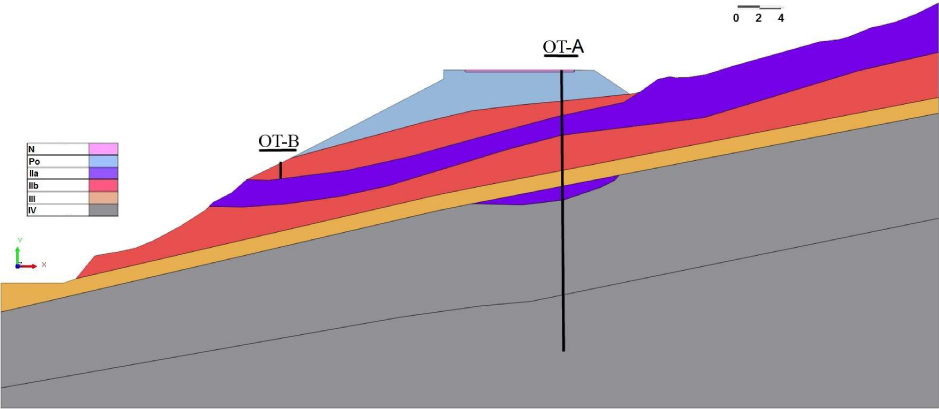
Cross-section with the drilling boreholes marked.
Another borehole was made by manual drilling to a depth of 1 m in order to take undisturbed soil samples (OT-B). The resulting cross-section is, according to the design, a road structure layer with a thickness of approximately 20 cm, followed by a 20 cm foundation and an additional 35 cm substructure. At a depth of about 75 cm below the ground level, a geotextile that separates the main road structure from the modified substrate was found. This subsoil consists of successive layers of up to 2.00 m below the ground level, a strongly compacted layer of building embankment, and then sandstone clay with varying degrees of plasticity, mainly with a stiff and firm consistency. At a depth of about 7-7.20 m below the ground level, a strongly fractured layer of sandstone appears at the drilling site, which is identified as a potential slip surface. Then, up to a depth of 17 m below the ground level, there is a sandstone with a different degree of cracking. Nowhere in the cross-section is there free or suspended water. Figure 5 presents the samples taken from the OT-A borehole in one–metre sections.
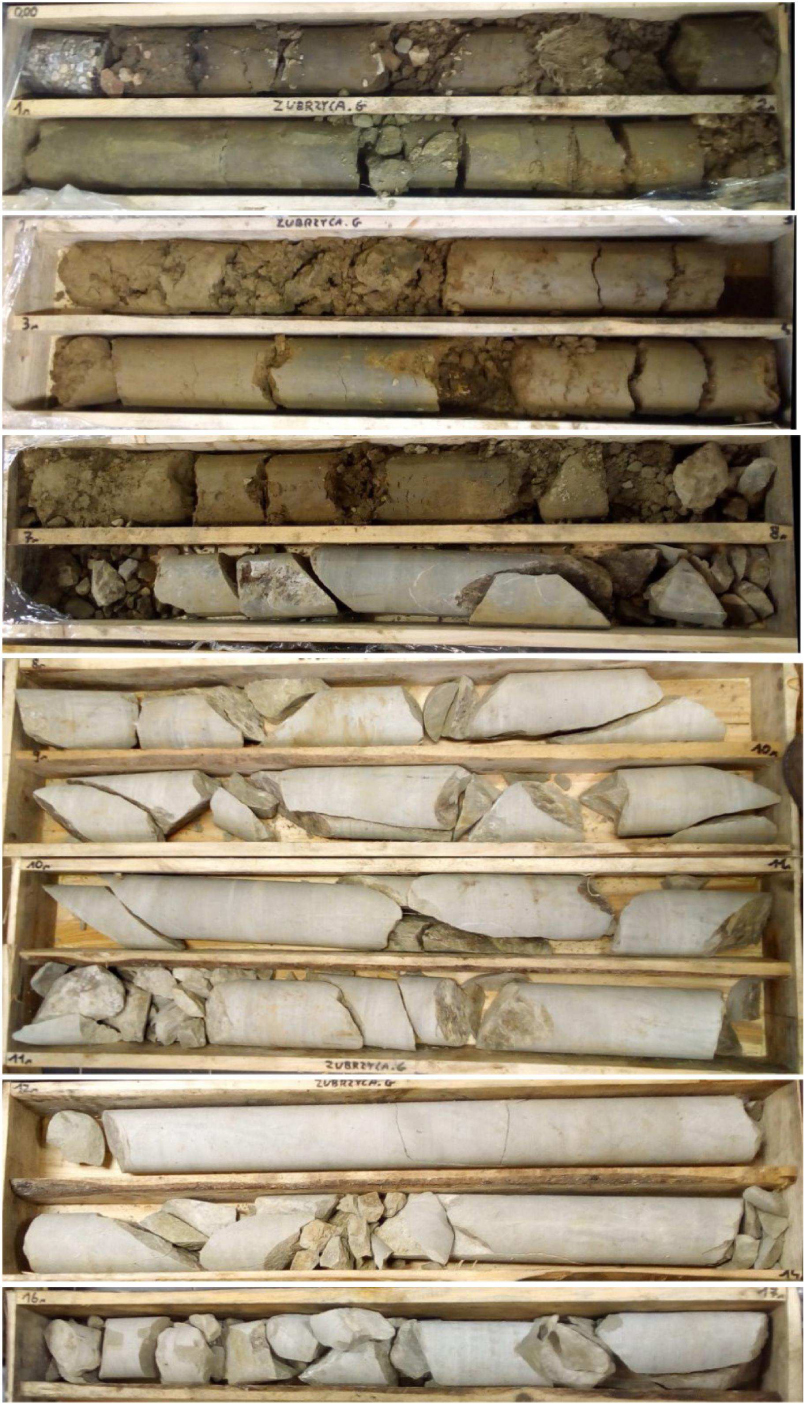
Overall view of the samples taken from the OT-A borehole.
During the fieldwork, a determination of the overall soil parameters from each geological layer was performed macroscopically [16]. Later on, laboratory tests for the water content [17], as well as the grain size distribution curve [18], were performed. The tests were carried out for eight representative samples in the OT-A borehole and one from OT-B. The grain size distribution (i.e., the sieve and hydrometer analysis) was carried out for four representative soil samples. Moreover, six determinations of soil strength parameters were carried out using a triaxial stress apparatus [19] to test the disturbed samples of unconsolidated soil in undrained conditions (UU). Figure 6 presents the Mohr circles obtained during the triaxial test with a confining pressure, namely 100 kPa, 150 kPa and 200 kPa, of a disturbed sample in undrained conditions from 1.2 m below the ground level. Figures 7 and Figure 8 present the results of a similar test for disturbed samples taken from 3.6 m and 6.6 m, respectively. Based on the results of the triaxial tests, the effective values of internal friction angle and cohesion, as fundamental parameters for the failure criterion of the soil were derived. The results are presented in the collective summary of the laboratory test results in Table 1.
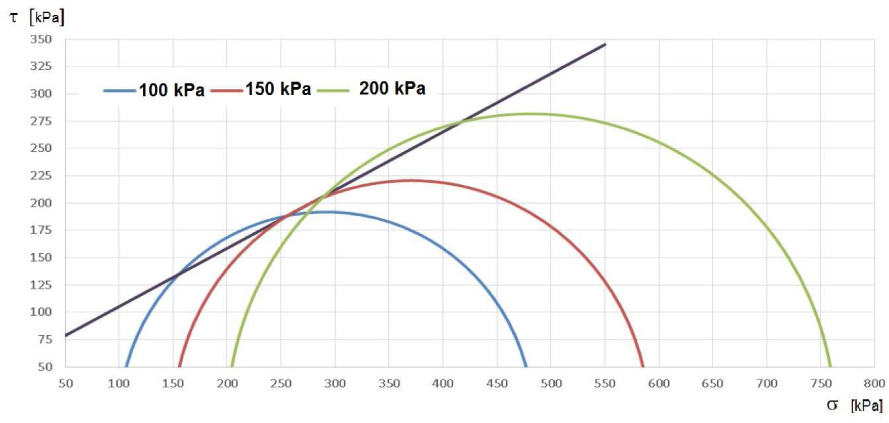
Mohr circles obtained during a triaxial UU test of a disturbed sample in undrained conditions from 1.2 m below the ground level.

Mohr circles obtained during triaxial UU test of a disturbed sample in undrained conditions from 3.6 m below the ground level.
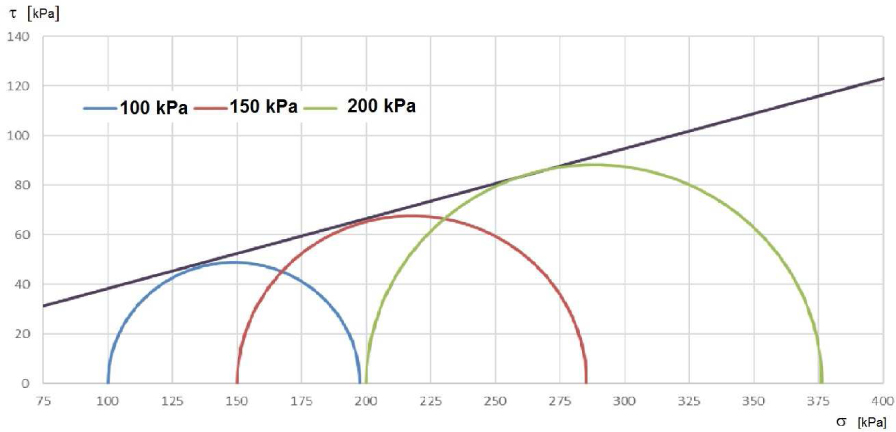
Mohr circles obtained during triaxial UU test of a disturbed sample in undrained conditions from 6.6 m below the ground level.
Parameters obtained from the OT-A and OT-B boreholes during the tests.
| Borehole | Layer | Thickness | Depth | Type | Natural water content | Density | Liquid limit | Plastic limit | Liquidity index | Effective internal friction | Effective cohesion |
|---|---|---|---|---|---|---|---|---|---|---|---|
| [m] | [m] | [%] | [g/cm3] | [%] | [%] | IL [ – ] | [deg] | [kPa] | |||
| 0.9 | 10.1 | - | 23 | 17 | -1.0 | - | - | ||||
| OT-A | I | 0.2-2.0 | 1.2 | Mm | 9.3 | 2.23 | - | - | - | 32 | 52 |
| 1.8 | (clGr) | - | - | 29 | 17 | -0.3 | - | - | |||
| 2.1 | 14.1 | - | 31 | 21 | -0.1 | - | - | ||||
| OT-A | IIb | 2.0-3.0 | 2.5 | - | 2.18 | - | - | - | 11 | 35 | |
| 3.3 | 18.7 | 2.19 | - | - | - | 28 | 39 | ||||
| OT-A | IIa | 3.0-4.0 | 3.5 | clGr | - | - | 29 | 19 | 0.1 | - | - |
| 4.6 | 23.1 | - | 33 | 22 | 0.2 | - | - | ||||
| 5.3 | 13.2 | 2.17 | - | - | - | 13 | 35 | ||||
| OT-A | IIb | 4.0-7.0 | 5.5 | - | - | 31 | 30 | 0.1 | - | - | |
| 6.5 | - | - | 38 | - | - | - | - | ||||
| 6.6 | 22.0 | 2.18 | - | - | - | 17 | 11 | ||||
| OT-A | III | 7.0-7.2 | - | Sandstone strongly fractured (potential slip surface) | - | - | - | - | - | - | - |
| OT-A | 7.2-14.6 | - | Sandstone | - | - | - | - | - | - | - | |
| OT-A | IV | 14.6-15.0 | - | Sandstone fractured (potential slip surface) | - | - | - | - | - | - | - |
| OT-A | 15.0-17.0 | - | Sandstone | - | - | - | - | - | - | - | |
| OT-B | I | 0.0-0.3 | Organic | 42.7 | - | - | - | - | - | - | |
| OT-B | II | 0.3-1.0 | 1.0 | sasiCl | 21.0 | 2.02 | 46 | 32 | -0.5 | 8 | 13 |
In the case of Magura sandstone, the Rock Quality Designation Index (RQD) [20], presented in Table 2, was found. One may notice that the quality of the rock mass is assessed as an average.
Rock Quality Designation Index [20] values of Magura sandstone.
| Sample | Depth | RQD |
|---|---|---|
| [m] | [%] | |
| 1 | 8-9 | 69 |
| 2 | 9-10 | 63 |
| 3 | 10-11 | 77 |
| 4 | 11-12 | 62 |
| 5 | 12-13 | 86 |
| 6 | 13-14 | 56 |
| 7 | 14-15 | 46 |
| 8 | 15-16 | 66 |
| 9 | 16-17 | 58 |
The strength of the rock was also measured using a Schmidt hammer. These values were obtained for six rock samples and are presented in Table 3. These rocks are characterized by homogeneous strength parameters in the range of 39.5-45.5 MPa. The uniaxial compression tests some of the soil samples were performed in an unconventional manner [21]. Figure 9 presents the experimental setup. The compression force and the vertical displacement were measured with the force measurement resolution equal to 0.1 N, while the resolution of the vertical deformations measurements was equal to 0.002 mm [22]. Moreover, a digital high resolution camera was used in the experiment; furthermore, a digital image correlation method was performed.
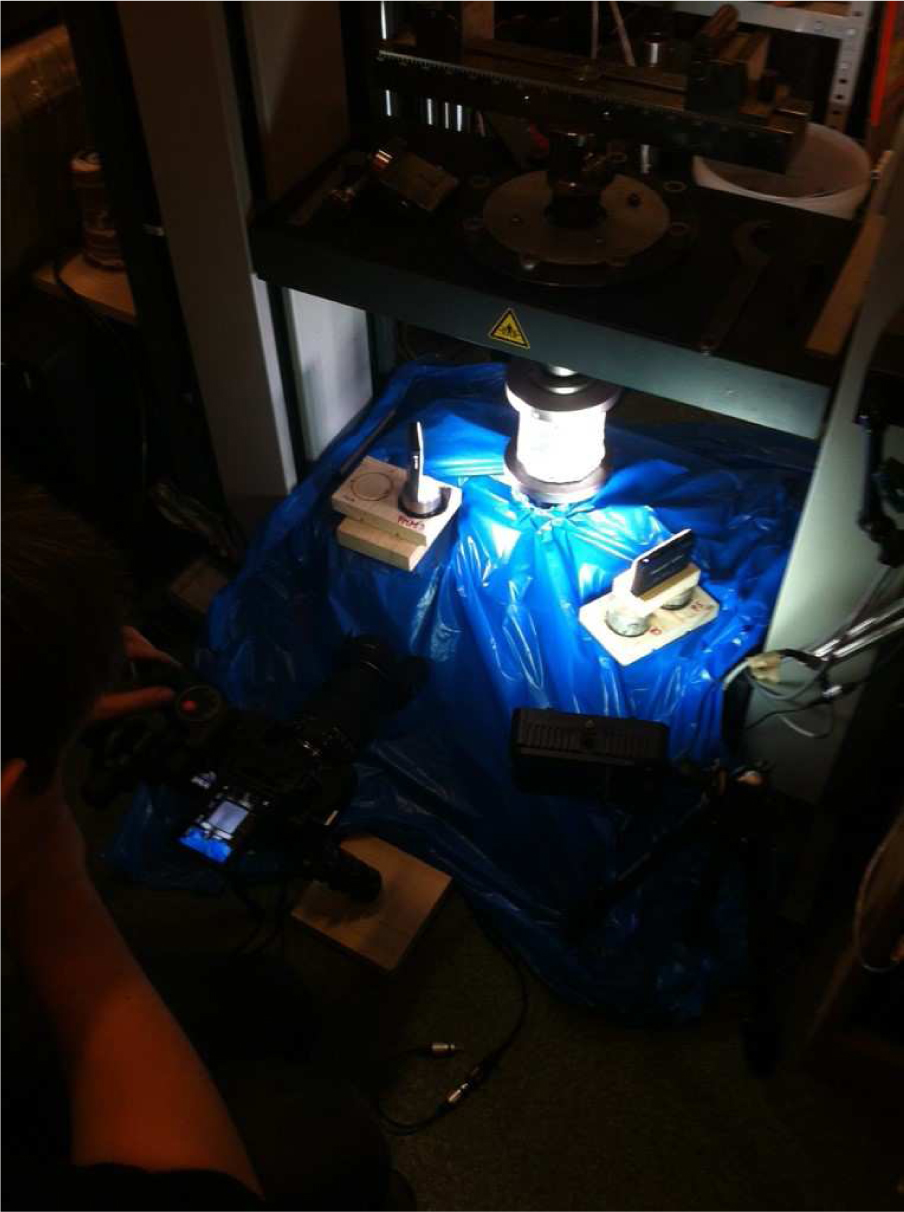
Experimental setup of uniaxial compression test consisting of the high resolution camera and the static testing machine.
Strength parameters of rocks.
| Sample | Depth | Type | Strength |
|---|---|---|---|
| [m] | [MPa] | ||
| 1 | 7.50 | Sandstone, fractured | 43.5 |
| 2 | 9.10 | Sandstone, fractured | 45.5 |
| 3 | 11.70 | Sandstone, fractured | 40.0 |
| 4 | 12.50 | Sandstone, fractured | 45.0 |
| 5 | 13.30 | Sandstone | 39.5 |
| 6 | 16.80 | Sandstone, fractured | 39.5 |
The resolution refers to the original value, which is obtained by means of an optical measurement, and, in this case, it is the displacement of a given point (marker). Thanks to the use of sub-pixel measurement, the measurement resolution was, depending on the test, from 0.01 to 0.02 px, yielding 0.0004 and 0.0008 mm, respectively. The collected image data was processed using an optical measurement system (CivEng Vision) [21]. According to ISO 17892 [23], the cross-sectional area of the specimen may either be circular or square, and is at least 1000 mm2. For cylindrical samples, the ratio between height and diameter is between 1.8 and 2.5. The largest particle in the sample should not exceed
![Figure 10 Stress-strain curves received for the uniaxial compression tests [21].](/document/doi/10.1515/geo-2018-0041/asset/graphic/j_geo-2018-0041_fig_010.jpg)
Stress-strain curves received for the uniaxial compression tests [21].
Young modulus and Poisson ratio of the analysed soil samples.
| Sample | Young modulus | Poisson ratio | Soil density |
|---|---|---|---|
| E [MPa] | ν [ – ] | ρ [g/cm3] | |
| #1 | 23.6 | 0.26 | 2.18 |
| #2 | 29.8 | 0.35 | 2.19 |
| #3 | 43.4 | 0.34 | 2.17 |
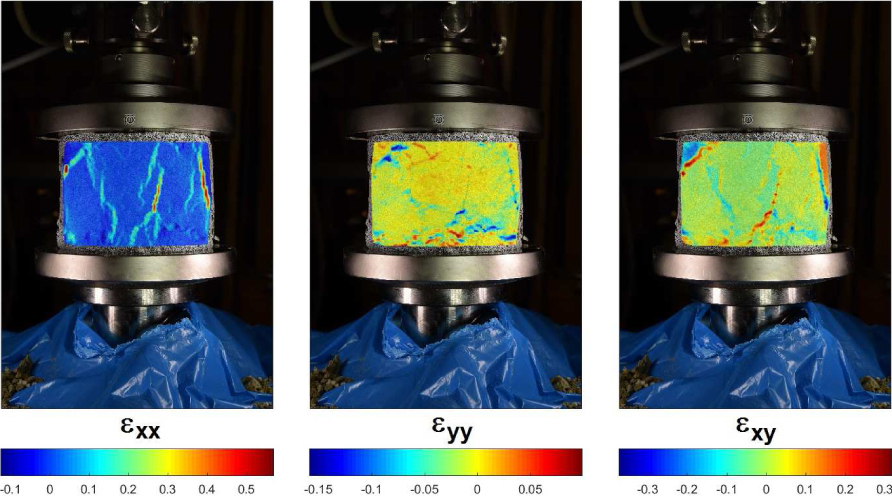
Figure 11 presents the digital maps of the strain tensor components, namely εxx, εyy, εxy, put on the image of soil sample 1. From the first tensor component εxx map, one may notice a least three oblique cracks. Two of them are not visible in εyy strain components, while the εxy tensor component map visibly exhibits only two cracks. Figure 12 presents the digital maps of the strain tensor components put on the image of soil sample # 2. Once again, from the tensor component εxx map, one may notice a least three oblique cracks, while the εyy strain components map shows only a horizontal crack. Observing the εxy tensor component map, one may notice two cracks nucleating in the upper corners. Figure 13 presents the digital maps of the strain tensor components put on the image of soil sample # 3. Similarly to the previous samples on the first tensor component εxx map, one may notice the oblique cracks very clearly, while the εyy strain component map does not show them at all. The εxy tensor component map is complementary to the εxx component map and confirms visible cracks.
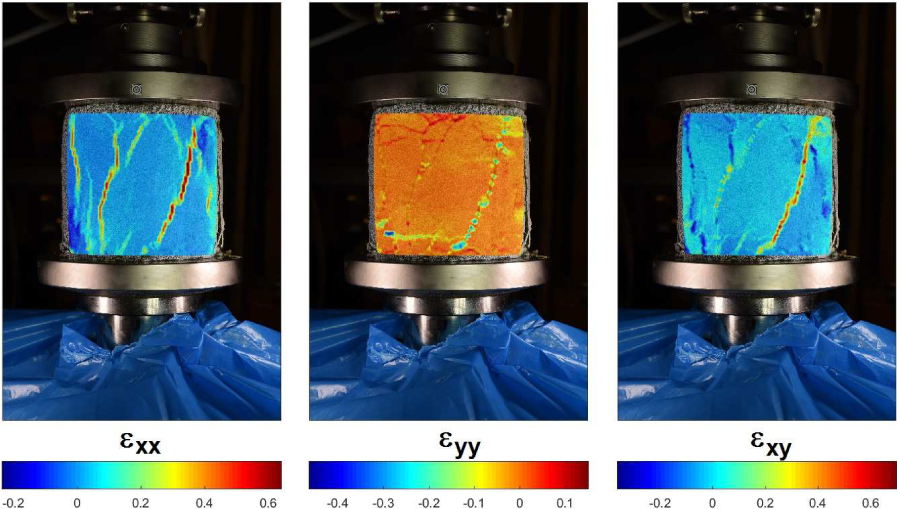
Strain tensor components of the final digital maps, put on the image of soil sample # 1.
Strain tensor components of the final digital maps, put on the image of soil sample # 2.
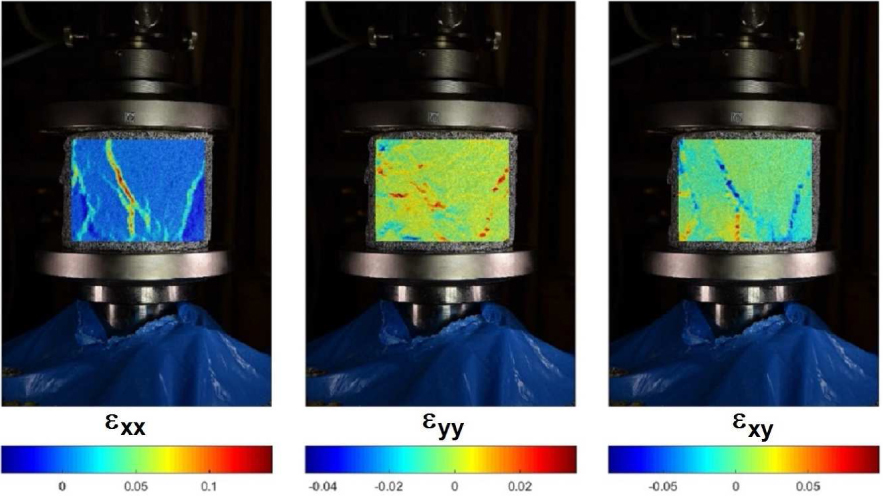
Strain tensor components of the final digital maps, put on the image of soil sample # 3.
The analysis of the uniaxial compression tests of the soil samples indicated that the behaviour of the soil is more similar to cohesive clay than it is to non-cohesive gravel. The use of the non-contact optical method, followed by the study of a digital image correlation (DIC) of the sample obtained during tests effectively completes the description of the behaviour of this type of soil material. The parameters determined during the tests shown in Table 4 were applied to the numerical models built subsequently, as well as to further analyses.
3.4 Surveying work
As part of the surveying work, a local situation and altitude map of the landslide was made using a Riegl Vz–400 terrestrial laser scanner. The ordinates were determined using the method of direct geodetic measurements in the field in the local coordinate system.
Figure 14 shows a terrestrial laser scan within overall view of the analysed landslide. Figure 15 shows the image of a road and the landslide developed using the Riscanpro package on a stretch of 75 meters. The image obtained, in the form of a cloud of points, may be compared with subsequent scans in order to monitor landslide movements.
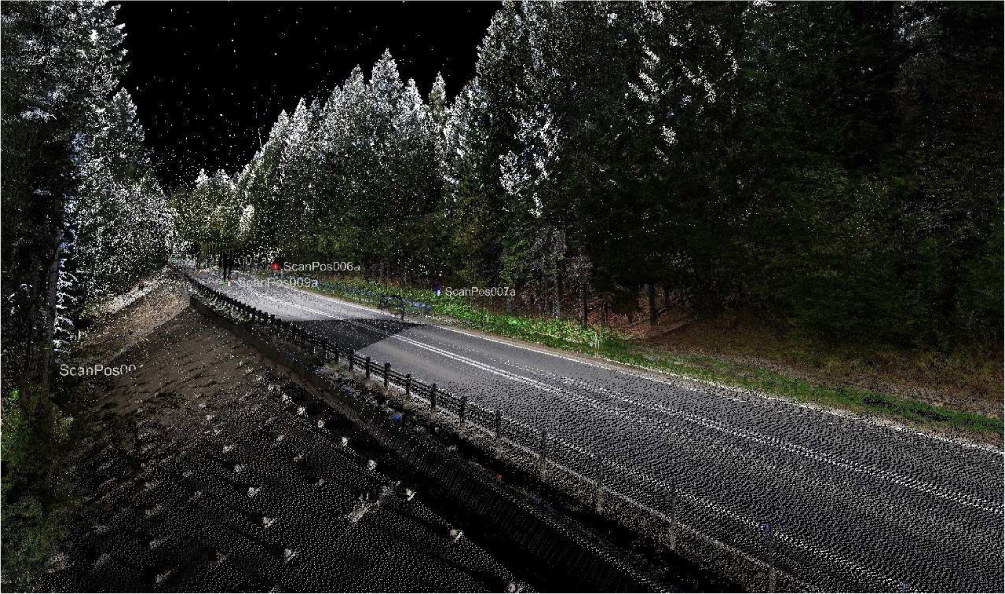
Terrestrial laser scan within overall view of the analysed landslide.
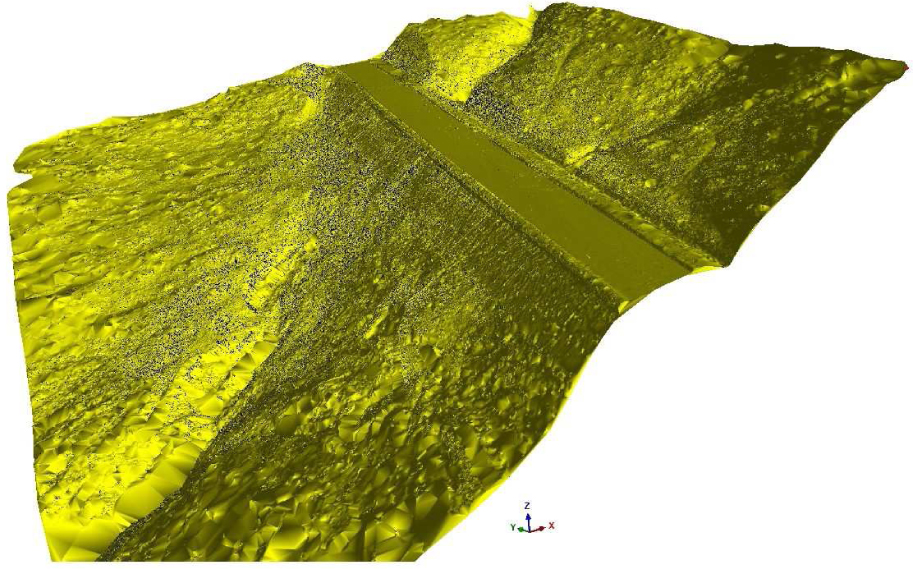
Road laser surface scan overview within the analysed landslide.
4 Slope stability numerical model
In order to verify the correctness of the solution, a 2–D numerical model of the B–B’ cross-section was built. The cross-section was the closest to the section passing through the overly displaced section, and numerical calculations were performed. Substrate parameters were assumed, as they were obtained from the documentation before the development of the detailed design and do not differ much from those shown in Table 1. Layer IIb has substantially lower value of the internal friction angle equal to ϕ = 8°, similarly to Layer II. Figure 16 presents the ground model adopted for computations.
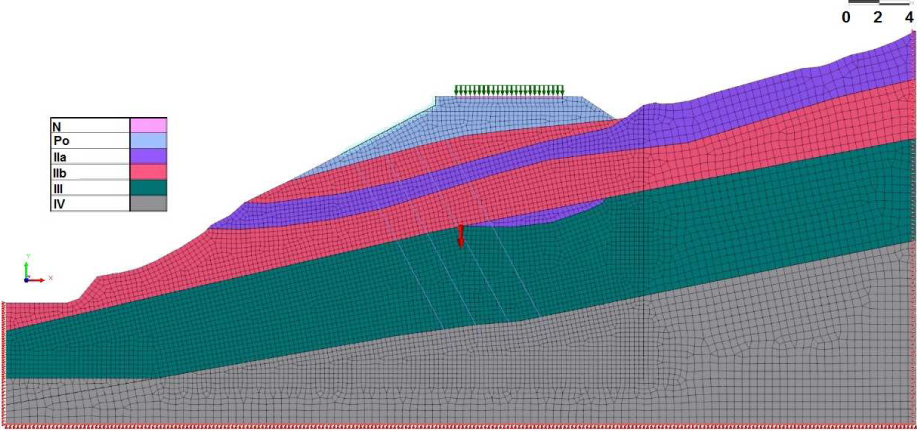
Substrate model corresponding to the B–B’ cross-section together with the finite element mesh.
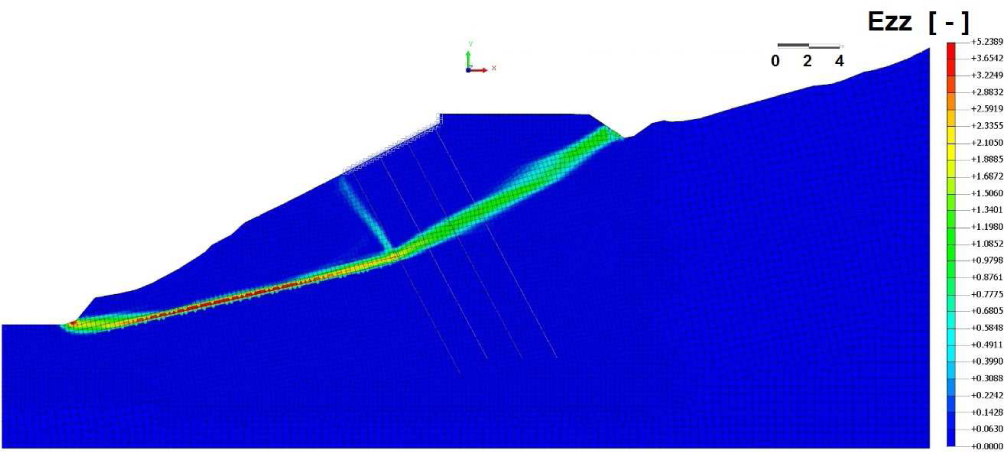
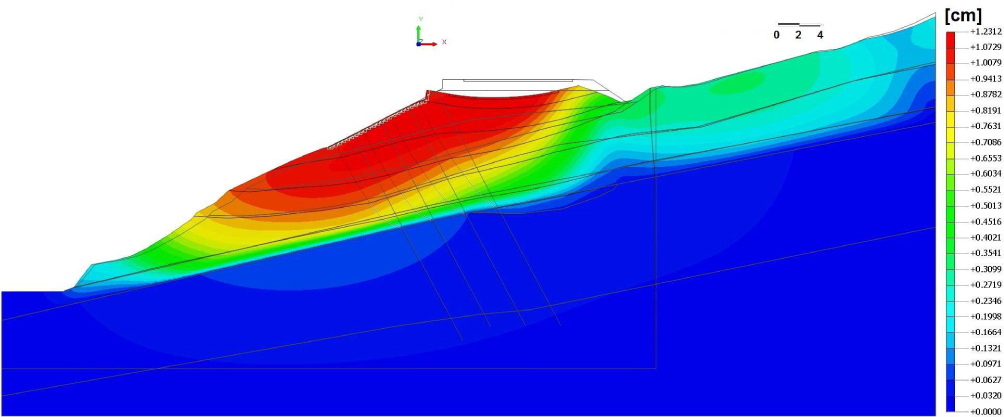
Subsequently, the substrate model was discretized by a finite element mesh and computed using the FEM package [15]. Figure 17 presents the potential slip surface obtained from the model and the factor of stability, which, in this case, is equal Fos = 1.23. With the construction solution adopted, the slope of the road remains stable, namely the forces acting to maintain the slope stability are greater than the forces destabilizing the slope. According to PN-B-03010:1983 [7], the safety factor interpreted here as the inverse of the stability factor for the roads supporting the road is in the range of m = 0.70-0.75 (i.e. Fos = 1.33-1.43). It means that it is slightly higher than that obtained from the modelling. Therefore, it is likely that ground anchors were used, properly installed, i.e. their trajectory intersected the plane of slip and anchorage was made below in a stable ground. Next, calculations simulating the behaviour of the entire structure along with the ground were carried out in order to estimate the potential displacements. Figure 18 presents the map of total displacements calculated for the parameters obtained from the design documentation. Maximum total displacements do not exceed 4.40 cm. Thus, they are much smaller than the limit values and those measured during the survey.
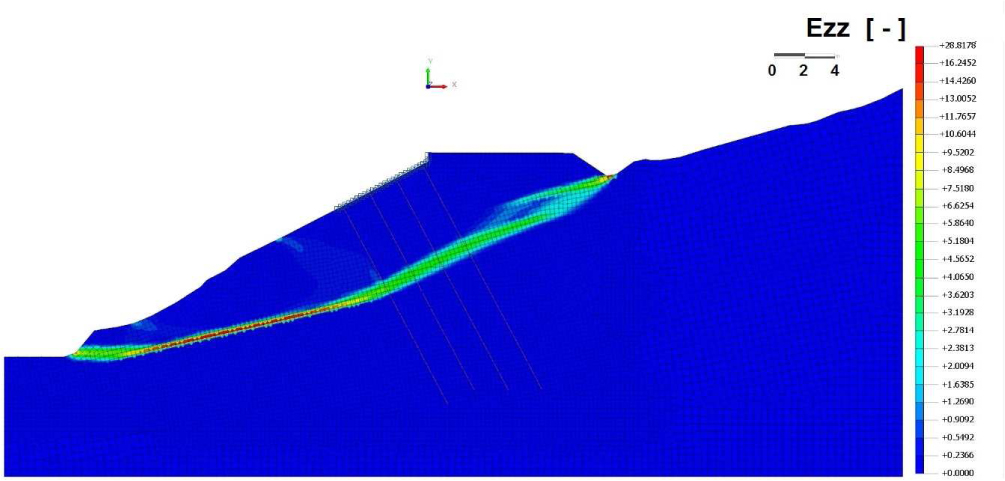
Slip surface obtained for the B–B’ section with a safety coefficient of slip surface obtained for the analysed cross-section with a stability factor of Fos = 1.23.
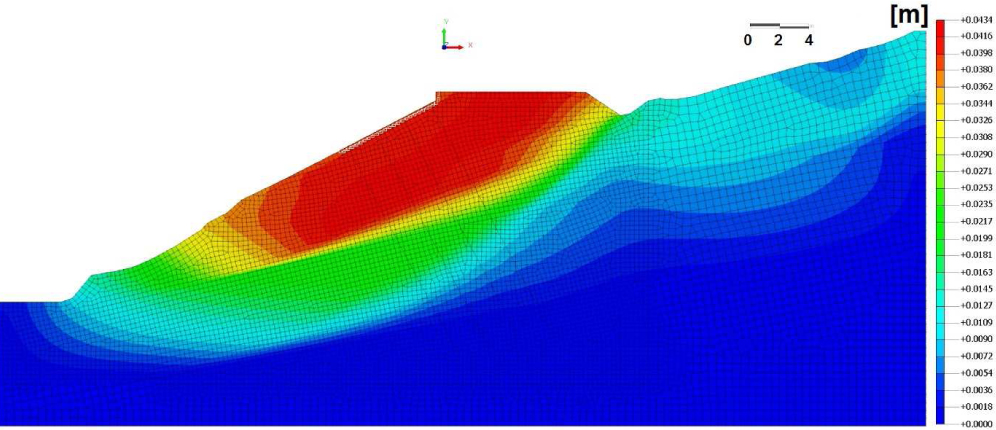
Map of total displacements obtained to verify the correctness of the design solution.
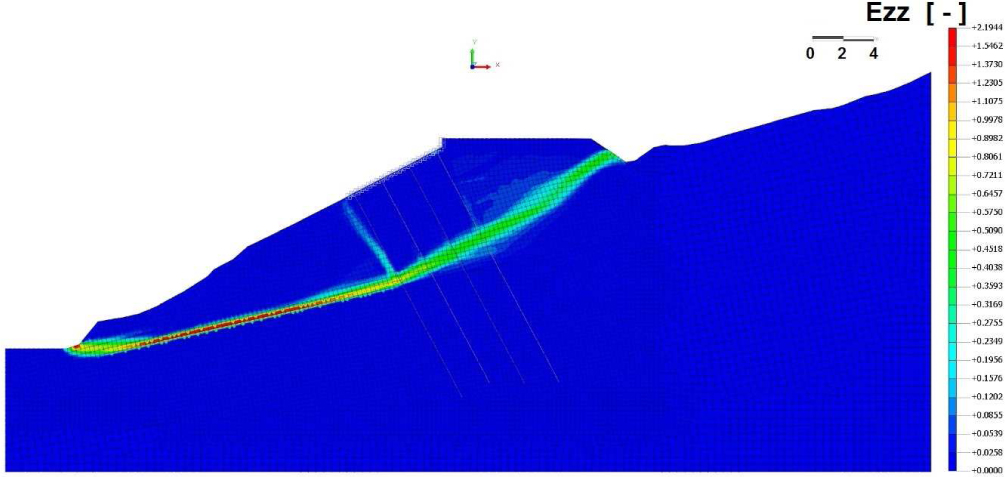
Figure 19 presents discrete numerical model based on the parameters obtained from the in-situ and laboratory tests as presented in Table 1 and Table 4. The numerical analysis of the described model made it possible to conclude that the stability coefficient is Fos = 1.40. The slip surface is shown in Figure 20. The slip surface does not differ much from the one that was obtained for the assumptions used in the design calculations. This value is the acceptable under the PN-B-03010:1983 standard, as it is exactly within the allowed range. The slip surface does not differ much from the one that was obtained for the assumptions used in the design calculations.
Discrete numerical model based on the parameters obtained from the in-situ and laboratory tests.
Slip surface obtained for the analysed cross-section with a stability factor of Fos = 1.40.
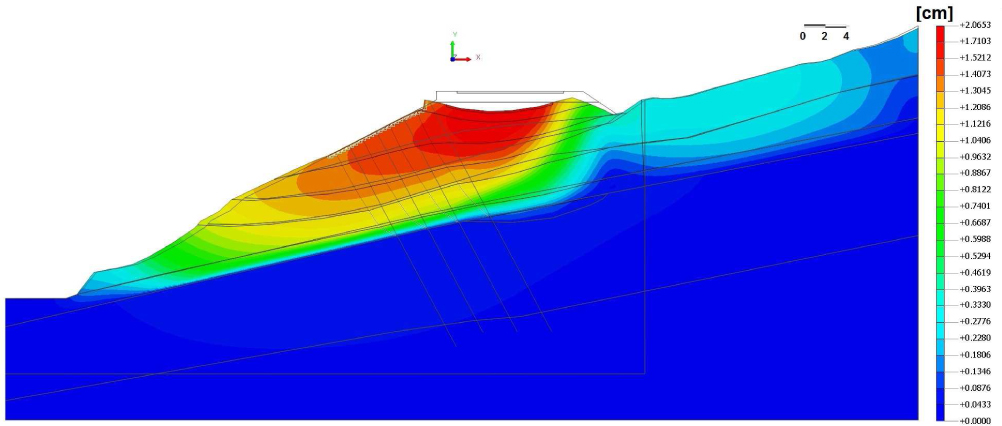
For the model adopted in this way, identical loads were accepted to those for which design calculations were made. As the next step, static calculations were performed, the result of which, in the form of a map of total displacements, is presented in Figure 21. The model shows that total displacements amount to approximately 1.2 cm; however, they are smaller than those noticed in the displaced cross-section. Therefore, the loading was re-analysed and focused on the passage of two heavy vehicles, the weight of which is transmitted via the rear axle and exceeded the permissible load, which was taken previously into account. Due to the road category and the traffic level, it was assumed that these exceptional loads are four wheels, each of 96.6 kN.
Map of total displacements obtained in the examined cross-section of the landslide along with the deformed FEA mesh.
The stability calculations of the substrate were made again and, in this case, the factor of stability was Fos = 1.34. The value was in the range accepted under the PN-B-03010:1983 standard but not met by the Instruction [24], where it is equal to Fos = 1.5. The shape of the slip surface did not change much. It is presented in Figure 22.
Slip surface obtained for an analysed cross-section with a stability factor of Fos = 1.34.
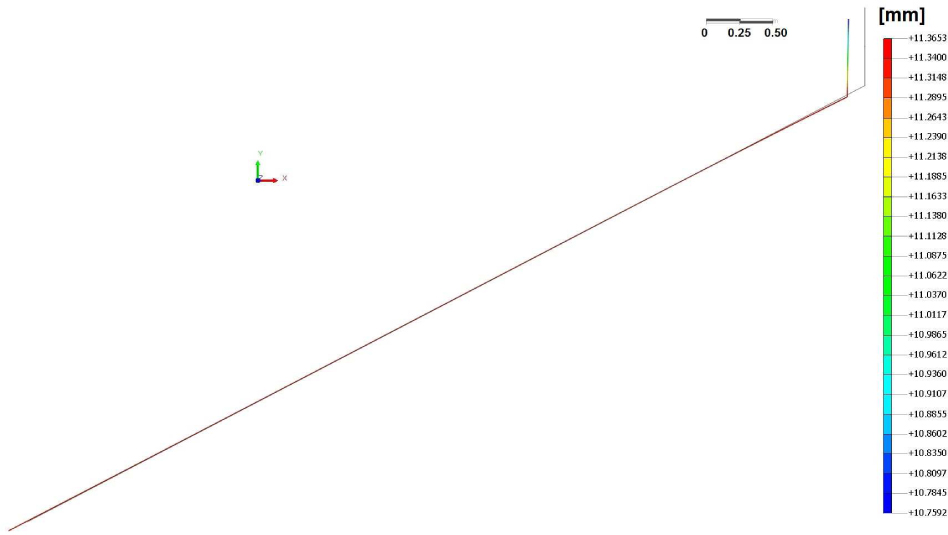
The calculated displacements do not exceed the limit values in this case. The map of total displacements together with the deformed cross-section is shown in Figure 23. An analysis of the behaviour of the retaining structure itself was also made. This structure consists of reinforced concrete rectangular elements and steel anchors fixed below the slip surface by placing a mound in the sandstone rock. Figure 24 presents the maximum longitudinal forces obtained in steel anchors. It is assumed in the model that there are four anchors in cross-section.
Map of total displacements obtained in the examined cross-section of a landslide along with a deformed FEA mesh in case of exceptional load.

Longitudinal forces obtained in the anchors from numerical model in the cross-section examined.
Figure 24 shows that the first anchor is compressed and the other three anchors are in tension. The results show that the maximum forces that can be taken over by individual anchors are much greater than those obtained during numerical analyses. Figure 25 presents the behaviour of the concrete wall of the segment, which was subjected to excessive displacement. The results show that the wall modelled here as a beam-type element acts like a rigid structure and moves in a direction parallel to the direction of the slope. Despite the adoption of increased loads, the displacements are much smaller than the ones observed in reality. Because of the use a 2–D model, some spatial behaviour of the reinforced concrete section is not possible. The spatial work of the road-retaining structure-landslide generates additional forces and rotating moments, so the system is more complex. The considerable size of the landslide, which causes the section to rotate, can be limited by pulling the structure of adjacent segments.
Deformed reinforced concrete wall and its total displacements obtained in the cross-section examined.
5 Soil-retaining structure FEM spatial analysis
A terrestrial laser scanner surveying allowed us to apply the map of the terrain surface to the numerical 3–D model. The model utilized the data from the design documentation about the spatial variability of the subsoil and the soil effective parameters from the tests. The 3–D model was built then and loaded with pointed forces corresponding to axles of several trucks. This ensures that, the rear axles were directly above the analysed cross-section. Figure 26 presents the FEM model, while Figure 27 presents map of vertical Szz stresses showing the series of truck loading. Figure 28 presents a map of horizontal displacements of the 3–D numerical model. Figure 29 shows the deformed cross section of the 3–D model. Figure 29 exhibits a significant similarity of the behaviour of the model in relation to Figure 30. This confirms the authors’ assumptions about the interaction of the road-retaining system with the ground. The total calculated displacement for the third section is 9.3 cm. This is a value that corresponds to that which is observed in reality.
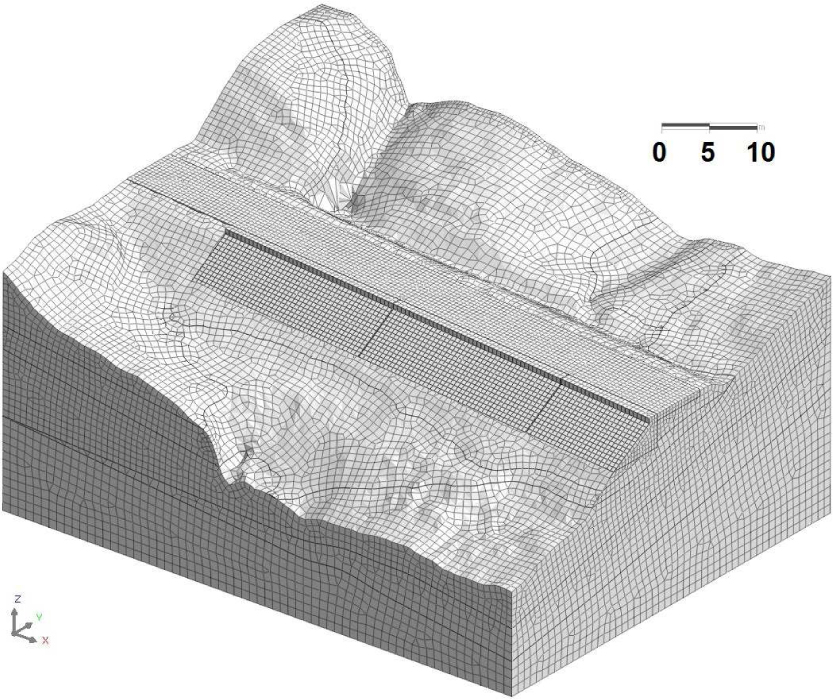
Spatial FEM mesh of the terrain with a retaining structure.
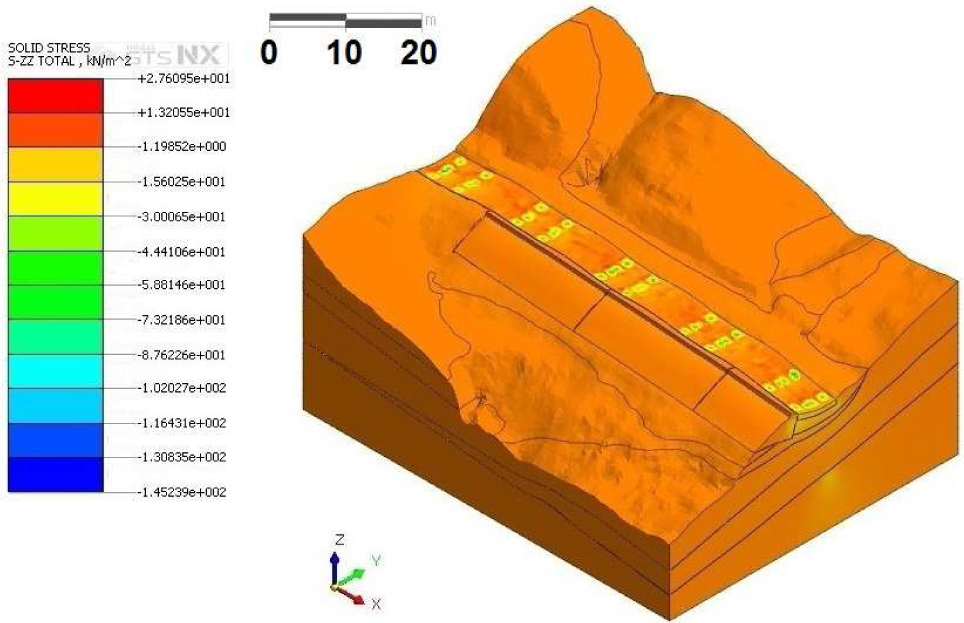
Vertical Szz stresses showing the series of truck loading.
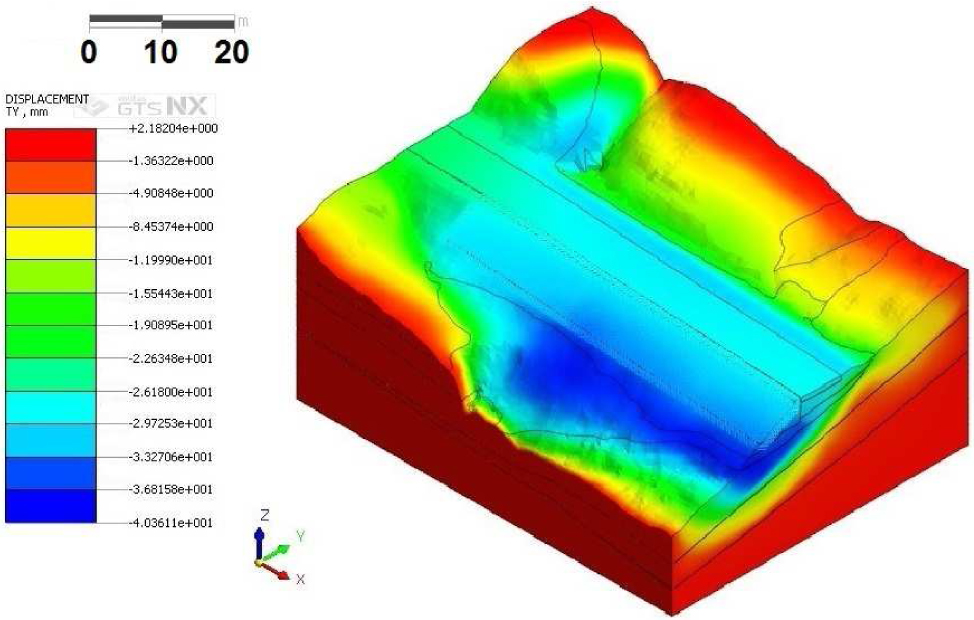
Horizontal displacements of 3–D numerical model.
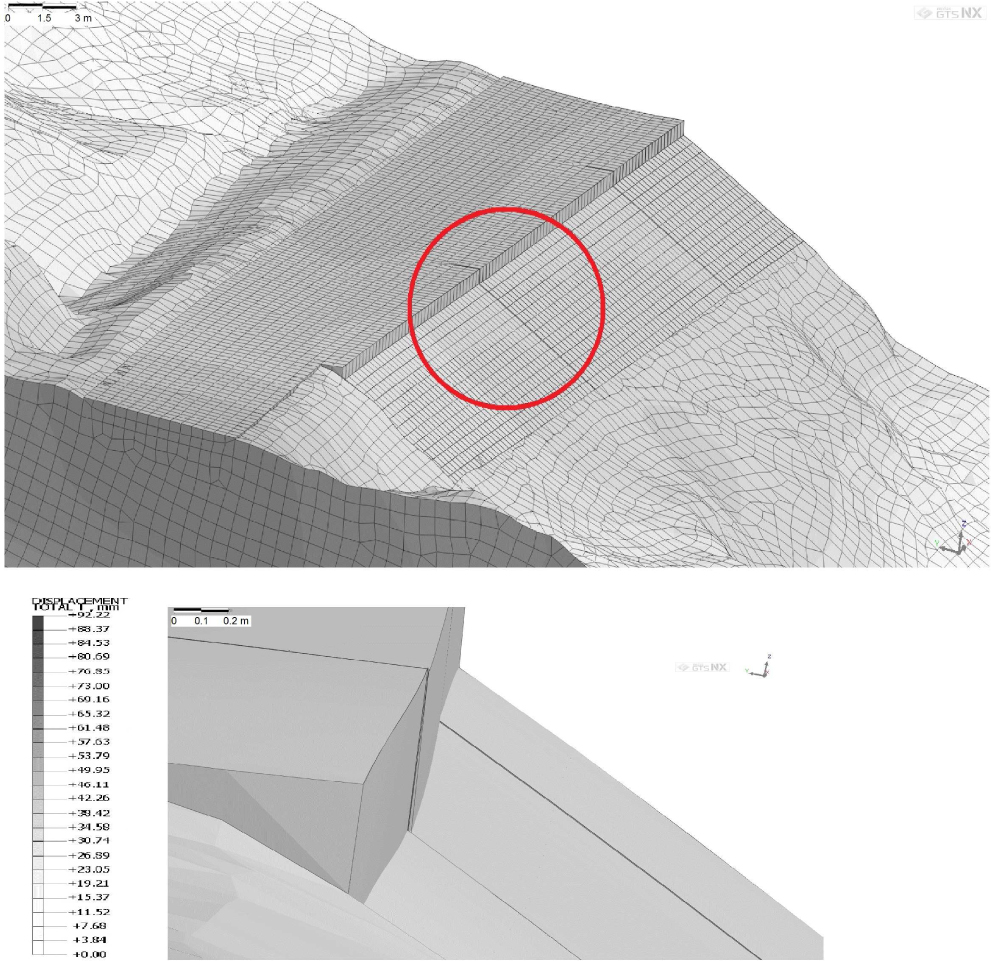
Displacement obtained for the 3–D numerical model assuming that two trucks stop in the section together with the detail showing the displacement of the failed section.
The failed section of anchored retaining structure.
6 Concluding remarks
Bearing in mind the results of the research into the behaviour of a retaining structure made in order to protect a road running through a landslide, the following should be noted. The retaining structure was made on a section directly passing through a landslide. The landslide is much larger and terminates at the bottom of the slope. It has several potential slip surfaces. Despite the stabilization of the road by the retaining structure, it is still working. Thus, the conclusion that it should be constantly observed, especially if the level of traffic in this section of road has significantly increased and the condition for the minimum stability factor is not met. The retaining structure has no support at the bottom edge. As a result, it is exposed to vertical movements. It is recommended, based on the results of monitoring, to establish a protection for the most deformed sections. These may be additional elements, such as piles (palisade) located at the foot of this structure. The piles should end below the slip surface. The analysis of the provided design and implementation documentation shows that the ground anchors, although pre-stressed, do not work correctly. The modelling of the behaviour of the road-substrate system demonstrated that the forces occurring in the first row of anchors were compression forces. Therefore, it is suggested that the anchors located in the first row should be slightly tensioned in the deformed section, so as not to damage the section and cause local tightening of the board to the ground. The loading applied into the system causes additional torsional moments that act on the retaining structure. As a result, in the section, uneven displacements arise. To avoid this, it is suggested to redistribute the loading in this section. It is recommended to join the deformed section (section three) together with the preceding section in a continuous manner that uses a flexible joint by affixing CFRP or ARFP tapes to the concrete using deformable adhesives and filling the dilatation with the deformable material (e.g., a polymer). Especially after long-lasting heavy rain or spring thaw, complex construction work in landslide area is expected. Thus, the described structure ought to be properly inspected and documented each time.
References
[1] Bober L., Thiel L., Zabuski L., Zjawiska osuwiskowe w polskich Karpatach fliszowych. IBW PAN, Gdańsk, 1997Search in Google Scholar
[2] Rączkowski W., Karta rejestracyjna osuwiska 12-11-052-001. The Polish Geological Institute – National Research Institute, 2009Search in Google Scholar
[3] Margielewski W., Structural control and types of movements of rock mass in anisotropic rocks: Case studies in the Polish Flysch Carpathians. Geomorphology, 2006, 77, 47–6810.1016/j.geomorph.2006.01.003Search in Google Scholar
[4] Alexandrowicz Z., Margielewski W., Impact of mass movements on geo– and biodiversity in the Polish Outer (Flysch) Carpathians. Geomorphology, 2010, 123, 290–30410.1016/j.geomorph.2010.07.020Search in Google Scholar
[5] Gaszyńska-Freiwald G., Wpływ laminacji na właściwości pęczniejące iłołupkόw fliszu karpackiego. Politechnika Krakowska, Krakόw, 2008Search in Google Scholar
[6] Polish Ministry of Transportation. The Regulation of the Polish Ministry of Transportation of March 2. The Polish Journal of Law, 43, 430, 1999Search in Google Scholar
[7] PKNMiJ, Warszawa. PN-B-03010:1983. Retaining walls. Static calculation and design, 1983Search in Google Scholar
[8] Fellenius W., Calculation of the stability of earth dams. In Transactions. 2nd Congress on Large Dams, 1936, 4, 445–463, Washington, DCSearch in Google Scholar
[9] Bishop A.W., The use of the slip cirlce in th stability analysis of slopes. Géotechnique, 1955, 5(1), 7–1710.1680/geot.1955.5.1.7Search in Google Scholar
[10] Morgenstern N., Price V., The analysis of the stability of general slip surfaces. Géotechnique, 1965, 15(1), 79–9310.1680/geot.1965.15.1.79Search in Google Scholar
[11] Sarma S., Seismic stability of earth dams and embankments. Géotechnique, 1975, 25(4), 743–76110.1680/geot.1975.25.4.743Search in Google Scholar
[12] Bathe K.J., Finite element procedures in engineering analysis. Prentice-Hall, Englewood Cliffs, New Jersey, 1982Search in Google Scholar
[13] Zienkiewicz O.C., Taylor R., The finite element method for solid and structural mechanics. Elsevier Butterworth–Heinemann, Amsterdam, Boston, 2005Search in Google Scholar
[14] Griffiths D., Lane P., Slope stability analysis by finite elements. Géotechnique, 1999, 49(3), 387–40310.1680/geot.1999.49.3.387Search in Google Scholar
[15] Midas GTS NX. Manual specifications, 2016Search in Google Scholar
[16] International Organization for Standardization. ISO 14688: Geotechnical investigation and testing. Identification and classification of soil. Principles for a classification, 2017Search in Google Scholar
[17] International Organization for Standardization. ISO/TS 17892-1: Geotechnical investigation and testing. Laboratory testing of soil. Part 1: Determination of water content, 2014Search in Google Scholar
[18] International Organization for Standardization. ISO/TS 17892-4: Geotechnical investigation and testing. Laboratory testing of soil. Part 4: Determination of particle size distribution, 2016Search in Google Scholar
[19] International Organization for Standardization. ISO/TS 17892-8: Geotechnical investigation and testing. Laboratory testing of soil. Part 8: Unconolidated undrained triaxial test, 2017Search in Google Scholar
[20] Deere D.U., Technical description of rock cores. Rock Mechanics Engineering Geology, 1964, 1, 16–22Search in Google Scholar
[21] Kogut J.P., Tekieli M., Application of the digital image correlation method in the study of cohesive coarse soil deformations. EPJ Web of Conferences, 2018, 36, 0300310.1051/e3sconf/20183603003Search in Google Scholar
[22] Kwiecień A., Shear bond of composites-to-brick applied with highly deformable, in relation to resin epoxy interface materials. Materials and Structures, 2014, 47, 2005–202010.1617/s11527-014-0363-ySearch in Google Scholar
[23] International Organization for Standardization. ISO/TS 17892-7: Geotechnical investigation and testing. Laboratory testing of soil. Part 7: Unconfine compression test, 2017Search in Google Scholar
[24] Grabowski D., Marciniec P., Mrozek T., Neścieruk P., Rączkowski W, Wόjcik, A., Zimnal, Z., Instrukcja opracowania mapy osuwisk i terenów zagrożonych ruchami masowymi. The Polish Geological Institute – National Research Institute, 2008Search in Google Scholar
© 2018 Janusz P. Kogut et al., published by De Gruyter
This work is licensed under the Creative Commons Attribution-NonCommercial-NoDerivatives 4.0 License.
Articles in the same Issue
- Regular Articles
- Spatio-temporal monitoring of vegetation phenology in the dry sub-humid region of Nigeria using time series of AVHRR NDVI and TAMSAT datasets
- Water Quality, Sediment Characteristics and Benthic Status of the Razim-Sinoie Lagoon System, Romania
- Provenance analysis of the Late Triassic Yichuan Basin: constraints from zircon U-Pb geochronology
- Historical Delineation of Landscape Units Using Physical Geographic Characteristics and Land Use/Cover Change
- ‘Hardcastle Hollows’ in loess landforms: Closed depressions in aeolian landscapes – in a geoheritage context
- Geostatistical screening of flood events in the groundwater levels of the diverted inner delta of the Danube River: implications for river bed clogging
- Utilizing Integrated Prediction Error Filter Analysis (INPEFA) to divide base-level cycle of fan-deltas: A case study of the Triassic Baikouquan Formation in Mabei Slope Area, Mahu Depression, Junggar Basin, China
- Architecture and reservoir quality of low-permeable Eocene lacustrine turbidite sandstone from the Dongying Depression, East China
- Flow units classification for geostatisitical three-dimensional modeling of a non-marine sandstone reservoir: A case study from the Paleocene Funing Formation of the Gaoji Oilfield, east China
- Umbrisols at Lower Altitudes, Case Study from Borská lowland (Slovakia)
- Modelling habitats in karst landscape by integrating remote sensing and topography data
- Mineral Constituents and Kaolinite Crystallinity of the <2 μm Fraction of Cretaceous-Paleogene/Neogene Kaolins from Eastern Dahomey and Niger Delta Basins, Nigeria
- Construction of a dynamic arrival time coverage map for emergency medical services
- Characterizing Seismo-stratigraphic and Structural Framework of Late Cretaceous-Recent succession of offshore Indus Pakistan
- Geosite Assessment Using Three Different Methods; a Comparative Study of the Krupaja and the Žagubica Springs – Hydrological Heritage of Serbia
- Use of discriminated nondimensionalization in the search of universal solutions for 2-D rectangular and cylindrical consolidation problems
- Trying to underline geotourist profile of National park visitors: Case study of NP Fruška Gora, Serbia (Typology of potential geotourists at NP Fruška Gora)
- Fluid-rock interaction and dissolution of feldspar in the Upper Triassic Xujiahe tight sandstone, western Sichuan Basin, China
- Calcified microorganisms bloom in Furongian of the North China Platform: Evidence from Microbialitic-Bioherm in Qijiayu Section, Hebei
- Spatial predictive modeling of prehistoric sites in the Bohemian-Moravian Highlands based on graph similarity analysis
- Geotourism starts with accessible information: the Internet as a promotional tool for the georesources of Lower Silesia
- Models for evaluating craters morphology, relation of indentation hardness and uniaxial compressive strength via a flat-end indenter
- Geotourism in an urban space?
- The first loess map and related topics: contributions by twenty significant women loess scholars
- Modeling of stringer deformation and displacement in Ara salt after the end of salt tectonics
- A multi-criteria decision analysis with special reference to loess and archaeological sites in Serbia (Could geosciences and archaeology cohabitate?)
- Speleotourism in Slovenia: balancing between mass tourism and geoheritage protection
- Attractiveness of protected areas for geotourism purposes from the perspective of visitors: the example of Babiogórski National Park (Poland)
- Implementation of Heat Maps in Geographical Information System – Exploratory Study on Traffic Accident Data
- Mapping War Geoheritage: Recognising Geomorphological Traces of War
- Numerical limitations of the attainment of the orientation of geological planes
- Assessment of runoff nitrogen load reduction measures for agricultural catchments
- Awheel Along Europe’s Rivers: Geoarchaeological Trails for Cycling Geotourists
- Simulation of Carbon Isotope Excursion Events at the Permian-Triassic Boundary Based on GEOCARB
- Morphometry of lunette dunes in the Tirari Desert, South Australia
- Multi-spectral and Topographic Fusion for Automated Road Extraction
- Ground-motion prediction equation and site effect characterization for the central area of the Main Syncline, Upper Silesia Coal Basin, Poland
- Dilatancy as a measure of fracturing development in the process of rock damage
- Error-bounded and Number-bounded Approximate Spatial Query for Interactive Visualization
- The Significance of Megalithic Monuments in the Process of Place Identity Creation and in Tourism Development
- Analysis of landslide effects along a road located in the Carpathian flysch
- Lithological mapping of East Tianshan area using integrated data fused by Chinese GF-1 PAN and ASTER multi-spectral data
- Evaluating the CBM reservoirs using NMR logging data
- The trends in the main thalweg path of selected reaches of the Middle Vistula River, and their relationships to the geological structure of river channel zone
- Lithostratigraphic Classification Method Combining Optimal Texture Window Size Selection and Test Sample Purification Using Landsat 8 OLI Data
- Effect of the hydrothermal activity in the Lower Yangtze region on marine shale gas enrichment: A case study of Lower Cambrian and Upper Ordovician-Lower Silurian shales in Jiangye-1 well
- Modified flash flood potential index in order to estimate areas with predisposition to water accumulation
- Quantifying the scales of spatial variation in gravel beds using terrestrial and airborne laser scanning data
- The evaluation of geosites in the territory of National park „Kopaonik“(Serbia)
- Combining multi-proxy palaeoecology with natural and manipulative experiments — XLII International Moor Excursion to Northern Poland
- Dynamic Reclamation Methods for Subsidence Land in the Mining Area with High Underground Water Level
- Loess documentary sites and their potential for geotourism in Lower Silesia (Poland)
- Equipment selection based on two different fuzzy multi criteria decision making methods: Fuzzy TOPSIS and fuzzy VIKOR
- Land deformation associated with exploitation of groundwater in Changzhou City measured by COSMO-SkyMed and Sentinel-1A SAR data
- Gas Desorption of Low-Maturity Lacustrine Shales, Trassic Yanchang Formation, Ordos Basin, China
- Feasibility of applying viscous remanent magnetization (VRM) orientation in the study of palaeowind direction by loess magnetic fabric
- Sensitivity evaluation of Krakowiec clay based on time-dependent behavior
- Effect of limestone and dolomite tailings’ particle size on potentially toxic elements adsorption
- Diagenesis and rock properties of sandstones from the Stormberg Group, Karoo Supergroup in the Eastern Cape Province of South Africa
- Using cluster analysis methods for multivariate mapping of traffic accidents
- Geographic Process Modeling Based on Geographic Ontology
- Soil Disintegration Characteristics of Collapsed Walls and Influencing Factors in Southern China
- Evaluation of aquifer hydraulic characteristics using geoelectrical sounding, pumping and laboratory tests: A case study of Lokoja and Patti Formations, Southern Bida Basin, Nigeria
- Petrography, modal composition and tectonic provenance of some selected sandstones from the Molteno, Elliot and Clarens Formations, Karoo Supergroup, in the Eastern Cape Province, South Africa
- Deformation and Subsidence prediction on Surface of Yuzhou mined-out areas along Middle Route Project of South-to-North Water Diversion, China
- Abnormal open-hole natural gamma ray (GR) log in Baikouquan Formation of Xiazijie Fan-delta, Mahu Depression, Junggar Basin, China
- GIS based approach to analyze soil liquefaction and amplification: A case study in Eskisehir, Turkey
- Analysis of the Factors that Influence Diagenesis in the Terminal Fan Reservoir of Fuyu Oil Layer in the Southern Songliao Basin, Northeast China
- Gravity Structure around Mt. Pandan, Madiun, East Java, Indonesia and Its Relationship to 2016 Seismic Activity
- Simulation of cement raw material deposits using plurigaussian technique
- Application of the nanoindentation technique for the characterization of varved clay
- Verification of compressibility and consolidation parameters of varved clays from Radzymin (Central Poland) based on direct observations of settlements of road embankment
- An enthusiasm for loess: Leonard Horner in Bonn and Liu Tungsheng in Beijing
- Limit Support Pressure of Tunnel Face in Multi-Layer Soils Below River Considering Water Pressure
- Spatial-temporal variability of the fluctuation of water level in Poyang Lake basin, China
- Modeling of IDF curves for stormwater design in Makkah Al Mukarramah region, The Kingdom of Saudi Arabia