Deformation and Subsidence prediction on Surface of Yuzhou mined-out areas along Middle Route Project of South-to-North Water Diversion, China
-
Ding Renwei


Abstract
The Middle Route of the South-to-North Water Diversion Project crosses the coal mined-out area in Yuzhou city. There are 4 mined-out areas along Yuzhou section of the water diversion project. The collapse, fracture and deformation of overlying rock mass occurred due to strata loss and stress field change, which then resulted in the subsidence, collapse fissures on the ground. The deformation of the upper rock mass is characterized by “three-zone”: caving zone, fault zone, and bend zone. Thus, it is very important to predict the surface subsidence of the mined-out areas. Highly precise deformation observation network were set along the channel. The monitoring data show that the surface tilt, curvature and horizontal deformation of the mined-out areas were less than critical values. However, the forecast and monitoring values are relatively larger in Guocun and Xinfeng mined-out areas due to large mining range and the possible location of two mined-out areas in the affected region. Therefore, the monitoring should focus on the two mined-out areas.
1 Introduction
Underground mining activities cause movement both in geological strata and on the ground surface. Deformation and Subsidence as a result of underground mining is a hazard to human life, properties and environment. Before 1889, there are reports about subsidence of ground surface caused by underground mining activities [1]. Can, et al. identified the effects of mining subsidence on masonry buildings in the mining area of Kozlu, Zonguldak, Turkey and detailed the results from a GPS Network conducted in the basin to determine the horizontal displacements on the surface created by the mining activities [2, 3]. Donnelly et al. reported that long wall mining methods resulted in subsidence that has caused severe damage to structures, residential property, and agricultural land, and also induced landslides in the Amaga, Angelopolis, Venecia and Bolombolo Regions, Antioquia, Colombia, and the “Subsidence with Influence Function Technique” program was used to predict the magnitude of subsidence [4]. Gayarre, et al. presented a forensic analysis of ground subsidence in Lo Tacón industrial area, which is located at the outskirts of La Unión (Murcia, SE Spain) [5]. The subsidence was triggered by the collapse of abandoned underground mining caverns occurred in 1998. Nádudvariused radar interferometer and SBAS technique were used to detect surface subsidence relating to coal mining in Upper Silesia from the periods of 1993-2000 and 2003-2010 [6].Howladar & Hasan evaluated the development of subsidence caused by the extraction of 1203 slice under the profile functions and influence functions methods [7]. Jung, et al. developed a quick, simple and quantitative method suitable for the estimation of subsidence susceptibility prior to the detailed field investigation of coal mines in Korea [8]. Hu, et al. got a few phases of measured data based on the long-term dynamic monitoring, and revealed the surface movement and deformation characteristics in the typical windy and sandy region in Bulianta coal mine of Shendong coal-field, located in Ordos, InnerMongolia [9]. Sun, et al. investigated the formation mechanism, relevant influential factors, and distribution laws of the collapse in the third mining area in Gongchangling District, Liaoyang City, China, and conducted evaluation and prediction of ground settlement induced by the goaf collapse [10]. Li, et al. used a similar material simulation method to examine the influencing mechanism(s) of abandoned goafs on the subsidence basin in the Nan Tun coal mine, Yanzhou, China [11].
The 1,277km long Middle Route of the South-to-North Water Diversion Project conveys water from Danjiangkou reservoir in the middle and upper reaches of Hanjiang River to Henan, Hebei, Beijing, and Tianjin through open canal. The route crosses the coal mining area in Yuzhou City, Henan Province, with 3.11km long goaf. Thus, the stability of goaf is one of the major technical problems in Yuzhou section of the Middle Route of the South-to-North Water Diversion Project [12, 13].
2 The description and geology of the research site
2.1 Mining and Geology
The Yuzhou main canal goes through 4 mined-out areas, namely, Xinfeng, Guocun, Gongmao and Fuli mined-out area, as shown in Figure 1 and Table 1. The mined-out areas are horizontally 3.11 km long. Most of the mined-out areas have one layer, a few areas have two layers, and each coal seam is about 1m thick. Most of mined-out areas were formed by small-scale coal mining after 1990s, and the mining has stopped since 2002. The mined-out areas are generally 100-269m deep, and a mobile basin occurs on the ground which is over 1700 m long in the WE direction and about 40m wide in the SN direction.
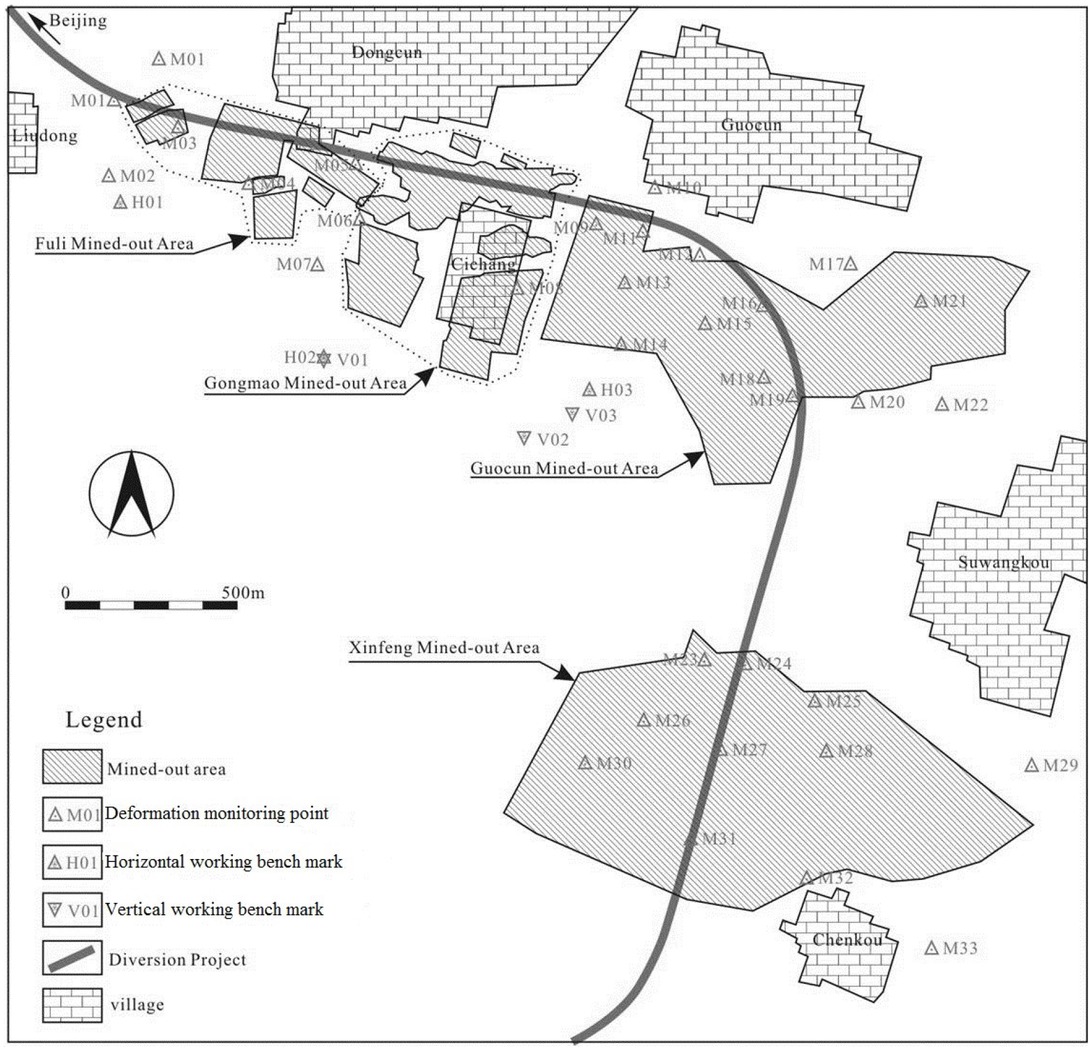
Schematic layout of mined-out areas along Yuzhou section of the Diversion Project.
Characteristics of mined-out areas along Yuzhou section of Middle Route Project.
| Name | Area (m2) | Occupation area of canal (m2) | Length (m) | Thickness(m) | Depth (m) | Close-down date |
|---|---|---|---|---|---|---|
| Xinfeng | 1387260 | 83314 | 724.98 | 0.9 | 107-266 | 1965 |
| Guocun | 525045 | 74772 | 703.46 | 0.75-1.13 | 126-290 | 1996 |
| Gongmao | 194086 | 71603 | 748.47 | 0.69-1.04 | 106-242 | 2005 |
| Fuli | 16389 | 16057 | 933.09 | 1-1.2 | 90-134 | 2003 |
The study area is located in the southwest of North China Craton [14]. The terrain is generally flat, with above sea level of 123-145m in the transition zone between the alluvial apron and the plain. The coal measure strata are the Permian Shanxi formation and Shihezi formation with attitude of 195∘ < 14∘.
The coal measure strata are monoclinic. The main faults in the area were formed before Quaternary, and Quaternary faults are not well developed. The largest fault is the Hutoushan Fault, which controls coalfield distribution. The fault is a normal fault with attitude of about 30∘ < 70∘, but the fault plane is undulated. The faults are covered by loess, with fault throw of 117-427m.
The groundwater is 4-8m deep, and its flow direction is in compliance with slope of the terrain. Permian mudstone, shale, and Quaternary clay are good aquifuges, and there is no hydraulic connection between phreatic water and mines.
2.2 Characteristic and mechanism of Surface Deformation
After underground mining, the collapse, fracture and deformation of overlying rock mass happened due to the geological environment disruptions such as strata loss and stress field change, which then resulted in the subsidence, collapse fissures on the ground surface. There are both large and small coal mines in Yuzhou mining area. In the small mines, the fifth and sixth coal measures of upper Shihezi Formation formed in Permian were mined. The mining sequence and spaces did not match the specification requirements. Therefore, the movement and deformation on surface varied greatly, and there were many ground fissures in the mined-out area, as listed in Table 2. Most ground fissures are less than 5m deep, a few centimeters to more than ten centimeters wide, and less than 200m long, with strike of WE.
Ground fissures in the mined-out area.
| Location | Number | Length (m) | Maximum width (m) | Visible depth (m) | Strike | Occurrence time |
|---|---|---|---|---|---|---|
| North Chenkou | 3 | ≤ 30 | 0.3 | ≤ 1 | WE | 1960s |
| South Guocun | > 10 | > 10 | 0.4 | ≤ 2 | WE | 1990s |
| Cichang | > 5 | 4.5-20 | 0.5-2.0 | 1.5-2.0 | WE | 1990s |
| Liudong- Dongcun | Unknown | ≤ 80 | 0.3 | ≤ 1 | Unknown | After rain in August, 2000 |
As we know, before mining, the rock mass was stable, and there were no any deformation or failure in the area. After mining, especially disordered mining or mining without support, initial in-situ stress field was destroyed, which caused some deformations and failures such as bending, breaking and caving. If the mining coal seam was shallow, or the deformation and failure of the wall rock was serious, they would influence ground surface, and caused subsidence, crack, tilt and horizontal displacement. With the enlargement of mined-out area, the deformation and failure of ground surface would develop into a subsidence trough.
Occurrence, development and results of deformation and failure in mined-out area were controlled by mechanical properties and structure of upper strata. At the same time, position and occurrence of coal bed, depth, thickness and method of mining also influenced the deformation and failure.
Upper strata are soft rock with hard rock, and their strikes are generally along EW direction, with south dip and dip angle of 12-19∘. The deformation of upper rock mass was a funnel-shaped subsidence from mining position to ground, and the deformed rock mass can be divided three zones: caving zone, fault zone, and bend zone, as shown in Figure 2.

Model of deformation and failure in the mined-out area. 1-caving zone; 2-fault zone; 3-bend zone; 4- subsidence trough; 5-ground fissure.
Most ground fissures are found on the outer margin of the subsidence trough, and they were parallel to boundary of the mined-out area. The scale (including width, depth and length) of the ground fissures are closely related to the type, thickness, component, physical and mechanical properties of topsoil. Generally, when the surface tensile deformation value exceeds 6 to 10mm/m in large plastic clayey soil, the ground fissures would occur around the subsidence trough. In addition, the fractures will happen when the tension deformation on the ground surface is 2-3mm in sandy clay, clay sand or rock. The range of subsidence trough and ground fissures is larger than underground mined-out area.
The area of ground subsidence increases with depth of mining, and the depth of subsidence decreases with depth of mining.
3 Methodologies for subsidence prediction
3.1 Method of subsidence prediction
The probability integral method used to predict the subsidence is based on the random medium theory. The rock mass is considered to consist of a large number of loose granular media. During the movement of rock mass, its continuity was destroyed, and the original connection between the media units changes. The units separate and move relative to each other. The influence of the whole mining on rock strata and surface is equal to the sum of the influence of each unit mining on strata and surface. According to the random medium theory, the surface subsidence basin caused by unit mining is the normal distribution, and is consistent with the probability density distribution. The probability integration method considers the overburden subsidence due to the unit mining as a random event to describe the possibility of settlement and settlement of rock mass [15, 16]. The probability integral method has become one of the most mature and widely used methods in China, and it is used in this study [17, 18, 19].
Figure 3 shows the comparison between the ideal sinking curve and actual sinking curve. The W′(x) represents the ideal limit settlement curve, and the W (x) denotes the actual subsidence curve.
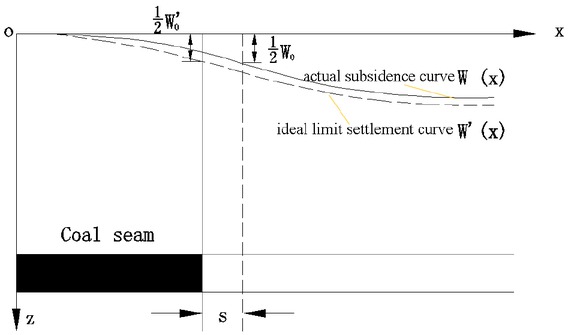
Comparison between ideal and actual subsidence curves.
The ideal limit subsidence curve is expressed as
where W′(x) is the ideal limit subsidence curve, q′ is the limiting subsidence coefficient, obviously q < q′ ≤ 1, m is the goaf thickness, α is the dip angle of coal seam, W′0 = q′m cos α is the maximum settlement, r is the influence radius, r=H/tanβ, β is the influence angle of coal seam,x is the length of goaf, and erf is the probability integral function.
The actual surface subsidence curve is
where W(x) is the actual subsidence curve, q is the current surface subsidence coefficient, and s is the offset of inflection point.
In the limit condition, the distribution curve of goaf surface subsidence is W′(x), and q′ in Formula (1) has the limit value of 1. The ultimate residual subsidence curve W0(x) is
The maximum residual settlement is the maximum of We(x), which can be solved by Formula (3). Figure 2 shows that the most value point of W(x) is at the right side of the S. Assuming that the maximum point of W′(x) is at the point x0, and the point of the maximum value of W(x) is x0+S. According to Formula (3), the maximum value of W(x) is between x0 and x0+S. The results of surface subsidence distribution function are listed in Table 3, which shows that, from the point x0 to the point x0+S, the W′(x) value decreases while the value of W(x) increases. Therefore, We(x) reaches the maximum value at the point x0, which is shown by
Results of Surface subsidence distribution function.
| x/r | 0 | ±0.1 | ±0.2 | ±0.3 | ±0.4 | ±0.5 | ±0.6 | ±0.7 |
| W(x)/W0 | 0.500 | 0.599 | 0.692 | 0.744 | 0.842 | 0.895 | 0.934 | 0.961 |
| 0.500 | 0.401 | 0.308 | 0.226 | 0.158 | 0.105 | 0.067 | 0.039 | |
| x/r | ±0.8 | ±0.9 | ±1.0 | ±1.1 | ±1.2 | ±1.3 | ±1.4 | ±1.5 |
| W(x)/W0 | 0.978 | 0.988 | 0.994 | 0.997 | 0.998 | 0.999 | 0.999 | 0.999 |
| 0.023 | 0.012 | 0.006 | 0.003 | 0.002 | 0.001 | 0.001 | 0.001 |
where η is the reduction factor which can be determined in Table 3 by letting x/r=1-S/r.
The first order reciprocal and two reciprocal of the curve W(x) are the tilt curve i x and the curvature curve K x, respectively. Ux is the horizontal displacement curve, and εx is the horizontal displacement curve. According to the literature [20], the maximum values are
where b is the horizontal movement coefficient,
where W0 is the maximum residual settlement of actual settlement curve.
The substitute of maximum residual settlement value into equations (5) - (8) will result in the corresponding residual deformation.
3.2 Deformation monitoring
In order to correctly evaluate the stability of the mined-out areas and their influence on the section of the Diversion Project and other buildings, a high precision deformation observation network (including surface leveling and horizontal deformation observation) was installed along the channel (Figure 1).
The observation network covers 4 mined-out areas, namely, Xinfeng, Guocun, Gongmao and Fuli mined-out areas.
Deformation observation sections are set up every 100 to 200m along the center line of the channel. Each observation section has three deformation monitoring points, one in the center of the canal and two at two sides 50-150m from the canal center. Therefore, there are 33 deformation monitoring points in total. In addition, there are 3 vertical working bench marks and 3 horizontal working bench marks (Figure 1).
The datum network should be rechecked every six months, and the points should be observed every a month. If there were special factors, time interval could vary.
3.3 Prediction parameters
The prediction parameters generally include the coal seam thickness, subsidence coefficient, horizontal movement coefficient, tangent of major influence angle, uphill inflection point offset, downhill inflection point offset and influence propagation angle coefficient. According to the code for building, water body, railway and main well roadway pillar retention and pressure coal mining [19] and measured data, the parameters are listed in Table 4.
Parameters for mined-out area subsidence prediction by probability integral method.
| Names | Definition | Values |
|---|---|---|
| Subsidence coefficient | When fully mining, the ratio of the maximum subsidence value of the ground surface to the projection length of the normal thickness of the coal seam in the vertical direction | 0.03 |
| Horizontal movement coefficient | When fully mining, the ratio of the maximum horizontal movement of the surface to the maximum subsidence value on the main section | 0.35 |
| Tangent of major influence angle | The ratio of mining depth to the main influence radius | 1.8 |
| Displacement distance of inflection point | the distance between the inflection point of the sinking curve and the coal wall | 0(m) |
| Coal seam thickness | - | 2(m) |
Prediction results of maximum subsidence in different horizontal plane (mm).
| horizontal plane | Guocun | Xinfeng | Gongmao | Fuli |
|---|---|---|---|---|
| Ground surface | 60 | 60 | 54 | 42 |
| Underground 50m | 110 | 110 | 100 | 80 |
| Underground 100m | 200 | 225 | 175 | 150 |
| Underground 150m | 320 | 320 | 280 | 200 |
The subsidence coefficient is calculated with the following formula (9). Because the prediction is the residual displacement deformation of the mined-out areas, and the mined-out areas were grouted to reduce subsidence, the subsidence coefficient is relatively small.
where, q1 is the surface residual subsidence coefficient after grouting, q is the surface subsidence coefficient (q = 0.88 here according to Code for coal mining under buildings, water-bodies and railways [19]), and q2 is the effect of grouting.
3.4 Prediction results
The ground tilt prediction results along strike are shown in Figure 4(a), with maximum negative tilt of -0.8 mm/m at the northwest corner of Guocun mined-out area and maximum positive tilt of 0.6 mm/m at the southwest and north of Guocun mined-out area and the North and southwest of the Xinfeng mined-out area, which is under the channel.

Tilt distribution.

Surface curvature distribution.
The ground tilt prediction results along dip direction are shown in Figure 4(b), with maximum negative tilt of −0.9 mm/m at the northwest corner of Guocun mined-out area and maximum positive tilt of 0.6 mm/m at southwest and north of Guocun mined-out area, which is just under the channel.
The predicted results of surface curvature are shown in Figure 5, with maximum negative curvature of −0.08 mm/m2 and maximum positive curvature of +0.08mm/m2 at the northwest corner of Guocun mined-out area, which is just under the channel.
The predicted results of horizontal surface deformation are shown in Figure 6, with maximum negative horizontal deformation of −0.9 mm/m and maximum positive horizontal deformation of 0.9 mm/m at the northwest corner of Guocun mined-out area, which is just under the channel.

Distribution of horizontal deformation.
According to the code for building, water body, railway and main well roadway pillar retention and pressure coal mining [19], the allowable deformation of ground surface is: tilt i = ±3mm/m, curvature K=+0.2×10⁻³/m, horizontal deformation ε = +2mm/m. Therefore, the channel will not be destroyed in terms of the ground deformation.
The prediction results of subsidence for the surface, −50m, −100m and −150m are shown in Figure 7. It can be found from Table 4 that the subsidence increases with depth. The position with maximum subsidence of Guocun and Xinfeng mined-out areas are under the channel. However, the distance from the position with maximum subsidence of Fuli mined-out area to the channel is far.
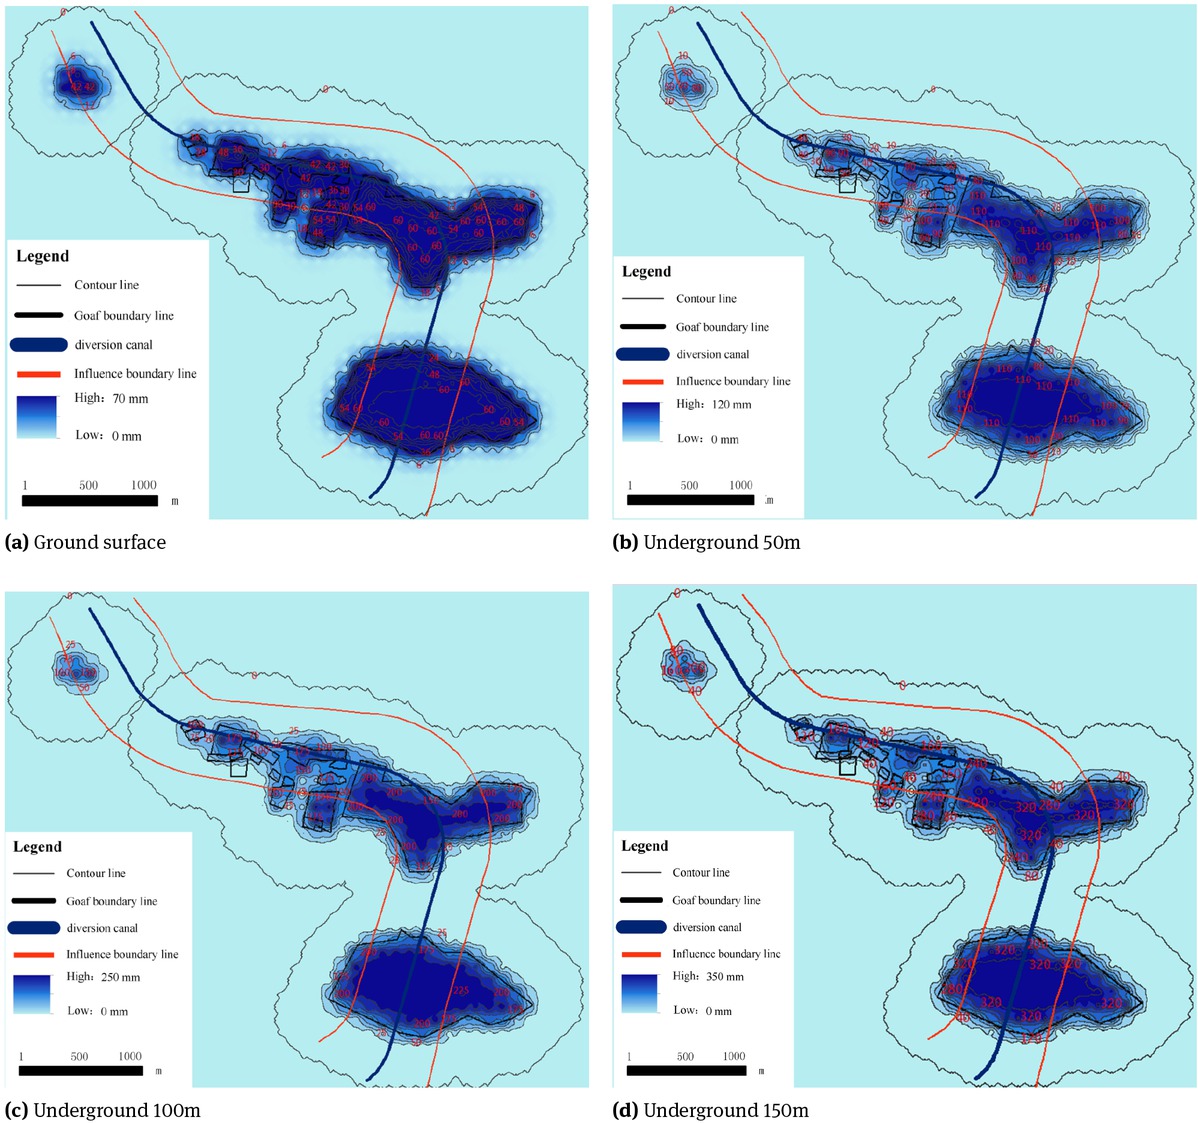
Contour of subsidence.
4 Conclusion and discussions
There were four mined-out areas along Yuzhou section of Middle Route Project of South-to-North water diversion. The collapse, fracture and deformation of overlying rock mass occurred due to strata loss and stress field change, which then resulted in the subsidence, collapse fissures on the ground.
The geological structure follows the typical “three-zone” overlying rock failure, and then the surface deformation and the underground failure are also the same as that of the “three-zone” overlying rock failure. Therefore, the deformation of the upper rock mass was a funnel-shaped subsidence from mining position to ground can be divided three zones: caving zone, fault zone, and bend zone.
According to the monitoring data, the surface tilt, curvature and horizontal deformation of the mined-out areas were less than critical values specified by the Code for coal mining under buildings water-bodies and railways. Therefore, the channel will not be destroyed in terms of the ground deformation.
The prediction of the internal subsidence of overlying rock shows that the subsidence increases with depth. The forecast and monitoring values are relatively larger in Guocun and Xinfeng mined-out areas, because the two mined-out areas are large and sufficient mining degree is high. Furthermore, their continuous deformation will affect the safety of the channel. Therefore, the two mined-out areas should be the focus of monitoring. Based on the prediction results, the classification pre-warning system model can be built for the channel.
Acknowledgement
This study was supported by the PhD student innovation fund of North China University of Water Resources and Electric Power and the National Natural Science Foundation of China (U1704243 & 41741019).
References
[1] Dron R. W., Effect of Coal Workings on the Surface. Jour. Brit. Soc. Min. Stud., 1889, 11, 122Suche in Google Scholar
[2] Can E., Kuşcu Ş., Kartal M. E., Effects of mining subsidence on masonry buildings in Zonguldak hard coal region in Turkey. Environmental Earth Sciences, 2012, 66(8), 2503-251810.1007/s12665-011-1473-2Suche in Google Scholar
[3] Can E, Kuşcu Ş., Mekik C. Determination of underground mining induced displacements using GPS observations in Zonguldak-Kozlu Hard Coal Basin. International Journal of Coal Geology, 2012, 89(1), 62-69.10.1016/j.coal.2011.08.006Suche in Google Scholar
[4] Donnelly L. J., Cruz H. D. L., Asmar I., Zapata O., Perez J.D., The monitoring and prediction of mining subsidence in the Amaga, Angelopolis, Venecia and Bolombolo Regions, Antioquia, Colombia. Engineering Geology, 2001, 59(1–2), 103-11410.1016/S0013-7952(00)00068-5Suche in Google Scholar
[5] Gayarre F. L., Álvarez-Fernández M. I., González-Nicieza C., Álvarez-Vigil A.E., García G.H., Forensic analysis of buildings affected by mining subsidence. Engineering Failure Analysis, 2010, 17(1), 270-28510.1016/j.engfailanal.2009.06.008Suche in Google Scholar
[6] Nádudvari Á., Using radar interferometry and SBAS technique to detect surface subsidence relating to coal mining in Upper Silesia from 1993-2000 and 2003-2010. Environmental & Socioeconomic Studies, 2016, 4(1), 24-3410.1515/environ-2016-0003Suche in Google Scholar
[7] Howladar M. F., Hasan K., A study on the development of subsidence due to the extraction of 1203 slice with its associated factors around Barapukuria underground coal mining industrial area, Dinajpur, Bangladesh. Environmental Earth Sciences, 2014, 72(9), 3699-371310.1007/s12665-014-3419-ySuche in Google Scholar
[8] Jung Y. B., Song W. K., Cheon D. S., Lee D. K., Park J. Y., Simple method for the identification of subsidence susceptibility above underground coal mines in Korea. Engineering Geology, 2014. 178, 121–13110.1016/j.enggeo.2014.06.006Suche in Google Scholar
[9] Hu Z., Chen C., XiaoW.,Wang X., Gao M., Surface movement and deformation characteristics due to high-intensive coal mining in the windy and sandy region. Int. J. Coal Sci. Technol, 2016, 3(3), 339-34810.1007/s40789-016-0144-zSuche in Google Scholar
[10] Sun Y., Zhang X.,MaoW., Xu L., Mechanism and stability evaluation of goaf ground subsidence in the third mining area in Gong Changling District, China. Arabian Journal of Geosciences, 2015, 8(2), 639-64610.1007/s12517-014-1270-9Suche in Google Scholar
[11] Li H., Zhao B., Guo G., Zha J., Bi J., The influence of an abandoned goaf on surface subsidence in an adjacent working coal face: a prediction method. Bulletin of Engineering Geology & the Environment, 2016, 1-1110.1007/s10064-016-0944-9Suche in Google Scholar
[12] Liu H., Zhu H., Huang Y., Stability research Guocungoaf at Middle Route Project on area of South-to-North water diversion. Rock and Soil Mechanics, 2015, 36(S2), 519-524 (in Chinese with English summary)Suche in Google Scholar
[13] Wu D., Ni H., Overview on design and key technological problems of Middle Route Project of South - to - North Water Diversion. Yangtze River, 2014, 6, 1-3 (in Chinese with English summary)Suche in Google Scholar
[14] Lin D., Pei F., Li X., Zuo A., Regional Geological Survey of Henan Province. Regional Geology of China, 1998, 17(4), 337-346 (in Chinese with English summary)Suche in Google Scholar
[15] He G., Yang L., Ling G., Mining subsidence. China University of Mining and Technology Press, Xuzhou, 1991 (in Chinese)Suche in Google Scholar
[16] Han X., Meng X., Zhang X., Zhang Y., The Deformation Stability Analysis of the Tunnels in Mined-out Areas Based on Creator and FLAC3. Journal of Water Resources and Architectural Engineering, 2014, 12(5), 93-97 (in Chinese with English summary)Suche in Google Scholar
[17] Liu B., Dai H., Research Development and Origin of Probability Integral Method. Coal Mining Technology, 2016, 21(2), 1-3 (in Chinese with English summary)Suche in Google Scholar
[18] Wang S., Prediction method of rock layer and surface movement. China Coal Industry Publishing House, Beijing, 1989 (in Chinese)Suche in Google Scholar
[19] China State Coal Industry Administration, code for building, water body, railway and main well roadway pillar retention and pressure coal mining. Coal Industry Press, Beijing, 2017 (in Chinese)Suche in Google Scholar
[20] Xie H., Zhou H., Wang J., Li L., Kwasniewski M.A., Application of flac to predict ground surface displacements due to coal extraction and its comparative analysis. Chinese Journal of Rock Mechanics and Engineering, 1999, 18(4), 397-401 (in Chinese with English summary)Suche in Google Scholar
© 2018 D. Renwei et al., published by De Gruyter
This work is licensed under the Creative Commons Attribution-NonCommercial-NoDerivatives 4.0 License.
Artikel in diesem Heft
- Regular Articles
- Spatio-temporal monitoring of vegetation phenology in the dry sub-humid region of Nigeria using time series of AVHRR NDVI and TAMSAT datasets
- Water Quality, Sediment Characteristics and Benthic Status of the Razim-Sinoie Lagoon System, Romania
- Provenance analysis of the Late Triassic Yichuan Basin: constraints from zircon U-Pb geochronology
- Historical Delineation of Landscape Units Using Physical Geographic Characteristics and Land Use/Cover Change
- ‘Hardcastle Hollows’ in loess landforms: Closed depressions in aeolian landscapes – in a geoheritage context
- Geostatistical screening of flood events in the groundwater levels of the diverted inner delta of the Danube River: implications for river bed clogging
- Utilizing Integrated Prediction Error Filter Analysis (INPEFA) to divide base-level cycle of fan-deltas: A case study of the Triassic Baikouquan Formation in Mabei Slope Area, Mahu Depression, Junggar Basin, China
- Architecture and reservoir quality of low-permeable Eocene lacustrine turbidite sandstone from the Dongying Depression, East China
- Flow units classification for geostatisitical three-dimensional modeling of a non-marine sandstone reservoir: A case study from the Paleocene Funing Formation of the Gaoji Oilfield, east China
- Umbrisols at Lower Altitudes, Case Study from Borská lowland (Slovakia)
- Modelling habitats in karst landscape by integrating remote sensing and topography data
- Mineral Constituents and Kaolinite Crystallinity of the <2 μm Fraction of Cretaceous-Paleogene/Neogene Kaolins from Eastern Dahomey and Niger Delta Basins, Nigeria
- Construction of a dynamic arrival time coverage map for emergency medical services
- Characterizing Seismo-stratigraphic and Structural Framework of Late Cretaceous-Recent succession of offshore Indus Pakistan
- Geosite Assessment Using Three Different Methods; a Comparative Study of the Krupaja and the Žagubica Springs – Hydrological Heritage of Serbia
- Use of discriminated nondimensionalization in the search of universal solutions for 2-D rectangular and cylindrical consolidation problems
- Trying to underline geotourist profile of National park visitors: Case study of NP Fruška Gora, Serbia (Typology of potential geotourists at NP Fruška Gora)
- Fluid-rock interaction and dissolution of feldspar in the Upper Triassic Xujiahe tight sandstone, western Sichuan Basin, China
- Calcified microorganisms bloom in Furongian of the North China Platform: Evidence from Microbialitic-Bioherm in Qijiayu Section, Hebei
- Spatial predictive modeling of prehistoric sites in the Bohemian-Moravian Highlands based on graph similarity analysis
- Geotourism starts with accessible information: the Internet as a promotional tool for the georesources of Lower Silesia
- Models for evaluating craters morphology, relation of indentation hardness and uniaxial compressive strength via a flat-end indenter
- Geotourism in an urban space?
- The first loess map and related topics: contributions by twenty significant women loess scholars
- Modeling of stringer deformation and displacement in Ara salt after the end of salt tectonics
- A multi-criteria decision analysis with special reference to loess and archaeological sites in Serbia (Could geosciences and archaeology cohabitate?)
- Speleotourism in Slovenia: balancing between mass tourism and geoheritage protection
- Attractiveness of protected areas for geotourism purposes from the perspective of visitors: the example of Babiogórski National Park (Poland)
- Implementation of Heat Maps in Geographical Information System – Exploratory Study on Traffic Accident Data
- Mapping War Geoheritage: Recognising Geomorphological Traces of War
- Numerical limitations of the attainment of the orientation of geological planes
- Assessment of runoff nitrogen load reduction measures for agricultural catchments
- Awheel Along Europe’s Rivers: Geoarchaeological Trails for Cycling Geotourists
- Simulation of Carbon Isotope Excursion Events at the Permian-Triassic Boundary Based on GEOCARB
- Morphometry of lunette dunes in the Tirari Desert, South Australia
- Multi-spectral and Topographic Fusion for Automated Road Extraction
- Ground-motion prediction equation and site effect characterization for the central area of the Main Syncline, Upper Silesia Coal Basin, Poland
- Dilatancy as a measure of fracturing development in the process of rock damage
- Error-bounded and Number-bounded Approximate Spatial Query for Interactive Visualization
- The Significance of Megalithic Monuments in the Process of Place Identity Creation and in Tourism Development
- Analysis of landslide effects along a road located in the Carpathian flysch
- Lithological mapping of East Tianshan area using integrated data fused by Chinese GF-1 PAN and ASTER multi-spectral data
- Evaluating the CBM reservoirs using NMR logging data
- The trends in the main thalweg path of selected reaches of the Middle Vistula River, and their relationships to the geological structure of river channel zone
- Lithostratigraphic Classification Method Combining Optimal Texture Window Size Selection and Test Sample Purification Using Landsat 8 OLI Data
- Effect of the hydrothermal activity in the Lower Yangtze region on marine shale gas enrichment: A case study of Lower Cambrian and Upper Ordovician-Lower Silurian shales in Jiangye-1 well
- Modified flash flood potential index in order to estimate areas with predisposition to water accumulation
- Quantifying the scales of spatial variation in gravel beds using terrestrial and airborne laser scanning data
- The evaluation of geosites in the territory of National park „Kopaonik“(Serbia)
- Combining multi-proxy palaeoecology with natural and manipulative experiments — XLII International Moor Excursion to Northern Poland
- Dynamic Reclamation Methods for Subsidence Land in the Mining Area with High Underground Water Level
- Loess documentary sites and their potential for geotourism in Lower Silesia (Poland)
- Equipment selection based on two different fuzzy multi criteria decision making methods: Fuzzy TOPSIS and fuzzy VIKOR
- Land deformation associated with exploitation of groundwater in Changzhou City measured by COSMO-SkyMed and Sentinel-1A SAR data
- Gas Desorption of Low-Maturity Lacustrine Shales, Trassic Yanchang Formation, Ordos Basin, China
- Feasibility of applying viscous remanent magnetization (VRM) orientation in the study of palaeowind direction by loess magnetic fabric
- Sensitivity evaluation of Krakowiec clay based on time-dependent behavior
- Effect of limestone and dolomite tailings’ particle size on potentially toxic elements adsorption
- Diagenesis and rock properties of sandstones from the Stormberg Group, Karoo Supergroup in the Eastern Cape Province of South Africa
- Using cluster analysis methods for multivariate mapping of traffic accidents
- Geographic Process Modeling Based on Geographic Ontology
- Soil Disintegration Characteristics of Collapsed Walls and Influencing Factors in Southern China
- Evaluation of aquifer hydraulic characteristics using geoelectrical sounding, pumping and laboratory tests: A case study of Lokoja and Patti Formations, Southern Bida Basin, Nigeria
- Petrography, modal composition and tectonic provenance of some selected sandstones from the Molteno, Elliot and Clarens Formations, Karoo Supergroup, in the Eastern Cape Province, South Africa
- Deformation and Subsidence prediction on Surface of Yuzhou mined-out areas along Middle Route Project of South-to-North Water Diversion, China
- Abnormal open-hole natural gamma ray (GR) log in Baikouquan Formation of Xiazijie Fan-delta, Mahu Depression, Junggar Basin, China
- GIS based approach to analyze soil liquefaction and amplification: A case study in Eskisehir, Turkey
- Analysis of the Factors that Influence Diagenesis in the Terminal Fan Reservoir of Fuyu Oil Layer in the Southern Songliao Basin, Northeast China
- Gravity Structure around Mt. Pandan, Madiun, East Java, Indonesia and Its Relationship to 2016 Seismic Activity
- Simulation of cement raw material deposits using plurigaussian technique
- Application of the nanoindentation technique for the characterization of varved clay
- Verification of compressibility and consolidation parameters of varved clays from Radzymin (Central Poland) based on direct observations of settlements of road embankment
- An enthusiasm for loess: Leonard Horner in Bonn and Liu Tungsheng in Beijing
- Limit Support Pressure of Tunnel Face in Multi-Layer Soils Below River Considering Water Pressure
- Spatial-temporal variability of the fluctuation of water level in Poyang Lake basin, China
- Modeling of IDF curves for stormwater design in Makkah Al Mukarramah region, The Kingdom of Saudi Arabia