Application of the nanoindentation technique for the characterization of varved clay
-
Matylda Tankiewicz


Abstract
Nanoindentation is a test carried out in a small scale, during which a rigid indenter (of known hardness and geometry) is pressed into the tested material. The results of the test are the load and unload curves, from which the harerial characterized by high heterogeneity (like soil – composed of grains and particles of different size and mineral composition), the use of multiple nanoindentation on a predefined grid (Grid Indentation Technique) is reasonable. It allows for the determination of the morphology of the material in a selected scale of observation. In the study, nanoindetation tests were performed on samples of varved clay - soil composed of two alternately arranged layers - occurring near the city of Bełchatów in central Poland. Due to the layered structure of the material, the tests were carried out for both layers separately. The outcomes show that there are significant differences in the values of their mechanical properties. Application of the deconvolution technique also allowed for the estimation of the number of components of both layers and their mechanical properties.
1 Introduction
Varved clay is a clayey sedimentary soil with a visible layering, which is formed in glacial lakes as a result of periodical melting of a glacier. It is composed of two alternately repeated layers: dark (silty-clayey) and bright (sandy-silty). Changes in sedimentation conditions results in the variability of the layers in terms of composition and thickness [1]. A consequence of the formation process is a multi-scale structure of the soil. Examinations of the properties of varved clays from different parts of the world are presented in [2, 3, 4, 5]. The property that effects the layered structure of the clay is the anisotropy of the mechanical behavior of the material. Not taking this into account in geotechnical engineering may lead to some errors. Works related to constructions made in varved clays are [6, 7, 8]. However, in view of the complex nature of varved clay, testing and modelling its mechanical behavior is not a trivial issue. A comprehensive study on the assessment of the strength of varved clay, as well as its modelling were previously introduced by the author in [9]. The paper presents a macroscopic approach in which the material is considered as an anisotropic unity. Another approach is a micromechanical one in which the parameters of the microstructure are determined, which allows a prediction of the macroscopic properties of the material. However, in this case a proper description of the microstructure of the material can be seen to be the most significant.
Nanoindentation is a hardness test performed in a small scale. This technique allows for the determination of the mechanical properties of materials, such as hardness, indentation modulus and elastic modulus [10]. The application of nanoindentation to geomaterials was presented e.g in [11, 12, 13]. In the paper, this procedure is used for characterization of varved clay in the nano-scale. The article focuses on varved clay occurring near the city of Bełchatów in central Poland. First, grid nanoindentation measurements were performed for both layers separately. Next, the deconvolution technique was used for separation of the material phases with respect to their mechanical properties. The technique allowed for the determination of a number of components of both layers and their mechanical properties. The work is a contribution in attempting to understand the mechanical behavior of the soil.
2 Nanoindentation technique
In the nanoindentation test a rigid indenter (of known hardness and geometry) is pressed into the tested material with a given force,which results in increase in depth of indentation. After the test, an imprint with a size depending on the hardness of the material remains in the sample. During the indentation, values of load P and depth h are recorded and the main outcome of the test are the P-h curves – see Figure 1. Analysis of the results allows for the determination of the micromechanical properties of the tested material: hardness, indentation modulus and elastic modulus. This technique was described in detail by Fischer-Cripps [14].
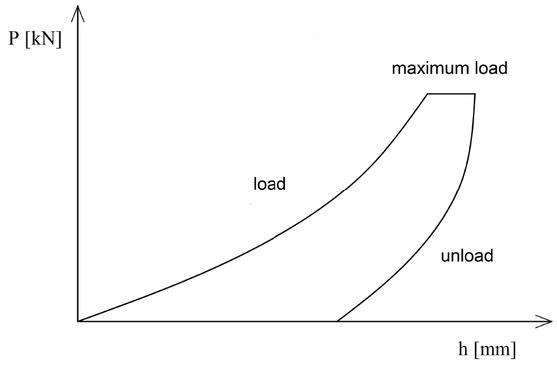
Load versus indentation depth curve.
The hardness HIT of the medium is defined as the ratio of the maximum force Pmax to the contact surface (of the indenter and the sample) A at the highest depth and force:
where size A is defined as a function of the maximum indentation depth hmax [15].
The indentation module MIT is determined using the Sneddon solution [16], which describes the relationship between force and depth when pressing a rigid element into an elastic half-space. For the Berkovich tip (tree-sided pyramid), it is determined from the equation:
where S is the slope of the unloaded curve, A is the contact surface and β is the dimensionless coefficient.
The elastic modulus EIT is determined by using the solution of the contact issue, presented by Hertz [17], from the equation:
where Ei and νi are the elastic modulus and Poisson’s ratio of the indenter, respectively, and ν and EIT are the parameters of the tested material. Determination of modulus EIT requires the assumption of Poisson’s ratio ν.
In the case of materials characterized by high heterogeneity in micro and nano-scale, the use of the so-called Grid Indentation Technique (GIT) allows for the determination of the morphology of the material in a selected scale of observation [18]. In this approach, a large number of tests are made on the predefined grid. If the grid size and indentation depth are chosen properly, statistical techniques may be applied. Generally, a higher load used in the test results in a larger imprint and a more homogenous mechanical response. On the other hand, for a relatively small load, the response refers to an individual phase of the tested material (Figure 2). In this last case, the histograms of indentation properties have a multimodal distribution and it is possible to distinguish each phase. For this purpose, the deconvolution technique presented by Bobko and Ulm [19] is used.

Scheme of the GIT for various loads.
The deconvolution procedure allows for the identification of a number of material phases and their mechanical properties from a grid indentation data set. In this approach, each indentation is treated as an independent statistical event, and the obtained values of HIT and EIT are considered as random variables. The first step is the generation of experimental cumulative distribution functions (CDF) of these variables. Next, one is specifying the theoretical CDF. It is assumed that a material is composed of j = (1,2...n) phases and each phase occupies a part fj of the indented surface. The distribution of properties is described by Gaussian distributions, expressed by mean values
3 Materials and methods
The investigated varved clay comes from close to the city of Bełchatów in central Poland. The tested material is composed of dark layers with a thickness of up to about 5 mm and very thin bright layers. It is presented in Figure 3 The particle size distributions of varved clay as a unity, and the bright and dark layers separately, are presented in Table 1. The data was obtained from three different representative samples taken for each layer and the varved clay using the standard hydrometer method [20]. Classification of the
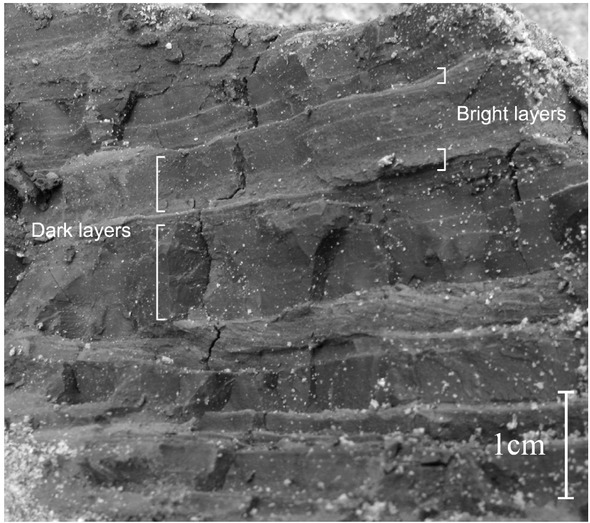
Varved clay.
The fractional composition of the tested material.
| Fraction content [%] | Type of soil | |||
|---|---|---|---|---|
| Sand 0.063–2 mm | Silt 0.002-0.063 mm | Clay <0.002 mm | ||
| Dark layer | 0.2-0.4 | 36.5-51.2 | 48.6-63.1 | Cl |
| Light layer | 5.7-22.9 | 52.5-71.8 | 18.7-24.6 | siCl / sasiCl |
| Varved clay | 2.4-3.6 | 53.2-67.7 | 28.7-44.4 | Cl / siCl |
samples was conducted in accordance with [21]. The dark layers consist mainly of clay fraction (≤ 0.002 mm) and silt fraction (0.002-0.063 mm). The composition of bright layers is more variable, but the main fraction is silt. Due to the variability of the grain size distribution and thickness of the layers, the composition of the varved clay is also variable. The examinations of its internal structure i.e identification of lamination, its thickness and arrangement, were presented by the author in [22].
A series of indentation tests were performed on the material. The tests were carried out using an TTX-NHT indenter (CSM Instruments) with a Berkovich diamond tip. To obtain reliable results, proper preparation of the tested surface was necessary – it must be flat, clean and smooth. The tested samples had a natural water content and the surface was perpendicular to the stratification. Due to the nature of the material and layer thickness, it was not possible to prepare the surface parallel to the lamination. Before the test, the soil was cold mounted with the use of epoxy resin and then placed in a vacuum chamber. After hardening of the resin, the samples were polished in three steps: first using 500 grit grinding paper, and additionally moistening the sample with alcohol; then with a diamond polishing cloth with a grit diameter of 15-3 μm (with a diamond suspension of the grit diameter of 15 μm); and finally with a cloth with a grit diameter ≤ 3 μm (with a diamond suspension of the grit diameter of 1 μm). The prepared specimen is shown in Figure 4. The samples, due to the possibility of fracture of the soil by drying, were subjected to testing immediately after grinding.

The sample prepared for the nanoindentation test.
Prior to the actual test, camera images were analyzed to identify the layering. Then, several indentations were performed in order to determine the optimum preset indentation force. After the preliminary measurements, a maximum force of 200 mN was assumed, which resulted in an imprint in the material with a size of about 10-30 μm. The size of grains and particles in the tested soil ranges from about 200 μm (for sand fraction) to less than 2 μm (for clay fraction). Due to this fact, selected force allowed for the determination of the mechanical parameters of the layers as a whole. The tests were carried out in two series: separately for the dark and light layers. An automatic grid of 100 indentation points was set for each layer. It was not possible to carry out more indentations in a given series due to the thickness of the layers. However, even such a number of results allowed the components of the material to be distinguished, which is shown in the next section. After the test, for each individual indentation, a P-h curve was obtained and the hardness HIT and elastic modulus EIT were determined. For the used indenter tip, the Poisson’s ratio is νi = 0.07 and the elastic modulus is Ei = 1000 GPa. To calculate EIT, it is necessary to assume a certain value of the Poisson ratio of the tested soil. However, this value, if reasonable, does not have a great impact on the determined values of the moduli. Therefore, when taking into account the mineral composition of the material, the average value of this coefficient was estimated to be 0.25.
4 Results
The histograms of the established hardness HIT and elastic modulus EIT for both layers are presented in Figure 5. It shows the frequency (by means of probability density) of occurrence of the given class ranges of values. Due to unevenness of the surface, some indentations failed. For the dark layer, 97 correct measurements were obtained, and for the light layer 81 correct indentations were made. The HIT and EIT values for the bright silty-sandy layer are about 10 times greater than for the dark clayey layer. In all cases, a certain scatter of results is observed. This is the result of the fact that both layers consist of grains and particles of different sizes and properties.
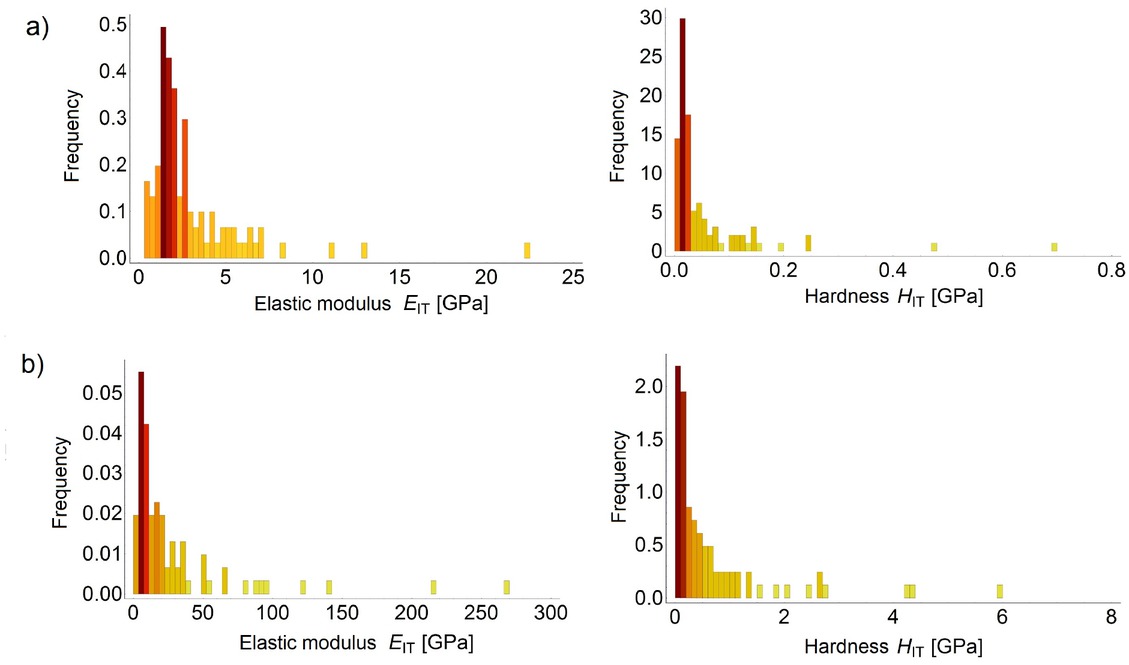
Histograms of elastic modulus EIT and hardness HIT for a) dark layer b) light layer.
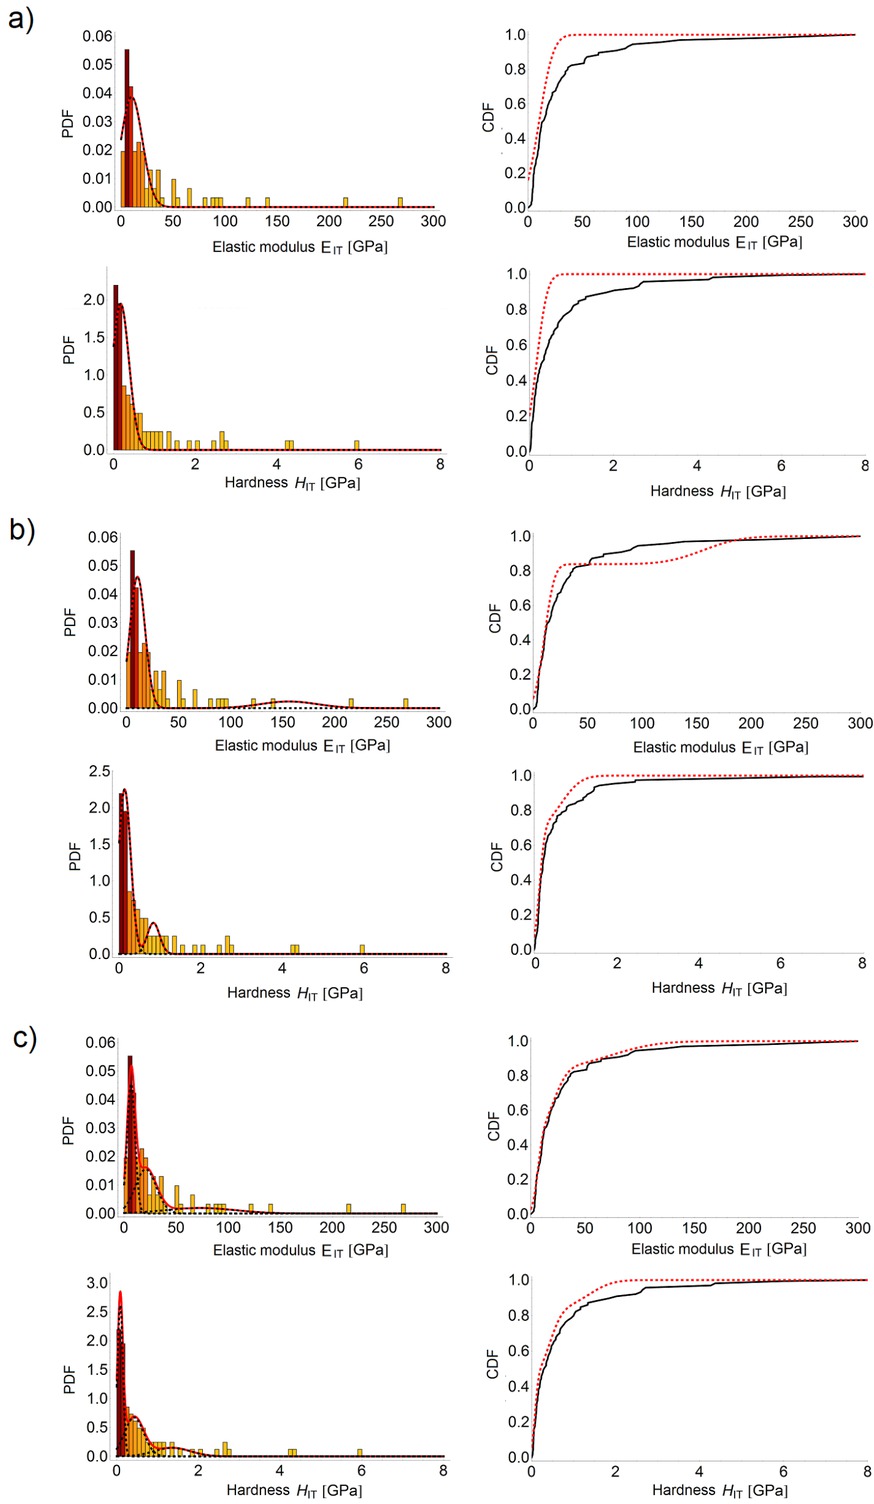
In order to describe the morphology of the layers, the deconvolution technique was applied. The procedure was carried out with the assumption of one, two or three phase, respectively. The outcomes are presented in Figures 6 (for the dark layer) and 7 (for the light layer). The histograms of elastic modulus EIT and hardness HIT are presented together
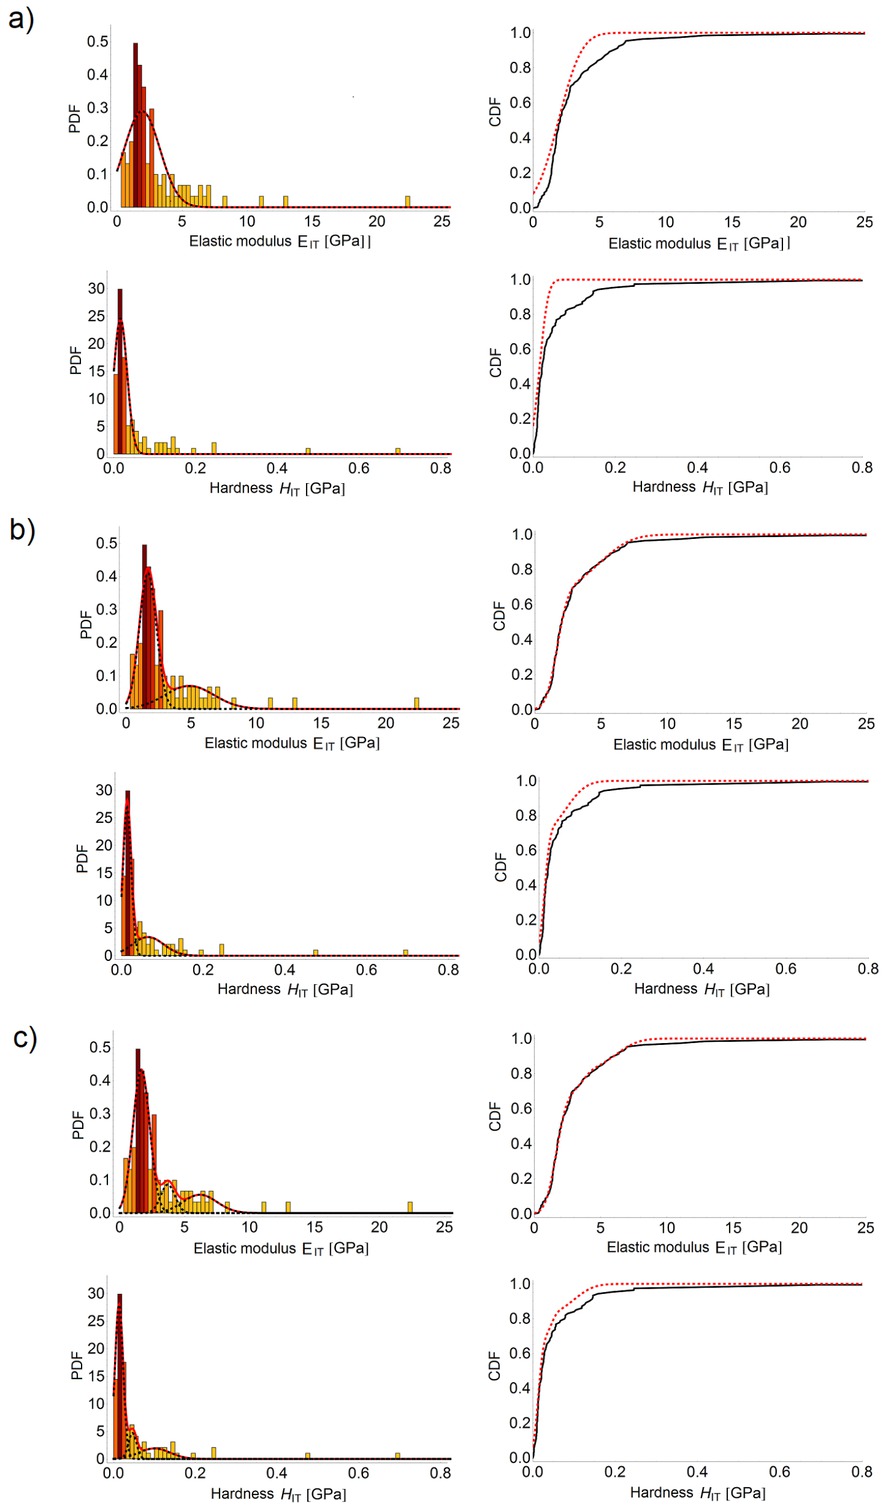
Results of deconvolution for a) 1 phase b) 2 phases c) 3 phases for the dark layer. The histograms of EIT and HIT with the PDF of individual phases (black dotted line) and the PDF for all phases (red continuous line), and also a comparison of theoretical (red dotted line) and experimental (black continuous line) CDFs.
Deconvolution parameters for the dark layer.
| Phases amount | |||||||
|---|---|---|---|---|---|---|---|
| Properties | 1 | 2 | 3 | ||||
| 1.907 | 1.662 | 4.862 | 1.663 | 3.702 | 6.175 | ||
| 0.0159 | 0.0135 | 0.0647 | 0.0133 | 0.0460 | 0.1001 | ||
| 1.376 | 0.656 | 1.874 | 0.646 | 0.548 | 1.306 | ||
| 0.0163 | 0.0100 | 0.0384 | 0.0100 | 0.0100 | 0.0378 | ||
| Share [-] | 1 | 0.67 | 0.32 | 0.70 | 0.12 | 0.18 | |
Deconvolution parameters for the light layer.
| Phases amount | |||||||
|---|---|---|---|---|---|---|---|
| Properties | 1 | 2 | 3 | ||||
| 10.129 | 10.373 | 155.757 | 6.629 | 20.665 | 73.020 | ||
| 0.1691 | 0.1311 | 0.8362 | 0.0830 | 0.4250 | 1.3570 | ||
| 10.310 | 7.259 | 27.321 | 3.841 | 10.195 | 33.778 | ||
| 0.2048 | 0.1486 | 0.1509 | 0.0669 | 0.2348 | 0.4427 | ||
| Share [-] | 1 | 0.84 | 0.16 | 0.44 | 0.40 | 0.16 | |
with the probability density functions (PDF) of individual phases (marked by a black dotted line) and the PDF for all the phases (marked by a red continuous line). Next to them, the cumulative distribution functions (CDF) for both parameters are demonstrated. Theoretical CDFs are marked by a red dotted line, and experimental ones by a black continuous line. The comparison of the quality of approximation of the experimental CDF by a theoretical one, according to the solutions for minimizing the issue, allows the selection of an adequate amount of components for each phase number. When considering the results of deconvolution for the dark layer, it was concluded that in relation to one phase (Figure 6a) the quality of description is substantially improved for two phases (Figure 6b) which is also clearly visible in the graphs. For three phases (Figure 6c) this improvement is already insignificant. In the case of the light layer, the assumption of two phases (Figure 7b) does not significantly enhance the description when compared to one phase (Figure 7a) Nevertheless, considering three phases (Figure 7c) gives much better compliance.
Results of deconvolution for a) 1 phase b) 2 phases c) 3 phases for light layer. The histograms of EIT and HIT with the PDF of individual phases (black dotted line) and the PDF for all phases (red continuous line), and also a comparison of theoretical (red dotted line) and experimental (black continuous line) CDFs.
The values of the established parameters i.e surface part fj, mean values
5 Discussion
After analyzing the outcomes of deconvolution for the dark layer, it was concluded that the best result was achieved for 2 separated phases of the material. It is related to the occurrence of only two fractions – clayey and silty – that compose this layer. According to the results for two phases, the first one covers 67% of the tested surface and corresponds to the lower values of modulus and hardness. The second one covers 32% and exhibits higher values of these parameters. This is consistent to those values obtained in the granulometric analysis. The clay fraction is found in the range of 48.6-63.1%, and the silt fraction in the range of 36.5-51.2%. It could be useful to compare the outcomes of the indentation with the mineral composition determined by X-ray diffraction, however, no such studies have been carried out.
In the case of the light layer, it was indicated that the best result was achieved for three constituents. The distinguished phases cover 44%, 40% and 16%, respectively of the indentation surface. The phase that has the largest share corresponds to the lowest values of EIT and HIT, and the one with the lowest share is associated with the highest values of the parameters. For the light layer, in the granulometric analysis, three fractions were separated, i.e clay, silt and sand, with a content of 5.7-22.9%, 52.5-71.8% and 18.7-24.6%, respectively. Compliance of the results is considerably lower than for the dark layer. It is related to the presence of a sand fraction (which is characterized by the highest value of elastic modulus and hardness) and its impact on the material’s response in the selected scale. For the 10-30 μm imprint size, the occurrence of sand grain close to the indentation surface will result in the averaged response of the material and, as a consequence, higher values of the established parameters. It is also important that due to the different granulometric composition it was possible to obtain a different smoothness of the indentation surface, which caused more errors during the tests.
When comparing the results of the mechanical properties of the identified components, some discrepancies can be found. For the dark layer, the mean values of the mechanical properties for the weaker component are 1.662 GPa for modulus and 0.0135 GPa for hardness. For a stronger constituent they are 4,862GPa and 0,0647GPa, respectively. For the light layer, the parameters of the two weaker components, identified with silt and clay fractions, are 6.629 and 20.665 GPa for EIT, and 0.0830 and 0.4250 GPa for HIT. The values are about five times higher than those obtained for the dark layer. This is associated, as stated above, with the presence of sand grains. The elastic modulus of a component identified as a sand fraction is 73.020GP, and the hardness is 1.3570GPa. A higher number of indentations would probably improve the findings of the deconvolution, however, due to the complexity of the material, the results will always be subject to uncertainty. It should also be noted that the effect of polishing a sample may affect the obtained results.
6 Conclusions
On the basis of the nanoindentation tests, the hardness and elastic modulus of the dark and bright layers of varved clay were determined. There are significant differences in the values of the micromechanical parameters obtained for the layers in the selected scale of observation. The light one, i.e silty-sandy, has much higher properties than the clayey dark layer. Furthermore, the presented results clearly confirm the heterogeneity of the composition of varved clay. Despite the limited number of tests, a separation of components of the tested surfaces was possible. In order to describe the morphology of the layers, a deconvolution technique was applied, which allowed the determination of the share of the phases and their mechanical properties. In the case of the dark layer, the best description of the results was obtained with the assumption of two phases, and for the light layer - for three. The above findings approximately coincide with the fractional composition determined in macroscopic studies, however for the light layer these differences are greater. In addition, there are some discrepancies in the results of the mechanical properties of the identified constituents. This is due to the occurrence of coarser fractions, including grains of sand, in the bright layer. The effect of different mechanical parameters of the layer constituents are the different properties of these layers and, in consequence, the anisotropy of varved clay. It indicates a multi-scale structure of the soil and the complexity of the considered issue of its strength.
References
[1] Petterson G., Renberg I., Geladi P., Lindberg A., Lindgren F., Spatial uniformity of sediment accumulation in varved lake sediments in northern Sweden, J. of Paleolimnol., 1993, 9(3), 195-20810.1007/BF00677213Suche in Google Scholar
[2] DeGroot D.J., Lutenegger A.J., Characterization by Sampling and In Situ Testing – Connecticut Valley Varved Clay, Studia Geotechnica et Mechanica, 2005, 27 (3-4), 107-120Suche in Google Scholar
[3] Jokinen S. A., Virtasalo J. J., Kotilainen A. T., Saarinen T., Varve microfabric record of seasonal sedimentation and bottom flow-modulated mud deposition in the coastal northern Baltic Sea, Mar. Geol., 2015, 366, 79-9610.1016/j.margeo.2015.05.003Suche in Google Scholar
[4] Lu Y., Tan Y., Lin G., Characterization of thick varved-clayey-silt deposits along the Delaware River by field and laboratory tests, Env. Earth Sci., 69(6), 2013,1845-186010.1007/s12665-012-2020-5Suche in Google Scholar
[5] Tiljander M., Ojala A., Saarinen T., Snowball I., Documentation of the physical properties of annually laminated (varved) sediments at a sub-annual to decadal resolution for environmental interpretation. Quarter. Int., 2002, 88(1), 5-1210.1016/S1040-6182(01)00068-4Suche in Google Scholar
[6] Kohv M., Talviste P., Hang T., Kalm V., Rosentau A., Slope stability and landslides in proglacial varved clays of western Estonia, Geomorphology, 2009, 106(3), 315-32310.1016/j.geomorph.2008.11.013Suche in Google Scholar
[7] Ladd C. C., Wissa, A. E., Geology and Engineering Properties of Connecticut Vally Varved Clays with Special Reference to Embankment Construction, Soils Publication, 1970, 264Suche in Google Scholar
[8] Marko K., Tiit H., Peeter T., Volli K., Analysis of a retrogressive landslide in glaciolacustrine varved clay, Eng. Geol., 2010, 116(1), 109-11610.1016/j.enggeo.2010.07.012Suche in Google Scholar
[9] Tankiewicz M., Kawa M., Identification of anisotropic criteria for stratified soil based on triaxial tests results, Studia Geotechnica et Mechanica, 2017, 39 (3), 59-6510.1515/sgem-2017-0030Suche in Google Scholar
[10] Oliver W. C., Pharr G. M., An improved technique for determining hardness and elastic modulus using load and displacement sensing indentation experiments, J.Mat. Res., 1992, 7 (6), 1564-158310.1557/JMR.1992.1564Suche in Google Scholar
[11] Cała M., Cyran K., Kawa M., Kolano M., Łydżba D., Pachnicz M., Rajczakowska M., Różański A., Sobótka M., Stefaniuk D., Stopkowicz A., Wałach D., Identification of Microstructural Properties of Shale by Combined Use of X-Ray Micro-CT and Nanoindentation Tests, Proced. Eng., 2017, 191, 735-74310.1016/j.proeng.2017.05.239Suche in Google Scholar
[12] Daphalapurkar N.P., Wang F., Fu B., Lu H., Komanduri R., Determination of Mechanical Properties of Sand Grains by Nanoindentation, Exp. Mech., 2011, 51, 719-72810.1007/s11340-010-9373-zSuche in Google Scholar
[13] Zhu W., Hughes J. J., Bicanic N., Pearce C. J., Nanoindentation mapping of mechanical properties of cement paste and natural rocks, Mater. Charact., 2007, 58(11), 1189-119810.1016/j.matchar.2007.05.018Suche in Google Scholar
[14] Fischer-Cripps A. C., Nanoindentation, Springer, 201110.1007/978-1-4419-9872-9Suche in Google Scholar
[15] Oliver,W. C., Pharr, G. M., Measurement of hardness and elastic modulus by instrumented indentation: Advances in understanding and refinements to methodology, J. Mat. Res., 2004, 19(1), 3-2010.1557/jmr.2004.19.1.3Suche in Google Scholar
[16] Sneddon I. N., The relation between load and penetration in the axisymmetric Boussinesq problem for a punch of arbitrary profile, Int. J. Eng. Sci., 1965, 3(1), 47-5710.1016/0020-7225(65)90019-4Suche in Google Scholar
[17] Francavilla A., Zienkiewicz O. C., A note on numerical computation of elastic contact problems, Int. J. Num. Meth. Eng., 1975, 9(4), 913-92410.1002/nme.1620090410Suche in Google Scholar
[18] Constantinides, G., Ulm, F. J., Van Vliet, K., On the use of nanoindentation for cementitious materials, Mater. Struct., 2003, 36(3), 191-19610.1007/BF02479557Suche in Google Scholar
[19] Bobko, C., Ulm, F. J., The nano-mechanical morphology of shale, Mech. Mater., 2008, 40(4), 318-33710.1016/j.mechmat.2007.09.006Suche in Google Scholar
[20] PKN-CEN ISO/TS 17892-4:2009, Geotechnical investigation and testing. Laboratory testing of soil. Part 4: Determination of particle size distribution.Suche in Google Scholar
[21] PN-EN ISO 14688: 2006, Geotechnical investigation and testing. Identification and classification of soil.Suche in Google Scholar
[22] Tankiewicz M., Structure investigations of layered soil – varved clay, Ann. Warsaw Univ. Life Sci. – SGGW, Land Reclam., 2016, 48(4), 365-37510.1515/sggw-2016-0028Suche in Google Scholar
© 2018 M. Tankiewicz, published by De Gruyter
This work is licensed under the Creative Commons Attribution-NonCommercial-NoDerivatives 4.0 License.
Artikel in diesem Heft
- Regular Articles
- Spatio-temporal monitoring of vegetation phenology in the dry sub-humid region of Nigeria using time series of AVHRR NDVI and TAMSAT datasets
- Water Quality, Sediment Characteristics and Benthic Status of the Razim-Sinoie Lagoon System, Romania
- Provenance analysis of the Late Triassic Yichuan Basin: constraints from zircon U-Pb geochronology
- Historical Delineation of Landscape Units Using Physical Geographic Characteristics and Land Use/Cover Change
- ‘Hardcastle Hollows’ in loess landforms: Closed depressions in aeolian landscapes – in a geoheritage context
- Geostatistical screening of flood events in the groundwater levels of the diverted inner delta of the Danube River: implications for river bed clogging
- Utilizing Integrated Prediction Error Filter Analysis (INPEFA) to divide base-level cycle of fan-deltas: A case study of the Triassic Baikouquan Formation in Mabei Slope Area, Mahu Depression, Junggar Basin, China
- Architecture and reservoir quality of low-permeable Eocene lacustrine turbidite sandstone from the Dongying Depression, East China
- Flow units classification for geostatisitical three-dimensional modeling of a non-marine sandstone reservoir: A case study from the Paleocene Funing Formation of the Gaoji Oilfield, east China
- Umbrisols at Lower Altitudes, Case Study from Borská lowland (Slovakia)
- Modelling habitats in karst landscape by integrating remote sensing and topography data
- Mineral Constituents and Kaolinite Crystallinity of the <2 μm Fraction of Cretaceous-Paleogene/Neogene Kaolins from Eastern Dahomey and Niger Delta Basins, Nigeria
- Construction of a dynamic arrival time coverage map for emergency medical services
- Characterizing Seismo-stratigraphic and Structural Framework of Late Cretaceous-Recent succession of offshore Indus Pakistan
- Geosite Assessment Using Three Different Methods; a Comparative Study of the Krupaja and the Žagubica Springs – Hydrological Heritage of Serbia
- Use of discriminated nondimensionalization in the search of universal solutions for 2-D rectangular and cylindrical consolidation problems
- Trying to underline geotourist profile of National park visitors: Case study of NP Fruška Gora, Serbia (Typology of potential geotourists at NP Fruška Gora)
- Fluid-rock interaction and dissolution of feldspar in the Upper Triassic Xujiahe tight sandstone, western Sichuan Basin, China
- Calcified microorganisms bloom in Furongian of the North China Platform: Evidence from Microbialitic-Bioherm in Qijiayu Section, Hebei
- Spatial predictive modeling of prehistoric sites in the Bohemian-Moravian Highlands based on graph similarity analysis
- Geotourism starts with accessible information: the Internet as a promotional tool for the georesources of Lower Silesia
- Models for evaluating craters morphology, relation of indentation hardness and uniaxial compressive strength via a flat-end indenter
- Geotourism in an urban space?
- The first loess map and related topics: contributions by twenty significant women loess scholars
- Modeling of stringer deformation and displacement in Ara salt after the end of salt tectonics
- A multi-criteria decision analysis with special reference to loess and archaeological sites in Serbia (Could geosciences and archaeology cohabitate?)
- Speleotourism in Slovenia: balancing between mass tourism and geoheritage protection
- Attractiveness of protected areas for geotourism purposes from the perspective of visitors: the example of Babiogórski National Park (Poland)
- Implementation of Heat Maps in Geographical Information System – Exploratory Study on Traffic Accident Data
- Mapping War Geoheritage: Recognising Geomorphological Traces of War
- Numerical limitations of the attainment of the orientation of geological planes
- Assessment of runoff nitrogen load reduction measures for agricultural catchments
- Awheel Along Europe’s Rivers: Geoarchaeological Trails for Cycling Geotourists
- Simulation of Carbon Isotope Excursion Events at the Permian-Triassic Boundary Based on GEOCARB
- Morphometry of lunette dunes in the Tirari Desert, South Australia
- Multi-spectral and Topographic Fusion for Automated Road Extraction
- Ground-motion prediction equation and site effect characterization for the central area of the Main Syncline, Upper Silesia Coal Basin, Poland
- Dilatancy as a measure of fracturing development in the process of rock damage
- Error-bounded and Number-bounded Approximate Spatial Query for Interactive Visualization
- The Significance of Megalithic Monuments in the Process of Place Identity Creation and in Tourism Development
- Analysis of landslide effects along a road located in the Carpathian flysch
- Lithological mapping of East Tianshan area using integrated data fused by Chinese GF-1 PAN and ASTER multi-spectral data
- Evaluating the CBM reservoirs using NMR logging data
- The trends in the main thalweg path of selected reaches of the Middle Vistula River, and their relationships to the geological structure of river channel zone
- Lithostratigraphic Classification Method Combining Optimal Texture Window Size Selection and Test Sample Purification Using Landsat 8 OLI Data
- Effect of the hydrothermal activity in the Lower Yangtze region on marine shale gas enrichment: A case study of Lower Cambrian and Upper Ordovician-Lower Silurian shales in Jiangye-1 well
- Modified flash flood potential index in order to estimate areas with predisposition to water accumulation
- Quantifying the scales of spatial variation in gravel beds using terrestrial and airborne laser scanning data
- The evaluation of geosites in the territory of National park „Kopaonik“(Serbia)
- Combining multi-proxy palaeoecology with natural and manipulative experiments — XLII International Moor Excursion to Northern Poland
- Dynamic Reclamation Methods for Subsidence Land in the Mining Area with High Underground Water Level
- Loess documentary sites and their potential for geotourism in Lower Silesia (Poland)
- Equipment selection based on two different fuzzy multi criteria decision making methods: Fuzzy TOPSIS and fuzzy VIKOR
- Land deformation associated with exploitation of groundwater in Changzhou City measured by COSMO-SkyMed and Sentinel-1A SAR data
- Gas Desorption of Low-Maturity Lacustrine Shales, Trassic Yanchang Formation, Ordos Basin, China
- Feasibility of applying viscous remanent magnetization (VRM) orientation in the study of palaeowind direction by loess magnetic fabric
- Sensitivity evaluation of Krakowiec clay based on time-dependent behavior
- Effect of limestone and dolomite tailings’ particle size on potentially toxic elements adsorption
- Diagenesis and rock properties of sandstones from the Stormberg Group, Karoo Supergroup in the Eastern Cape Province of South Africa
- Using cluster analysis methods for multivariate mapping of traffic accidents
- Geographic Process Modeling Based on Geographic Ontology
- Soil Disintegration Characteristics of Collapsed Walls and Influencing Factors in Southern China
- Evaluation of aquifer hydraulic characteristics using geoelectrical sounding, pumping and laboratory tests: A case study of Lokoja and Patti Formations, Southern Bida Basin, Nigeria
- Petrography, modal composition and tectonic provenance of some selected sandstones from the Molteno, Elliot and Clarens Formations, Karoo Supergroup, in the Eastern Cape Province, South Africa
- Deformation and Subsidence prediction on Surface of Yuzhou mined-out areas along Middle Route Project of South-to-North Water Diversion, China
- Abnormal open-hole natural gamma ray (GR) log in Baikouquan Formation of Xiazijie Fan-delta, Mahu Depression, Junggar Basin, China
- GIS based approach to analyze soil liquefaction and amplification: A case study in Eskisehir, Turkey
- Analysis of the Factors that Influence Diagenesis in the Terminal Fan Reservoir of Fuyu Oil Layer in the Southern Songliao Basin, Northeast China
- Gravity Structure around Mt. Pandan, Madiun, East Java, Indonesia and Its Relationship to 2016 Seismic Activity
- Simulation of cement raw material deposits using plurigaussian technique
- Application of the nanoindentation technique for the characterization of varved clay
- Verification of compressibility and consolidation parameters of varved clays from Radzymin (Central Poland) based on direct observations of settlements of road embankment
- An enthusiasm for loess: Leonard Horner in Bonn and Liu Tungsheng in Beijing
- Limit Support Pressure of Tunnel Face in Multi-Layer Soils Below River Considering Water Pressure
- Spatial-temporal variability of the fluctuation of water level in Poyang Lake basin, China
- Modeling of IDF curves for stormwater design in Makkah Al Mukarramah region, The Kingdom of Saudi Arabia