Lithological mapping of East Tianshan area using integrated data fused by Chinese GF-1 PAN and ASTER multi-spectral data
-
Min Yang
 ,
Lei Kang
,
Lei Kang

Abstract
The East Tianshan Mountain is one of the most important gold ore forming zones in northwestern China and central Asia. The Chinese GaoFen-1 (GF-1), the first Chinese high resolution satellite, is characterized by its 2-m resolution PAN data. The Advanced Spaceborne Thermal Emission and Reflection Radiometer (ASTER), the well-known earth observation satellite, is advanced by its finer spectral resolution owing 9 bands in the visible and near infrared (VNIR) to the short-wave infrared (SWIR) region. In this study, we fused the GF-1 PAN and the ASTER multispectral data using the well-known Gram-Schmidt Pan Sharpening (G-S) method to produce a new data with both high spatial and spectral resolution. Then different lithological units were mapped respectively using the fusion data, the ASTER data and the WorldView-3 data by support vector machine (SVM) method. In order to assess this fusion data, a comparison work was executed among the three mapping results. The comparison work indicated that lithological classification using the new fusion data is an efficient, robust and low cost method, and it could replace the WV-3 data in some large sale geological work.
1 Introduction
A series of multispectral remote sensing sensor have been successfully used for lithological mapping, alteration products discrimination and fracture structure interpretation. The most commonly used data are including Landsat 5 Thematic Mapper (TM), Landsat 7 Enhanced Thematic Mapper Plus (ETM+), Landsat 8 Operational Land Imager (OLI) and Terra Advanced Spaceborne Thermal Emission and Reflection Radiometer (ASTER) data [1,2,3,4,5,6,7,8,9,10,11]. The ASTER satellite carrying the Terra platform (EOS), was launched in December 1999 and provide a finer spectral resolution with three visible and near infrared (VNIR) bands from 520 to 860 nm and six short-wave infrared (SWIR) bands from 1600 to 2500 nm. But the spatial resolution of the ASTER images is relatively low at 15m of VNIR bands and 30 m of SWIR bands per pixel [1]. The ASTER data was widely applied in geological works due to its spectral advantage in short-wave infrared (SWIR) region, which covers hydroxyl absorption bands and carbonate bands (Al-OH, Mg-OH and
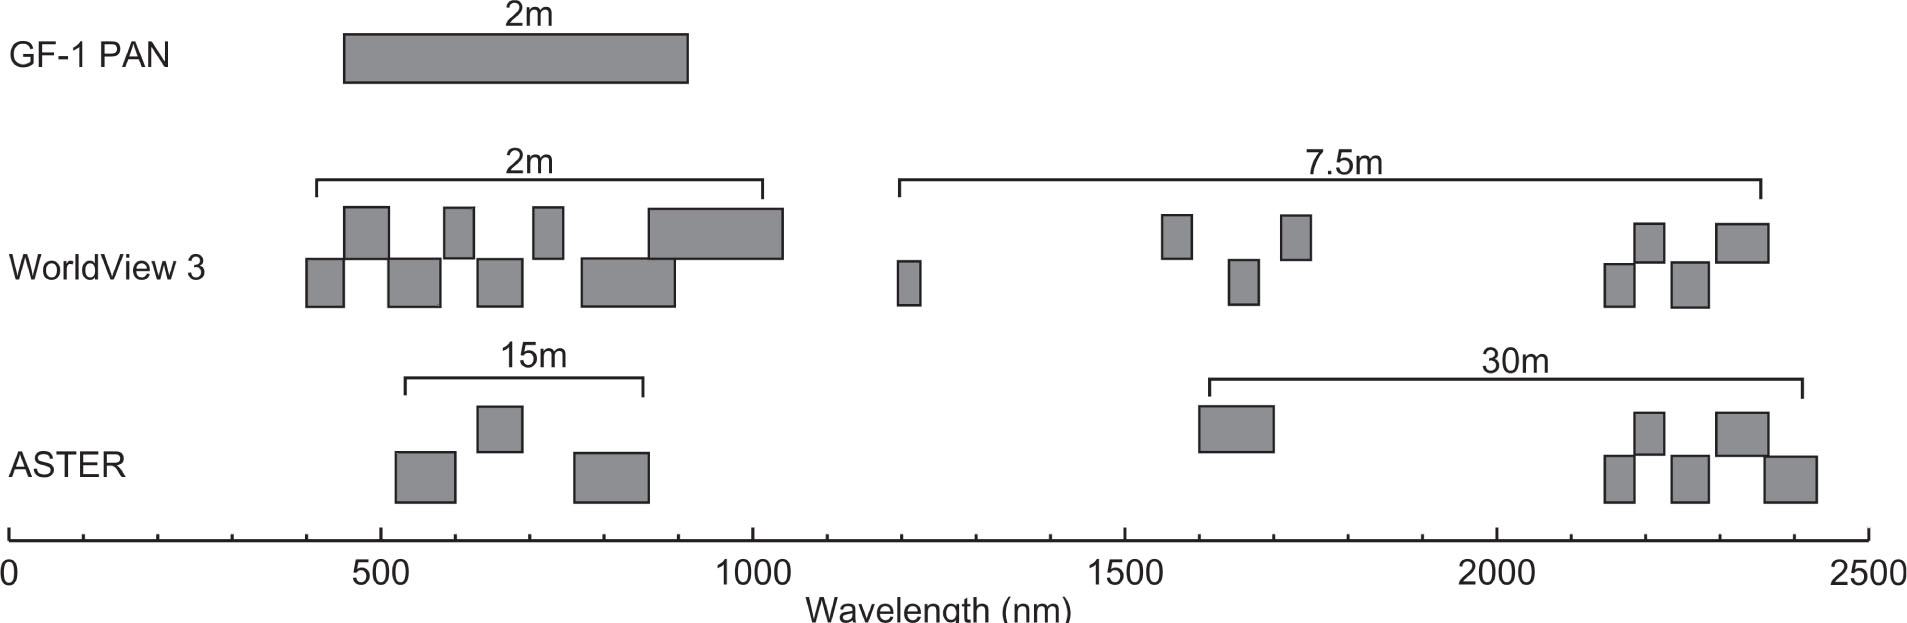
The bands of the GF-1 PAN, WorldView-3 and ASTER data
Hyperspectral data, including airborne and spaceborne imagery, have been widely used in lithological mapping, alteration minerals mapping and providing significant geological information for geologic researchers in some arid areas [20,21,22,23,24]. The airborne hyperspectral technique was considered to be a time and financial consuming method and it is not suitable for regional data collection [25]. The NASA’s EO-1 Hyperion, the first spaceborne hyperspectral sensor, was launched on November 21, 2000. It opened up new opportunities for geological mapping with 242 spectral bands (400-2500 nm) and 30 m spatial resolution [26,27,28]. The Chinese first spaceborne hyperspectral sensor, the Tiangong-1 Hyerspectral Imager (HSI), was launched on September 29, 2011. It provides 64 bands in visible to near infrared region (400-1000 nm) and another 64 bands in short-wave infrared region (1000-2500nm). And the Tiangong-1 data was proved to be a valuable way in assisting gold exploration [29]. Although the spaceborne data could perfectly map the geologic indicators and freely obtained from the United States Geological Survey’s website, the ground coverage of these data is relatively low than the ASTER and the Landsat series [30].
Images fused by Landsat 5 TM multispectral data and IRS-1C panchromatic data were used for lithological mapping in the Holenarsipur Supracrustal Belt, India, and this fusion data could help geologists to easily find the boundaries of resistant rock formations [31]. Fusion data integrated by ERS-2 SAR imagery and IRS-1C multispectral data were assisted lithological mapping in the Singhbhum Shear Zone, India, and this data could discriminated various litho-units [32]. Imagery fused by Landsat 7 ETM+ multispectral data and ERS-2 SAR data were experimented for geological mapping in Eljufra, Libya [33]. A new data integration for geological mapping in vegetation presence areas was conducted on basis of Airborne Thematic Mapper (ATM) multispectral data and Airborne LiDAR data [34], but the collection and processing of the airborne data may become time and financial consuming. Zawadzki et al. reported a geo-statistical based technique to extract vegetation information in some forest covering areas, these methods could help to solve the problems caused by vegetation cover in lithological mapping [35]. An effective way of identifying the volcanic and granitic rocks was reported using a kind of fusion data integrated by Egyptsat 1 and Landsat 7 ETM+ data [36]. Data fused by the Phased Array type L-band Synthetic Aperture Radar (PALSAR) data and the ASTER data could provide further detail geological information for metallic deposits exploration [37]. Integrated images by fusing the GF-1 PAN and Landsat 8 OLI were applied to map the iron oxide minerals distribution, and provided an efficient and economic method in exploring geological information by remotely sensed technique [38].
The aim of this study is to traditionally process the new integrated data fused by GF-1 PAN image and ASTER multispectral bands for lithological mapping and to evaluate the classification accuracy of this fusion data by comparing with the classification results of ASTER data and WV-3 data processed by the same method. The main novelty of this study is reporting an economical way for lithological mapping and geological survey by use of a fusion data produced by the Chinese GF-1 and ASTER.
2 Geological Settings
The study area is located in the East Tianshan ore forming belt of the Xinjiang Uygur Autonomous Region, Northwest China (Figure 2). The East Tianshan ore forming belt is one of the most important metallogenic belt with an abundance of metallic mineral deposits such as Tuwu copper deposit, Yandong copper deposit, Yamansu Fe-Cu deposit, Bailingshan Fe deposit, Xiaorequanzi Cu-Zn deposit, Shiyingshan gold deposit, etc. Most of the deposits are porphyry-, skarn-, or hydrothermal related with tectonic and intrusions [39].

The location of the study area (The image is WV-3 natural color data)
The Palaeoproterozoic gneiss, the Late Carboniferous to Permian diorite, hornblende diorite, and gabbro, and the Early Permian granite intrusions are the main stratigraphic units of the study area. The gneiss is generally distributed in the north part of the study area. The diorite or hornblende diorite are widespread in the middle and south part of the study area. The gabbro is located at the east part of the study area. Additionally, some small sized granite intrusions (10-60 m in width) are located in the diorite.
According to some regional geological researches, the study area may be a significant gold metallogenic zone. While two types of gold deposits were declared to be the main exploration target: first is the volcano gold deposit occurred in the Permian and Carboniferous volcano rocks including the Xinjinchang gold deposit; second is the hydrothermal gold deposits related to intermediate acidic magmatite, mostly occurs in acid rock alteration zones [40].
3 Materials and Methods
3.1 Remote Sensing Data
The cloudless GF-1 PAN data was obtained on 13 September, 2015, and was freely provided by the CRESDA (http://www.cresda.com/CN/). The image was georeferenced to UTM zone 46 North projection by using WGS-84 datum. The ASTER level 1B data used in this study were acquired on 20 July, 2006. The images have been pre-georeferenced to UTM zone 46 North projections with WGS-84 datum. The spatial resolution of SWIR bands were resampled to 15m according to VNIR bands, and the ASTER data were corrected for atmospheric effects using the Fast Line-of-sight Atmospheric Analysis of Spectral Hypercubes module (FLAASH). The ASTER data are available to the general public at no cost and can be downloaded at the United States Geological Survey’s (USGS) website: http://glovis.usgs.gov. The WorldView-3 data was obtained from the 21st Century Aerospace Technology Company (Beijing, China), at level L2A. The WV-3 data was acquired at 05:08 am, 29 June 2016, UTC time, and the images was refer to reflectance data already. Because of the commercial restriction, the WV-3 VNIR data and SWIR data were resampled from 1.24 m and 3.7 m to 2 m and 7.5 m respectively. We also resampled the SWIR images to 2 m according to the VNIR bands. The three kinds of images were subset via the region of interest (ROI) of their repeating area for further processing. The data processing methods is shown in Figure 3.
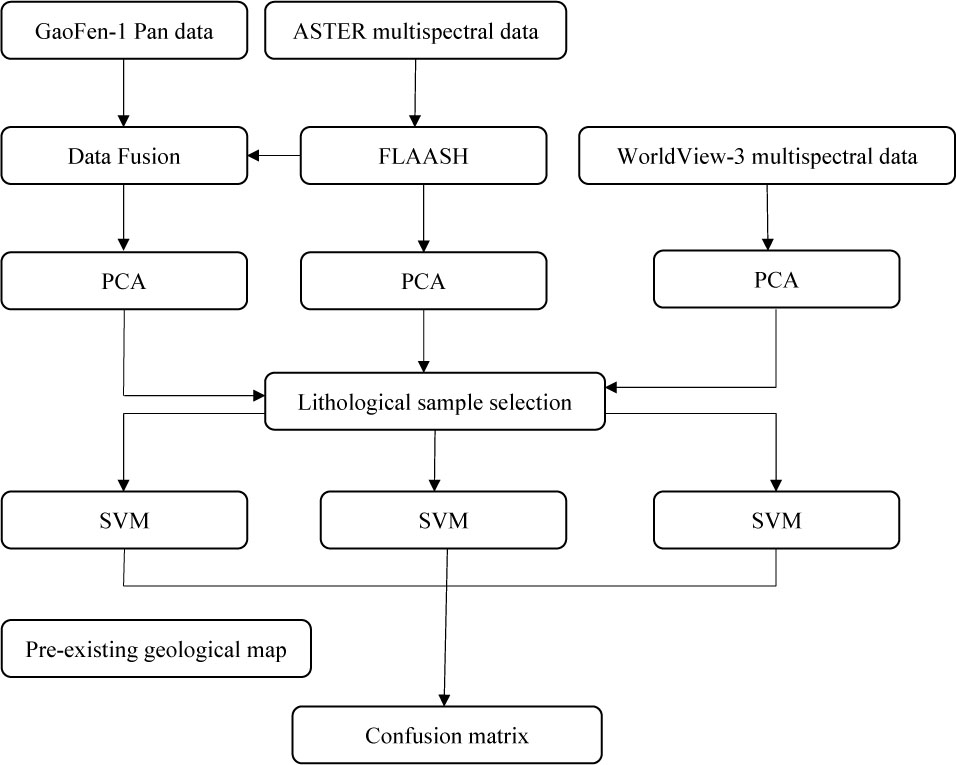
The flow chart of the data processing methods
3.2 Gram-Schmidt Pan Sharpening
Pan-sharpening algorithms are used to sharpen multispectral data using high spatial resolution panchromatic data. Gram-Schmidt Pan Sharpening (G-S) is a phase retrieval algorithm published by Laben and Brower (2000) [41]. The spatial resolution of the multispectral images is enhanced by merging the high resolution Pan image with the low spatial resolution multispectral bands. Since its publication, the Gram-Schmidt pan-sharpen method has become one of the most useful fusion methods [42]. Some available studies fused Hyperion hyperspectral data and IKONOS data for land cover classification or fused Landsat 8 OLI data and GF-1 PAN data for mineral mapping using Gram-Schmidt Pan Sharpening [38]. Therefore, the new fused data and the fusion method were proved to be valuable even though their bands cover different spectral range [38,43]. The Gram-Schmidt Pan Sharpening method was used to fuse GF-1 PAN data with ASTER data and to produce a new 9 bands multispectral data with both high spectral and spatial resolution.
3.3 Principal Component Analysis
Principal component analysis (PCA) is a statistical tool for producing uncorrelated bands by finding a new set of orthogonal axes that have their origin at the data mean, and that are rotated so the data variance is maximized [44,45,46,47]. The PCA technique is traditionally used to compress a large correlated band into smaller uncorrelated bands named principal components (PCs) [9]. This process eliminates the data redundancy, isolates the noise in the output PC bands, and therefore enhances certain types of spectral signatures from the background. PCA was applied to the proposed ASTER data, fusion data and WV-3 data to emphasize the distribution of the different rock units in the study area. Then the main principal bands including most information were selected to compose false color images for lithological discrimination.
3.4 Support Vector Machine Classification
The support vector machine (SVM) is a classification method on basis of statistical learning theory. It maximizes the margin between the classes and discriminates the classes with a decision surface. The surface is generally named as the optimal hyperplane, and the data points closest to the hyperplane are described as support vectors [48,49,50,51]. The support vectors are the critical elements of the training set. The lithological samples of different rocks were selected via regions of interests (ROIs) according to the pre-existing geological map for SVM classification (Figure 4). The ROIs of the samples were meticulously selected by geologists who mapped the geological map.

The distribution map of the lithological samples selected via ROIs
3.5 Confusion Matrix
The accuracy of each classification result using SVM method was examined via a Confusion Matrix by comparing a mapping result with ground truth ROIs selected according to pre-existing geological map. The overall accuracy is represented by the ratio of the number of correctly classified pixels to the total number of pixels. The total number of pixels is the sum of all the pixels in all the ground truth classes. The true class of the pixels are defined by the ground truth ROIs, which are collected from the pre-existing geological map. The correctly classified pixels are list along the diagonal of the confusion matrix table where the number of pixels delimit into the correct ground truth class. The total number of pixels is calculated by summing up the pixels in all the ground truth classes [52].
4 Results
4.1 Principal Component Analysis
The results calculated from the PCA, which include PC bands and eigenvalues [53, 54]. PC1 contains the highest values (usually the total albedo of the scene) in each kind of image (99.365% in ASTER, 99.391% in fusion image and 98.644% in WV-3). PC2 enhances the discrepancies between the VNIR bands (ASTER bands 1, 2, 3 and WV-3 bands 1-8) and SWIR bands (ASTER bands 4, 5, 6, 7, 8, 9 and WV-3 bands 9-16) by opposite signs [6]. In the remaining PCs, the signs and magnitude of eigenvectors could be analyzed in the discrimination of different objects [55]. From the PCA results, we selected PC1, PC2 and PC3 bands of each data for finer discrimination of lithology in the study area because of the high percentage of the ground information. The PCA (R: PC2, G: PC1, B: PC3) false color images of the three kinds of data were made for geological interpretations, which perform various colors in different lithology. The gneiss are identified by a pink-magenta tone in the ASTER data, appear as dark blue in the fusion data, and showed by red to magenta in the WV-3 data. The amphibole diorite and diorite are marked by green to yellow in the ASTER data, displayed as light blue to yellow-green in the fused data, and covered by light green to yellow in the WV-3 data. The gabbro are depicted as purple to dark-blue in the ASTER image, showed by dark blue in the fused data, and appear as purple in the WV-3 data. The granite are similarly showed by green to yellow color in the three kinds of data. The alluvium are displayed as light pink, light blue and green in the ASTER, fused data and WV-3 data respectively. The PCA false color images of three different data are shown in Figure 5. The recognition ability of small geological intrusions could also improve by the fusion method. Some gabbro dykes could hardly find in the ASTER data (Figure 6a) but could easily identified in the fusion image and the WV-3 data (Figure 6b and 6c).
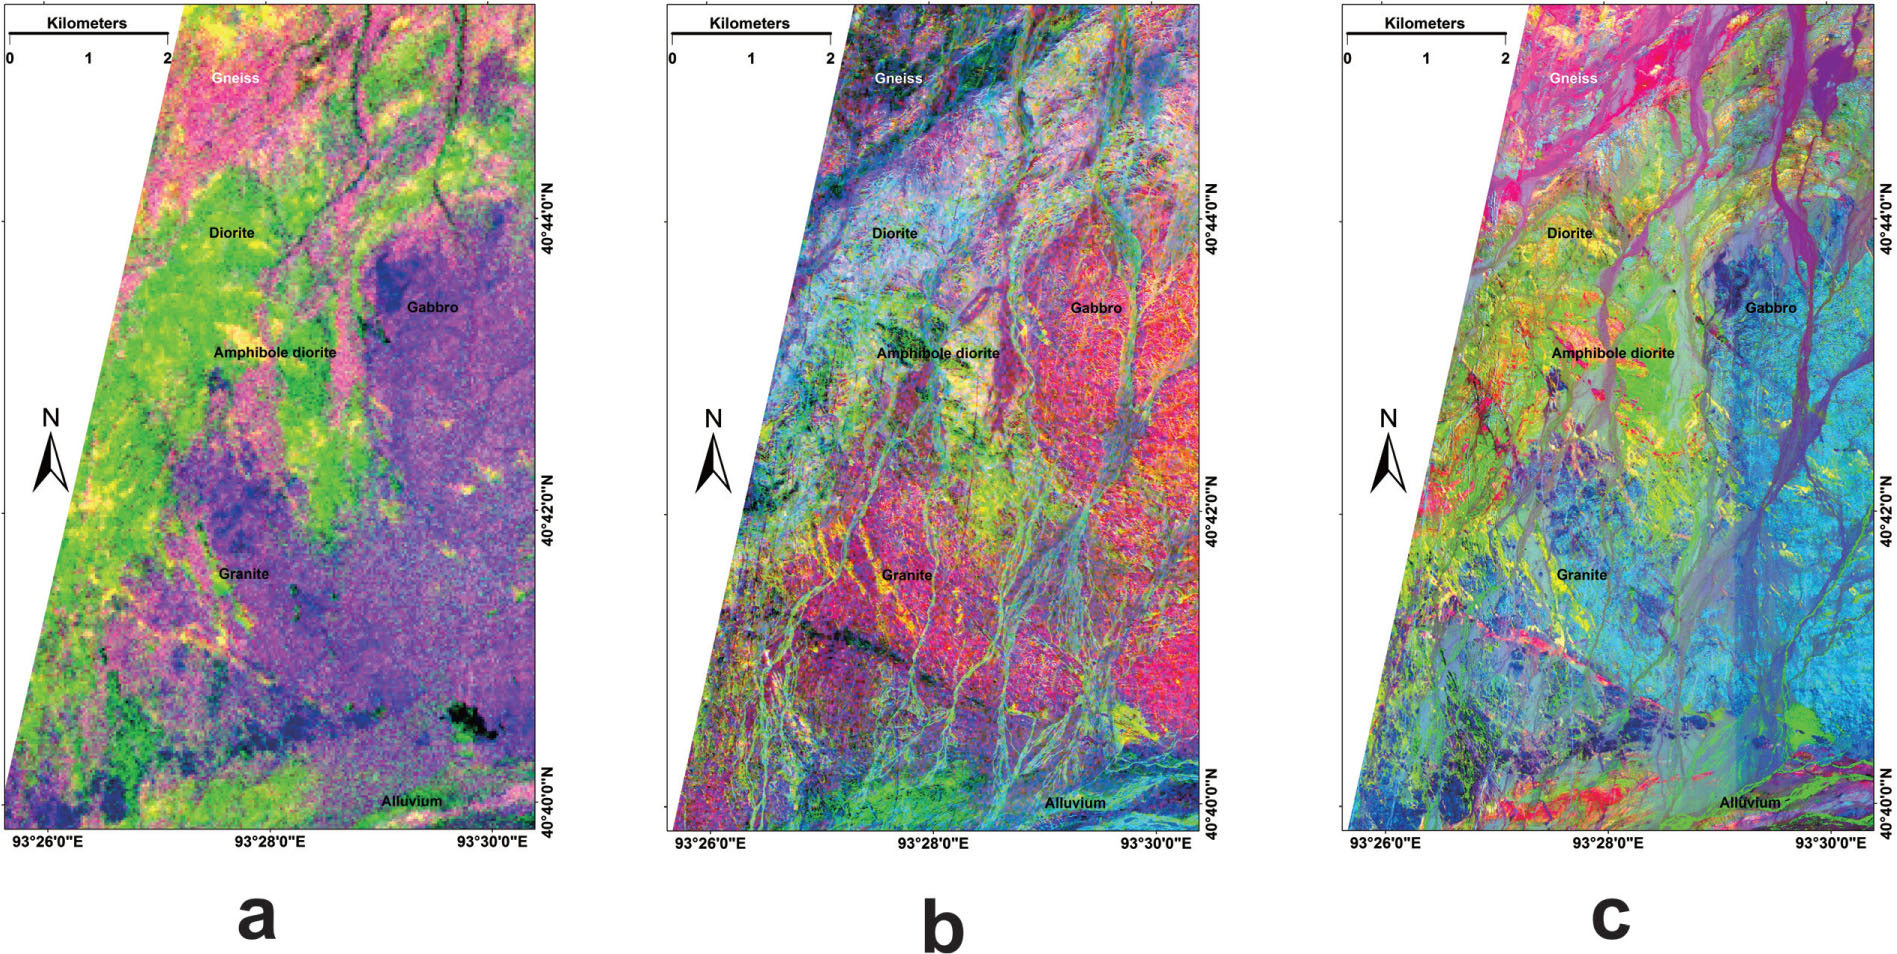
The results of band combinations derived from PCA result (R:G:B = 2:1:3), a. result of the ASTER data, b. result of the fusion data, c. result of the WV-3 data
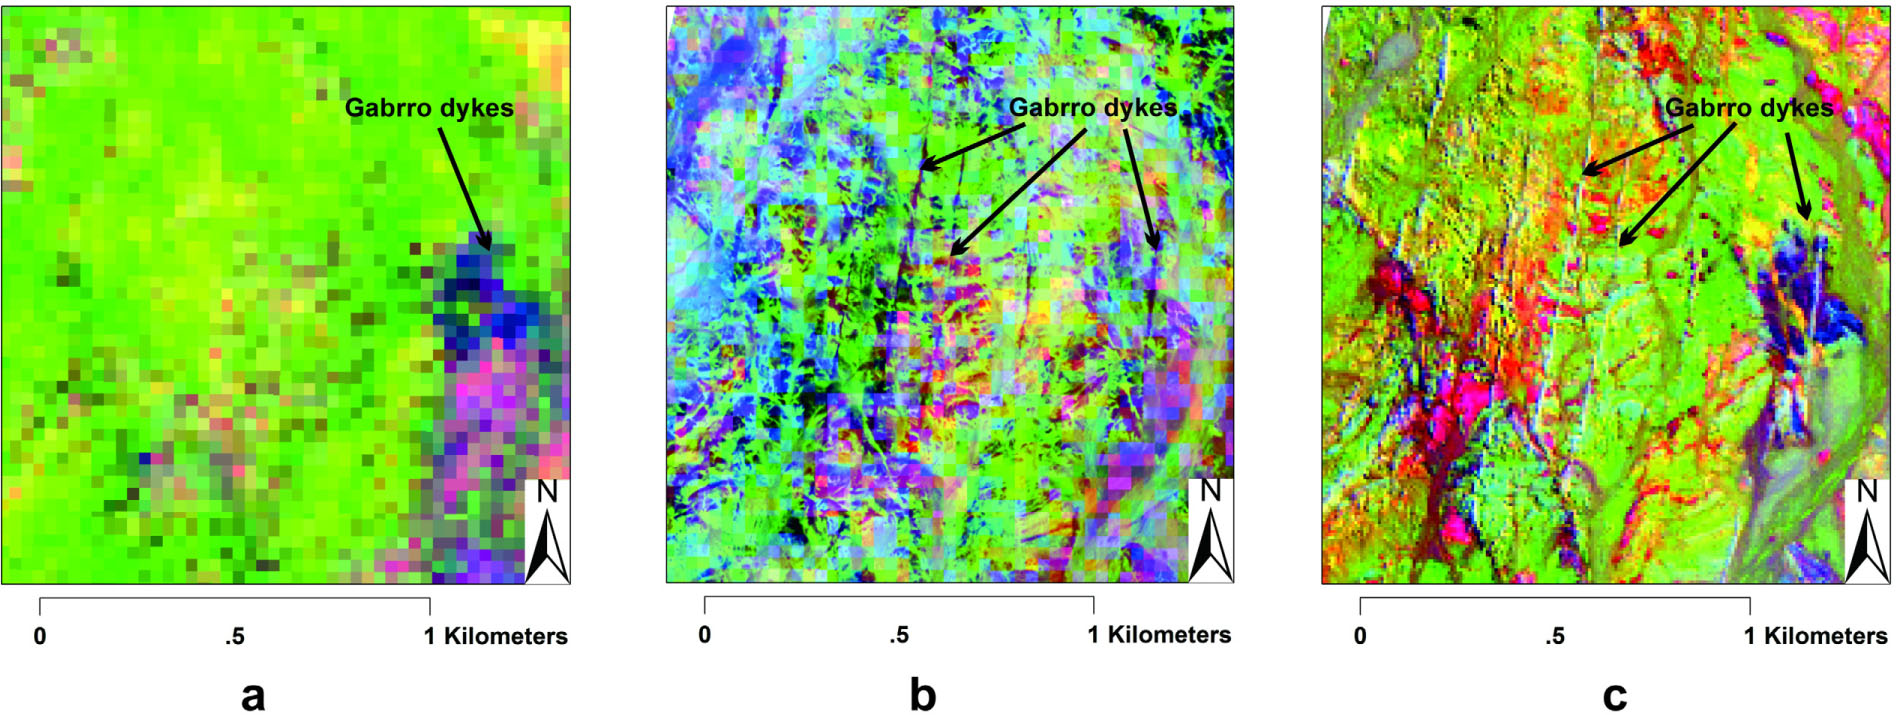
Comparison of the three kinds of PCA images in highlighting the gabbro dykes (a. the ASTER data, b. the fusion data, c. the WV-3 data)
4.2 Support Vector Machine
Lithological classification maps using SVM method on basis of three kinds of data are shown in Figure 7. Six types of lithological units including gneiss, diorite, hornblende diorite, gabbro, granite and alluvium have been distinguished well using WV-3 and the fusion data whereas the lithological distribution mapped by the two data are similar to the pre-existing geological map (Figure 7b and 7c). And more details of rock units could be shown from the classification result of WV-3 imagery. The mapping results of ASTER data are also efficient in identifying gneiss, diorite, gabbro and alluvium, but fail to discriminate hornblende diorite from diorite (Figure 7a). Furthermore, the granite and alluvium mapped by ASTER data are wide spread in our study area, this result may contain high misclassification.
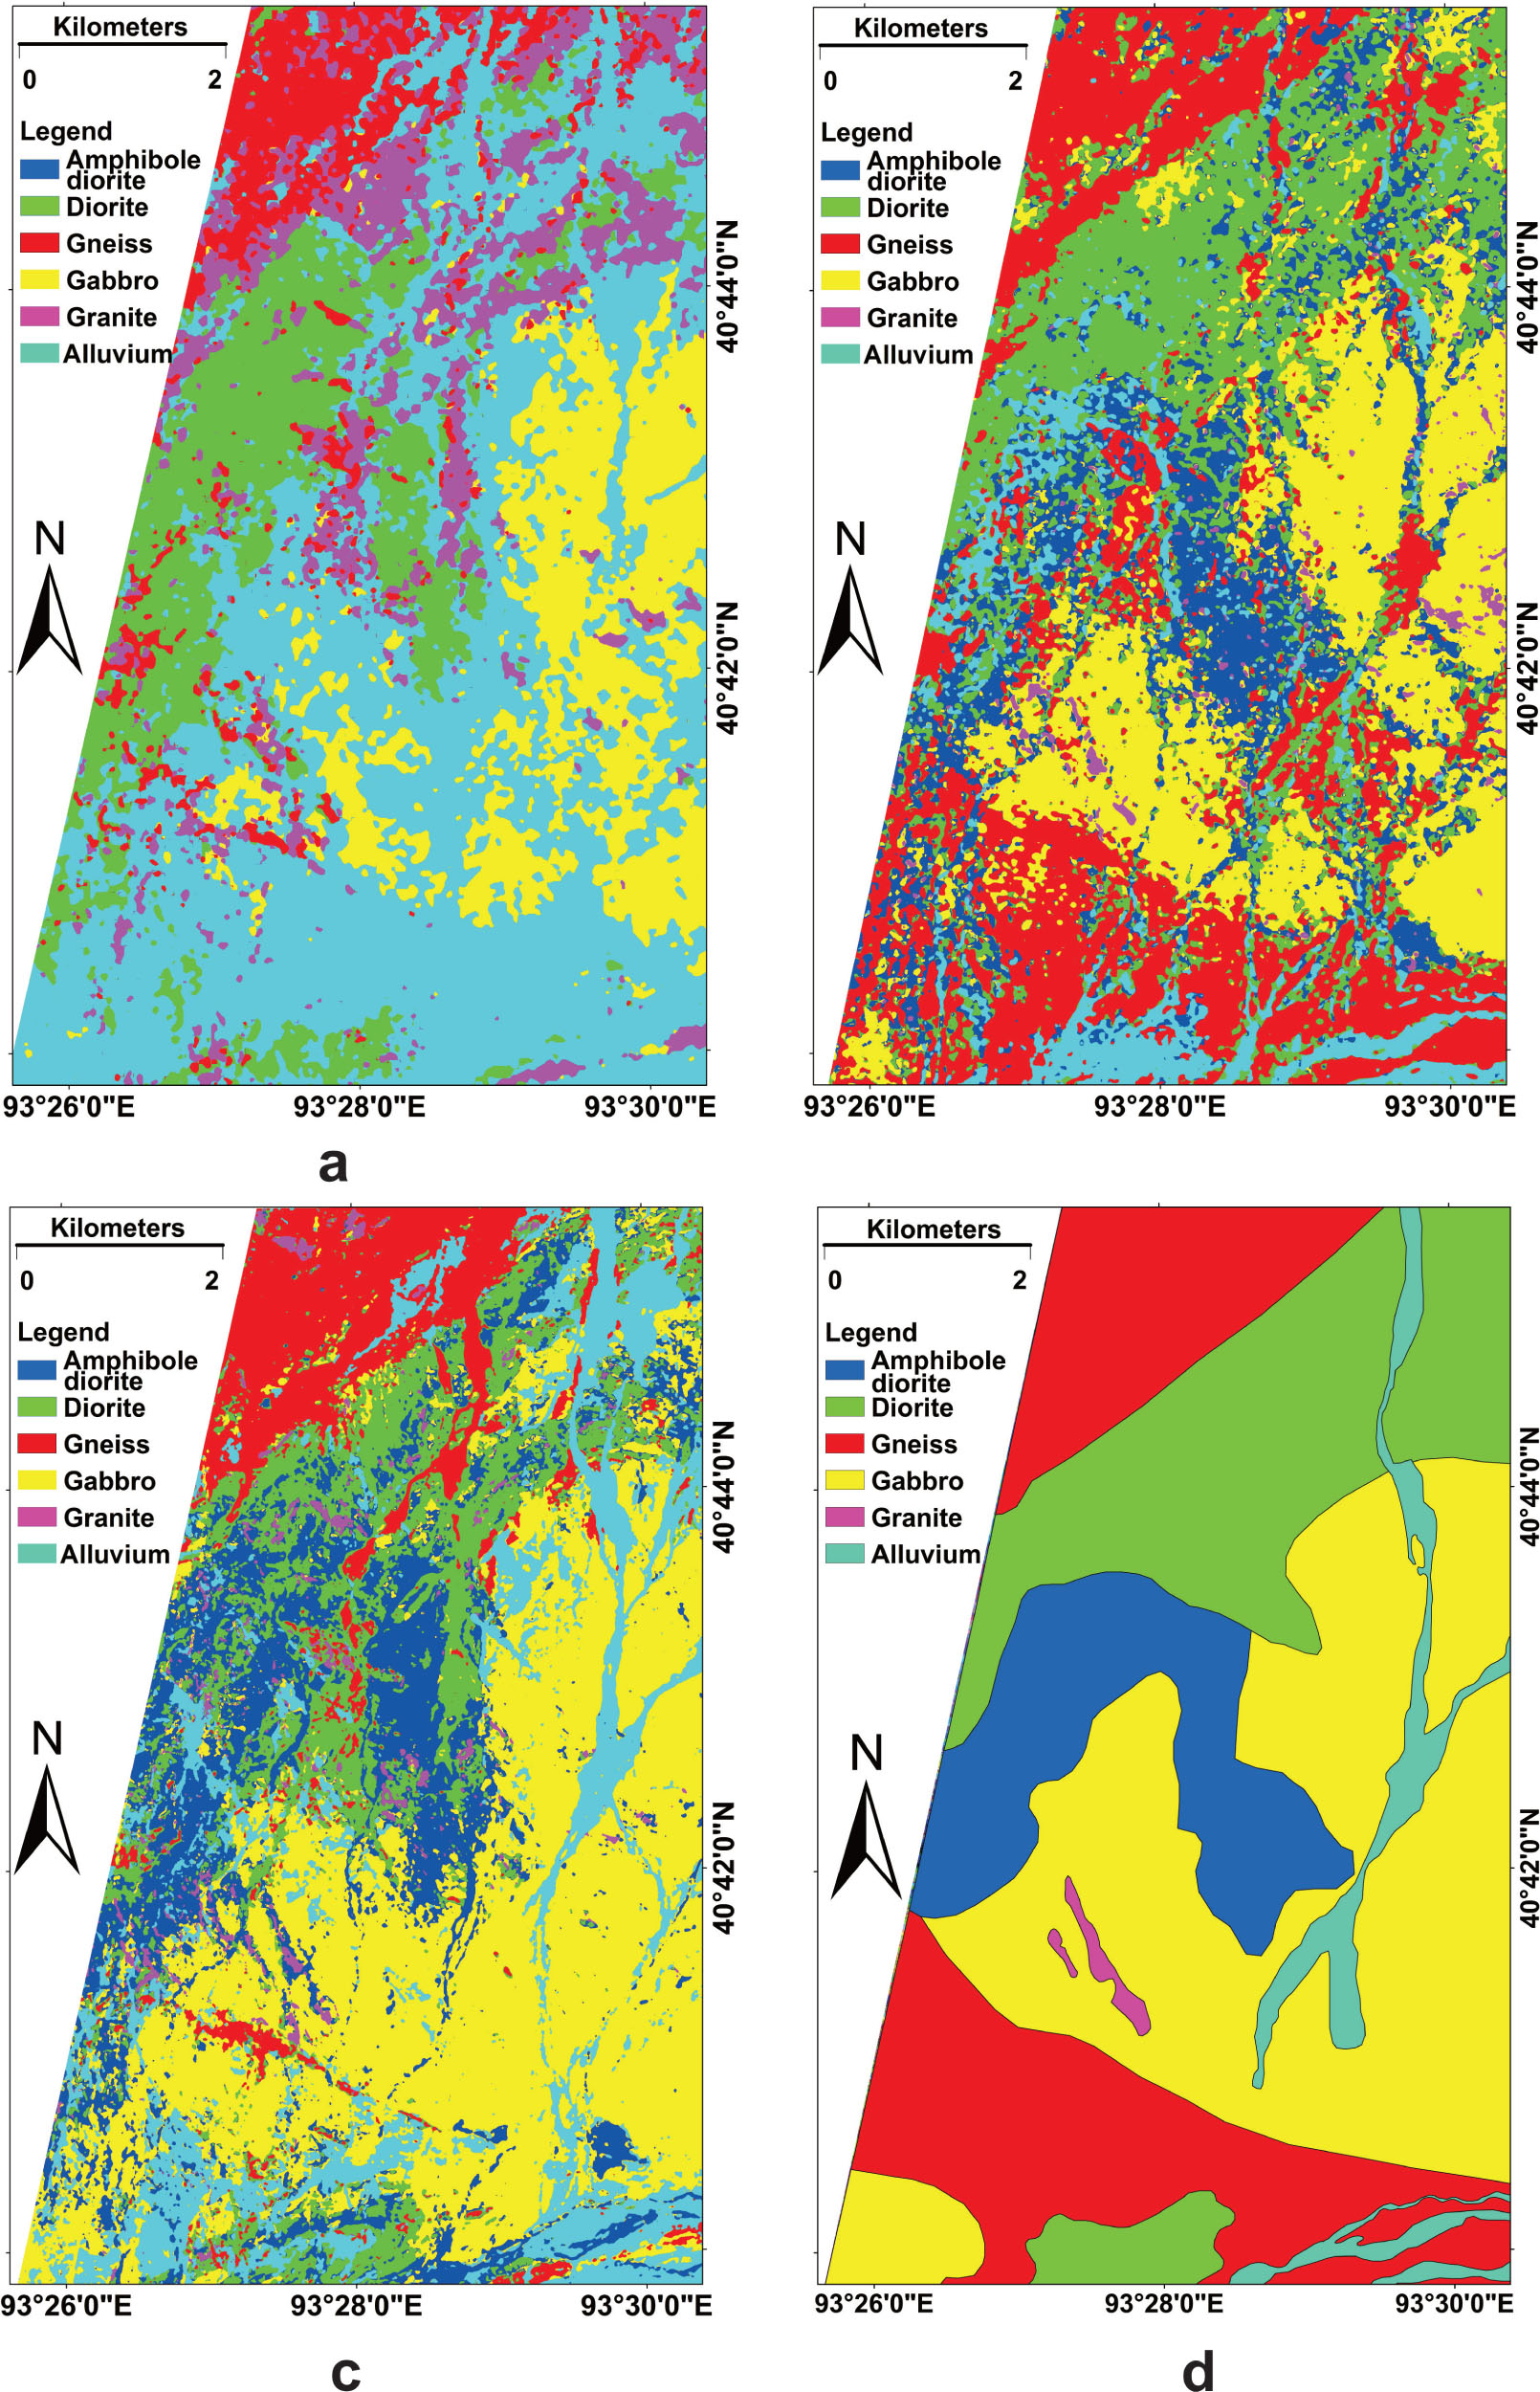
The classification results of the three kinds of data using SVM method (a. the ASTER data, b. the fusion data, c. the WV-3 data, d. the pre-existing geological map)
4.3 Classification Accuracy
The classification accuracy was quantitatively evaluated by test samples via a confusion matrix and the overall accuracy. The overall accuracy of WV-3 data classification was 67.88% (Table 3). The accuracies of three kinds of lithological units including diorite, gabbro and alluvium were over 60%, whereas hornblende diorite and granite reached relatively lower accuracies: 26.94% and 31.94 respectively. The overall accuracy of the fusion data mapping result was 52.84% (Table 2). The accuracies of alluvium, gneiss and diorite were 79.9%, 61.8% and 57.17% respectively and the accuracies of other lithological units were generally over 40%. Although the accuracy of the fusion data were slightly lower than that of the WV-3 data, the classification result may still valuable in regional geological mapping. Moreover, the financial cost of the fusion data is affirmatively lower than the WV-3 data. The overall accuracy of the ASTER data were the lowest at 46.10% (Table 1). The accuracies of gabbro, gneiss and alluvium were 62.01%, 57.67% and 53.09. The diorite and hornblende diorite were hard to discriminate using the ASTER data because they both shown light green color on ASTER PCA false color component image in Figure 5a.
The confusion matrix on the ASTER image based on the geological map of the study area
| Class | Gneiss | Diorite | Granite | Gabbro | Alluvium | Hornblende diorite | Total |
|---|---|---|---|---|---|---|---|
| Gneiss | 57.67 | 12.68 | 25.71 | 15.42 | 0.09 | 13.29 | 18.8 |
| Diorite | 20.55 | 28.96 | 41.39 | 13.15 | 36.22 | 68.35 | 23.6 |
| Granite | 8.18 | 4.33 | 0.98 | 3.45 | 0 | 3.99 | 4.21 |
| Gabbro | 3.87 | 43.99 | 26.11 | 62.01 | 10.6 | 7.31 | 45.3 |
| Alluvium | 9.73 | 10.03 | 5.81 | 5.97 | 53.09 | 7.06 | 8.1 |
| Total | 100 | 100 | 100 | 100 | 100 | 100 | 100 |
Overall Accuracy = 46.10%
The confusion matrix on the fusion data based on the geological map of the study area
| Class | Gneiss | Diorite | Hornblende diorite | Gabbro | Granite | Alluvium | Total |
|---|---|---|---|---|---|---|---|
| Gneiss | 61.8 | 7.58 | 7.4 | 15.95 | 2.71 | 9.87 | 21.4 |
| Diorite | 13.35 | 57.17 | 16.98 | 11.56 | 1.23 | 6.25 | 22.3 |
| Hornblende diorite | 8.81 | 20.53 | 48.07 | 14.87 | 10.29 | 4 | 18.5 |
| Gabbro | 3.42 | 8.14 | 7.89 | 48.1 | 45.32 | 0 | 26.3 |
| Granite | 0.48 | 1.28 | 8.76 | 2.51 | 40.45 | 0 | 2.74 |
| Alluvium | 12.14 | 5.3 | 10.89 | 7 | 0 | 79.9 | 8.74 |
| Total | 100 | 100 | 100 | 100 | 100 | 100 | 100 |
Overall Accuracy = 52.87%
The confusion matrix on the WV-3 image based on the geological map of the study area
| Class | Gneiss | Diorite | Hornblende diorite | Gabbro | Granite | Alluvium | Total |
|---|---|---|---|---|---|---|---|
| Gneiss | 45.07 | 7.46 | 0.28 | 0.58 | 0 | 3.99 | 8.8 |
| Diorite | 19.5 | 60.75 | 52.02 | 4.09 | 15.47 | 1.75 | 25 |
| Hornblende diorite | 2.19 | 8.57 | 26.94 | 1.95 | 7.56 | 2.92 | 5.69 |
| Gabbro | 12.36 | 11.17 | 7.01 | 85.5 | 45.03 | 16.8 | 45.1 |
| Granite | 0.83 | 2.79 | 11.32 | 0.31 | 31.94 | 0.03 | 2.07 |
| Alluvium | 20.06 | 9.27 | 2.44 | 7.57 | 0 | 74.5 | 13.3 |
| Total | 100 | 100 | 100 | 100 | 100 | 100 | 100 |
Overall Accuracy = 67.88%
A comparison between the accuracies of confusion matrixes showed that the WV-3 sensor gave the best results followed by the fusion data and the ASTER sensor, especially in distinguishing the gabbro, alluvium, diorite and gneiss. The high accuracies of the WV-3 results is mainly due to the high spectral and spatial resolution as well as the perfect signal to noise performance. Although the results of the fusion data are between WV-3 and ASTER data, the accuracies of the six lithological units are all over 40%. The classification result could provide a satisfactory quality in large scale lithological mapping. The result mapped by the ASTER data gave the poorest accuracy and it may be more suitable in a regional mapping.
5 Discussions
According to the classification results, the overall classification effect of the WV-3 data was slightly better than that of the fusion data. It is no doubt due to its finer spectral and spatial resolution. The fusion data could also show a satisfactory result in lithological mapping at large scale.
Some available studies have shown efficient results to use Gram-Schmitt Pan Sharpening method in fusion data producing, land cover mapping and iron alteration extraction [38, 42, 43, 56]. Vaiopoulos and Karantzalos in 2016 have detailedly described the high spectral fidelity between the fusion data (fused by the VNIR and SWIR data of Sentinel-2) and the raw multispectral data even though the SWIR data do not overlap spectrally with the high spatial resolution VNIR bands [57]. The spectral features of different rock units are influenced by atmospheric effects, mineral component of the rocks, vegetation cover, soil cover, and the spatial and spectral resolution of the image. Even though, the spectral curve of the same rock collected from remote sensing images could be significantly different from the laboratory spectra [58]. This discrepancy significantly due to the water content in the natural samples. Moreover, the main rock-forming minerals including quartz and feldspar show limited absorption features in VNIR and SWIR regions and most of the spectral features are caused by altered or weathered minerals [59]. However, the diagnostic absorptions could be identified from certain bands. In order to examine the imagery spectral features, the average spectra of different rock units were obtained from the three kinds of images according to the pre-existing geological map (Figure 8).
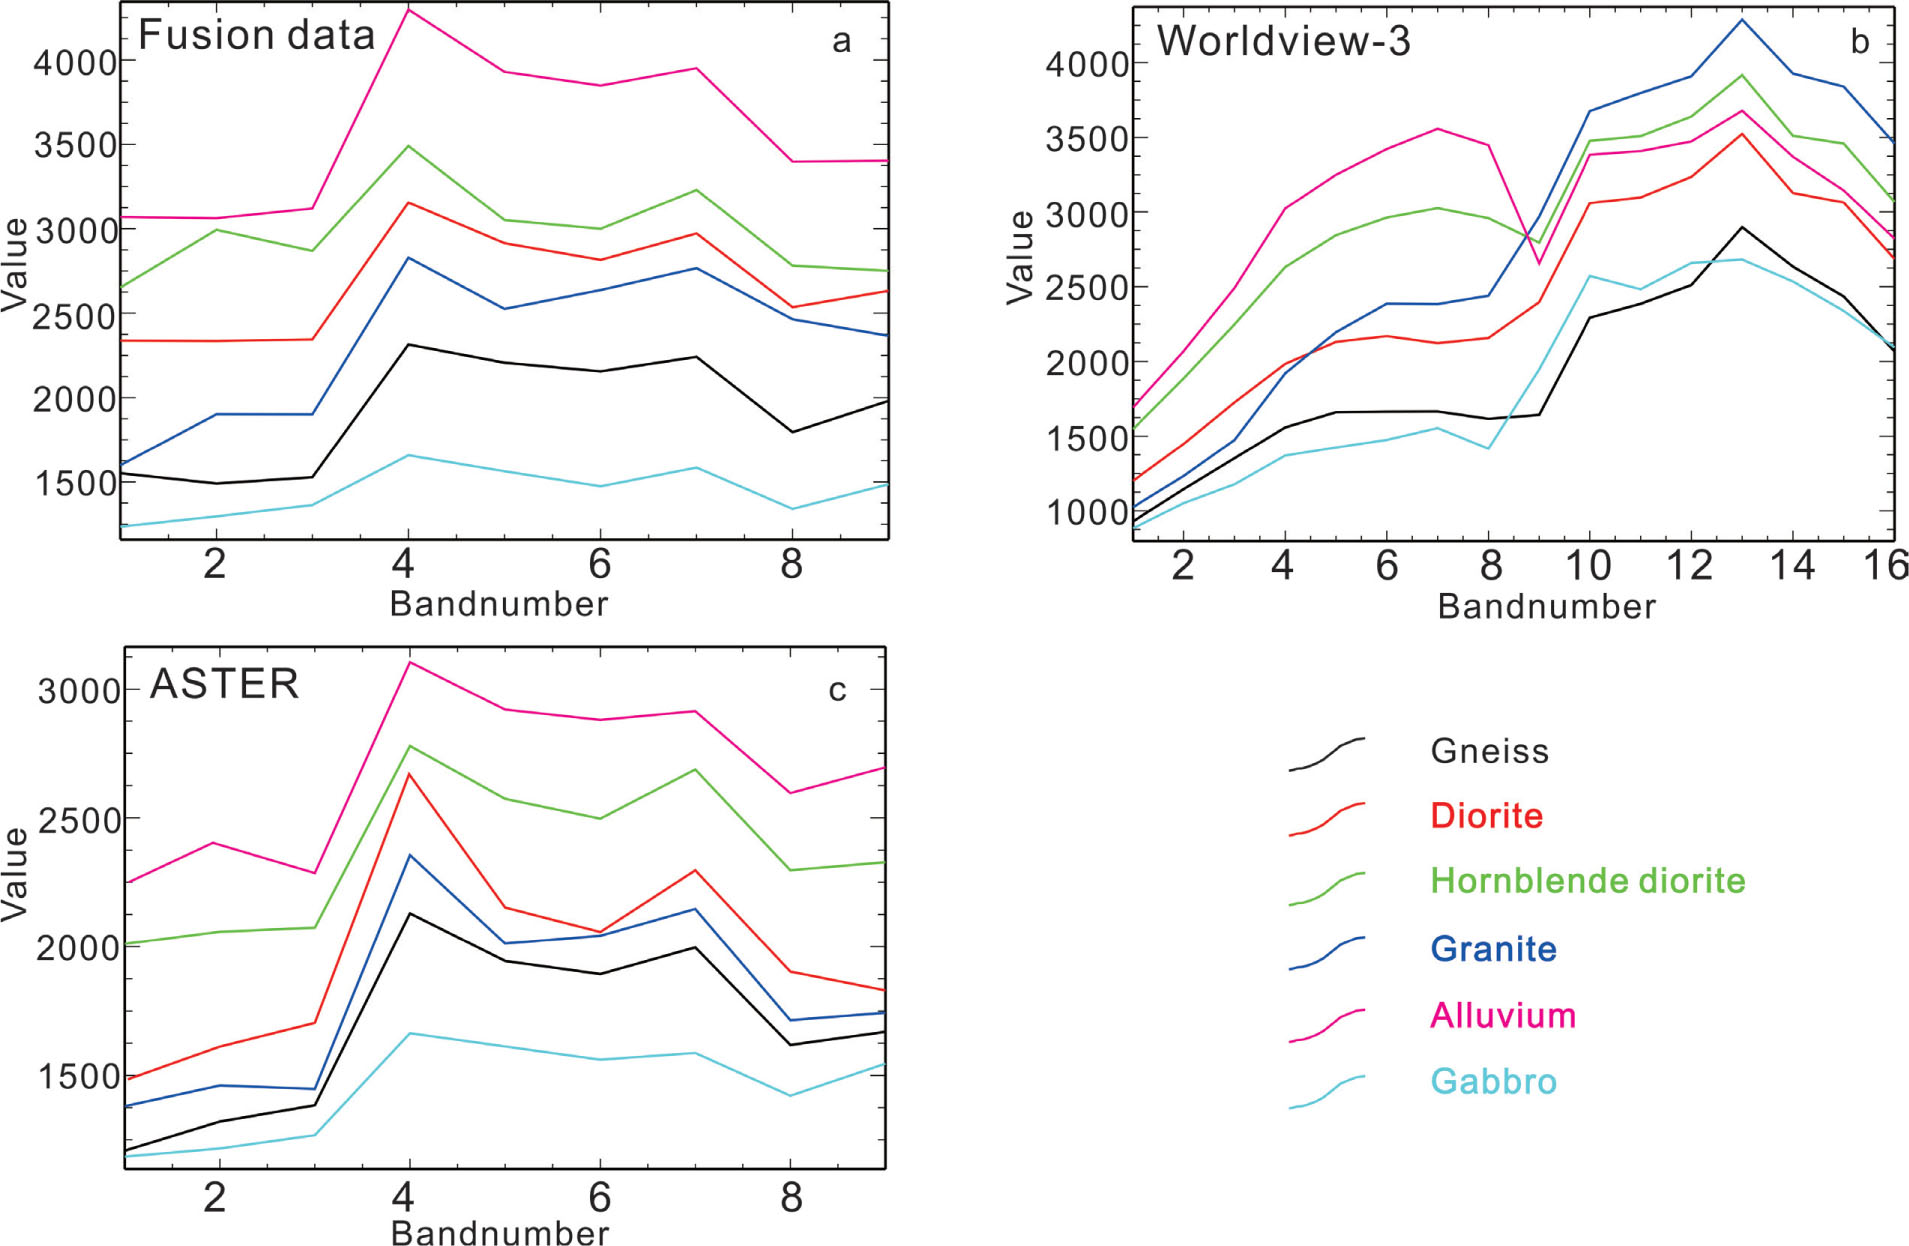
The spectral curves of different rocks gathered from the fusion data, WV-3 data and ASTER data. (a. The spectral curves from the fusion data, b. The spectral curves from the WV-3 data, c. The spectral curves from the ASTER data)
Obviously in Figure 8a and 8c, the spectra of the same lithological unit collected from both the fusion data and the ASTER data were quite similar. From Figure 8a, the spectra of the six different lithological units gathered from the fusion data were also analogous in shape with two high reflectance at band 4 and band 7. The main differences were shown in band 1, band 2, band 5, band 6 and band 9. Comparing to Figure 8a, the Figure 8c showed the spectra of different rocks in the raw ASTER image, and only band 5, band 6 and band 9 reflected obvious features, whereas other bands were quite similar. Especially, the diorite and the hornblende diorite showed parallel spectral curves in the ASTER data and they occurred different in shape on band 2 and band 5 in the fusion data. This may be the reason why the fusion data could discriminated the two types of rock but the ASTER data failed.
In the VNIR bands (band 1 to band 8) of the WV-3 images (Figure 8b), the spectra are also quite similar in shape. In the SWIR bands (band 9 to band 16), the spectral curves of different rock units are significantly different in shape. Especially, band 9 showed prominent features of different rocks whereas band 14 showed weak features. These bands may make a great contribution on distinguishing variety of rock types.
From Figure 6b and 6c, the gabbro dykes could high lightened by the PCA false color image of the fusion data and the WV-3 data. But the ASTER PCA false color image could not figure out the gabbro dykes due to the poor spatial resolution (Figure 6a). This phenomenon surely indicated the significant resolution contribution of Chinese GF-1 PAN data in interpreting small veins.
The accuracy of each individual rock unit is a significant factor for assessing the new fusion data. As is shown in Table 1 to Table 3, the mapping results of the four kinds of wide spread rock units including gneiss, diorite, gabbro and alluvium have given relatively high accuracies. The gneiss and the alluvium discriminated by the fusion data reached the highest score (61.8% and 79.9%) among the three kinds of data. And the diorite and the gabbro identified by the WV-3 data gave the best result of 60.75% and 85.5%. The distinguishing accuracies of the granite using the three data were relatively low with scores not exceeding 41%. This may be due to the sporadic distribution of the granite veins, and other main rock units may negatively influence the spectral response of the granite. In addition, some of the granite veins are much smaller in width (5-10 m) than the pixel size of ASTER (30 m), and the spectral information of the pixels in fusion data could not exceed the ASTER data. So the target distribution and the data information quantity both exits influence on the recognition results of the granite vein. Despite of the small disadvantage of the fusion data on the overall accuracy, the mapping result of the WV-3 could be replaced by that of the fusion data in some large scale lithological mapping. In this study the WV-3 data cost nearly 5,000 dollars whereas the ASTER data and the GF-1 PAN data were freely provided by the USGS and the CRESDA. This new fusion data may provide an efficient, low cost approach in assisting geological mapping in some inaccessible regions with low vegetation cover.
The samples of the different rock units gathered on the images also plays an important role in the classification. Selecting the training samples according to the preexisting geological map in the artificial interpretation included some uncertainty. Test samples were selected empirically by geologists, so the samples of the same rock may lead to different results. Samples in this research were selected carefully by the geologists who mapped the pre-existing geological map. So the lithological samples were more reliable than the selection work only based on imagery. Simultaneously, because of the spatial resolution discrepancy of the three data, the lithological distribution appeared not congruous. Additionally, unavoidable errors of the classification work caused by acquisition time, field of view, surface weathering and sub-pixel spectral mixing may have significant impact on the mapping accuracy. The fusion data may alter the spectral features of the raw ASTER data, and is not very suitable for laboratory spectral based mapping methods including Spectral Angle Mapper (SAM) and MF (Matched Filtering).
6 Conclusions
This study conducted lithological mapping using the new integrated data (fused by Chinese GF-1 PAN and the ASTER data) and a SVM method, and compared with the lithological classification maps of ASTER and WV-3 data for the first time. The classification accuracies of the three kinds of data were estimated. The results showed the mapping accuracy of the fusion data was 6.77% higher than the ASTER data and 15.01% lower than the WV-3 data, because the spectral and spatial resolution of the fusion data are between that of the WV-3 data and the ASTER data. Concerning the high cost of WV-3 data, this new fusion data had an important advantages in visual interpretation and supervised classification. The high spatial resolution of the fusion data contributed by the GF-1 PAN data could make the small gabbro dykes available on the screen. Moreover, SVM method is also useful for the fusion data. This fusion data may open a new realm of remote sensing image analysis for lithological mapping and alteration extraction.
Acknowledgement
The study was supported by the National Natural Science Foundation of China (vote no. 41502312) and the China Geological Survey Foundation (vote no. DD20179607, DD20160336, DD20160009 and DD20160002). The authors are thankful to the China Center for Resources Satellite Data and Application (CRESDA) and the United States Geological Survey (USGS) for providing the Chinese GF-1 data and the ASTER data.
References
[1] Rowan, L. C., Mars, J. C., “Lithologic mapping in the Mountain Pass, California area using Advances Spaceborne Thermal Emission and Reflection Radiometer (ASTER) data”, Remote Sens. Environ., 2003, 84, 350-366.10.1016/S0034-4257(02)00127-XSearch in Google Scholar
[2] Hellman, M. J., Ramsey, M. S., “Analysis of hot springs and associated deposits in Yellowstone National Park using ASTER and AVIRIS remote sensing”, J. Volcanol. Geoth. Res., 2004, 135, 195-219.10.1016/j.jvolgeores.2003.12.012Search in Google Scholar
[3] Qari, M. H. T., Madani, A. A., Matsah, M. I. M., Hamimi, Z., “Utilization of ASTER and Landsat data in geologic mapping of basement rocks of Arafat area, Saudi Arabia”, Arab. J. Sci. Eng., 2008, 33, 99-116.Search in Google Scholar
[4] Tangestani, M. H., Mazhari, N., Agar, B., Moor, F., “Evaluating Advances Spaceborne Thermal Emission and Reflection Radiometer (ASTER) data for alteration zone enhancement in a semi-arid area, northern Shahr-e-Babak, SE Iran”, Int. J. Remote Sens., 2008, 29, 2833-2850.10.1080/01431160701422239Search in Google Scholar
[5] Pastor, I. M., Pedreno, J. N., Koch, M., Gomez, I., “Applying imaging spectroscopy techniques to map saline soils with ASTER images”, Geoderma, 2010, 158, 55-65.10.1016/j.geoderma.2010.02.015Search in Google Scholar
[6] Pour, A.B., and Hashim, M., “Identification of hydrothermal alteration minerals for exploring of porphyry copper deposit using ASTER data, SE Iran”, J. Asian Earth Sci., 2011, 42, 1309–1323.10.1016/j.jseaes.2011.07.017Search in Google Scholar
[7] Pournamdari, M., Hashim, M., “Detection of chromite bearing mineralized zones in Abdasht ophiolite complex using ASTER and ETM+ remote sensing data”, Arab. J. Geosci., 2014, 7, 1-11.10.1007/s12517-013-0927-0Search in Google Scholar
[8] Sadeghi, B., Khalajmasoumi, M., Afzal, P., Moarefvand, P., Yasrebi, A. B., Wetherelt, A., Foster, P., Ziazarifi, A., “Using ETM+ and ASTER sensors to identify iron occurrences in the Esfordi 1:100,000 mapping sheet of Central Iran”, J. Afr. Earth Sci., 2013, 85, 103-114.10.1016/j.jafrearsci.2013.05.003Search in Google Scholar
[9] Adiri, Z., Harti, A.El., Jellouli, A., Maacha, L., Bachaoui, E.M., “Lithological mapping using Landsat 8 OLI and Terra ASTER multispectral data in the Bas Draa inlier, Moroccan Anti Atlas”, J. Appl. Remote Sens., 2016, 10, 1–14.10.1117/1.JRS.10.016005Search in Google Scholar
[10] Liu, L., Zhou, J., Han, L., Xu, X., “Mineral mapping and ore prospecting using Landsat TM and Hyperion data, Wushitala, Xinjiang, northwestern China”, Ore Geology Reviews, 2017, 81, 280-295.10.1016/j.oregeorev.2016.10.007Search in Google Scholar
[11] Arulbalaji, P., Balasubramanian, G., “Lithological mapping of Kanjamalai hill using hyperspectral remote sensing tools in Salem district Tamil Nadu, India”, J. Appl. Remote Sens., 2017, 11, 036027-1-03602.10.1117/1.JRS.11.036027Search in Google Scholar
[12] Liu L., Feng J., Han L., Zhou J., Xu X., Liu R. Mineral mapping using spaceborne Tiangong-1 hyperspectral imagery and ASTER data: A case study of alteration detection in support of regional geological survey at Jintanzi-Malianquan area, Beishan, Gansu Province, China. Geological Journal. 2018; 53(S2):372– 383. https://doi.org/10.1002/gj.32607-10.Search in Google Scholar
[13] Hao, P., Wang, L., Niu, Z., “Potential of multitemporal Gaofen-1 panchromatic/multispectral images for crop classification: case study in Xinjiang Uygur Autonomous Region, China”, J. Appl. Remote Sens., 2015, 9, 096035-1-096035-15.10.1117/1.JRS.9.096035Search in Google Scholar
[14] Li, J., Chen, X., Tian, L., Huang, J., Feng, L., “Improved capabilities of the Chinese high-resolution remote sensing satellite GF-1 for monitoring suspended particulate matter (SPM) in inland waters: Radiometric and spatial considerations”, ISPRS J. Photogramm., 2015, 106, 145-456.10.1016/j.isprsjprs.2015.05.009Search in Google Scholar
[15] Jia, K., Liang, S., Gu, X., Baret, F., Wei, X., Wang, X., Yao, Y., Yang, L., Li, Y., “Fractional vegetation cover estimation algorithm for Chinese GF-1 wide field wiew data”, Remote Sens. Environ., 2016, 177, 184-191.10.1016/j.rse.2016.02.019Search in Google Scholar
[16] Kruse, F. A., Perry, S. L., “Mineral mapping using simulated Worldview-3 short-wave-infrared imagery”, Remote Sensing, 2013, 5, 2688-2703.10.3390/rs5062688Search in Google Scholar
[17] Kruse, F. A., Baugh, W. M., Perry, S. L., “Validation of Digital-Globe WorldView-3 Earth imaging satellite shortwave infrared bands for mineral mapping”, J. Appl. Remote Sens., 2015, 9, 096044-1-096044-17.10.1117/1.JRS.9.096044Search in Google Scholar
[18] Alonzo, M., Bookhagen, B. and Roberts, D.A. Urban tree species mapping using hyperspectral and lidar data fusion. Remote Sensing of Environment, 2014, 148: 70-83.10.1016/j.rse.2014.03.018Search in Google Scholar
[19] Ye, B., Tian, S., Ge, j., Sun, Y., “Assessment of WorldView-3 data for lithological mapping”, Remote Sensing, 2017, 9, 1-19.10.3390/rs9111132Search in Google Scholar
[20] Crowley, J.K. Mapping playa evaporite minerals with AVIRIS data: A first report from Death Valley, California. Remote Sens. Environ. 1993, 44, 337–356.10.1016/0034-4257(93)90025-SSearch in Google Scholar
[21] Kruse, F.A., Lefkoff, A.B., Dietz, J.B. Expert system-based mineral mappingin Northern Death-Valley, California Nevada, using the airborne visibleinfrared imaging spectrometer (Aviris). Remote Sens. Environ. 1993, 44, 309–336.Search in Google Scholar
[22] Van der Meer, F., Bakker, W. Cross correlogram spectral matching:application to surface mineralogical mapping by using AVIRIS data fromCuprite, Nevada. Remote Sens. Environ. 1997, 61, 371–382.10.1016/S0034-4257(97)00047-3Search in Google Scholar
[23] Kereszturi, G., Schaefer, L.N., Schleiffarth, W.K., Procter, J., Pullanagari, R.R., Mead, S. and Kennedy, B. Integrating airborne hyperspectral imagery and LiDAR for volcano mapping and monitoring through image classification. International Journal of Applied Earth Observation and Geoinformation, 2018, 73:323-339.10.1016/j.jag.2018.07.006Search in Google Scholar
[24] Feng, J., Rogge, D. and Rivard, B. Comparison of lithological mapping results from airborne hyperspectral VNIR-SWIR, LWIR and combined data. International Journal of Applied Earth Observation and Geoinformation, 2018, 64: 340-353.10.1016/j.jag.2017.03.003Search in Google Scholar
[25] Rogge, D., Rivard, B., Segl, K., Grant, B., Feng, J. Mapping of NiCu-PGE orehosting ultramafic rocks using airborne and simulated EnMAP hyperspectralimagery Nunavik, Canada. Remote Sens. Environ. 2014, 152, 302–317.10.1016/j.rse.2014.06.024Search in Google Scholar
[26] Kruse, F.A., Boardman, J.W. and Huntington, J.F. Comparison of airborne hyperspectral data and EO-1 Hyperion for mineral mapping. IEEE Transactions on Geoscience and Remote Sensing, 2003, 41(6): 1388-1400.10.1109/TGRS.2003.812908Search in Google Scholar
[27] Liu, L., Zhou, J., Jiang, D., Zhuang, D.F., Mansaray, L.R., Hu, Z.J., Ji, Z.B. Mineralresources prospecting by synthetic application of TM/ETM plus, Quickbird andHyperion data in the Hatu area, West Junggar, Xinjiang, China. Sci. 2016, Rep-UK 6.10.1038/srep21851Search in Google Scholar PubMed PubMed Central
[28] Liu, L., Zhou, J., Han, L., Xu, X.L. Mineral mapping and ore prospecting usingLandsat TM and Hyperion. data Wushitala, Xinjiang, northwestern China. OreGeol. Rev. 2017, 81, 280–295.Search in Google Scholar
[29] Liu, L., Feng, J., Rivard, B., Xu, X., Zhou, J., Han, L., Yang, J. and Ren, G. Mapping alteration using imagery from the Tiangong-1 hyperspectral spaceborne system: Example for the Jintanzi gold province, China. International Journal of Applied Earth Observation and Geoinformation, 2018, 64: 275-286.10.1016/j.jag.2017.03.013Search in Google Scholar
[30] Zhang, X., Pazner, M. Comparison of lithologic mapping with ASTER, hyperion, and ETM data in the southeastern Chocolate Mountains, USA. Photogrammetric Engineering & Remote Sensing, 2005, 73 (5), 555-561.10.14358/PERS.73.5.555Search in Google Scholar
[31] Chatterjee, R. S., Prabakaran, B., Jha, V. K. Fusion of surface relief data with high spectral and spatial resolution satellite remote sensor data for deciphering geological information in a mature topographic terrain, International Journal of Remote Sensing, 2003, 24(23), 4761-4775, 10.1080/0143116031000070472.Search in Google Scholar
[32] Pal, S. K., Majumdar, T. J., Bhattacharya, A. K. ERS-2 SAR and IRS-1C LISS III data fusion: A PCA approach to improve remote sensing based geological interpretation, ISPRS Journal of Photogrammetry & Remote Sensing, 2007, 61, 281-297.10.1016/j.isprsjprs.2006.10.001Search in Google Scholar
[33] Saadi, N. M. and Watanabe, K. Assessing image processing techniques for geological mapping: a case study in Eljufra, Libya, Geocarto International, 2009, 24(3), 241-253, 10.1080/10106040802556199.Search in Google Scholar
[34] Grebby, S., Naden, J., Cunningham, D., Tansey, K. Integrating airborne multispectral imagery and airborne LiDAR data for enhanced lithological mapping in vegetated terrain. Remote Sensing of Environment, 2011, 115(1), 214-226.10.1016/j.rse.2010.08.019Search in Google Scholar
[35] Zawadzki, J., Cieszewski, C.J., Zasada, M. and Lowe, R.C. Applying geostatistics for investigations of forest ecosystems using remote sensing imagery. Silva Fenica. 2005, 39(4):599-617.10.14214/sf.369Search in Google Scholar
[36] Sadek, M. F., Hassan, S. M. Application of Egyptsat-1 and Landsat-ETM Data Fusion in Discrimination of Volcanic and Granitic Gocks at Gabal Gharib Area, Northeastern Egypt. Australian Journal of Basice and Applied Sciences, 2012, 6(13), 471-480.Search in Google Scholar
[37] Pour, A. B., Hashim, M. Integrating PALSAR and ASTER data for mineral deposits exploration in tropical environments: a case study from Central Belt, Peninsular Malaysia. International Journal of Image and Data Fusion, 2015, 6, 170-188.10.1080/19479832.2014.985619Search in Google Scholar
[38] Wang, S., Xing, L., Zhong, B., Yang, A., Zhang, F., Liang, M., “Extraction of Iron Stained Alteration Information based on Landsat 8 OLI and GF-1 PMS Data” Remote Sensing Technology and Application, 2016, 31, 950-957.Search in Google Scholar
[39] Mao, J., Goldfarb, R. J., Wang, Y., Hart, C. J., Wang, Z., Yang, J., “Late Paleozoic base and precious metal deposits, East Tianshan, Xinjiang, China: Characteristics and geodynamic setting”, Episodes, 2005, 28, 23-36.10.18814/epiiugs/2005/v28i1/003Search in Google Scholar
[40] Fu, H., Cao, G., “The geochemistry characteristics and prediction in Beishan area of Xinjiang”, Journal of Guilin Institute of Technology, 2001, 21, 201-206.Search in Google Scholar
[41] Laben, C. A., Brower, B. V., “Process for Enhancing the Spatial Resolution of Multispectral Imagery using Pan-Sharpening”, U.S. Patent, 2000, 6, 875.Search in Google Scholar
[42] Maurer, T., “How to Pan-Sharpen images using the Gram-Schmidt Pan-Sharpen method-a recipe”, International Archives of the Photogrammetry Remote Sensing and Spatial Information Sciences, ISPRS Hannover Workshop, 2013, XL-1/W1, 239-244.10.5194/isprsarchives-XL-1-W1-239-2013Search in Google Scholar
[43] Poonam, H. P., Shashi Dobhal, S. T., “Analyzing hyper-spectral and multi-spectral data fusion in spectral domain”, J. Indian Soc. Remote Sens., 2009, 37, 395-408.10.1007/s12524-009-0038-2Search in Google Scholar
[44] Hassan, S.M., and Ramadan, T.M., “Mapping of the late Neoproterozoic Basement rocks and detection of the gold-bearing alteration zones at Abu Marawat-Semna area, Eastern Desert, Egypt using remote sensing data”, Arab. J. Geosci., 2015, 8, 4641–4656.10.1007/s12517-014-1562-0Search in Google Scholar
[45] Singh S, Singh C, Kumar K, Gupta R, Mukherjee S. 2009. Spatialtemporal monitoring of groundwater using multivariate statistical techniques in Bareilly district of Uttar Pradesh, India. J Hydrol Hydromechanics. 57:45–54.10.2478/v10098-009-0005-1Search in Google Scholar
[46] Balázs B, Bíró T, Dyke Gareth, Singh SK, Szabó S. 2018. Extracting water-related features using reflectance data and principal component analysis of Landsat images. Hydrological Sciences Journal, 63(2), 269-284. https://doi.org/10.1080/02626667.2018.1425802.10.1080/02626667.2018.1425802Search in Google Scholar
[47] Singh SK, Basommi, BP, Mustak Sk, Srivastava PK, Szabo S. 2017. Modelling of land use land cover change using earth observation data-sets of Tons River Basin, Madhya Pradesh, India. Geocarto Int. 1-21. HYPERLINK http://dx.doi.org/10.1080/10106049.2017.1343390.10.1080/10106049.2017.1343390Search in Google Scholar
[48] Geranian, H., Tabatabaei, S. H., Asadi, H. H., Carranza, E. J. M., “Application of discriminant analysis and support vector machine in mapping gold potential areas for further drilling in the Sari-Gunay gold deposit, NW Iran”, Natural Resources Research, 2015, 1-15.10.1007/s11053-015-9271-2Search in Google Scholar
[49] Singh SK, Srivastava K, Gupta M, Thakur K, Mukherjee S. 2014. Appraisal of land use/land cover of mangrove forest ecosystem using support vector machine. Environ Earth Sci. 71:2245–2255.10.1007/s12665-013-2628-0Search in Google Scholar
[50] Lamine S, Petropoulos GP, Singh SK, Szabó S, Bachari NEI, Srivastava PK, Suman S. 2017. Quantifying land use/land cover spatio-temporal landscape pattern dynamics from Hyperion using SVMs classifier and FRAGSTATS ®. Geocarto Int. 33 (8): 862–878. https://doi.org/10.1080/10106049.2017.1307460.10.1080/10106049.2017.1307460Search in Google Scholar
[51] Srivastava PK, Yaduvanshi A, Singh SK, Islam T, Gupta M. 2016. Support vector machines and generalized linear models for quantifying soil dehydrogenase activity in agro-forestry system of mid altitude central Himalaya. Environ Earth Sci. 75:1–15.10.1007/s12665-015-5074-3Search in Google Scholar
[52] Lewis, H. G., Brown, M., “A generalized confusion matrix for assessing area estimates from remotely sensed data”, Int. J. Remote Sensing, 16(22), 2001, 3223-3235.10.1080/01431160152558332Search in Google Scholar
[53] Pour, A.B., and Hashim, M., “Identifying areas of high economic-potential copper mineralization using ASTER data in the Urumieh–Dokhtar Volcanic Belt, Iran”, Adv. Space Res., 2012, 49, 753–769.10.1016/j.asr.2011.11.028Search in Google Scholar
[54] Li, N., “Textural and rule-based lithological classification of remote sensing data, and geological mapping in Southwestern Prieska sub-basin, Transvaal Supergroup, South Africa”, Ph.D. thesis, University of Munich, Germany, 2010.10.1016/j.jafrearsci.2011.03.002Search in Google Scholar
[55] Xiong, Y., Khan, S.D., Mahmood, K., and Sisson, V.B., “Lithological mapping of Bela ophiolite with remote-sensing data”, Int.J. Remote Sens., 2011, 32, 4641–4658.10.1080/01431161.2010.489069Search in Google Scholar
[56] Zhang, N., Zhao, J., Zhang, L., “Comparison and evaluation on image fusion methods for GaoFen-1 imagery”, Proceedings of SPIE, 2016, 10157, V1-V5.10.1117/12.2246695Search in Google Scholar
[57] Vaiopoulos, A. D., Karantzalos, K., “Pan-Sharpening on the narrow VNIR and SWIR spectral bands of Sentinel-2”, The International Archives of the Photogrammetry Remote Sensing and Spatial Information Sciences, ISPRS Congress, 2016, XLI-B7, 723-730.10.5194/isprsarchives-XLI-B7-723-2016Search in Google Scholar
[58] Yu, L., Porwal, A., Holden, E. J., Dentith, M. C., “Towards automatic lithological classification from remote sensing data using support vector machines”, Comput. Gosci., 2012, 45, 229-239.10.1016/j.cageo.2011.11.019Search in Google Scholar
[59] Clark, R. N., Swayze, G. A., Livo, K. E., Kokaly, R. F., Sutley, S. J., Dalton, J. B., McDougal, R. R., Gent, C. A., “Imaging spectroscopy: Earth and planetary remote sensing with the USGS tetracorder and expert systems”, J. Geophys. Res. Planets, 2003, 108, 1-44.10.1029/2002JE001847Search in Google Scholar
© 2018 M. Yang et al., published by De Gruyter
This work is licensed under the Creative Commons Attribution-NonCommercial-NoDerivatives 4.0 License.
Articles in the same Issue
- Regular Articles
- Spatio-temporal monitoring of vegetation phenology in the dry sub-humid region of Nigeria using time series of AVHRR NDVI and TAMSAT datasets
- Water Quality, Sediment Characteristics and Benthic Status of the Razim-Sinoie Lagoon System, Romania
- Provenance analysis of the Late Triassic Yichuan Basin: constraints from zircon U-Pb geochronology
- Historical Delineation of Landscape Units Using Physical Geographic Characteristics and Land Use/Cover Change
- ‘Hardcastle Hollows’ in loess landforms: Closed depressions in aeolian landscapes – in a geoheritage context
- Geostatistical screening of flood events in the groundwater levels of the diverted inner delta of the Danube River: implications for river bed clogging
- Utilizing Integrated Prediction Error Filter Analysis (INPEFA) to divide base-level cycle of fan-deltas: A case study of the Triassic Baikouquan Formation in Mabei Slope Area, Mahu Depression, Junggar Basin, China
- Architecture and reservoir quality of low-permeable Eocene lacustrine turbidite sandstone from the Dongying Depression, East China
- Flow units classification for geostatisitical three-dimensional modeling of a non-marine sandstone reservoir: A case study from the Paleocene Funing Formation of the Gaoji Oilfield, east China
- Umbrisols at Lower Altitudes, Case Study from Borská lowland (Slovakia)
- Modelling habitats in karst landscape by integrating remote sensing and topography data
- Mineral Constituents and Kaolinite Crystallinity of the <2 μm Fraction of Cretaceous-Paleogene/Neogene Kaolins from Eastern Dahomey and Niger Delta Basins, Nigeria
- Construction of a dynamic arrival time coverage map for emergency medical services
- Characterizing Seismo-stratigraphic and Structural Framework of Late Cretaceous-Recent succession of offshore Indus Pakistan
- Geosite Assessment Using Three Different Methods; a Comparative Study of the Krupaja and the Žagubica Springs – Hydrological Heritage of Serbia
- Use of discriminated nondimensionalization in the search of universal solutions for 2-D rectangular and cylindrical consolidation problems
- Trying to underline geotourist profile of National park visitors: Case study of NP Fruška Gora, Serbia (Typology of potential geotourists at NP Fruška Gora)
- Fluid-rock interaction and dissolution of feldspar in the Upper Triassic Xujiahe tight sandstone, western Sichuan Basin, China
- Calcified microorganisms bloom in Furongian of the North China Platform: Evidence from Microbialitic-Bioherm in Qijiayu Section, Hebei
- Spatial predictive modeling of prehistoric sites in the Bohemian-Moravian Highlands based on graph similarity analysis
- Geotourism starts with accessible information: the Internet as a promotional tool for the georesources of Lower Silesia
- Models for evaluating craters morphology, relation of indentation hardness and uniaxial compressive strength via a flat-end indenter
- Geotourism in an urban space?
- The first loess map and related topics: contributions by twenty significant women loess scholars
- Modeling of stringer deformation and displacement in Ara salt after the end of salt tectonics
- A multi-criteria decision analysis with special reference to loess and archaeological sites in Serbia (Could geosciences and archaeology cohabitate?)
- Speleotourism in Slovenia: balancing between mass tourism and geoheritage protection
- Attractiveness of protected areas for geotourism purposes from the perspective of visitors: the example of Babiogórski National Park (Poland)
- Implementation of Heat Maps in Geographical Information System – Exploratory Study on Traffic Accident Data
- Mapping War Geoheritage: Recognising Geomorphological Traces of War
- Numerical limitations of the attainment of the orientation of geological planes
- Assessment of runoff nitrogen load reduction measures for agricultural catchments
- Awheel Along Europe’s Rivers: Geoarchaeological Trails for Cycling Geotourists
- Simulation of Carbon Isotope Excursion Events at the Permian-Triassic Boundary Based on GEOCARB
- Morphometry of lunette dunes in the Tirari Desert, South Australia
- Multi-spectral and Topographic Fusion for Automated Road Extraction
- Ground-motion prediction equation and site effect characterization for the central area of the Main Syncline, Upper Silesia Coal Basin, Poland
- Dilatancy as a measure of fracturing development in the process of rock damage
- Error-bounded and Number-bounded Approximate Spatial Query for Interactive Visualization
- The Significance of Megalithic Monuments in the Process of Place Identity Creation and in Tourism Development
- Analysis of landslide effects along a road located in the Carpathian flysch
- Lithological mapping of East Tianshan area using integrated data fused by Chinese GF-1 PAN and ASTER multi-spectral data
- Evaluating the CBM reservoirs using NMR logging data
- The trends in the main thalweg path of selected reaches of the Middle Vistula River, and their relationships to the geological structure of river channel zone
- Lithostratigraphic Classification Method Combining Optimal Texture Window Size Selection and Test Sample Purification Using Landsat 8 OLI Data
- Effect of the hydrothermal activity in the Lower Yangtze region on marine shale gas enrichment: A case study of Lower Cambrian and Upper Ordovician-Lower Silurian shales in Jiangye-1 well
- Modified flash flood potential index in order to estimate areas with predisposition to water accumulation
- Quantifying the scales of spatial variation in gravel beds using terrestrial and airborne laser scanning data
- The evaluation of geosites in the territory of National park „Kopaonik“(Serbia)
- Combining multi-proxy palaeoecology with natural and manipulative experiments — XLII International Moor Excursion to Northern Poland
- Dynamic Reclamation Methods for Subsidence Land in the Mining Area with High Underground Water Level
- Loess documentary sites and their potential for geotourism in Lower Silesia (Poland)
- Equipment selection based on two different fuzzy multi criteria decision making methods: Fuzzy TOPSIS and fuzzy VIKOR
- Land deformation associated with exploitation of groundwater in Changzhou City measured by COSMO-SkyMed and Sentinel-1A SAR data
- Gas Desorption of Low-Maturity Lacustrine Shales, Trassic Yanchang Formation, Ordos Basin, China
- Feasibility of applying viscous remanent magnetization (VRM) orientation in the study of palaeowind direction by loess magnetic fabric
- Sensitivity evaluation of Krakowiec clay based on time-dependent behavior
- Effect of limestone and dolomite tailings’ particle size on potentially toxic elements adsorption
- Diagenesis and rock properties of sandstones from the Stormberg Group, Karoo Supergroup in the Eastern Cape Province of South Africa
- Using cluster analysis methods for multivariate mapping of traffic accidents
- Geographic Process Modeling Based on Geographic Ontology
- Soil Disintegration Characteristics of Collapsed Walls and Influencing Factors in Southern China
- Evaluation of aquifer hydraulic characteristics using geoelectrical sounding, pumping and laboratory tests: A case study of Lokoja and Patti Formations, Southern Bida Basin, Nigeria
- Petrography, modal composition and tectonic provenance of some selected sandstones from the Molteno, Elliot and Clarens Formations, Karoo Supergroup, in the Eastern Cape Province, South Africa
- Deformation and Subsidence prediction on Surface of Yuzhou mined-out areas along Middle Route Project of South-to-North Water Diversion, China
- Abnormal open-hole natural gamma ray (GR) log in Baikouquan Formation of Xiazijie Fan-delta, Mahu Depression, Junggar Basin, China
- GIS based approach to analyze soil liquefaction and amplification: A case study in Eskisehir, Turkey
- Analysis of the Factors that Influence Diagenesis in the Terminal Fan Reservoir of Fuyu Oil Layer in the Southern Songliao Basin, Northeast China
- Gravity Structure around Mt. Pandan, Madiun, East Java, Indonesia and Its Relationship to 2016 Seismic Activity
- Simulation of cement raw material deposits using plurigaussian technique
- Application of the nanoindentation technique for the characterization of varved clay
- Verification of compressibility and consolidation parameters of varved clays from Radzymin (Central Poland) based on direct observations of settlements of road embankment
- An enthusiasm for loess: Leonard Horner in Bonn and Liu Tungsheng in Beijing
- Limit Support Pressure of Tunnel Face in Multi-Layer Soils Below River Considering Water Pressure
- Spatial-temporal variability of the fluctuation of water level in Poyang Lake basin, China
- Modeling of IDF curves for stormwater design in Makkah Al Mukarramah region, The Kingdom of Saudi Arabia