Mineral Constituents and Kaolinite Crystallinity of the <2 μm Fraction of Cretaceous-Paleogene/Neogene Kaolins from Eastern Dahomey and Niger Delta Basins, Nigeria
-
O.M. Oyebanjo
 ,
G.E. Ekosse
,
G.E. Ekosse

Abstract
This study examines the mineral composition and kaolinite crystallinity of Cretaceous and Paleogene/Neogene kaolins from Nigeria based on X-ray diffraction (XRD) and Fourier transform infrared (FTIR) spectroscopy data of the <2 μm fraction. The purpose of this was to assess the minerals present, structural order, and possible industrial applications of the kaolins. A total of twenty-eight (28) samples comprising of fifteen (15) Cretaceous and thirteen (13) Paleogene/Neogene kaolins were analysed. The XRD results showed that both the Cretaceous and Paleogene/Neogene kaolins have kaolinite as the dominant phase followed by quartz with anatase, hematite, and goethite occurring in minor quantities. Based on the mineralogical composition, the Paleogene/Neogene deposits were classified as sandy kaolin and the Cretaceous deposits were classified as pure kaolin. The kaolinite structural order for the Cretaceous pure kaolin was higher than that obtained for the Paleogene/Neogene sandy kaolin with more quartz, iron, and titanium oxides. The economic consideration of the deposits showed that the sandy kaolin type can be used in pigment industrial applications whereas the pure kaolin type can be used in refractory, fiberglass, and ceramic industrial applications.
1 Introduction
Kaolin minerals include kaolinite, dickite, nacrite, and halloysite, respectively. Kaolinite (Al2 Si2O5(OH)4) is the most common kaolin mineral with the theoretical chemical composition: 46.54% SiO2, 39.50% Al2O3, and 13.96% H2O [1]. Kaolinite has 1:1 ratio of tetrahedral and octahedral layers continuous in the z- and x- axes directions, respectively, and stacked above each other in the y-direction. Kaolinite is one of the most important industrial clay minerals useful to man with a wide range of applications as raw material in ceramics, paper filling and coating, refractory, fiberglass, cement, rubber and plastics, cosmetics, paint, catalyst, pharmaceutic and agriculture [2, 3] because of its relatively low cost and easy availability. Its application is a function of its physical and chemical characteristics in relation to requirements of the end user [1]. The physical and chemical properties of kaolinite are strongly influenced by its structural order [4]. Structural defects in the kaolinite crystal structure have been attributed to a large number of stacking faults that may appear during its formation and growth. The knowledge of variations in the kaolinite structure is important in assessing its correlation with plasticity, brightness, and viscosity [5]. In addition, the degree of defects in kaolinites for use in manufacturing of ceramics is linked to the mineralogical assemblage, structural order, and thermal stability of the material [6]. In view of its wide applications, the occurrence of kaolin is worth proper physico-chemical, mineralogical and chemical investigations.
The X-ray diffractometry (XRD) technique has been well used for mineralogical identifications and in the examination of the structural disorder or crystallinity of kaolinite based on XRD-derived crystallinity indices such as Hinckley indices [5, 7]. The Fourier transform infrared (FTIR) spectroscopy is an alternative method in the determination of kaolinite disorder degree based on differences in the position and relative intensity of OH stretching and bending bands in the IR spectrum [8]. Vaculikova [4] proposed two approaches in determining the degree of structural disorder of kaolinites from IR spectra, namely, empirical approach (IR-E) and numerical approach (IR-N). The IR-E is based on resolution and relative intensities of bands in OH stretching and bending region whereas IR-N is based on crystallinity indices (CI) calculated from the intensities selected vibration models and structural OH bands.
Most of the sedimentary kaolins in the world, geologically occur as Cretaceous and Paleogene/Neogene argillaceous sediments [9]. Ekosse [2] with this in mind advocated that kaolin exploration in Africa should be focused on investigating Cretaceous and Paleogene/Neogene argillaceous sediments. In Nigeria, many of the Cretaceous- Paleogene/Neogene kaolin deposits occur within the sedimentary basins which are believed to be filled with Cretaceous-Recent sediments except for some Paleogene/Neogene kaolin occurring within the Jos Plateau in areas underlain by the Younger Granites. Quite a number of the kaolin deposits in Nigeria with estimated reserve of three (3) billion tonnes have not been properly evaluated in detail for industrial purposes [10]. Nigeria is a mono-economic nation with petroleum contributing the largest percentage of her foreign exchange earnings and revenues. Considering the current dwindling of oil prices and the gradual reduction of its oil reserve, diversifying the economy of Nigeria therefore calls for systematic investigation and characterisation of the vast occurrence of kaolinitic clays [2, 11]. This paper seeks to assess the mineralogy and structural order of some potential kaolin deposits in Nigeria using both XRD and FTIR techniques. This is considered essential in boosting the nation’s economy.
2 Materials and Methods
2.1 Study Areas
Four Cretaceous-Paleogene/Neogene kaolin deposits in Nigeria were selected for this study, namely,
The Cretaceous Lakiri and Eruku kaolins occur within Ise Formation of the Abeokuta Group in the Eastern Dahomey Basin (Fig. 1). The Abeokuta Group has three formations, namely, Ise Formation (oldest), Afowo Formation, and Araromi Formation (youngest). The Ise Formation is a sequence of continental sands, grits and siltstones with a basal conglomerate overlying the Basement Complex. Interbedded kaolinitic clays occur up to metres in some places. Sporomorphs recovered from the shell-BP paleontologists including Cicatricosisporites sp. cf. C. mohrioides, Pilosisporites trichopapillosus, Klukisporites pseudoreticulatus, Aequitriradites aff. verucosus and Stapilinisporites caminus indicate an Early Cretaceous (probably Valanginian – Barremian) age for the formation [12].
![Figure 1 Geologic Map of Eastern Dahomey Basin showing the study areas [14].](/document/doi/10.1515/geo-2018-0012/asset/graphic/j_geo-2018-0012_fig_001.jpg) Figure 1
Figure 1Geologic Map of Eastern Dahomey Basin showing the study areas [14].
The Paleogene/Neogene Ubulu-Uku and Awo-Omama kaolins occur within the Ogwashi-Asaba Formation of Niger Delta Basin (Fig. 2). The Ogwashi-Asaba Formation consists of white, blue, and pink clays, cross-bedded sands, carbonaceous mudstones, shales and seams of lignite. The type locality is at Eke Mgbalimgba in Ogwashi-Asaba, Delta State but extends from Okitipupa Ridge through Onitsha, Ozubulu, Nnewi, Ikot Ekpene, Uyo, and Calabar where it is over-lapped by the Benin Formation. Ogwashi-Asaba Formation contains some plant remains, which indicate an Oligocene – Miocene age and a continental environment of deposition for it [13].
![Figure 2 Geologic Map of Niger Delta Basin showing the study areas [13].](/document/doi/10.1515/geo-2018-0012/asset/graphic/j_geo-2018-0012_fig_002.jpg)
Geologic Map of Niger Delta Basin showing the study areas [13].
2.2 Sampling
To avoid contaminations from recent weathering products or external leached materials, the outcrop faces were dug back to at least 60 cm to gain access to fresh surfaces before sampling. Twenty-eight (28) bulk representative kaolin samples composed of nine (9) from Eruku (EP), andsix (6) from Lakiri (LP) deposits at 2 m interval, respectively; six (6) from Awo-Omama (AL), seven (7) from Ubulu Uku (UL) deposits at 1 m interval, respectively (Fig. 3) were collected, stored in polythene bags carefully labeled, and transported to the laboratory for XRD and FTIR analyses.
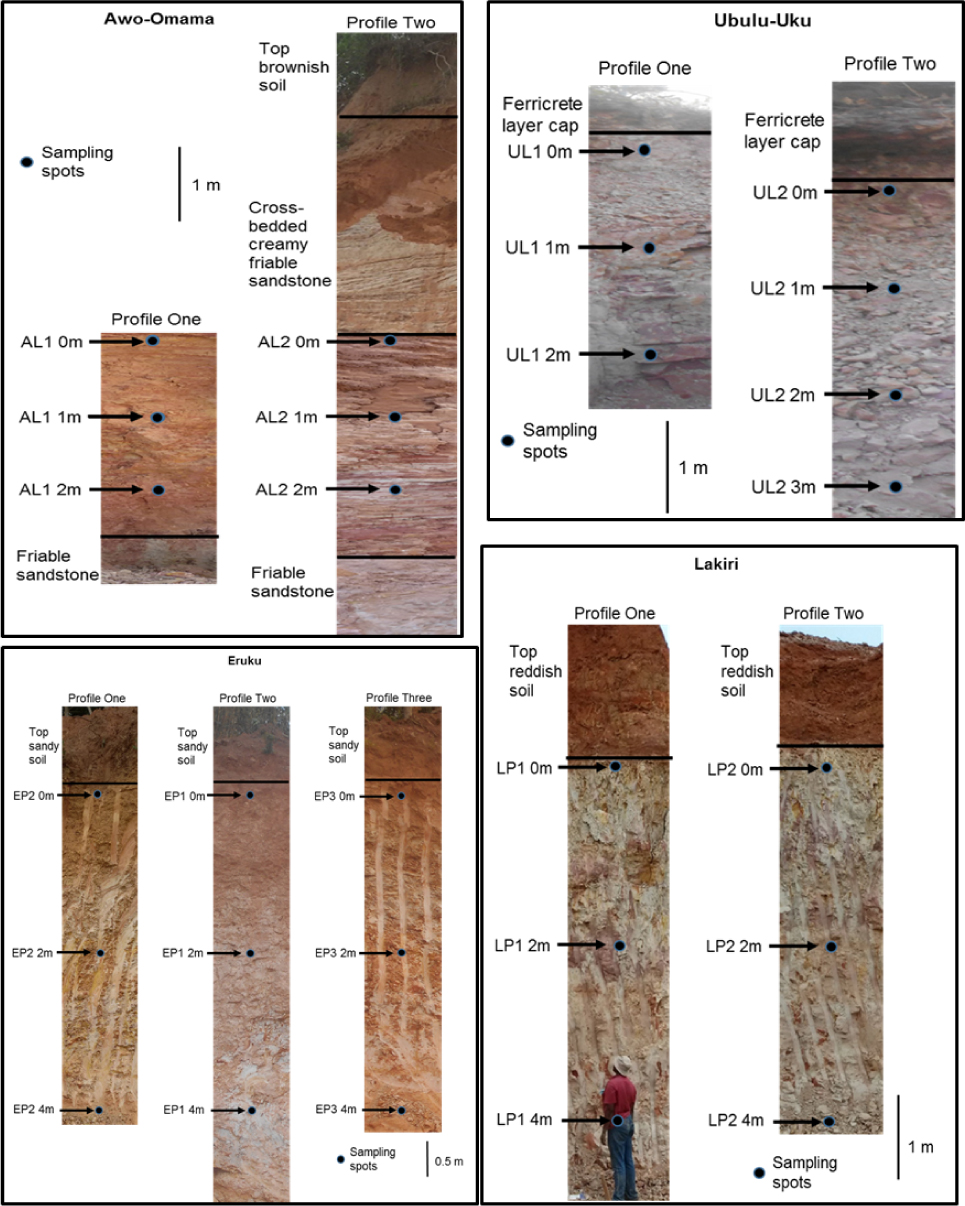
Vertical profiles showing sampling depths and lithologic units of the studied kaolin deposit.
2.3 Sample Preparation and Clay Fraction Analyses
The <2 μm fraction was obtained based on the principle of sedimentation according to Stoke’s law which allow individual spherical particles to fall freely at a steady velocity under the influence of gravity, resisted only by the viscous drag of the medium [15]. The mineralogy of the <2 μm fraction of the kaolins was determined by using the XRD method after the removal of organic matter [16]. In order not to alter the kaolinite crystallinity, the dried samples were gently crushed in an agate mortar to a fine texture [17]. The powder samples were scanned in the Bruker AXS D8 Advance PSD system which was operated at 40 kV and 40 mA, using a Cu-Kα radiation, graphite monochromator by taking recordings at step size of 0.02° 2θ scanned from 2 to 32° 2θ with a counting time of 2 s/step.
The mineral phases were identified using Bruker EVA software and compared with data and patterns available in the Mineral Powder Diffraction File [18] for confirmation. The relative phase amounts (weight %) were estimated using the Rietveld method. The infrared spectra (IR) were obtained using a Bruker Alpha Platinum-ATR spectrometer. To achieve high quality spectra, good contact between the sample and ATR crystal was ensured. The Bruker’s spectroscopy software OPUS allowed real time monitoring of the spectral quality after applying pressure on the sample. The IR peaks were reported based on % transmittance to given wavelengths. The crystallinity of <2 μm fraction of the studied kaolins was evaluated using the Hinckley Index (HI) [5, 19] from X-ray diffractogram, IR - empirical (IRE) and IR - numerical (IR-N) approaches [4] from IR spectra. The HI computation is illustrated in Fig. 4. Normal HI values ranges from <0.5 (disordered) to 1.5 (ordered) [5]. The IR-N approach is based on crystallinity indices CI1 and CI2 defined as CI1 = I(v1)/I(v3) and CI2 = I(v4)/I(v1) where I(v1) and I(v4) are intensities of OH stretching bands at 3691/3689 cm–1 and 3619 cm–1, respectively, and I(v3) is the intensity of OH bending band at 912 cm–1. The kaolinite structures are classified as poorly ordered, if CI1 <0.7 and CI2>1.2; partially ordered; if 0.7<CI1 <0.8 and 0.9<CI2 <1.2; and ordered, if CI1 <0.8 and CI2<0.9 [20, 21].
![Figure 4 Calculation of the HI from the ratio of the height above background of the 110 (A) and 111 (B) peaks above the band of overlapping peaks occurring between 20-23 ~ compared to the total height of the 110 above background (At). The abscissa is in terms of 2 theta and the ordinate is on a relative scale [7].](/document/doi/10.1515/geo-2018-0012/asset/graphic/j_geo-2018-0012_fig_004.jpg)
Calculation of the HI from the ratio of the height above background of the 110 (A) and 111 (B) peaks above the band of overlapping peaks occurring between 20-23 ~ compared to the total height of the 110 above background (At). The abscissa is in terms of 2 theta and the ordinate is on a relative scale [7].
3 Results and Discussion
3.1 X-ray Diffraction
The X-ray diffractograms for the <2 μm fraction were not significantly different, hence only one per deposit is presented for Awo-Omama, Ubulu-Uku, Eruku, and Lakiri deposits, respectively, (Figs 5 and 6). Tables 1 and 2 give the summary of mineral constituents contained in the different <2 μm fraction kaolin samples. Of all the minerals present, kaolinite alone constitutes between 67 – 91 % in the Paleogene/Neogene deposits and 87 – 99 % in the Cretaceous deposits. Quartz and anatase on the other hand, varies from 4 – 28 % and 1 – 6 % in Paleogene/Neogene deposits and 1 – 6 % and 1 – 8 % in Cretaceous deposits, respectively. Hematite and goethite were present in minor quantities. The Cretaceous deposits generally show less quartz contents and higher kaolinite contents compared to the Paleogene/Neogene deposits. The presence of anatase, hematite, and goethite coupled with the absence of pyrite and marcasite indicate that kaolin is associated with oxidizing depositional environment [22, 23]. The average kaolinite percentages obtained for the Paleogene/Neogene (82 %) were comparable to the value reported for Cretaceous Red Sea kaolins in Egypt (84 %) [24] whereas the 96 % average percentage for the Cretaceous deposits is comparable to those reported for the <5 μm fraction of Paleogene/Neogene Maoming kaolins (97%) in China [25], <4 μm fraction of Paleogene/Neogene Georgia kaolins (98%) in the USA and Cretaceous Poveda kaolins in Spain [5]. A plot of the average percentages of minerals present in each of the deposits on the ternary diagram for general mineralogical classification of economic kaolin deposits categorised the deposits into kaolin types (Fig. 7). The Paleogene/Neogene Awo-Omama and Ubulu-Uku deposits plotted in the region of sandy kaolin whereas the Cretaceous Eruku and Lakiri deposits plotted in the region of pure kaolin show a decrease in quartz content with age.
Mineral constituents and HI of the <2 μm fraction of the kaolin from Awo-Omama and Ubulu-Uku Paleogene/Neogene kaolin deposits.
| Sample ID | Kaolinite % | Quartz % | Anatase % | Hematite % | Goethite % | HI | |
|---|---|---|---|---|---|---|---|
| CF AL1 0m | 91 | 4 | 3 | 2 | - | 0.28 | |
| CF AL11m | 68 | 27 | 5 | - | - | 0.30 | |
| CF AL1 2m | 75 | 20 | 5 | - | - | 0.41 | |
| CF AL2 0m | 89 | 4 | 6 | 1 | - | 0.29 | |
| CF AL2 1m | 79 | 15 | 6 | - | - | 0.28 | |
| CF AL2 2m | 90 | 5 | 5 | - | - | 0.27 | |
| CF UL1 0m | 67 | 28 | 3 | - | 2 | 0.58 | |
| CF UL11m | 76 | 20 | - | - | 4 | 1 | |
| CF UL1 2m | 90 | 10 | - | - | - | 1.05 | |
| CF UL2 0m | 74 | 24 | 1 | - | 1 | 0.68 | |
| CF UL2 1m | 84 | 15 | - | - | 1 | 0.92 | |
| CF UL2 2m | 90 | 9 | 1 | - | - | 1.36 | |
| CF UL2 3m | 88 | 11 | - | - | 1 | 1.17 | |
| Average | 82 | 15 | 4 | 1 | 2 | 0.61 | |
| Max | 91 | 28 | 6 | 2 | 4 | 1.36 | |
| Min | 67 | 4 | 1 | 1 | 1 | 0.27 |
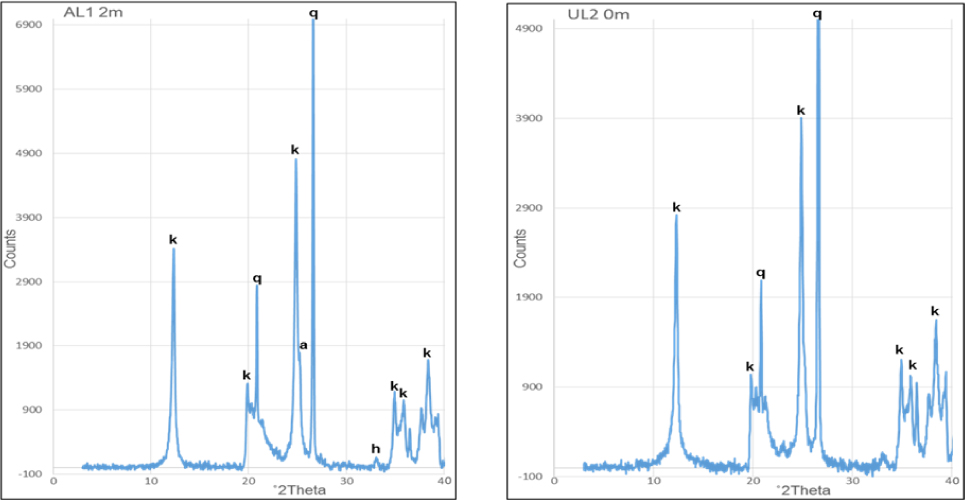
Representative X-ray diffractogram of the <2 μm fraction of the kaolin from Awo-Omama (AL1 2m) and Ubulu-Uku (UL2 0m) deposits showing kaolinite (k), quartz (q), anatase (a), and hematite (h).
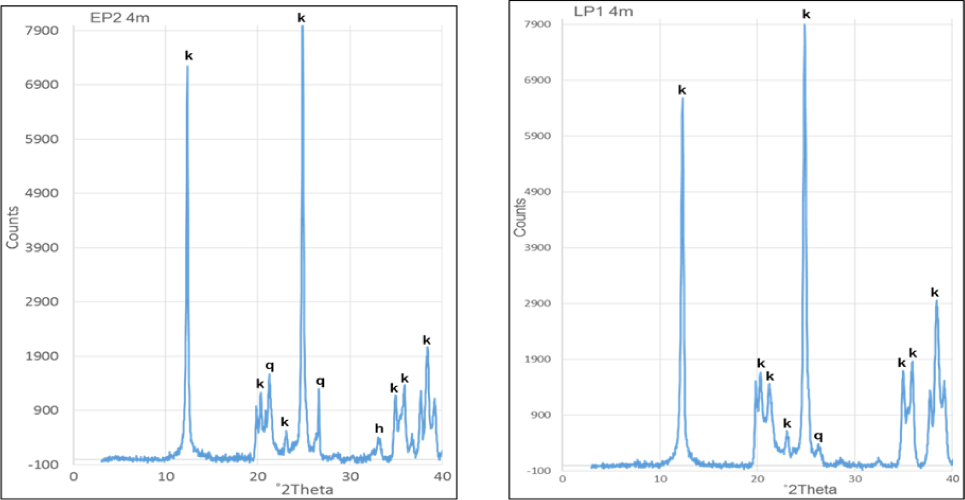
Representative X-ray diffractogram of the <2 μm fraction of the kaolin from Eruku (EP2 4m) and Lakiri (LP1 4m) deposits showing kaolinite (k), quartz (q), and hematite (h).
![Figure 7 Kaolin type mineralogical classification for the deposits [26].](/document/doi/10.1515/geo-2018-0012/asset/graphic/j_geo-2018-0012_fig_007.jpg)
Kaolin type mineralogical classification for the deposits [26].
The calculated Hinckley index (HI) percentages from the XRD pattern of the <2 μm fraction are presented in Tables 1 and 2. The HI values obtained for the kaolinites from Awo-Omama range between 0.27 and 0.41 with an average value of 0.31, which corresponds to low kaolinite structural order whereas the HI values for the kaolinites from Ubulu-Uku, Eruku, and Lakiri ranges from 0.58 and 1.36 with an average value of 0.97; 0.8 and 1.38 with an average value of 0.98; and 0.75 and 1.09 with an average value of 0.99, respectively, which is classified under the medium to high kaolinite structural order. From the average HI values, the kaolinites are partially ordered except for the Awo-Omama kaolinites. The increasing kaolinite structural order is Awo-Omama (with least structural orderliness) < Ubulu-Uku < Eruku < Lakiri (with best structural orderliness). This implies that the Cretaceous kaolinites are more ordered than the Paleogene/Neogene kaolinites. The average HI value of 0.75 obtained for the <2 μm fraction of Cretaceous Red Sea kaolinites in Egypt [24] is lower than the average values obtained for Ubulu-Uku, Eruku, and Lakiri deposits. Kaolins that have undergone more intense oxidative weathering typically contain a higher percentage of well-ordered kaolinite and therefore a higher HI value [23].
Mineral constituents and HI of the <2 μm fraction of the kaolin from Eruku and Lakiri Cretaceous kaolin deposits.
| Sample ID | Kaolinite % | Quartz % | Anatase % | Hematite % | Goethite % | HI |
|---|---|---|---|---|---|---|
| CF EP1 0m | 94.31 | 1 | 5 | - | - | 0.94 |
| CF EP1 2m | 96.49 | 2 | 1 | - | - | 0.86 |
| CF EP1 4m | 97.3 | 1 | 2 | - | - | 1 |
| CF EP2 0m | 97.5 | 1 | 1 | 1 | - | 0.8 |
| CF EP2 2m | 97.31 | 1 | 2 | - | - | 1.07 |
| CF EP2 4m | 88.28 | 2 | 8 | 1 | 1 | 1.38 |
| CF EP3 0m | 92.15 | 6 | 1 | - | 1 | 0.95 |
| CF EP3 2m | 86.71 | 5 | 5 | 1 | 2 | 0.86 |
| CF EP3 4m | 96.89 | - | 1 | - | 2 | 1 |
| CF LP1 0m | 95.74 | - | 4 | - | - | 0.75 |
| CF LP1 2m | 99.06 | - | 1 | - | - | 1.09 |
| CF LP1 4m | 98.85 | - | 1 | - | - | 1 |
| CF LP2 0m | 98.93 | - | 1 | - | - | 1.03 |
| CF LP2 2m | 99.03 | - | 1 | - | - | 1 |
| CF LP2 4m | 98.82 | - | 1 | - | - | 1.05 |
| Average | 95.82 | 2 | 2 | 1 | 2 | 0.98 |
| Max | 99.06 | 6 | 8 | 1 | 2 | 1.38 |
| Min | 86.71 | 1 | 1 | 1 | 1 | 0.75 |
3.2 FTIR Spectroscopy
The IR spectra for the <2 μm kaolin fraction from Awo- Omama, Ubulu-Uku, Eruku, and Lakiri deposits are presented in Figs. 8 – 11. The summary of the assignment of the absorption bands in measured IR is presented in Tables 3-6.
Position and assignment of IR bands of the <2 μm kaolin fraction from Awo-Omama and theoretical kaolinite.
| Theoretical | AL1 | AL1 | AL1 | AL2 | AL2 | AL2 | Assignment |
|---|---|---|---|---|---|---|---|
| Kaolinite | 0m | 1m | 2m | 0m | 1m | 2m | |
| 3691-89 | 3690 | 3692 | 3690 | 3690 | 3690 | 3690 | Al—O-H stretching of inner surface hydroxyl groups |
| 3669 | 3669 | 3670 | 3669 | 3669 | 3670 | 3669 | Al—O-H stretching of inner surface hydroxyl groups |
| 3651 | 3651 | 3649 | 3649 | 3650 | 3650 | 3650 | Al—O-H stretching of inner surface hydroxyl groups |
| 3619 | 3620 | 3620 | 3621 | 3621 | 3621 | 3621 | Al—O-H stretching of inner hydroxyl groups |
| 1115 - 14 | 1116 | 1116 | 1118 | 1116 | 1116 | 1116 | Si-O stretching (Longitudinal mode) |
| 1028 - 27 | 1026 | 1026 | 1028 | 1026 | 1026 | 1026 | In-plane Si-O stretching |
| 1005 - 04 | 999 | 999 | 997 | 1002 | 999 | 997 | In-plane Si-O stretching |
| 937 - 935 | 938 | 938 | 938 | 936 | 936 | 938 | OH deformation of inner surface hydroxyl groups |
| 912 | 910 | 912 | 912 | 912 | 912 | 910 | OH deformation of inner hydroxyl groups |
| 789 - 788 | 794 | 798 | 798 | 791 | 795 | 796 | OH deformation linked to Al, Mg |
| 751 - 750 | 751 | 751 | 749 | 750 | 753 | 749 | Si-O perpendicular |
| 684 - 681 | 689 | 691 | 696 | 683 | 687 | 691 | Si-O perpendicular |
| 541 | 520 | 529 | 528 | 520 | 530 | 530 | Fe-O, Fe2O3, Ti-O; Si-O-Al stretching |
Position and assignment of IR bands of the <2 μm kaolin fraction from Ubulu-Uku and theoretical kaolinite.
| Theoretical | UL1 | UL1 | UL1 | UL2 | UL2 | UL2 | UL2 | Assignment |
|---|---|---|---|---|---|---|---|---|
| Kaolinite | 0m | 1m | 2m | 0m | 1m | 2m | 3m | |
| 3691-89 | 3692 | 3692 | 3688 | 3692 | 3692 | 3688 | 3690 | Al—O-H stretching of inner surface hydroxyl groups |
| 3669 | 3669 | 3670 | 3668 | 3667 | 3668 | 3668 | 3670 | Al—O-H stretching of inner surface hydroxyl groups |
| 3651 | 3652 | 3651 | 3651 | 3651 | 3649 | 3651 | 3651 | Al—O-H stretching of inner surface hydroxyl groups |
| 3619 | 3621 | 3621 | 3619 | 3621 | 3621 | 3621 | 3619 | Al—O-H stretching of inner hydroxyl groups |
| 1115 - 14 | 1116 | 1116 | 1116 | 1116 | 1116 | 1116 | 1116 | Si-O stretching (Longitudinal mode) |
| 1028 - 27 | 1026 | 1028 | 1026 | 1026 | 1026 | 1024 | 1028 | In-plane Si-O stretching |
| 1005 - 04 | 1000 | 1000 | 1000 | 1002 | 1000 | 997 | 1002 | In-plane Si-O stretching |
| 937 - 935 | 938 | 938 | 938 | 936 | 938 | 936 | 936 | OH deformation of inner surface hydroxyl groups |
| 912 | 912 | 910 | 914 | 912 | 912 | 912 | 912 | OH deformation of inner hydroxyl groups |
| 789 - 788 | 798 | 800 | 798 | 798 | 798 | 798 | 798 | OH deformation linked to Al, Mg |
| 751 - 750 | 752 | 753 | 751 | 751 | 751 | 751 | 751 | Si-O perpendicular |
| 684 - 681 | 689 | 689 | 692 | 687 | 687 | 687 | 687 | Si-O perpendicular |
| 541 | 530 | 532 | 528 | 530 | 528 | 526 | 528 | Fe-O, Fe2O3, Ti-O; Si-O-Al stretching |
Position and assignment of IR bands of the <2 μm kaolin fraction from Lakiri and theoretical kaolinite.
| Theoretical | LP1 | LP1 | LP1 | LP2 | LP2 | LP2 | Assignment |
|---|---|---|---|---|---|---|---|
| Kaolinite | 0m | 2m | 4m | 0m | 2m | 4m | |
| 3691-89 | 3688 | 3686 | 3686 | 3686 | 3688 | 3688 | Al—O-H stretching of inner surface hydroxyl groups |
| 3669 | 3669 | 3670 | 3669 | 3670 | 3669 | 3670 | Al—O-H stretching of inner surface hydroxyl groups |
| 3651 | 3651 | 3653 | 3651 | 3651 | 3651 | 3651 | Al—O-H stretching of inner surface hydroxyl groups |
| 3619 | 3619 | 3619 | 3619 | 3619 | 3619 | 3619 | Al—O-H stretching of inner hydroxyl groups |
| 1115 - 14 | 1114 | 1116 | 1114 | 1116 | 1114 | 1116 | Si-O stretching (Longitudinal mode) |
| 1028 - 27 | 1023 | 1026 | 1026 | 1023 | 1026 | 1026 | In-plane Si-O stretching |
| 1005 - 04 | 1000 | 1000 | 1000 | 1000 | 1000 | 998 | In-plane Si-O stretching |
| 937 - 935 | 938 | 938 | 938 | 938 | 938 | 940 | OH deformation of inner surface hydroxyl groups |
| 912 | 912 | 912 | 912 | 914 | 912 | 912 | OH deformation of inner hydroxyl groups |
| 789 - 788 | 794 | 791 | 796 | 796 | 793 | 793 | OH deformation linked to Al, Mg |
| 751 - 750 | 749 | 753 | 753 | 753 | 751 | 751 | Si-O perpendicular |
| 684 - 681 | 689 | 689 | 692 | 687 | 687 | 687 | Si-O perpendicular |
| 541 | 524 | 524 | 530 | 522 | 526 | 528 | Fe-O, Fe2O3, Ti-O; Si-O-Al stretching |
Position and assignment of IR bands of the <2 μm kaolin fraction from Eruku and theoretical kaolinite.
| Theoretical | EP1 | EP1 | EP1 | EP2 | EP2 | EP2 | EP3 | EP3 | EP3 | Assignment |
|---|---|---|---|---|---|---|---|---|---|---|
| Kaolinite | 0m | 2m | 4m | 0m | 2m | 4m | 0m | 2m | 4m | |
| 3691-89 | 3688 | 3688 | 3688 | 3688 | 3686 | 3688 | 3688 | 3688 | 3686 | Al—O-H stretching of inner surface hydroxyl groups |
| 3669 | 3669 | 3670 | 3670 | 3670 | 3670 | 3670 | 3670 | 3670 | 3670 | Al—O-H stretching of inner surface hydroxyl groups |
| 3651 | 3651 | 3651 | 3651 | 3651 | 3651 | 3651 | 3651 | 3651 | 3651 | Al—O-H stretching of inner surface hydroxyl groups |
| 3619 | 3619 | 3619 | 3619 | 3619 | 3619 | 3619 | 3621 | 3619 | 3619 | Al—O-H stretching of inner hydroxyl groups |
| 1115 - 14 | 1116 | 1114 | 1114 | 1114 | 1114 | 1114 | 1116 | 1116 | 1114 | Si-O stretching (Longitudinal mode) |
| 1028 - 27 | 1026 | 1024 | 1026 | 1026 | 1026 | 1026 | 1026 | 1024 | 1024 | In-plane Si-O stretching |
| 1005 - 04 | 999 | 998 | 1002 | 1000 | 1000 | 1002 | 1000 | 1000 | 1000 | In-plane Si-O stretching |
| 937 - 935 | 938 | 938 | 940 | 938 | 936 | 938 | 936 | 938 | 936 | OH deformation of inner surface hydroxyl groups |
| 912 | 912 | 910 | 914 | 912 | 912 | 912 | 912 | 912 | 912 | OH deformation of inner hydroxyl groups |
| 789 - 788 | 796 | 791 | 794 | 791 | 791 | 791 | 791 | 791 | 793 | OH deformation linked to Al, Mg |
| 751 - 750 | 749 | 751 | 749 | 751 | 751 | 751 | 751 | 751 | 751 | Si-O perpendicular |
| 684 - 681 | 691 | 691 | 696 | 683 | 687 | 691 | 683 | 687 | 691 | Si-O perpendicular |
| 541 | 526 | 528 | 522 | 522 | 522 | 528 | 524 | 526 | 526 | Fe-O, Fe2O3, Ti-O; Si-O-Al stretching |
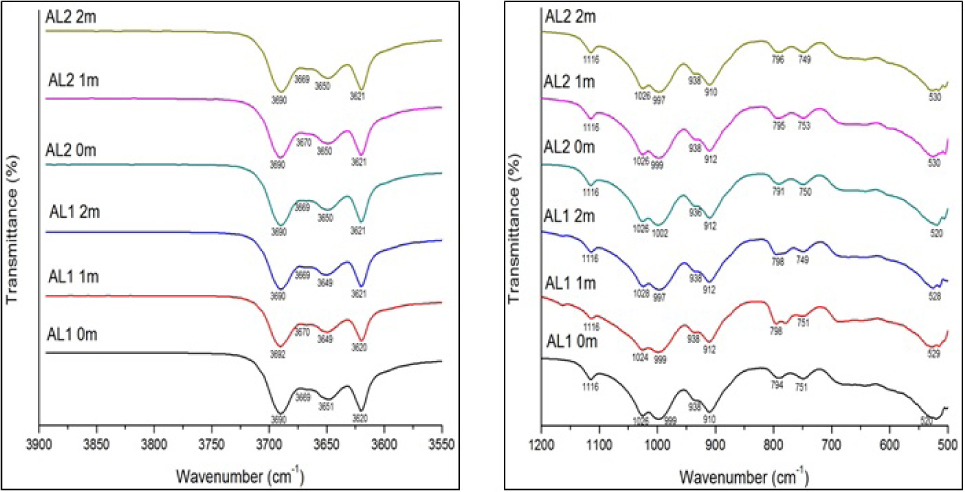
The IR spectra of the <2 μm kaolin fraction from Awo- Omama between 3900 to 3550 cm–1 and 1200 to 500 cm–1.

The IR spectra of the <2 μm kaolin fraction from Ubulu-Uku between 3900 to 3550 cm–1 and 1200 to 500

The IR spectra of the <2 μm kaolin fraction from Eruku between 3900 to 3550 cm–1 and 1200 to 500 cm–1.
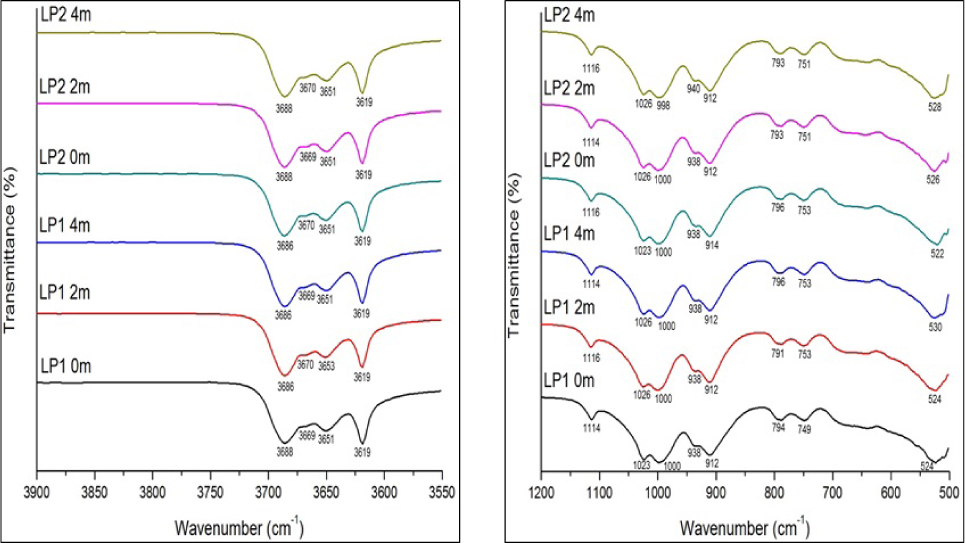
The IR spectra of the <2 μm kaolin fraction from Lakiri between 3900 to 3550 cm–1 and 1200 to 500 cm–1.
The identification of absorption bands at about 3691/3689, 3669, 3651/3650, and 3619 by visual estimation (IR-E) can be used to infer kaolinite structural order [4, 8]. According to the IR-E classification, kaolinite structure is considered ordered, if the four OH stretching and bending bands were clearly resolved; partially ordered, if the individual OH bands at 3669, 3651/3650 and 937/935 cm–1 could be identified but intensities were low; and poorly ordered, if only one band near 3660 cm–1 or inflexions near 3669 cm–1, 3651/3650 cm–1 and 937/935 cm–1 were observed in the spectra [4]. From the IR spectra obtained for the samples, the four bands in the OH stretching region were observed with the 3669 band showing weak inflexions which is more pronounced particularly for the <2 μm kaolin fraction from Awo-Omama deposit (Fig. 8). This indicates partially ordered structure for the samples. Based on the IR spectrum for the deposits, the order of increasing structural order is Awo-Omama, Ubulu-Uku, Eruku, and Lakiri deposits, respectively. Characteristic bands at 1116-1114 and 692-683 indicative of quartz interference in the samples were identified. Muscovite interference was identified in all the samples at bands between 1028-1023 cm–1. The 500-600 cm–1 bands due to the presence of iron oxide and Ti-O bond vibrations [27] were prominent at bands between 532-520 cm–1 in all the samples. From the foregoing, it therefore means that the IR spectra showed the presence of kaolinite, quartz, muscovite, hematite, goethite, and anatase in the samples, most of which had earlier been identified by XRD in some of the samples. This further demonstrates the complementary role of both FTIR and XRD techniques in characterising kaolin clay fraction, though the latter did not show the presence of muscovite in the samples.
The calculated CI1 and CI2 values obtained for the kaolinites correspond to partially ordered structures based on the IR-N classification (Table 7). There is an agreement between the IR-E and IR-N classifications in that the kaolinite structures were classified as partially ordered. This agreement is due to the absence of clay minerals like illite or smectite which could affect the IR pattern in OH stretching and bending region [4]. The IR and HI classifications agree with each other for the Ubulu-Uku, Eruku, and Lakiri deposits except for Awo-Omama deposit. This accordance further confirm that FTIR is a sensitive tool in the estimation of kaolinite crystallinity [28].
The structural order of kaolinite samples using IR-N classification.
| Deposit | Age | IR-N | ||
|---|---|---|---|---|
| Average CI1 | Average CI 2 | Class | ||
| Awo-Omama (n=6) | Paleogene/Neogene | 3.36 | 1.02 | pa-o |
| Ubulu-Uku (n=7) | Paleogene/Neogene | 3.12 | 1.05 | pa-o |
| Average | 3.24 | 1.04 | pa-o | |
| Eruku (n=9) | Cretaceous | 2.99 | 1.03 | pa-o |
| Lakiri (n=6) | Cretaceous | 3.10 | 1.03 | pa-o |
| Average | 3.04 | 1.03 | pa-o | |
3.3 Industrial Applications
The industrial utility of kaolin is determined by its physico-chemical, mineralogical, and geochemical characteristics. The <2 μm fraction is important in accessing the industrial applications of kaolins because most applications require between 40 – 95 % clay fraction [29]. Based on the mineralogical composition (Fig. 12), the pure kaolin type deposits will possibly be useful as raw materials for refractory, fiberglass and ceramic applications whereas the sandy kaolin type deposit will possibly be useful for pigment applications. For the pure kaolin-type, the major colouring minerals are anatase, hematite, and goethite. The presence of Fe and Ti phases could cause whiteness problem in ceramics [30]. This deduction can be substantiated by matching the chemistry of these kaolin samples with various industrial specifications.
![Figure 12 Possible industrial applications of the kaolin based on their mineralogical classification [26] described in Fig. 7.](/document/doi/10.1515/geo-2018-0012/asset/graphic/j_geo-2018-0012_fig_012.jpg)
4 Conclusions
The mineralogical analyses carried out on the <2 μm kaolin fraction from Awo-Omama, Ubulu-Uku, Eruku, and Lakiri deposits show them to be essentially kaolinitic with other mineral constituents such as quartz, anatase, goethite, and hematite in that decreasing order. Based on the mineralogical classification (Pruett, 2016), the Paleogene/Neogene Awo-Omama and Ubulu-Uku deposits are classified as sandy kaolin and the Cretaceous Eruku and Lakiri deposits are classified as pure kaolin type.
The kaolinite structural order from the XRD based HI method and the FTIR based IR-E and IR-N methods in increasing orderliness is Awo-Omama (with least structural orderliness) < Ubulu-Uku < Eruku < Lakiri (with best structural orderliness). This implies that the pure kaolin type have higher kaolinite structural order than the sandy kaolin type. From the mineralogy and kaolinite structural order, it can be deduced that the pure kaolin type have undergone more intense oxidative weathering.
The economic consideration of the deposits showed that the sandy kaolin type can be used in pigment industrial applications whereas the pure kaolin type can be used in refractory, fiberglass, and ceramic industrial applications. However, more knowledge on the chemistry is important for efficient mineral separation using magnetic, flotation and selective flocculation methods. This can also give more geologic insight into the evolution of the kaolin deposits and improve the traditional kaolin applications.
Acknowledgement
The financial support received from the Research and Publication Committee (RPC), University of Venda is highly appreciated. Intellectual contributions of Dr. Remy Bucher of the Ithemba Labs is thankfully acknowledged.
References
[1] Murray H.H., Applied Clay Mineralogy. Occurrences, Processing and Application of Kaolins, Bentonites, Palygorskite–Sepiolite, and Common Clays, 1st ed. Elsevier, Oxford, 2007, 189 pp.10.1016/S1572-4352(06)02001-0Suche in Google Scholar
[2] Ekosse G., Kaolin deposits and Occurrences in Africa: Geology, Mineralogy and Utilization. Appl. Clay Sci., 2010, 50, 212-236.10.1016/j.clay.2010.08.003Suche in Google Scholar
[3] Mefire A.N., Njoya A., Fouateu R.Y., Mache J.R., Tapon N.A., Nzeugang A.N; et al., Occurrences of kaolin in Koutaba (west Cameroon): Mineralogical and physicochemical characterization for use in ceramic products. Clay Miner., 2015, 50 (5), 593 –606.10.1180/claymin.2015.050.5.04Suche in Google Scholar
[4] Vaculíková L., Plevová E.Vallová, S., KoutníkI., Characterization and differentiation of kaolinites from selected Czech deposits using infrared spectroscopy and differential thermal analysis. Acta Geodyn. Geomater., 2011, 8/1 (161), 59–67.Suche in Google Scholar
[5] Aparicio P., Galán E., Mineralogical interference on kaolinite crystallinity index measurements. Clays Clay Miner., 1999, 47, 12–27.10.1346/CCMN.1999.0470102Suche in Google Scholar
[6] Diko M., Ekosse G., Ogola J., Fourier transform infrared spectroscopy and thermal analyses of kaolinitic clays from South Africa and Cameroon. Acta Geodyn. Geomater, 2016, 13/2 (182), 149–158.10.13168/AGG.2015.0052Suche in Google Scholar
[7] Aparicio P., Galán E., Ferrell R.E., A new kaolinite order index based on XRD profile fitting. Clay Miner., 2006, 41, 811–817.10.1180/0009855064140220Suche in Google Scholar
[8] Madejová J., Kraus I., Tunega D., Šamajová E., Fourier transform infrared spectroscopic characterization of kaolin group minerals from the main Slovak deposits. Geol. Carphat., 1997, 6/1, 3–10.Suche in Google Scholar
[9] Murray H.H., Kaolin Minerals: their genesis and occurrences. In: Bailey S.W. (Ed.), Hydrous phyllosilicates (exclusive of Micas). Reviews in Mineralogy, Mineralogical Society of America, Washington D.C., 1998, 19, 67-89.Suche in Google Scholar
[10] Onyemaobi O. O., Mineral Resources Exploitation, Processing and Utilization – A Sine Qua Non for Nigeria’s Metallurgical Industrial Development Inaugural Lecture Series 5 of FUTO, Owerri: FUTO Press, 2002, 48 pp.Suche in Google Scholar
[11] Raw Materials Research and Development Council (RMRDC) Multidisciplinary Committee Techno-Economic Survey (MCTS) Report, Chemicals and Pharmaceutical Sector. 4th Update, 2003, 16-69, 102.Suche in Google Scholar
[12] Omatsola M.E., Adegoke O.S., Tectonic evolution and Cretaceous stratigraphy of Dahomey Basin. J. Min. Geol., 1981, 18, 130–137.Suche in Google Scholar
[13] Nwajide C.S., Geology of Nigeria’s Sedimentary Basins. CSS Press, Nigeria, 2013, 565 pp.Suche in Google Scholar
[14] Billman A, Offshore stratigraphy and paleontology of the Dahomey Basin (Benin embayment), West Africa. Paper presented at the 7th African Micropaleontological coll., Ile-Ife, 1976.Suche in Google Scholar
[15] Gaspe A., Messer P., Young P., Selection and preparation of clay bodies for stove manufacture. Clay testing. A manual on clay/non-clay ratio measurement technique, 1994, 10 pp.10.3362/9781780443980Suche in Google Scholar
[16] Jackson M.L., Soil chemical analysis, 2nd edition, Madison, WI, USA, 1979, 895 pp.Suche in Google Scholar
[17] Ekosse G., Basic principles and practices in X–ray diffraction. In: Ekosse G., Totolo O. (Eds), Proceedings of the seminar on Faculty of Science Shared Facilities: Enhancing teaching, research and promoting industry solutions, Botswana, 2004, 26 – 33.Suche in Google Scholar
[18] International Centre for Diffraction Data (ICDD), Mineral Powder diffraction file data book, 2002, 941p.Suche in Google Scholar
[19] Hinckley D., Variability in “crystallinity” values among the kaolin deposits of the Coastal Plain of Georgia and South Carolina. In: Proceedings of the 11th International Conference on Clays and Clay Minerals, 1963, 229-235.10.1346/CCMN.1962.0110122Suche in Google Scholar
[20] Russell, J.D., Fraser, A.R., Infrared methods. In: Wilson M.J. (Ed.), Clay Mineralogy: Spectroscopic and Chemical Determinative Methods’. Chapman & Hall, London, 1994, 11-67.10.1007/978-94-011-0727-3_2Suche in Google Scholar
[21] Madejová J., Komadel P. Baseline studies of the clay minerals source society: infrared methods. Clays Clay Miner., 2001, 49, 410–432.10.1346/CCMN.2001.0490508Suche in Google Scholar
[22] Németh T., Máthé Z., Pekker P., Dódony I., Kovács-Kis V., Sipos P.; et al., Clay mineralogy of the Boda Claystone Formation (Mecsek Mts., SW Hungary), Open Geosci. 2016; 8:259–274.10.1515/geo-2016-0024Suche in Google Scholar
[23] Kogel J.E., Pickering S.M., Shelobolina E., Chowns T., Yuan J., Avant D.M., The Georgia Kaolins: Geology and Utilization, Society for Mining Metallurgy, 2002, 84 pp.Suche in Google Scholar
[24] Baioumy H.M., Geochemistry and origin of the Cretaceous sedimentary kaolin deposits, Red Sea, Egypt, Chemie der Erde, 2014, 74, 195–203.10.1016/j.chemer.2013.06.008Suche in Google Scholar
[25] Wilson I.R., Halls C., Spiro B., A comparison between the China Clay deposits of China and Cornwall. Proceedings of the Ussher Society, 1997, 9, 195-200.Suche in Google Scholar
[26] Pruett R.J., Kaolin deposits and their uses: Northern Brazil and Georgia, USA. Appl. Clay Sci., 2016,131, 3-13.10.1016/j.clay.2016.01.048Suche in Google Scholar
[27] Gao Y., Masuda Y., Peng Z., Yonezawa T., Koumoto K., Room temperature deposition of a TiO2 thin film from aqueous peroxotitanatesolution. J. Mater. Chem., 2003, 13, 608–613.10.1039/b208681fSuche in Google Scholar
[28] Prost R., Dameme A., Huard E., Driard J., Leydecker J.P., Infrared Study of Structural OH in Kaolinite, Dickite, Nacrite, and Poorly Crystalline Kaolinite at 5 to 600 K, Clays Clay Miner, 1989, 37 (5), 464 – 468.10.1346/CCMN.1989.0370511Suche in Google Scholar
[29] Bloodworth A J, Highley D. E., Mitchell, C. J., Industrial Minerals Laboratory Manual: Kaolin, British Geological Survey Technical Report WG/1993/1.Suche in Google Scholar
[30] Garcia-Valles M., Pi T., Alfonso P., Canet C., Martínez S., Jiménez- Franco A.; et al., Kaolin from Acoculco (Puebla, Mexico) as raw material: Mineralogical and thermal characterization, Clay Miner., 2015, 50, 405-416.10.1180/claymin.2015.050.3.12Suche in Google Scholar
© 2018 O.M. Oyebanjo et al., published by De Gruyter
This work is licensed under the Creative Commons Attribution-NonCommercial-NoDerivatives 4.0 License.
Artikel in diesem Heft
- Regular Articles
- Spatio-temporal monitoring of vegetation phenology in the dry sub-humid region of Nigeria using time series of AVHRR NDVI and TAMSAT datasets
- Water Quality, Sediment Characteristics and Benthic Status of the Razim-Sinoie Lagoon System, Romania
- Provenance analysis of the Late Triassic Yichuan Basin: constraints from zircon U-Pb geochronology
- Historical Delineation of Landscape Units Using Physical Geographic Characteristics and Land Use/Cover Change
- ‘Hardcastle Hollows’ in loess landforms: Closed depressions in aeolian landscapes – in a geoheritage context
- Geostatistical screening of flood events in the groundwater levels of the diverted inner delta of the Danube River: implications for river bed clogging
- Utilizing Integrated Prediction Error Filter Analysis (INPEFA) to divide base-level cycle of fan-deltas: A case study of the Triassic Baikouquan Formation in Mabei Slope Area, Mahu Depression, Junggar Basin, China
- Architecture and reservoir quality of low-permeable Eocene lacustrine turbidite sandstone from the Dongying Depression, East China
- Flow units classification for geostatisitical three-dimensional modeling of a non-marine sandstone reservoir: A case study from the Paleocene Funing Formation of the Gaoji Oilfield, east China
- Umbrisols at Lower Altitudes, Case Study from Borská lowland (Slovakia)
- Modelling habitats in karst landscape by integrating remote sensing and topography data
- Mineral Constituents and Kaolinite Crystallinity of the <2 μm Fraction of Cretaceous-Paleogene/Neogene Kaolins from Eastern Dahomey and Niger Delta Basins, Nigeria
- Construction of a dynamic arrival time coverage map for emergency medical services
- Characterizing Seismo-stratigraphic and Structural Framework of Late Cretaceous-Recent succession of offshore Indus Pakistan
- Geosite Assessment Using Three Different Methods; a Comparative Study of the Krupaja and the Žagubica Springs – Hydrological Heritage of Serbia
- Use of discriminated nondimensionalization in the search of universal solutions for 2-D rectangular and cylindrical consolidation problems
- Trying to underline geotourist profile of National park visitors: Case study of NP Fruška Gora, Serbia (Typology of potential geotourists at NP Fruška Gora)
- Fluid-rock interaction and dissolution of feldspar in the Upper Triassic Xujiahe tight sandstone, western Sichuan Basin, China
- Calcified microorganisms bloom in Furongian of the North China Platform: Evidence from Microbialitic-Bioherm in Qijiayu Section, Hebei
- Spatial predictive modeling of prehistoric sites in the Bohemian-Moravian Highlands based on graph similarity analysis
- Geotourism starts with accessible information: the Internet as a promotional tool for the georesources of Lower Silesia
- Models for evaluating craters morphology, relation of indentation hardness and uniaxial compressive strength via a flat-end indenter
- Geotourism in an urban space?
- The first loess map and related topics: contributions by twenty significant women loess scholars
- Modeling of stringer deformation and displacement in Ara salt after the end of salt tectonics
- A multi-criteria decision analysis with special reference to loess and archaeological sites in Serbia (Could geosciences and archaeology cohabitate?)
- Speleotourism in Slovenia: balancing between mass tourism and geoheritage protection
- Attractiveness of protected areas for geotourism purposes from the perspective of visitors: the example of Babiogórski National Park (Poland)
- Implementation of Heat Maps in Geographical Information System – Exploratory Study on Traffic Accident Data
- Mapping War Geoheritage: Recognising Geomorphological Traces of War
- Numerical limitations of the attainment of the orientation of geological planes
- Assessment of runoff nitrogen load reduction measures for agricultural catchments
- Awheel Along Europe’s Rivers: Geoarchaeological Trails for Cycling Geotourists
- Simulation of Carbon Isotope Excursion Events at the Permian-Triassic Boundary Based on GEOCARB
- Morphometry of lunette dunes in the Tirari Desert, South Australia
- Multi-spectral and Topographic Fusion for Automated Road Extraction
- Ground-motion prediction equation and site effect characterization for the central area of the Main Syncline, Upper Silesia Coal Basin, Poland
- Dilatancy as a measure of fracturing development in the process of rock damage
- Error-bounded and Number-bounded Approximate Spatial Query for Interactive Visualization
- The Significance of Megalithic Monuments in the Process of Place Identity Creation and in Tourism Development
- Analysis of landslide effects along a road located in the Carpathian flysch
- Lithological mapping of East Tianshan area using integrated data fused by Chinese GF-1 PAN and ASTER multi-spectral data
- Evaluating the CBM reservoirs using NMR logging data
- The trends in the main thalweg path of selected reaches of the Middle Vistula River, and their relationships to the geological structure of river channel zone
- Lithostratigraphic Classification Method Combining Optimal Texture Window Size Selection and Test Sample Purification Using Landsat 8 OLI Data
- Effect of the hydrothermal activity in the Lower Yangtze region on marine shale gas enrichment: A case study of Lower Cambrian and Upper Ordovician-Lower Silurian shales in Jiangye-1 well
- Modified flash flood potential index in order to estimate areas with predisposition to water accumulation
- Quantifying the scales of spatial variation in gravel beds using terrestrial and airborne laser scanning data
- The evaluation of geosites in the territory of National park „Kopaonik“(Serbia)
- Combining multi-proxy palaeoecology with natural and manipulative experiments — XLII International Moor Excursion to Northern Poland
- Dynamic Reclamation Methods for Subsidence Land in the Mining Area with High Underground Water Level
- Loess documentary sites and their potential for geotourism in Lower Silesia (Poland)
- Equipment selection based on two different fuzzy multi criteria decision making methods: Fuzzy TOPSIS and fuzzy VIKOR
- Land deformation associated with exploitation of groundwater in Changzhou City measured by COSMO-SkyMed and Sentinel-1A SAR data
- Gas Desorption of Low-Maturity Lacustrine Shales, Trassic Yanchang Formation, Ordos Basin, China
- Feasibility of applying viscous remanent magnetization (VRM) orientation in the study of palaeowind direction by loess magnetic fabric
- Sensitivity evaluation of Krakowiec clay based on time-dependent behavior
- Effect of limestone and dolomite tailings’ particle size on potentially toxic elements adsorption
- Diagenesis and rock properties of sandstones from the Stormberg Group, Karoo Supergroup in the Eastern Cape Province of South Africa
- Using cluster analysis methods for multivariate mapping of traffic accidents
- Geographic Process Modeling Based on Geographic Ontology
- Soil Disintegration Characteristics of Collapsed Walls and Influencing Factors in Southern China
- Evaluation of aquifer hydraulic characteristics using geoelectrical sounding, pumping and laboratory tests: A case study of Lokoja and Patti Formations, Southern Bida Basin, Nigeria
- Petrography, modal composition and tectonic provenance of some selected sandstones from the Molteno, Elliot and Clarens Formations, Karoo Supergroup, in the Eastern Cape Province, South Africa
- Deformation and Subsidence prediction on Surface of Yuzhou mined-out areas along Middle Route Project of South-to-North Water Diversion, China
- Abnormal open-hole natural gamma ray (GR) log in Baikouquan Formation of Xiazijie Fan-delta, Mahu Depression, Junggar Basin, China
- GIS based approach to analyze soil liquefaction and amplification: A case study in Eskisehir, Turkey
- Analysis of the Factors that Influence Diagenesis in the Terminal Fan Reservoir of Fuyu Oil Layer in the Southern Songliao Basin, Northeast China
- Gravity Structure around Mt. Pandan, Madiun, East Java, Indonesia and Its Relationship to 2016 Seismic Activity
- Simulation of cement raw material deposits using plurigaussian technique
- Application of the nanoindentation technique for the characterization of varved clay
- Verification of compressibility and consolidation parameters of varved clays from Radzymin (Central Poland) based on direct observations of settlements of road embankment
- An enthusiasm for loess: Leonard Horner in Bonn and Liu Tungsheng in Beijing
- Limit Support Pressure of Tunnel Face in Multi-Layer Soils Below River Considering Water Pressure
- Spatial-temporal variability of the fluctuation of water level in Poyang Lake basin, China
- Modeling of IDF curves for stormwater design in Makkah Al Mukarramah region, The Kingdom of Saudi Arabia