Land deformation associated with exploitation of groundwater in Changzhou City measured by COSMO-SkyMed and Sentinel-1A SAR data
-
Deliang Chen
 ,
Yanyan Lu
,
Yanyan Lu

Abstract
The Urban Agglomeration in Yangtze River Delta is one of the most important economic and industrial regions in China. The City of Changzhou is one of the most important industrial citys in Yangtze River Delta Urban Agglomeration. Activities here include groundwater exploration. Groundwater overexploitation has contributed to the major land deformation in this city. The severity and magnitude of land deformation over time were investigated in Changzhou City. A Small Baseline Subset Interferometric Synthetic Aperture Radar (SBAS-InSAR) technology, provides a useful tool in measuring urban land deformation. In this study, a time series of COSMO-SkyMed and Sentinel-1A SAR images covering Changzhou City were acquired. SBAS-InSAR imaging technique was used to survey the extent and severity of land deformation associated with the exploitation of groundwater in Changzhou City. Leveling data was used to validate the SBAR-InSAR productions, the error of SBAR-InSAR annual subsidence results was within 2 mm. The results showed that three main land subsidence zones were detected at Xinbei, Tianning and Wujin District. Four subsidence points were selected to analyze the temporal and spatial evolution characteristics of land subsidence. The subsidence rate of P1 to P4 was −2.48 mm/year, −12.78 mm/year, −18.09 mm/year, and −12.69 mm/year respectively. Land subsidence over Changzhou showed a trend of slowing down from 2011 to 2017, especially in Wujin District. SBAR-InSAR derived land deformation that correlates with the water level change in six groundwater stations. Indicated that with groundwater rebound, the land rebound obviously, and the maximum rebound vale reached 9.13 mm.
1 Introduction
The Yangtze River Delta is located in the eastern part of China, with a low and flat ground surface. It occupies an area of nearly 210 700 km2, including part of Jiangsu Province, Zhejiang Province, and Shanghai City. The Yangtze River Delta is one of the most developed areas in China. The developed economics and a rise in population cause the domestic and industrial water supply to increase rapidly. Groundwater is extracted from the aquifer system underlying the Yangtze River Delta to handle the increasing water demand. This area has suffered from land subsidence since the early 1920s due to the increasing amount of the groundwater usage [1]. Changzhou City is located in the south Yangtze River Delta area, with its north adjacent to the Yangtze River and south to Taihu Lake. Changzhou City is one of the most economically developed cities in the Yangtze River Delta, and it is characterized by a dense population and numerous towns. Changzhou City was a typical area in Yangtze River Delta with serious land subsidence due to excessive groundwater withdrawal [2]. In 2000, the provincial government announced a regulation to comprehensively ban deep groundwater extraction by 2005 to mitigate the widespread subsidence and earth fissures in the Changzhou City.
However, up until now there has been no large-scale high-precision measuring work conducted in Changzhou City Especially how the subsidence and rebound evolve spatially and temporally before and after the implementation of the policy limiting groundwater exploitation. Only some local leveling measurements have been taken. Unfortunately, the present leveling data set is not very reliable due to lack of historical measurements and incomplete records. In order to investigate the scope, magnitude, distribution, and temporal change of land deformation in Changzhou City and the possible causes, synthetic aperture radar interferometry (InSAR) would be ideal technology to employ. InSAR is an advanced remote sensing technology that has been developed over the last decades, and it features multiple prominent technological advantages, such as 24-hour all-weather capability, high-deformation sensitivity, and high-resolution. Therefore, InSAR complements other techniques such as precise leveling and global positioning system (GPS) for subsidence monitoring. Currently, differential InSAR (DInSAR) has been widely applied in monitoring surface deformation [3, 4, 5, 6,]. Atzori et al. used X-band COSMO-SkyMed and C-band ENVISAT SAR data with DInSAR to examine the seismic deformation of L’Aquila in central Italy, and they integrated DInSAR data with 30 GPS site displacements to constrain inversion models for fault dislocation [7]. The best fit fault plane was in very good agreement with the results of CMT (centroid moment tensor) solutions. Tomás et al. used TerraSAR-X data and DInSAR to investigate the deformation of La Pedrera Dam deformation in Spain, and their results showed a good agreement with other studies [8]. Ge et al. used the C-band ENVISAT ASAR and L-band ALOS PALSAR data to monitor the land subsidence of Bandung Basin, West Java province, Indonesia. Good correlations were observed between DInSAR results and GPS survey data [9].
Traditional DInSAR focuses on single pair of InSAR images for deformation detection. Factors such as temporal/spatial decoherence and atmospheric phase interference often affect the formation of interferograms. X-band SAR data and DInSAR are affected by temporal and spatial decoherence, which could lead to unreliable deformation results [10]. To overcome these problems, advanced DInSAR technologies, such as persistent scatterer (PS) and small baseline subset (SBAS) have been developed. The PS method generally requires a large quantity of SAR images; otherwise, severe decoherence, originated from overstretched temporal and spatial baselines is likely to occur. Therefore, the nonlinear deformation phase cannot be separated from the noise and atmospheric delay phase and reliable deformation results cannot be obtained [11]. However, a small quantity of SAR images is not a problem for the SBAS method. Moreover, SBAS limits the geometric decoherence resulted from long baselines; therefore, the processing of SAR data can utilize an unlimited amount of SAR interferometric pairs to enhance the sampling rate in temporal space [12]. The SBAS-InSAR technique has been successfully applied to studies of surface deformation events caused by geological disasters, such as volcanic deformations, landslides, and urban ground deformation [12, 13, 14, ]. Lubitz et al. applied TerraSAR-X data and SBAS-InSAR to monitor the surface deformation of the Staufen area in southwestern Germany. They obtained experimental data that was consistent with the results of the leveling survey [15]. Calò et al. monitored the landslide in the Ivancich area in central Italy based on the X-band COSMO-SkyMed SAR data and SBAS-InSAR [16]. Hu et al. used C-band ENVISAT ASAR data and SBAS-InSAR to survey land subsidence in Beijing, and they obtained results that were comparable with the leveling data [17].
In this study, we utilized the SBAS-InSAR technique based on COSMO-SkyMed and Sentinel-1A SAR data to derive the land deformation time-series in Changzhou City to study the dynamic evolution of land deformation before and after the implementation of subsidence control, and to analyze the causes of subsidence. section 2 presents an overview of the study area and datasets. section3 presents the methodology involved. section 4 and section 5 present the results and land deformation analysis work, respectively, and concluding remarks are given in section 6.
2 Study area and datasets
2.1 Study area
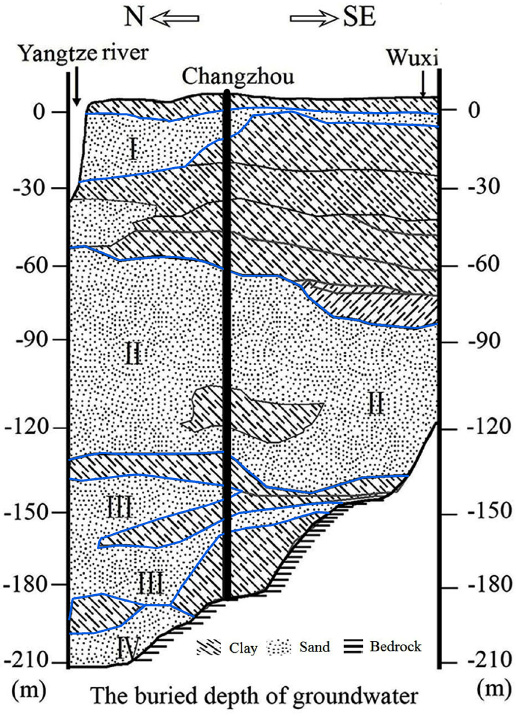
Changzhou City is the study area located on the deltaic deposits of the Yangtze River Delta on the east coast of China (Figure 1 (a) Its geographic location is 31°09’N-32°04’N and 119°08’E-120°12’E, with Taihu Lake to the south and Wuxi city to the east. The urban region of Changzhou contains Xinbei, Zhonglou, Tianning, and Wujin districts. (Figure 1(b)) The ground elevation is less than 10 m in the plain area, higher in northwest, lower in the middle and southeast. There are several bedrock hills spotted in south and west part of this city, and the groundwater elevation is about 80 to 178 m [18]. Sedimentary and igneous rocks constitute the basement of Changzhou City. This city experienced seawater intrusions four times and deposited a set of Quaternary sediments since middle Pleistocene. The thickness of Quaternary deposits strata varies, which affected by the bedrock [19]. There are four aquifers in the Quaternary alluviums, namely, one unconfined and three confined aquifers, which are denoted as U, I, II and III (Figure. 1(c)). Conventionally, groundwater with in 50 m deep is shallow, i.e., U and I, otherwise is deep, i.e., II and III [20].
Changzhou City is within a temperate climate zone of abundant rainfall and dense river network. Over the past several decades, its urban and rural areas have witnessed phenomenal economic growth, which has been accompanied by severe pollution of the surface water and general decline of the water quality of rivers. With the rapid economic development and the pollution of the surface water in Changzhou City, the groundwater usage (both civilian and industrial water) increased gradually. In our study, the second confined aquifer is the main aquifer.
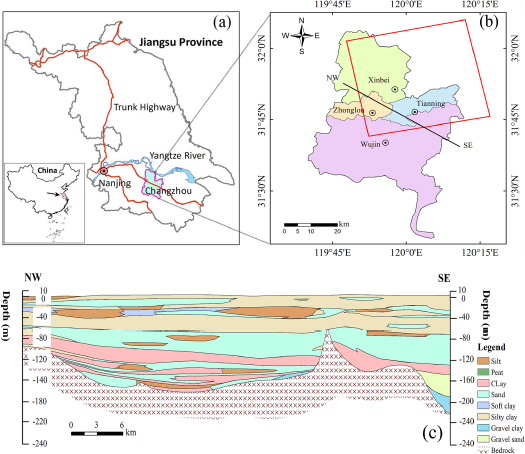
(a) Location of the study area. (b) Red polygon denotes area under the SAR images including the major urban areas of Changzhou: Xinbei, Zhonglou, Tianning, and northeast portion of Wujin. (c) The NW-SE oriented line segment indicates the location of the geological cross section of the Changzhou City
2.2 SAR Data
All the SAR data information used in this study is show in Table 1. COSMO-SkyMed is a high-resolution radar satellite constellation that developed by the Italian space agency and defense department, and it is composed of four synthetic aperture radar satellites. COSMO-SkyMed acquires X-band images (wavelength of 3.1 cm), and is more sensitive to urban land deformation detection than the C-band (5.6 cm wavelength) and L-band (23.5 cm wavelength) radars [10]. The COSMO-SkyMed image data feature high spatial resolution, wide coverage, selectable angles of incidence and multipolarity; the image features used in conjunction with the precise orbital data allow for repeat-track interferometry in the monitoring of surface deformations. In this study, the 12 single-look complex slant (SCS) (L1A) data was acquired from the X-band SAR1 and SAR3 satellites that cover the study area. The five SAR3 images were between July and December of 2011, whereas the seven SAR1 images were between January and July of 2012. All images for this study were of HH polarization and from the ascending orbit. The look angle at the image center was about 26°, and the imaging mode was Stripmap. The Stripmap mode has two sub-modes: HIMAGE and Ping-Pong. All images for this study were of HIMAGE mode. In the HIMAGE mode, the configurations of the radar transmitting and receiving antenna do not change over time, satellites can receive the full Doppler beam width from every ground scatter, with a pattern width approximately 40 km. Currently, the X-band COSMO-SkyMed SAR data have been successfully applied to the detection of surface deformations with sub-centimeter accuracy [7], [16]. Sentinel-1A is a European C-band radar satellite launched in 3 April 2014 with a 12-day repeat cycle. The data are freely provided by the European Space Agency (ESA) (https://scihub.copernicus.eu/dhus/). It is a C-band SAR satellite. This satellite has four modes: Interferometric Wide Swath (IW), Extra Wide Swath (EW), Wave Mode (WV) and Stripmap (SM). In this study, Sentinel-1A IW Level (L1) products are used. Twenty-six scenes of Sentinel-1A IW mode (VV) data from the ascending orbit are observed and available from May 2, 2015 to April 9, 2017.
COSMO-SkyMED and Sentinel-1A data information used in this study
| Sensor | COSMO-SkyMED | Sentinel-1A |
|---|---|---|
| Imaging mode | Pingpong | Interferometric Wide swath |
| Band | X | C |
| Wavelength (cm) | 3.1 | 5.6 |
| Polarization | HH | VV |
| Orbit type | Ascending | Ascending |
| Number of images | 12 | 26 |
| Data range | 21 July 2011 ~ 14 July 2012 | 2 May 2015 ~ 27 January 2017 |
2.3 Leveling measurements
Four second-order leveling stations (labeled as L1-L4) (Figure 2) located in Tianning, Xinbei and Wujin are used to monitor land subsidence in Changhzou, with the observation once every two years. The leveling survey data is from September 2006 to September 2014. Leveling data (from 2011 to 2012) are used to validate the InSAR results.
2.4 Groundwater level
In Changzhou, the main layer from which groundwater extracted is the second confined aquifer. To explore the relationship between the variation of the water-table and the land deformation, groundwater-table data of the second confined aquifer, obtained from six water wells (labelled as W1 to W6 in Figure 2), were used in this study. These data were provided by the Jiangsu Province Hydrology and Water Resources Investigation Bureau.
2.5 SRTM DEM
The Shuttle Radar Topography Mission (SRTM) is a NASA mission conducted in 2000 to obtain elevation data for most of the world. It is the current dataset of choice for digital elevation model data (DEM) since it has a fairly high resolution (about 90 meters) and near-global coverage (from 56° S to 60° N). SRTM DEM has been publicly released in 2003, and revised many times. Data used for this study is the version 4.1 [21]. SRTM DEM was used to remove the topographic phase of interferometric phase.
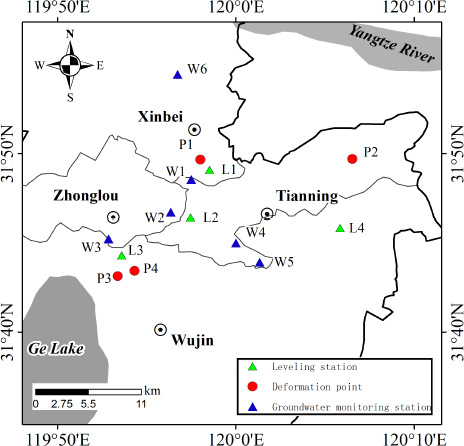
The location of leveling stations, deformation points and groundwater monitoring stations distributed in the study area.
3 Method
3.1 SBAS-InSAR principle
SBAS-InSAR is a newly developed DInSAR-based time-series analysis method first proposed by Berardino et al. [12]. Over the past decade, SBAS algorithm has been improved constantly and widely used in surface deformation studies [13, 14, 15, 16, 17, 18, 19, 20, 21, 22, 23,]. In the analysis, all SAR images are subject to random combinations and form interference pairs.
Supposing there are SAR images with N+1 scenes covering the same area with acquisition times of t0, t1 ... tN, and an image from each scene can form an interference pair with at least one image of another scene. The SAR images whose vertical baselines are below the threshold of small baseline condition are grouped together to generate a total of L candidate images and M differential interferograms. M satisfies the following inequality (assuming N is an odd number):
If all of the differential interferograms are correctly unwrapped, they can be calibrated by a highly coherent point (x0, r0) that is stable or whose deformation magnitude is known. For a specific interferogram i.e., after the removal of the flat earth and topographic phases, and assume tB> t A (tA, tB are the two acquisition dates of the co-registered image pair for the interferogram i), then in a coordinate system of azimuth-range (x, r), the interferometric phase of a single-look slow-varying filtered phase (SFP) pixel (x, r) in the differential interferogram i can be expressed as follows:
where λ is the center wavelength of the imaging radar system, d(tB, x, r)and d(tA, x, r) represent the relative displacement in the direction of the radar line of sight (LOS) at times tB and t A, respectively.
After phase unwrapping, the linear deformation and DEM error phase can be used to construct a new SBAS linear equation:
where B is an M × N matrix, and C is the coefficient matrix related to the space-baseline distance. p0 is given by
where v represents the phase-value matrix of the average deformation rate.
The linear deformation phase and DEM errors are removed from the interferogram to generate the residual phases, which now include the atmospheric delay phase, non–linear deformation phase and decoherence noises. Subsequently, filtering is performed based on the different temporal and spatial properties of the residual phases, thereby separating the non–linear deformation phase and atmospheric delay phase. Finally, time series deformation results can be obtained by applying a least square (LS) method [22] or singular value decomposition (SVD) rule to all of the unwrapped interferograms.
3.2 SBAS-InSAR processing
Land displacement in Changzhou was mapped with the ENVI SARscape software developed by ESRI company. This software provided SBAS-InSAR processing method. The SBAS-InSAR is used to divide the generated SAR data into several groups to suppres the effect of spatial-temporal de-coherence. In the SBAS InSAR approach, thresholds of spatial-temporal baseline and Doppler centroid difference were applied to generate interferograms with SAR image pairs that maximize the InSAR coherence. In this study, only the spatial-temporal baseline was considered since the Doppler centroid difference was negligible. Spatial baseline smaller than 800 m and 300 m, the temporal interval smaller than 300 days and 500 days for images in COSMO-SkyMED and Sentinel-1A respectively. Under such design, 37 interferograms in the X-band (Figure 3(a)), and 67 interferograms in the C-band (Figure 3(b)) were generated (Figure 3(c))
Each interferometry pair that meets the temporal and spatial criteria was processed to form a DInSAR interferogram using the two-tracked method, which mainly consists of image registration and baseline estimation, interferogram generation, coherence coefficient calculation, external DEM simulation, precise baseline estimation based on precise orbits and control point data, interferogram adaptive filtering calculation [24], phase unwrapping and refinement and reflattening. To dampen the noises, boost coherence, and examine the deformation at a relatively large scale, interferograms were subject to a multi-look treatment using 11 azimuth looks and 10 range looks for COSMO-SkyMED and 1 azimuth looks and 5 range looks for Sentinel-1A. The minimum cost flow algorithm is applied for phase unwrapping [25].
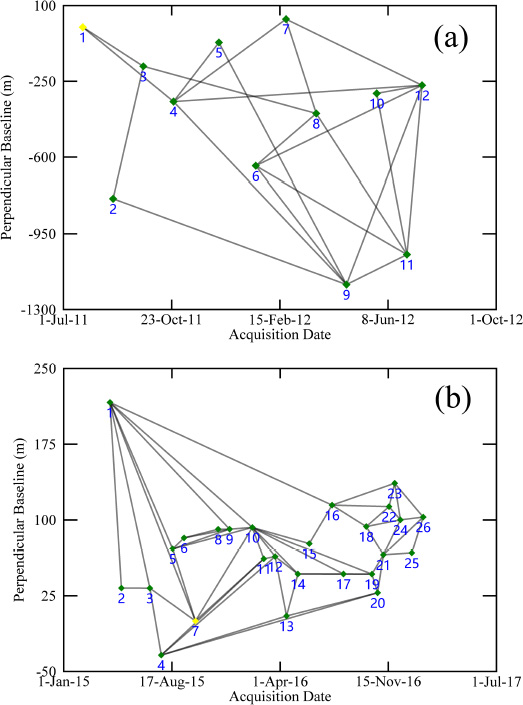
Distribution of small-baseline pairs. (a) COSMO-SKeMED. (b) Sentinel-1A
The unwrapped phases of 16 differential interferometry pairs were processed as follows. First, the differential interferometric phase was used to estimate the linear deformation phase of the study area. Then the linear deformation phase was transformed to a LOS directional deformation rate. Subsequently, the linear deformation phase and residual topographic phase were removed from the original differential interferometric phase before the residual phase was phase unwrapped and the SVD (singular value decomposition) was used to solve the non–linear deformation phase, which culminated in the generation of a cumulative deformation time-series phase. To estimate the atmospheric delay phase, the data were subjected to high-pass (HP) filtering in the time domain followed by low-pass (LP) filtering in the space domain; subsequently the atmospheric delay phase were separated from the data.
4 Results and analyses
4.1 Time evolution of land deformation
Annual land deformation maps are produced from ENVI SARscape processing. Figure 4 shows the deformation calculate with COSMO-SkyMED data (Figure 4(a)) and Sentinel-1A data (Figure 4(b)) The deformation rate from 2011 to 2012 calculated with COSMO-SkyMED data was – 55 ~ +30 mm/year. The deformation rate from 2015 to 2017 calculated with Sentinel-1A data was – 40 ~ +36 mm/year. Three subsidence zones concentrate on Xinbei, Tianning and Wujin districts marked with A, B and C respectively. There are detected in COSMO-SkyMED data. With the implementation of control measures for land subsidence by the Government, the subsidence zones of these three zones have been controlled effectively and zone C in Wujin District presents land rebound obviously (Figure 4(b))
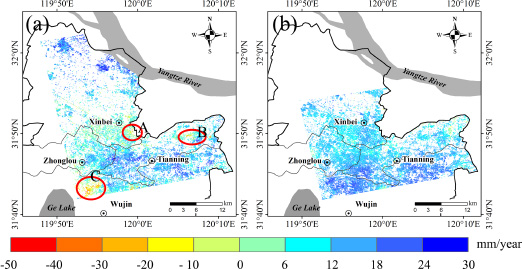
Deformation rates projected onto the vertical direction for COSMO-SkyMED and Sentinel-1A data at the selected study area. A, B and C represent the regions with serious land subsidence (a) COSMO-SkyMED measurements, (b) Sentinel-1A measurements.
4.2 InSAR accuracy assessment
Land deformation calculated from SBAS-InSAR method is along LOS (line of sight) direction, but the leveling measurement is along the vertical. In order to insure the comparability of InSAR measurements and leveling measurement, the InSAR measurements (include COSMO-SkyMED and Sentinel-1A result) were projected to the vertical direction. In this study, leveling measurements from 2011 to 2012 were used to assess InSAR measurements accuracy. To compare InSAR measurements with those from leveling benchmarks, SFPs that lie within 100 mpf benchmarks are selected and then average displacement values around benchmarks. Through the above operation, leveling and InSAR measurements are in the same spatial frames. The comparison results indicated great agreement between InSAR and leveling measurements. With a minimum and maximum difference of 1.2 mm/year and 3.0 mm/year, respectively (Table 2). Measurement of land deformation based on individual interferograms can often be affected by artifacts due to temporal change in atmospheric delay and error. In satellite orbit and topographic data used, all of these factors that tend to affect the In-SAR accuracy. With SBAS-InSAR method described in section 3, atmosphere, baseline and other artifacts can be reduced effectively.
The deformation results of SBAS-InSAR from July 21th 2011 to July 14th 2012 compared with leveling data.
| Points | SBAS-InSAR (mm) | Leveling (mm) | Error (mm) |
|---|---|---|---|
| L1 | 5.0 | 3.0 | 2.0 |
| L2 | -1.9 | 0.1 | -2.0 |
| L3 | 0.5 | -1.0 | 1.5 |
| L4 | 3.2 | 2.9 | 0.3 |
4.3 land deformation in Changzhou from 2011 to 2017
As the data acquisition time of COSMO-SkyMED is from July 21th 2011 to July 14th 2012 and Sentinel-1A data is from April 8th 2015 to January 27th 2017, there is a data gap between them (from July 14th 2012 to April 8th 2015). To fill the gap, average deformation rates during July 21th 2011 to July 14th 2012 are used to connect two types of land deformation of the time serious.
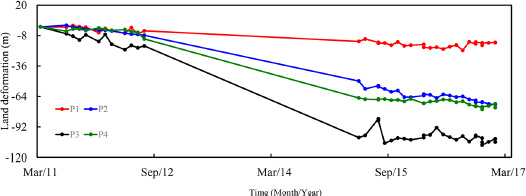
Land deformation of P1, P2, P3 and P4.
In order to better analyze the development of deformation in land subsidence areas, four land subsidence points marked with P1, P2, P3 and P4 are selected (Figure 5). The annual land subsidence rate of P1 to P4 in Figure 4 was −2.48 mm/year, −12.78 mm/year, −18.09 mm/year, and −12.69 mm/year respectively, and the accumulative land subsidence value of P1 to P4 in Figure 5 was −14.54 mm, −71.31 mm, −105.92 mm, and −74.27 mm respectively (Figure 5). The variation trends at the four points may suggest that the subsidence in these areas may continue for a while. An investigation of land subsidence in the Changzhou city by Hu indicated that over the exploitation of groundwater for industrial purposes was the main cause of land subsidence [26].
5 Discussions
5.1 The historical land subsidence in Changzhou
According to the historical leveling survey data, land subsidence in Changzhou started in the year of 1970 and reached 50.63 mm/year between 1979 and 1983, with the maximal subsidence up to 100 mm. Between 1984 and 1991, there was a subsidence rate of 40–50 mm/year that led to a maximal cumulative subsidence of 949 mm in some of the central urban areas. The average subsidence rate was about 40 mm/year between 1993 and 1998 [26]. Since 1996, the government started limiting groundwater withdrawal [27]. Land subsidence in Changzhou showed a slowdown since 2000, at which time a subsidence rate of approximately 25 mm/year was observed. After 2004, except for the eastern part of Changzhou, land subsidence had been effectively curbed. A slight rebound occurred in some areas, and the rebound area gradually expanded. By 2007, urban land subsidence slowed down and many regions of urban areas start to rebound [26].
From July 21th 2011 to July 14th 2012 in this study (Figure 4(a)), land subsidence still occurred in parts of Xinbei District and Wujin District. The average subsidence rate was −7 mm/year at subsidence area of Xinbei District (e.g. the region A in the Figure 4(a)) and −15 mm/year at subsidence area of Wujin District (e.g. the region B in the Figure 4(a)). There is also a settlement phenomenon in the east part of Tianning (e.g. the region C in the Figure 4(a)), and the average subsidence rate was −5 mm/year. In addition, there was a slight rebound at an uplift rate of 4 mm/year in central urban districts (e.g., Zhonglou District and the west part of Tianning District).
From April 8th 2015 to January 27th 2017 results (Figure 3(b)), land subsidence in Xinbei, Tianning, Zhonglou and Wujin district has been controlled efficaciously. The average land subsidence rate of A, B and C is 0 mm/year, −1 mm/year and +6 mm/year. Although land subsidence in A, B and C region slow down, the future attention is also required to monitor land subsidence over this area.
5.2 The relationship between land deformation and groundwater exploitation
Figure 6 shows a sketch of the vertical cross-section of confined aquifers in Changzhou, which had abundant confined groundwater resources [27, 28, 29]. In the urban areas of Changzhou, the second deep confined aquifer was the main layer of groundwater extraction and the volume of groundwater exploitation has reached a considerable scale since the 1980s [27]. The mining of deep confined aquifer was at it’s minimum before 1960, but it was significantly enhanced during 1960-1970 when the social and economic development began to accelerate and led to insufficient urban water supply. Between 1970 and 1994, large water-consumption industries (e.g., printing, dyeing and textile) were developed swiftly, which caused massive exploration of groundwater resource in the surrounding towns and villages. Such exploration gradually surpassed the mining quantity of central urban districts. Thus, Changzhou experienced a drastic groundwater withdrawal during this period. After 1994, the local government realized the potential environmental damage due to excessive exploitation of groundwater, and formulated a series of rules and regulations to restrict groundwater extraction [26]. Miao et al. discovered that in Changzhou, changes in the confined water level II correlated well with the land subsidence trend. Excessive withdrawal of groundwater was the most critical factor leading to large-scale land subsidence in the city [27].
Since 2000, exploitation of groundwater has been prohibited in Changzhou city and measures were taken to recharge the depleted areas. Since 2005, a widespread increase of groundwater level has been recorded [26]. Since then, subsidence slowed down in Zhonglou and Tianning districts, alongside a slight land rebound was even observed [18, 19, 20, 21, 22, 23, 24, 25, 26, 27,]. From 2002 to 2009, Wujin had experienced a rapid industrial development that has led to a tremendous need of groundwater, lowering the groundwater table and deteriorating the land subsidence [28].
Figure 7 shows the relationship between land deformations with groundwater levels of the confined aquifer exploitation wells, (W1-W5) (Figure 7) from July 2011 to July 2012. The wells (W1-W5) were applied to exploit confined water for industrial production and the groundwater level of these wells was recorded. As the groundwater level data only covered the data acquisition time of COSMO-SkyMED, the analysis based on COSMO-SkyMED data. There is a strong correlation between the land subsidence and groundwater depth (Figure 7). The land subsidence increases with the increase of groundwater depth (i.e. decrease of groundwater level). With the groundwater rebound 2.39 m, 1.07 m, −0.51 m, 4.37 m, 4.33m and 0.9 m, the land rebound 2.95 mm, 2.95 mm, −1.79 mm, 9.14 mm, 0.92 mm and 2.60 mm in W1, W2, W3, W4, W5 and W6 respectively.
Cumulative displacements at locations P1-P4 (Figure 5) in the subsidence zone. The blue lines represent the water level.
6 Conclusion
In this study, a time series of COSMO-SkyMed images from July 2011 to July 2012 and Sentinel-1A images from April 8th 2015 to January 27th 2017 with SBAS-InSAR method employed to map the spatial and temporal variations of land deformation in Changzhou City. Combining InSAR results, level observations and measurements of the groundwater level of the second confined aquifer. Concluded the following results: first, the leveling observations were used to assess the accuracy of InSAR measurement, and the result showed that the error of InSAR annual subsidence results was within 2 mm. It indicated that SBAS-InSAR method could be used in monitoring land deformation. Second, three main land subsidence zones were detected at Xin-bei, Tianning and Wujin District. Four subsidence points were selected to analyze the temporal and spatial evolution characteristics of land subsidence. The subsidence rate of P1 to P4 was −2.48 mm/year, −12.78 mm/year, −18.09 mm/year, and −12.69 mm/year respectively. Land subsidence over Changzhou showed a trend of slowing down from 2011 to 2017, especially in Wujin District. Third, InSAR derived land deformation correlates with the water level change in six groundwater stations. This is indicated by the groundwater rebound, the land rebound, and the maximum rebound vale reached 9.13 mm.
With the enormous urban sprawl and mass construction in Changzhou City, monitoring land deformation with InSAR technology can provide a precise and economic means to image land deformation and movements of fissures and faults and the associated geohazards. Not only is it a great way to picture the characteristics of spatial/temporal evolution and mechanism of land deformation, but it also provides independent unparalleled data for the further geological and geophysical interpretation. It is eventually enhancing disaster prevention and mitigation. Which is essential for protecting the lives of others’ and property.
Our future study will continue the monitoring of land deformation in Yangtze River Delta region using multiple radar satellites including COSMO-SkyMed, Sentinel-1/A, Radarsat-2, and ALOS-2. With SAR acquisitions, multiple sensors with different imaging geometries will be developed to improve the accuracy of InSAR measurements. Various observations can also enhance the accuracy of deformation decomposition to generate precise three-dimensional deformation components.
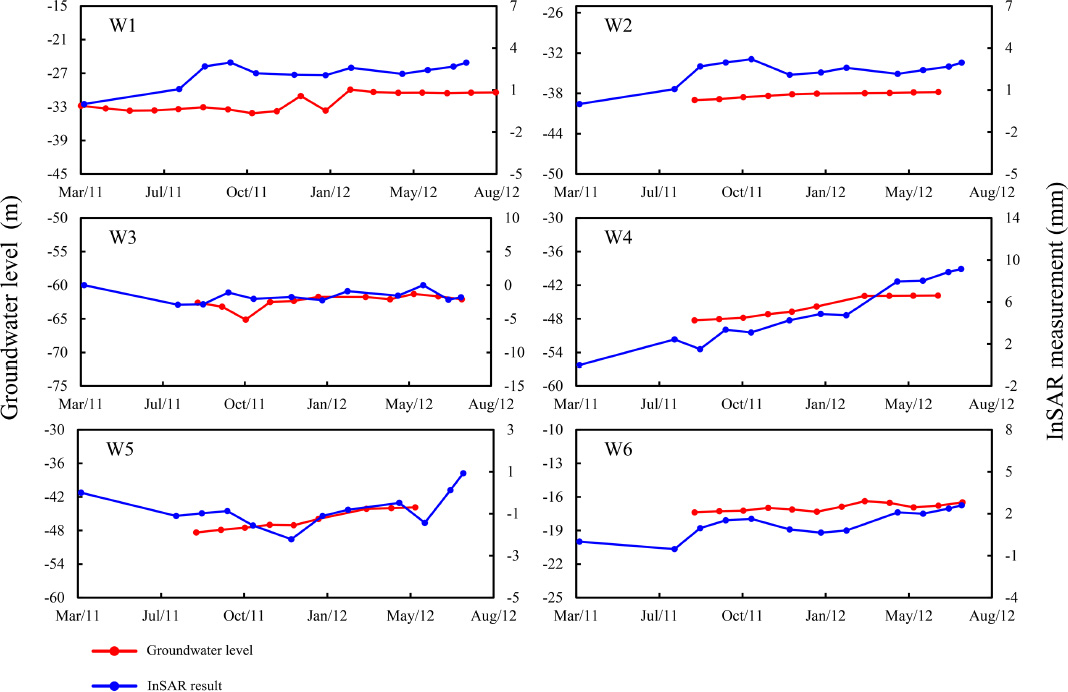
Groundwater table level and land deformation from 2011 to 2012 at the groundwater wells in Changzhou. Stations W1 to W6 are the water wells marked in Figure 5. The red dots indicate InSAR measured displacement value and blue dots indicate ground water level value.
Acknowledgement
This work was supported by National Natural Science Foundation of China (No. 41601497, No. 41474001), China Postdoctoral Science Foundation funded project (No. 2017M621716), National Key R&D Program of China (2017YFB0504205), and NJUPT Research Project (NY214195).
References
[1] Geological Survey Offlce, Study on the land subsidence in Su-Xi-Chang area. Geological Survey Institute of Jiangsu Province, 2003(in Chinese).Search in Google Scholar
[2] Zhang Y., Xue Y. Q., Wu J. C., Shi X. Q., Yu J., Excessive groundwater withdrawal and resultant land subsidence in the Su–Xi–Chang area, China. Environ. Earth Sci., 2010, 61(6), 1135–114310.1007/s12665-009-0433-6Search in Google Scholar
[3] Gabriel A. K., Goldstein R. M., Zebker H. A., Mapping small elevation changes over large areas: differential radar interferometry. J. Geophys. Res.: Solid Earth (1978–2012), 1989, 94(B7), 9183-9191,10.1029/JB094iB07p09183Search in Google Scholar
[4] Tomás R., Márquez Y., Lopez-sanchez J. M., Delgado J., Blanco P., Mallorquí J. J., Martinez M., Herrera G., Mulas J., Mapping ground subsidence induced by aquifer overexploitation using advanced Differential SAR Interferometry: Vega Media of the Segura River (SE Spain) case study. Remote Sens. Environ., 2005, 98(2-3), 269-28310.1016/j.rse.2005.08.003Search in Google Scholar
[5] Zhou X. B., Chang N. B., Li S. S., Applications of SAR interferometry in earth and environmental science research. Sensors, 2009, 9(3), 1876-191210.3390/s90301876Search in Google Scholar PubMed PubMed Central
[6] Yerro A., Corominas J., Monells D.,MallorquíJ. J., Analysis of the evolution of ground movements in a low densely urban area by means of DInSAR technique. Eng. Geol., 2014, 170, 52-6510.1016/j.enggeo.2013.12.002Search in Google Scholar
[7] Atzori S., Hunstad I., Chini M., Salvi S., Tolomei C., Bignami C., Stramondo S., Trasatti E., Antonioli A., Boschi E., Finite fault inversion of DInSAR coseismic displacement of the 2009 L’Aquila earthquake (central Italy). Geophys. Res. Lett., 2009, 36(15), 1-610.1029/2009GL039293Search in Google Scholar
[8] Tomás R., Cano M., García-Barba J., Vicente F., Herrera G., Lopez-Sanchez J. M., Mallorquí J. J., Monitoring an earthfill dam using differential SAR interferometry: La Pedrera dam, Alicante, Spain. Eng. Geol., 2013,157, 21-3210.1016/j.enggeo.2013.01.022Search in Google Scholar
[9] Ge L. L., Ng A. H. M., Li X. J., Abidin H. Z., Gumilar I., Land subsidence characteristics of Bandung Basin as revealed by ENVISAT ASAR and ALOS PALSAR interferometry. Remote Sens. Environ., 2014, 154(SI), 46-6010.1016/j.rse.2014.08.004Search in Google Scholar
[10] Liu G. X., Jia H. G., Zhang R., Zhang H. X., Jia H. L., Yu B., Sang M. Z., Exploration of subsidence estimation by persistent scatterer InSAR on time series of high resolution TerraSAR-X images. IEEE J. Sel. Top. Appl. Earth Observ. Remote Sens., 2011, 4(1), 159-17010.1109/JSTARS.2010.2067446Search in Google Scholar
[11] Ferretti A., Prati C., Rocca F., Permanent scatterers in SAR interferometry. IEEE Trans. Geosci. Remote Sens., 2001 39(1), 8-2010.1109/IGARSS.1999.772008Search in Google Scholar
[12] Berardino P., Fornaro G., Lanari R., Sansosti E., A new algorithm for surface deformation monitoring based on small baseline differential SAR interferograms. IEEE Trans. Geosci. Remote Sens., 2002, 40(11), 2375-238310.1109/TGRS.2002.803792Search in Google Scholar
[13] Tizzani P., Berardino P., Casu F., Euillades P., Manzo M., Ricciardi G. P., Zeni G., Lanari R., Surface deformation of Long Valley caldera and Mono Basin, California, investigated with the SBAS-InSAR approach. Remote Sens. Environ., 2007, 108(3), 277-28910.1016/j.rse.2006.11.015Search in Google Scholar
[14] Canova F., Tolomei C., Salvi S., Toscani G., Seno S., Land subsidence along the Ionian coast of SE Sicily (Italy), detection and analysis via Small Baseline Subset (SBAS) multitemporal differential SAR interferometry. Earth Surf. Process. Landf., 2012, 37(3), 273-28610.1002/esp.2238Search in Google Scholar
[15] Lubitz C., Motagh M., Wetzel H., Anderssohn J., TerraSAR-X Time series uplift monitoring in Staufen, South-West Germany. Proceedings of IEEE International Geoscience and Remote Sensing Symposium (IGARSS), Munich, Germany. 2012, 1306-130910.1109/IGARSS.2012.6351298Search in Google Scholar
[16] CalòF., Ardizzone F., Castaldo R., Lollino P., Tizzani P., Guzzetti F., Lanari R., Angeli M. G., Pontoni F., Manunta M., Enhanced landslide investigations through advanced DInSAR techniques: The Ivancich case study, Assisi, Italy. Remote Sens. Environ., 2014, 142, 69-8210.1016/j.rse.2013.11.003Search in Google Scholar
[17] Hu B., Wang H. S., Sun Y. L., Hou J. G., Liang J., Long-Term Land Subsidence Monitoring of Beijing (China) Using the Small Baseline Subset (SBAS) Technique. Remote Sens., 2014, 6(5), 3648-366110.3390/rs6053648Search in Google Scholar
[18] Wang G.Y., You G., Shi B., Yu J., Tuck M., Long-term land subsidence and strata compression in Changzhou, China. Eng. Geol., 2009, 104(1), 109-11810.1016/j.enggeo.2008.09.001Search in Google Scholar
[19] Xu Y. S., Yuan Y., Shen S. L., Yin Z. Y., Wu H. N., Ma L., Investigation into subsidence hazards due to groundwater pumping from Aquifer II in Changzhou, China. Nat. Hazards, 2015, 78(1), 281-29610.1007/s11069-015-1714-xSearch in Google Scholar
[20] Wang G. Y., You G., Shi B., Yu J., Tuck M., Long-term land subsidence and strata compression in Changzhou, China. Eng. Geol., 2009, 104(1), 109-11810.1016/j.enggeo.2008.09.001Search in Google Scholar
[21] Farr T. G., Rosen P. A., Caro E., Crippen R., Duren R., Hensley S., Kobrick M., Paller M., Rodriguez E., Roth L., Seal D., Shaffer S., Shimada J.,Umland J., Werner M., Oskin M., Burbank D., Alsdorf D., The shuttle radar topography mission. Rev. Geophys., 2007, 45(2), 1-3310.1029/2005RG000183Search in Google Scholar
[22] Usai S., A least squares database approach for SAR interferometric data. IEEE Trans. Geosci. Remote Sens., 2003, 41(4), 753-76010.1109/TGRS.2003.810675Search in Google Scholar
[23] Lanari R., Mora O., Manunta M., MallorquíJ. J., Berardino P., Sansosti E., A small-baseline approach for investigating deformations on full-resolution differential SAR interferograms. IEEE Trans. Geosci. Remote Sens., 42(7), 2004, 1377-138610.1109/TGRS.2004.828196Search in Google Scholar
[24] Goldstein R. M., Werner C. L., Radar interferogram filtering for geophysical applications. Geophys. Res. 1998, Lett., 25(21), 4035-403810.1029/1998GL900033Search in Google Scholar
[25] Eineder M., Hubig M., Milcke B., Unwrapping large interferograms using the minimum cost flow algorithm. Proceedings of the1998 International Geoscience and Remote Sensing Symposium (IGARSS 98) on Sensing and Managing the Environment, Seattle, Washington, USA, 1998, 6-10, 83-8710.1109/IGARSS.1998.702806Search in Google Scholar
[26] Hu J. P., A Study on the Land Subsidence Effect after Prohibiting Extraction of Groundwater in Suzhou-Wuxi-Changzhou Area, China. Phd thesis, Nanjing University, China, 2011 (in Chinese)Search in Google Scholar
[27] Miao X. T., Zhu X. X., Lu M. L., Chen F. C., Huangfu A. F., Ground Water Exploration of Confined Aquifer II and Land Subsidence Control Suzhou-Wuxi-Changzhou Area. Chinese J. Geol. Hazard Control., 2007, 18(2), 132-139, (in Chinese)Search in Google Scholar
[28] Zhang Y., Xue Y. Q., Wu J. C., Ye S. J., Wei Z. X., Li Q. F., Yu J., Characteristics of aquifer system deformation in the Southern Yangtse Delta, China. Eng. Geol., 2007, 90(3), 160-17310.1016/j.enggeo.2007.01.004Search in Google Scholar
[29] Shi X. Q., Wu J. C., Ye S. J., Zhang Y., Xue Y. Q., Wei Z. X., Li Q. F., Yu J., Regional land subsidence simulation in Su-Xi-Chang area and Shanghai City, China. Eng. Geol., 2008, 100(1), 27-4210.1016/j.enggeo.2008.02.011Search in Google Scholar
© 2018 Deliang Chen et al., published by De Gruyter
This work is licensed under the Creative Commons Attribution-NonCommercial-NoDerivatives 4.0 License.
Articles in the same Issue
- Regular Articles
- Spatio-temporal monitoring of vegetation phenology in the dry sub-humid region of Nigeria using time series of AVHRR NDVI and TAMSAT datasets
- Water Quality, Sediment Characteristics and Benthic Status of the Razim-Sinoie Lagoon System, Romania
- Provenance analysis of the Late Triassic Yichuan Basin: constraints from zircon U-Pb geochronology
- Historical Delineation of Landscape Units Using Physical Geographic Characteristics and Land Use/Cover Change
- ‘Hardcastle Hollows’ in loess landforms: Closed depressions in aeolian landscapes – in a geoheritage context
- Geostatistical screening of flood events in the groundwater levels of the diverted inner delta of the Danube River: implications for river bed clogging
- Utilizing Integrated Prediction Error Filter Analysis (INPEFA) to divide base-level cycle of fan-deltas: A case study of the Triassic Baikouquan Formation in Mabei Slope Area, Mahu Depression, Junggar Basin, China
- Architecture and reservoir quality of low-permeable Eocene lacustrine turbidite sandstone from the Dongying Depression, East China
- Flow units classification for geostatisitical three-dimensional modeling of a non-marine sandstone reservoir: A case study from the Paleocene Funing Formation of the Gaoji Oilfield, east China
- Umbrisols at Lower Altitudes, Case Study from Borská lowland (Slovakia)
- Modelling habitats in karst landscape by integrating remote sensing and topography data
- Mineral Constituents and Kaolinite Crystallinity of the <2 μm Fraction of Cretaceous-Paleogene/Neogene Kaolins from Eastern Dahomey and Niger Delta Basins, Nigeria
- Construction of a dynamic arrival time coverage map for emergency medical services
- Characterizing Seismo-stratigraphic and Structural Framework of Late Cretaceous-Recent succession of offshore Indus Pakistan
- Geosite Assessment Using Three Different Methods; a Comparative Study of the Krupaja and the Žagubica Springs – Hydrological Heritage of Serbia
- Use of discriminated nondimensionalization in the search of universal solutions for 2-D rectangular and cylindrical consolidation problems
- Trying to underline geotourist profile of National park visitors: Case study of NP Fruška Gora, Serbia (Typology of potential geotourists at NP Fruška Gora)
- Fluid-rock interaction and dissolution of feldspar in the Upper Triassic Xujiahe tight sandstone, western Sichuan Basin, China
- Calcified microorganisms bloom in Furongian of the North China Platform: Evidence from Microbialitic-Bioherm in Qijiayu Section, Hebei
- Spatial predictive modeling of prehistoric sites in the Bohemian-Moravian Highlands based on graph similarity analysis
- Geotourism starts with accessible information: the Internet as a promotional tool for the georesources of Lower Silesia
- Models for evaluating craters morphology, relation of indentation hardness and uniaxial compressive strength via a flat-end indenter
- Geotourism in an urban space?
- The first loess map and related topics: contributions by twenty significant women loess scholars
- Modeling of stringer deformation and displacement in Ara salt after the end of salt tectonics
- A multi-criteria decision analysis with special reference to loess and archaeological sites in Serbia (Could geosciences and archaeology cohabitate?)
- Speleotourism in Slovenia: balancing between mass tourism and geoheritage protection
- Attractiveness of protected areas for geotourism purposes from the perspective of visitors: the example of Babiogórski National Park (Poland)
- Implementation of Heat Maps in Geographical Information System – Exploratory Study on Traffic Accident Data
- Mapping War Geoheritage: Recognising Geomorphological Traces of War
- Numerical limitations of the attainment of the orientation of geological planes
- Assessment of runoff nitrogen load reduction measures for agricultural catchments
- Awheel Along Europe’s Rivers: Geoarchaeological Trails for Cycling Geotourists
- Simulation of Carbon Isotope Excursion Events at the Permian-Triassic Boundary Based on GEOCARB
- Morphometry of lunette dunes in the Tirari Desert, South Australia
- Multi-spectral and Topographic Fusion for Automated Road Extraction
- Ground-motion prediction equation and site effect characterization for the central area of the Main Syncline, Upper Silesia Coal Basin, Poland
- Dilatancy as a measure of fracturing development in the process of rock damage
- Error-bounded and Number-bounded Approximate Spatial Query for Interactive Visualization
- The Significance of Megalithic Monuments in the Process of Place Identity Creation and in Tourism Development
- Analysis of landslide effects along a road located in the Carpathian flysch
- Lithological mapping of East Tianshan area using integrated data fused by Chinese GF-1 PAN and ASTER multi-spectral data
- Evaluating the CBM reservoirs using NMR logging data
- The trends in the main thalweg path of selected reaches of the Middle Vistula River, and their relationships to the geological structure of river channel zone
- Lithostratigraphic Classification Method Combining Optimal Texture Window Size Selection and Test Sample Purification Using Landsat 8 OLI Data
- Effect of the hydrothermal activity in the Lower Yangtze region on marine shale gas enrichment: A case study of Lower Cambrian and Upper Ordovician-Lower Silurian shales in Jiangye-1 well
- Modified flash flood potential index in order to estimate areas with predisposition to water accumulation
- Quantifying the scales of spatial variation in gravel beds using terrestrial and airborne laser scanning data
- The evaluation of geosites in the territory of National park „Kopaonik“(Serbia)
- Combining multi-proxy palaeoecology with natural and manipulative experiments — XLII International Moor Excursion to Northern Poland
- Dynamic Reclamation Methods for Subsidence Land in the Mining Area with High Underground Water Level
- Loess documentary sites and their potential for geotourism in Lower Silesia (Poland)
- Equipment selection based on two different fuzzy multi criteria decision making methods: Fuzzy TOPSIS and fuzzy VIKOR
- Land deformation associated with exploitation of groundwater in Changzhou City measured by COSMO-SkyMed and Sentinel-1A SAR data
- Gas Desorption of Low-Maturity Lacustrine Shales, Trassic Yanchang Formation, Ordos Basin, China
- Feasibility of applying viscous remanent magnetization (VRM) orientation in the study of palaeowind direction by loess magnetic fabric
- Sensitivity evaluation of Krakowiec clay based on time-dependent behavior
- Effect of limestone and dolomite tailings’ particle size on potentially toxic elements adsorption
- Diagenesis and rock properties of sandstones from the Stormberg Group, Karoo Supergroup in the Eastern Cape Province of South Africa
- Using cluster analysis methods for multivariate mapping of traffic accidents
- Geographic Process Modeling Based on Geographic Ontology
- Soil Disintegration Characteristics of Collapsed Walls and Influencing Factors in Southern China
- Evaluation of aquifer hydraulic characteristics using geoelectrical sounding, pumping and laboratory tests: A case study of Lokoja and Patti Formations, Southern Bida Basin, Nigeria
- Petrography, modal composition and tectonic provenance of some selected sandstones from the Molteno, Elliot and Clarens Formations, Karoo Supergroup, in the Eastern Cape Province, South Africa
- Deformation and Subsidence prediction on Surface of Yuzhou mined-out areas along Middle Route Project of South-to-North Water Diversion, China
- Abnormal open-hole natural gamma ray (GR) log in Baikouquan Formation of Xiazijie Fan-delta, Mahu Depression, Junggar Basin, China
- GIS based approach to analyze soil liquefaction and amplification: A case study in Eskisehir, Turkey
- Analysis of the Factors that Influence Diagenesis in the Terminal Fan Reservoir of Fuyu Oil Layer in the Southern Songliao Basin, Northeast China
- Gravity Structure around Mt. Pandan, Madiun, East Java, Indonesia and Its Relationship to 2016 Seismic Activity
- Simulation of cement raw material deposits using plurigaussian technique
- Application of the nanoindentation technique for the characterization of varved clay
- Verification of compressibility and consolidation parameters of varved clays from Radzymin (Central Poland) based on direct observations of settlements of road embankment
- An enthusiasm for loess: Leonard Horner in Bonn and Liu Tungsheng in Beijing
- Limit Support Pressure of Tunnel Face in Multi-Layer Soils Below River Considering Water Pressure
- Spatial-temporal variability of the fluctuation of water level in Poyang Lake basin, China
- Modeling of IDF curves for stormwater design in Makkah Al Mukarramah region, The Kingdom of Saudi Arabia