Construction of a dynamic arrival time coverage map for emergency medical services
-
Adam Piórkowski


Abstract
This article presents a design of coverage maps for emergency journeys made by emergency medical services. The system was designed for the Malopolskie Voivodeship Office in Cracow, Poland. The proposed solution displays maps of the ambulance coverage of areas and ambulance’s potential journey times. There are two versions of the map: static and dynamic. The static version is used to appropriately allocate ambulances to cover an area with the ability to reach locations in less than 15 or 20 minutes; the dynamic version allows monitoring of ambulance fleets under normal conditions or in the event of a crisis.
The article also presents the results of archival data related to the movement of ambulances on the roads of Malopolskie Voivodship. Particular attention was paid to the relation between the speed of vehicles and the traffic on the road, the day of the week or month, and long-term trends. The collected observations made it possible to assume a general model of ambulance movement in the voivodeship to calculate arrival time coverage maps.
1 Background
Coverage maps are commonly associated with analyses of the availability of mobile telephony. These maps display areas according to the power of the available telecommunications signal, but this is not the only application. Various map solutions are implemented in the field of health and safety: for example, coverage maps can be created for the analysis of immunization areas [1] or the degree of patient choice and competition between Adult Congenital Heart Disease Centers, based on a feasible travel time of 120 minutes [2]. A similar case of hour service areas for hospital are presented in [3]. Another example is presented in [4], which describes a solution that provides the geographic information needed to support real-time routing of alerts for accidents to the nearest air medical transport service. This paper describes the authors’ development of the Atlas Database and the Air Medical Services Database. The map shows circular areas that can be reached by aircraft in 10, 20 or 30 minutes. Coverage maps can be also treated as a component of the Smart City solutions [5].
In the context of ambulance travel, some examples of coverage maps can be also given. In [6], polygon map overlays showing 8- and 15-minute arrival times for the city of Haifa are presented. Time-based Ambulance Zoning was presented in [7], and [8] presents simulation-based probability-of-coverage maps that demonstrate the probability that the nearest available ambulance can respond to a call. Probability-of-coverage maps are also mentioned in [9]. Another strategy to reduce the average response time from the initial call to the arrival of ambulances in Singapore using geospatial-time analysis is presented in [10] and are presented as coverage maps. Analysis of ambulance coverage within 10 minutes in Samsun, Turkey is the scope of [11]. [12] shows a solution which makes it possible to plan ambulance distribution to maximize the coverage efficiency for a given number of ambulances in any particular area in Johor Bahru (Malaysia). In [13], a predicted future call coverage map is discussed. [14] presents another solution in which maps display analyses of the fastest routes to incidents and the average response time with associated serviceability in North Dakota, USA. A computational model of demand, bases and distribution of hospitals in Melbourne is presented in [15]. An analysis of rural area coverage by EMS in Western Cape, South Africa is presented in [16]. The ambulance deployment and demand coverage for Odunpazari District (Turkey) is shown in [17] with a 5 minute response time as the goal. In [18], the probability of the nearest ambulance arriving within 4 minutes is presented for Toronto using the city road grid as the reference map. The general issue of ambulance redeployment has also been covered by numerous additional articles [12, 15, 19, 20, 21, 22, 23, 24, 25].
This papers outlines the construction and determination of ambulance coverage mapping that can be updated in real time. For a given area (represented by a properly prepared grid), it graphically represents the shortest driving time of a ambulance. The aforementioned solution was designed in 2015 for the Malopolskie Voivodship Office [26]; and includes not only static analysis of sample stationary ambulance patterns, but also real-time dynamic analysis of emergency situations.
2 Methods
2.1 Maps
The basic element of the project is the map. The WGS84 reference system is used for all visualizations and calculations. The project was limited to the map of the Malopolskie Voivodship. The most important issue here is the representation of the area in context of the visualization of the potential travel times of ambulances. In [27, 28], the analyzed area is represented as a grid of intersections; in [2], a coverage map defines travel times from general medical practitioners (a list of 11,631 postal codes) to ten ACHD (Adult Congenital Heart Disease) centers. The project described in this article assumes representation of an area as an orthogonal grid whose points are 250 m apart in urban areas, while 1000 m intervals are considered sufficient in rural areas. The grid G is constructed as a list of points Pi, for which each is assigned coordinates and a unique identifier.
where:
Pi - point of grid,
G - grid of points (set of points).
This solution allows for flexible representation of an area, with high-density classification in urban areas (Fig. 1, e.g. Cracow and neighborhoods) and low-density classification in areas where points are meaningless (e.g. lakes). Selected points can be moved to other representative locations, and special points such as hospitals or known fixed ambulance stations can be added.
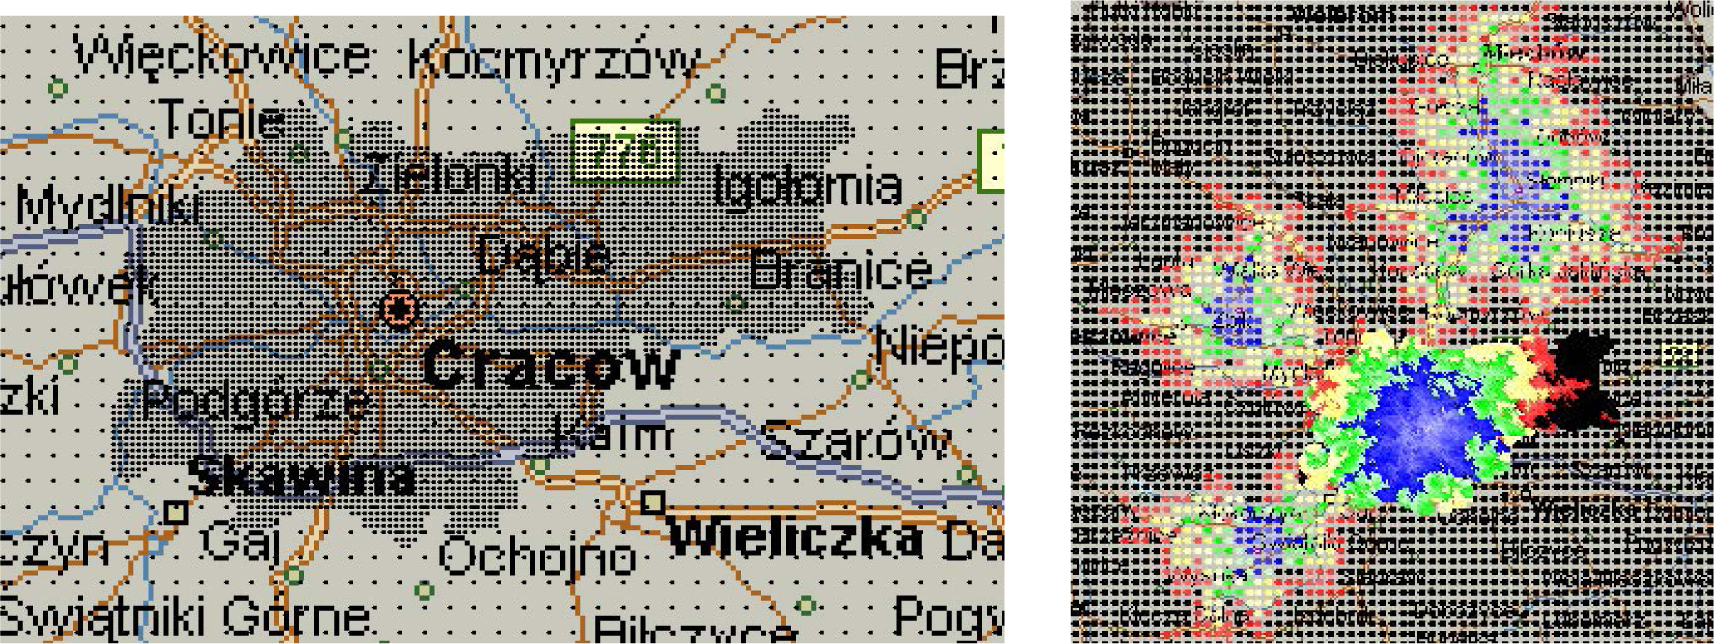
Grid example for Cracow and neighborhood
The locations of stationary ambulances A on standby are essential and are rounded to the closest grid point of G. In order to increase the accuracy of the point grid, the appropriate ambulance stationing points designated by the Voivodship Office were added. In Malopolskie Voivodeship, the number of ambulances is variable and was 119 at the time the project was created.
where
A - set of ambulances,
Ai - current location point of ambulance i, Ai is equal to Pj (closest point of grid G).
2.2 Determining the pre-calculated times of ambulance journeys
In order to determine the ambulance journey times for the entire coverage map in real-time, a map of pre-calculated travel times (PT) was created that shows travel times between any two points of the grid in both directions [29, 30, 31, 32].
where PT[x, y] - travel time from Px to Py.
Determining travel times for a map of pre-calculated values is time-consuming because of the Cartesian product of all possible routes, therefore limits are imposed that allow irrelevant calculations to be rejected [33]. A custom plug-in for MapPoint was used for this project; calculations were then made on a cluster of 30 computers with Intel Core i7 processors, which took a several days to complete a map of the city of Krakow (distance 250 m) and Malopolskie Voivodship (distance 1000 m).
2.3 The model of ambulance velocities
One very important issue is to choose the general model of velocities that are characteristic for ambulances [34]. The typical driving model used by Google Maps and MapPoint determines the characteristic speed values for five types of roads:
Interstates (motorways),
Limited access roads,
Other (major) roads,
Arterial (minor) roads,
Streets.
The standard values for vehicles complying with standard traffic rules are determined by the vector (104, 96, 80, 56, 32) [km/h]. However, in the case of ambulances, these speeds are considerably higher, and so based on data collected from real-world systems, the value of these speeds were determined. For this, a system for calculating the inverse problem was created [35]. A Monte Carlo algorithm was used to match the velocity values of the simulated ambulance journeys that were closest to historical data. In this way, a velocity vector (145, 121, 82, 71, 38) was compiled with a compensation error of 13%. Further consideration is needed however to determine whether this model is sufficient to describe traffic regardless of time of day, or day of the week or month.
2.4 Verification of the model based on instantaneous speeds
Creating an ambulance traffic model is not an easy issue. There are few works that theoretically or empirically estimate this form of vehicle movement model [8, 9, 18, 27]. The primary problem is determining whether periodic increases in road traffic actually affect travel times [36] with or without traffic signal control [37, 38]. The author used data obtained from the Malopolska Office which contain approx. 450,000,000 records describing the time, current position of the ambulance, its status and instantaneous speed. These data were collected in the period 2013-2017 (2017: I-VI) from GPS devices mounted in ambulances. Records were generated every 2 minutes when stationary and every 30 seconds when moving (technical or call-related). These data were analyzed for daily fluctuations of traffic congestion with an accuracy of one hour, and graphs of mean instantaneous velocities were constructed. Also shown were the days of the week, months, and variations in subsequent years. The research outlines are shown in the graphs (Fig. 2, 3).

Average ambulance instantaneous speed for the entire voivodship by hour and day of the week; E - emergency trip, T - technical trip
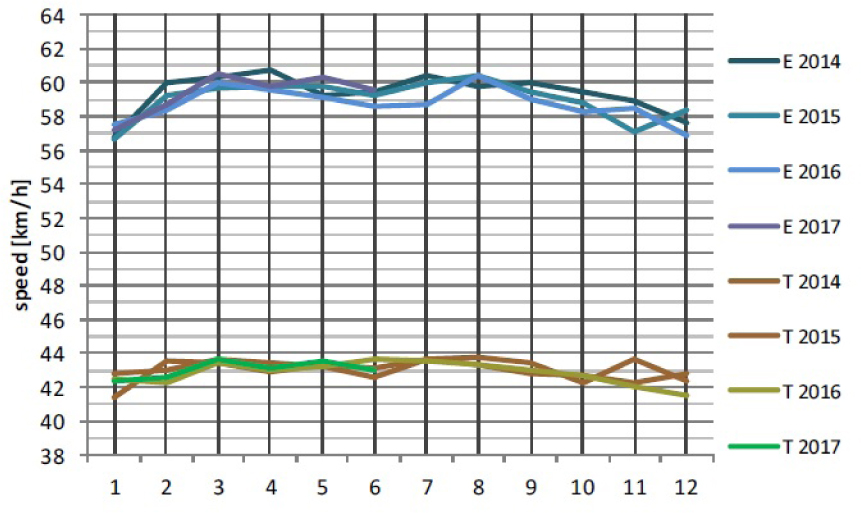
Average ambulance instantaneous speed for the entire voivodship by month; E - emergency trip, T - technical trip
Analysis of the results allowed many intriguing conclusions to be drawn. The most important conclusion is that despite peak traffic, ambulance speeds on emergency callouts do not significantly change (max 2-4 km/h, in opposite to Shenzhen, [39]). This can be explained by the use of special bus lanes in cities and the culture of the drivers on the roads. This explanation also confirms the result that during technical trips (i.e. non-emergency), there is a significant reduction in ambulance speeds at peak road usage hours. Moreover, ambulances are not slowed down by traffic jams at weekends (Saturday and Sunday). Annually, there is a slight reduction in ambulance speeds (4km/h) in the winter. However, by comparing the speed of emergency trips to technical trips it can be concluded that one general ambulance model can be used if small deviations in speed are accepted.
Constructing the arrival coverage map
To calculate the coverage map CM, each grid point Pi should have calculated the minimum travel time from all standby ambulances:
where
Ai - current location point of ambulance i,
Pi - grid point i.
As a result, the calculated values for each grid point can be applied to the base map by giving the grid coverage of ambulances with the lowest call times. The coverage can be represented with color, e.g. the example scale uses shades of blue for times of 0-10 minutes; green for 11-15 minutes; yellow for 16-20 minutes; and red or black for more than 20 minutes. This is related to statutory travel times of 15 minutes within the city and 20 outside the city.
3 Results
The illustration shows an example of an arrival time coverage map for Cracow (Fig. 4, where two ambulances are on standby: one in the northwest and one in the south. Attention should be paid to the nonlinear nature of such coverage maps, as the journey time for points near motorway exits is significantly shorter than that for points in other areas. The coverage map also illustrates that the northeastern part of the city remains uncovered by emergency medical services within the 20 minute statutory time limits.

An example of arrival coverage map for Cracow (two ambulances) and time scale used (minutes); times in minutes refer to the following colors: 0-10 blue, 11-15 green, 16-20 yellow, 21-25 red.
The coverage designated in the manner described above varies according to the type of urban area: densely built up with a regular and extensive road network (Figure 5(a)); adjacent to main roads with many junctions (Fig. 5(b)); and mountainous (valley) (Fig. 5(c)). Therefore, coverage maps could be of great use to local authorities when creating ambulance station mapping or in crisis situations. The system also implements additional layers related to population density and frequency of accidents based on historical data [29].
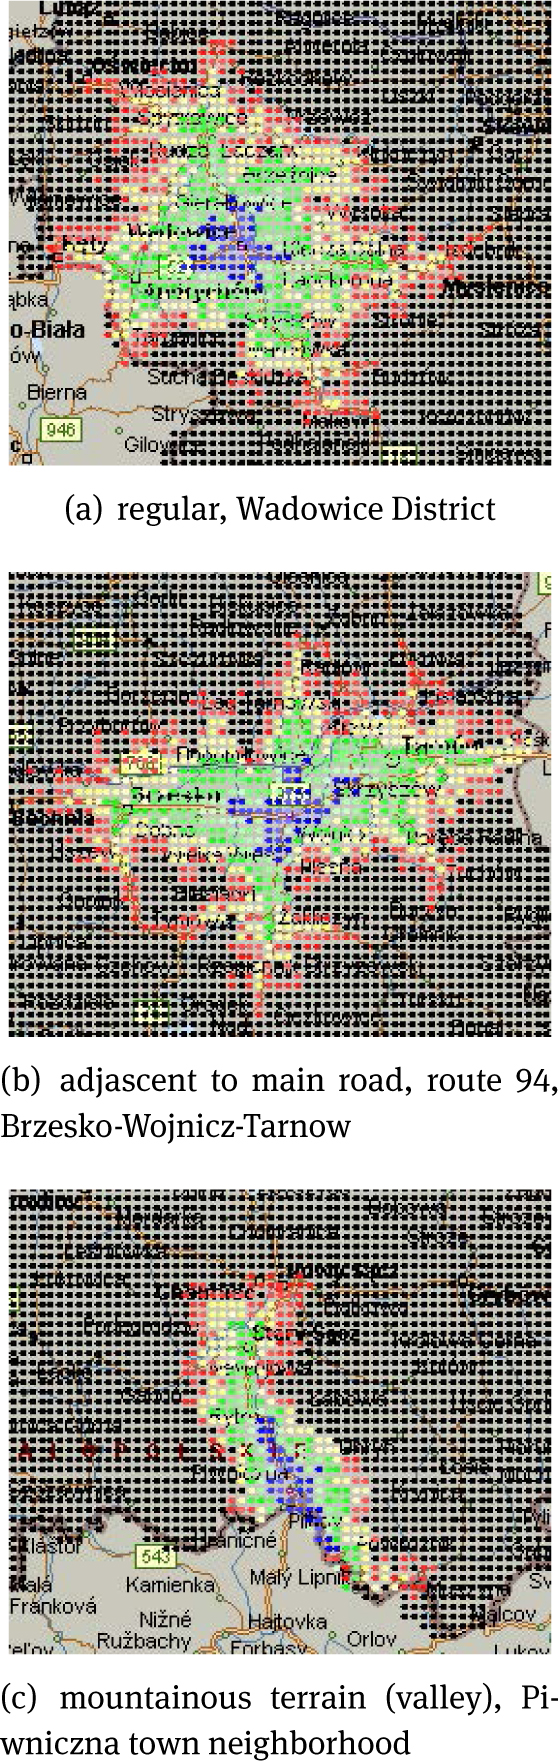
Heterogeneity of area characteristics
3.1 Real-time application
The calculation time of the coverage map in the tested model, with 21448 points covering the city of Krakow with an accuracy of 250 m and the remaining areas of the province with an accuracy of 1000 m, takes about 40 ms on a typical computer with Intel i5 Core CPU. A longer processing time may be caused by preparing a graphic view of map, but such tasks can be performed on the GPU. Therefore, the low requirement for computing power allow realtime depiction of the coverage of ambulance services. Fig. 6 presents a fragment of the map depicting a vehicle drive for two time moments (point A and point B). It is noticeable that the 10-minute access area (blue) is moving with the vehicle position. Such an application has been prepared for implementation by ambulance units of the Malopolskie Voivodeship Office.
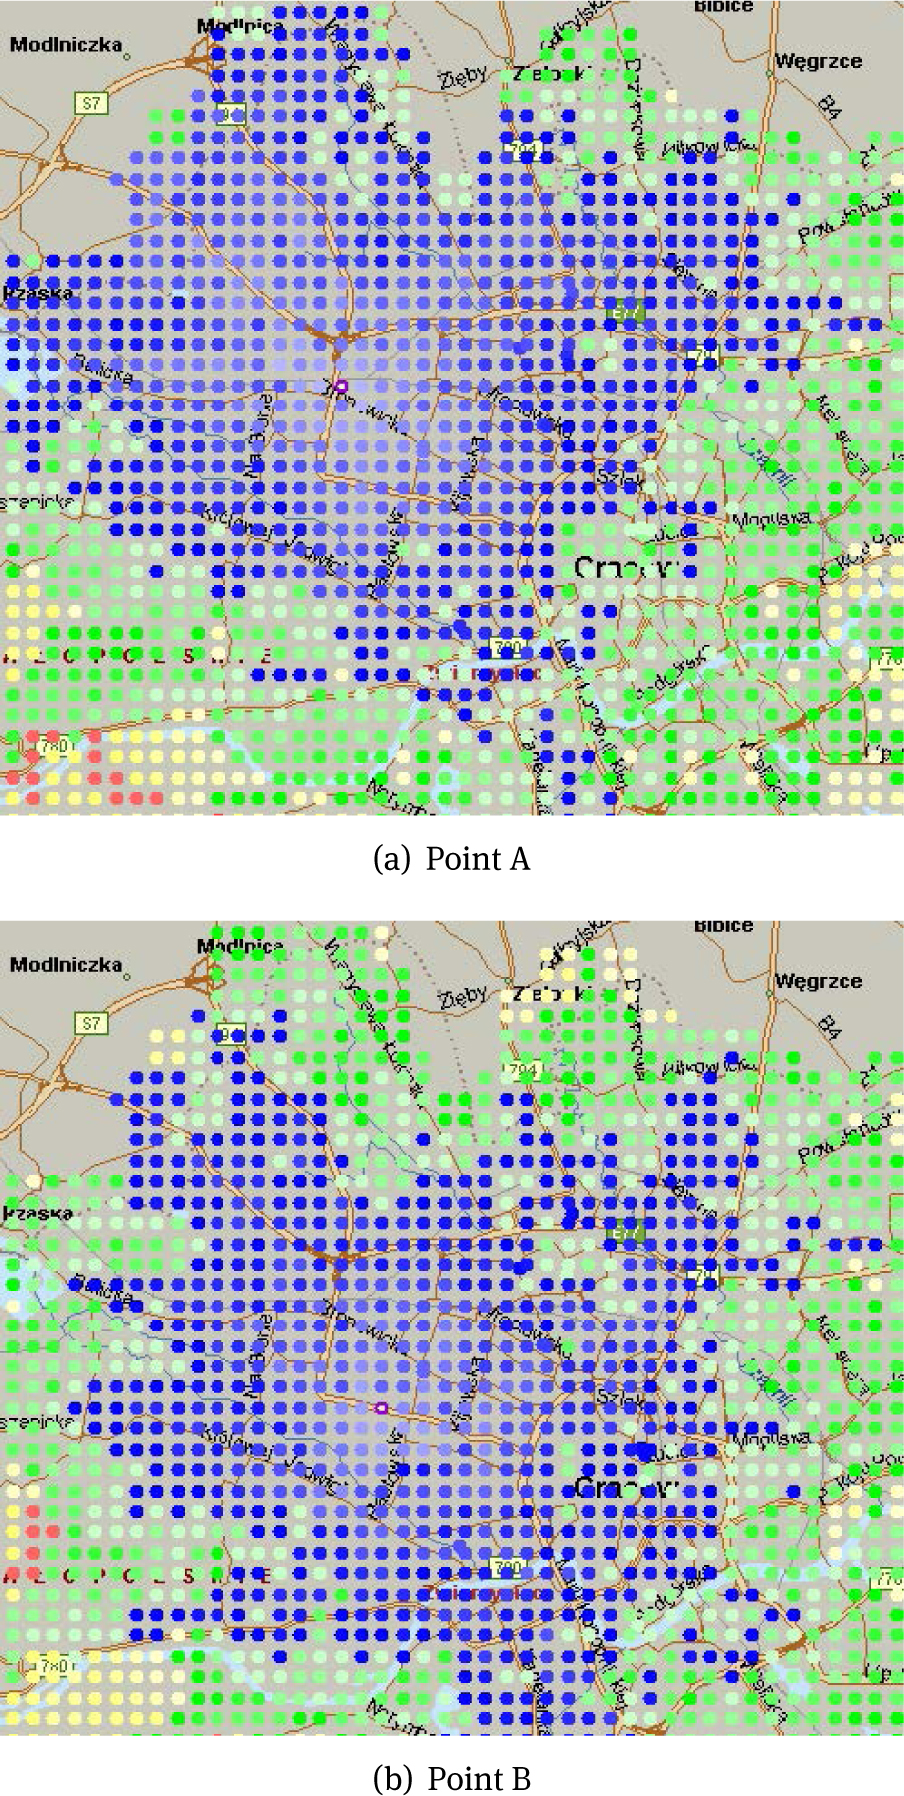
An example of real-time coverage map. The ambulace is marked as a violet circle with a white dot.
4 Conclusions
This article describes a novel approach which supports ambulance fleet planning, management, and redeployment. The proposed solution makes it possible to present service coverage of urban and rural areas by EMS and produces real-time coverage maps that can be used by dispatch or crisis management centers.
The construction details of the proposed system are described in the article. An interesting issue related to the ambulance model based on instantaneous speed was discussed. The results of matching the characteristic velocities used by the network calculation systems are presented. Based on the collected speed data, it was determined that in the administrative area of Malopolskie Voivodeship the speed of ambulances traveling on call is not significantly affected by traffic jams. This proves that one general coverage map is a sufficient approach.
The first implementation of the system took place in 2015 and it was submitted for the Malopolskie Voivodeship Office as a tool supporting the Medical Rescue and Sanitary Unit of the Social Policy Department.
A sample application demo is available on the site:
Acknowledgement
The author would thank to Governor J. Miller; M. Lechowicz, S. Janusz and S. Choroba from Malopolskie Voivodeship Office; F. Banas from KPR and supporting team of M. Lupa, K. Szostek, I. Plokita, P. Lukasik, T. Pazdalski and R. Rumanek.
This work was financed by the AGH - University of Science and Technology, Faculty of Geology, Geophysics and Environmental Protection as a part of statutory project.
References
[1] Kamadjeu R, Tolentino H (2006) Web-based public health geographic in- formation systems for resources-constrained environment using scalable vector graphics technology: a proof of concept applied to the expanded program on immunization data. International Journal of Health Geographics 5(1):2410.1186/1476-072X-5-24Suche in Google Scholar PubMed PubMed Central
[2] Diller GP, Kempny A, Piorkowski A, Grübler M, Swan L, Baumgartner H, Dimopoulos K, Gatzoulis MA (2014) Choice and competition between adult congenital heart disease centers. Circulation: Cardiovascular Quality and Outcomes 7(2):285-29110.1161/CIRCOUTCOMES.113.000555Suche in Google Scholar PubMed
[3] Schuurman N, Fiedler RS, Grzybowski SC, Grund D (2006) Defining rational hospital catchments for non-urban areas based on travel-time. International Journal of Health Geographics 5(1):4310.1186/1476-072X-5-43Suche in Google Scholar PubMed PubMed Central
[4] Flanigan M, Blatt A, Lombardo L, Mancuso D, Miller M, Wiles D, Pirson H, Hwang J, Thill JC, Majka K (2005) Assessment of air medical coverage using the atlas and database of air medical services and correlations with reduced highway fatality rates. Air medical journal 24(4):151-16310.1016/j.amj.2005.05.001Suche in Google Scholar PubMed
[5] Chmielewski S, Samulowska M, Lupa M, Lee D, Zagajewski B (2018) Citizen science and WebGIS for outdoor advertisement visual pollution assessment. Computers, Environment and Urban Systems, 67, 97-10910.1016/j.compenvurbsys.2017.09.001Suche in Google Scholar
[6] Peleg K, Pliskin JS (2004) A geographic information system simulation model of ems: reducing ambulance response time. The American journal of emergency medicine 22(3):164-17010.1016/j.ajem.2004.02.003Suche in Google Scholar PubMed
[7] Shuib A, Zaharudin ZA (2010) Framework of tazopt model for ambulance location and allocation problem. World Academy of Science, Engineering and Technology 70:678-683Suche in Google Scholar
[8] Budge S, Ingolfsson A, Zerom D (2010) Empirical analysis of ambulance travel times: the case of calgary emergency medical services. Management Science 56(4):716-72310.1287/mnsc.1090.1142Suche in Google Scholar
[9] Ingolfsson A (2013) Ems planning and management. In: Operations Re- search and Health Care Policy, Springer, pp 105-12810.1007/978-1-4614-6507-2_6Suche in Google Scholar
[10] Ong MEH, Chiam TF, Ng FSP, Sultana P, Lim SH, Leong BSH, Ong VYK, Tan C, Ching E, Tham LP, et al (2010) Reducing ambulance response times using geospatial-time analysis of ambulance deployment. Academic Emergency Medicine 17(9):951-95710.1111/j.1553-2712.2010.00860.xSuche in Google Scholar PubMed
[11] Terzi O, Sisman A, Canbaz S, Dündar C, Peksen Y (2013) A geographic information system-based analysis of ambulance station coverage area in Samsun, Turkey. Singapore Med J 54(11):653-65810.11622/smedj.2013228Suche in Google Scholar PubMed
[12] Azizan MH, Lim CS, Hatta WALWM GT, Teoh S (2013) Simulation of emergency medical services delivery performance based on real map. International Journal of Engineering and Technology 5(3):2620-2627Suche in Google Scholar
[13] Mason AJ (2013) Simulation and real-time optimised relocation for improving ambulance operations. In: Handbook of Healthcare Operations Management, Springer, pp 289-31710.1007/978-1-4614-5885-2_11Suche in Google Scholar
[14] Lee E (2014) Designing service coverage and measuring accessibility and serviceability of rural and small urban ambulance systems. Systems 2(1):34-5310.3390/systems2010034Suche in Google Scholar
[15] Maxwell MS, Ni EC, Tong C, Henderson SG, Topaloglu H, Hunter SR (2014) A bound on the performance of an optimal ambulance redeployment policy. Operations Research 62(5):1014-102710.1287/opre.2014.1302Suche in Google Scholar
[16] Vanderschuren M, McKune D (2015) Emergency care facility access in rural areas within the golden hour?: Western cape case study. International Journal of Health Geographics 14(1):510.1186/1476-072X-14-5Suche in Google Scholar PubMed PubMed Central
[17] Swalehe M, Aktas SG (2016) Dynamic ambulance deployment to reduce ambulance response times using geographic information systems: A case study of Odunpazari District of Eskisehir Province, Turkey. Procedia Environmental Sciences 36:199-20610.1016/j.proenv.2016.09.033Suche in Google Scholar
[18] Westgate BS, Woodard DB, Matteson DS, Henderson SG (2016) Large- network travel time distribution estimation for ambulances. European Journal of Operational Research 252(1):322- 33310.1016/j.ejor.2016.01.004Suche in Google Scholar
[19] Maxwell MS, Henderson SG, Topaloglu H (2009) Ambulance redeployment: An approximate dynamic programming approach. In: Winter Simulation Conference, Winter Simulation Conference, pp 1850-186010.1109/WSC.2009.5429196Suche in Google Scholar
[20] Sasaki S, Comber AJ, Suzuki H, Brunsdon C (2010) Using genetic algorithms to optimise current and future health planning-the example of ambulance locations. International Journal of Health Geographics 9(1):410.1186/1476-072X-9-4Suche in Google Scholar PubMed PubMed Central
[21] Bernas M, Wisniewska J (2013) Quantum road traffic model for ambulance travel time estimation. Journal of Medical Informatics & Technologies 22:257-264Suche in Google Scholar
[22] Simić D, Simić S (2012) Hybrid artificial intelligence approaches on vehicle routing problem in logistics distribution. Hybrid Artificial Intelligent Systems pp 208-22010.1007/978-3-642-28942-2_19Suche in Google Scholar
[23] Simić D, Kovaćević I, Svirćević V, Simić S (2015) Hybrid firefly model in routing heterogeneous fleet of vehicles in logistics distribution. Logic Journal of the IGPL 23(3):521-53210.1093/jigpal/jzv011Suche in Google Scholar
[24] Gendreau M, Laporte G, Semet F (2001) A dynamic model and parallel tabu search heuristic for real-time ambulance relocation. Parallel computing 27(12):1641-165310.1016/S0167-8191(01)00103-XSuche in Google Scholar
[25] Goldberg J, Paz L (1991) Locating emergency vehicle bases when service time depends on call location. Transportation science 25(4):264-28010.1287/trsc.25.4.264Suche in Google Scholar
[26] Trebacz I (2015) Karetki dojada szybciej (ambulances will arrive more quickly). In: Biuletyn AGH, vol 11, AGH, p 33, URL http://www.agh.edu.pl/en/blog-naukowy/info/article/ambulances-will-arrive-more-quickly-scientific-blog/Suche in Google Scholar
[27] Westgate BS, Woodard DB, Matteson DS, Henderson SG (2013) Travel time estimation for ambulances using bayesian data augmentation. The Annals of Applied Statistics pp 1139-116110.1214/13-AOAS626Suche in Google Scholar
[28] Lewandowski M, P laczek B, Bernas M (2017) Decentralized control of traffic signals with priority for ambulances. Journal of Medical Informatics & Technologies 26:17-25Suche in Google Scholar
[29] Koziel G (2014) Algorytmy wyznaczania optymalnej trasy przejazdu [Algorithms for optimal route determine]. Logistyka 3:3206-3212Suche in Google Scholar
[30] Mitosz M, Ztomaniec P, Badurowicz M (2014) Modele matematyczne optymalizacji tras w tranporcie medycznym [Mathematical models of route optimization in medical transport field], Logistyka, 6(2014), 7524-7533.Suche in Google Scholar
[31] Cichociński P, Dębińska E (2012) Baclanie dostępności komunikacyjnej wybranej lokalizacji z wykorzystaniem funkcji analiz sieciowych [Accessibility study of a selected location using network analysis functions]. Roczniki Geomatyki-Annals of Geomatics, 10(4(54)), 41-48.Suche in Google Scholar
[32] Lewandowicz E, Flisek P (2017) Dostępność komunikacyjna w analizach sieciowych w przestrzeniach heterogenicznych [Communication availability in network analysis in heterogeneous spaces]. Roczniki Geomatyki-Annals of Geomatics, 15(4(79)), 375-389.Suche in Google Scholar
[33] Płokita I, Piórkowski A, Lupa M, et al (2016) Comparative analysis of algorithms for calculating arrival times of emergency vehicles. Geoinformatica Polonica 15:85-91Suche in Google Scholar
[34] Fisher R, Lassa J (2017) Interactive, open source, travel time scenario modelling: tools to facilitate participation in health service access analysis. International Journal of Health Geographics 16(1):1310.1186/s12942-017-0086-8Suche in Google Scholar PubMed PubMed Central
[35] Lukasik P, Piórkowski A (2016) Development of ambulance speed characteristics based on actual data. Studia Informatica 37(1):113-124Suche in Google Scholar
[36] Amram O, Schuurman N, Hameed SM (2011) Mass casualty modelling: a spatial tool to support triage decision making. International Journal of Health Geographics 10(1):4010.1186/1476-072X-10-40Suche in Google Scholar PubMed PubMed Central
[37] Lewandowski M, P laczek B, Bernas M (2017) Self-organizing traffic signal control with prioritization strategy aided by vehicular sensor network. In: IFIP International Conference on Computer Information Systems and Industrial Management, Springer, pp 536-54710.1007/978-3-319-59105-6_46Suche in Google Scholar
[38] Bernaś M, P laczek B, Porwik P, Pamuła T(2014) Segmentation of vehicle detector data for improved k-nearest neighbours-based traffic ow prediction. IET Intelligent Transport Systems 9(3):264- 27410.1049/iet-its.2013.0164Suche in Google Scholar
[39] Jenelius E, Koutsopoulos HN (2017) Urban network travel time prediction based on a probabilistic principal component analysis model of probe data. IEEE Transactions on Intelligent Transportation Systems10.1109/TITS.2017.2703652Suche in Google Scholar
© 2018 Adam Piórkowski, published by De Gruyter
This work is licensed under the Creative Commons Attribution-NonCommercial-NoDerivatives 4.0 License.
Artikel in diesem Heft
- Regular Articles
- Spatio-temporal monitoring of vegetation phenology in the dry sub-humid region of Nigeria using time series of AVHRR NDVI and TAMSAT datasets
- Water Quality, Sediment Characteristics and Benthic Status of the Razim-Sinoie Lagoon System, Romania
- Provenance analysis of the Late Triassic Yichuan Basin: constraints from zircon U-Pb geochronology
- Historical Delineation of Landscape Units Using Physical Geographic Characteristics and Land Use/Cover Change
- ‘Hardcastle Hollows’ in loess landforms: Closed depressions in aeolian landscapes – in a geoheritage context
- Geostatistical screening of flood events in the groundwater levels of the diverted inner delta of the Danube River: implications for river bed clogging
- Utilizing Integrated Prediction Error Filter Analysis (INPEFA) to divide base-level cycle of fan-deltas: A case study of the Triassic Baikouquan Formation in Mabei Slope Area, Mahu Depression, Junggar Basin, China
- Architecture and reservoir quality of low-permeable Eocene lacustrine turbidite sandstone from the Dongying Depression, East China
- Flow units classification for geostatisitical three-dimensional modeling of a non-marine sandstone reservoir: A case study from the Paleocene Funing Formation of the Gaoji Oilfield, east China
- Umbrisols at Lower Altitudes, Case Study from Borská lowland (Slovakia)
- Modelling habitats in karst landscape by integrating remote sensing and topography data
- Mineral Constituents and Kaolinite Crystallinity of the <2 μm Fraction of Cretaceous-Paleogene/Neogene Kaolins from Eastern Dahomey and Niger Delta Basins, Nigeria
- Construction of a dynamic arrival time coverage map for emergency medical services
- Characterizing Seismo-stratigraphic and Structural Framework of Late Cretaceous-Recent succession of offshore Indus Pakistan
- Geosite Assessment Using Three Different Methods; a Comparative Study of the Krupaja and the Žagubica Springs – Hydrological Heritage of Serbia
- Use of discriminated nondimensionalization in the search of universal solutions for 2-D rectangular and cylindrical consolidation problems
- Trying to underline geotourist profile of National park visitors: Case study of NP Fruška Gora, Serbia (Typology of potential geotourists at NP Fruška Gora)
- Fluid-rock interaction and dissolution of feldspar in the Upper Triassic Xujiahe tight sandstone, western Sichuan Basin, China
- Calcified microorganisms bloom in Furongian of the North China Platform: Evidence from Microbialitic-Bioherm in Qijiayu Section, Hebei
- Spatial predictive modeling of prehistoric sites in the Bohemian-Moravian Highlands based on graph similarity analysis
- Geotourism starts with accessible information: the Internet as a promotional tool for the georesources of Lower Silesia
- Models for evaluating craters morphology, relation of indentation hardness and uniaxial compressive strength via a flat-end indenter
- Geotourism in an urban space?
- The first loess map and related topics: contributions by twenty significant women loess scholars
- Modeling of stringer deformation and displacement in Ara salt after the end of salt tectonics
- A multi-criteria decision analysis with special reference to loess and archaeological sites in Serbia (Could geosciences and archaeology cohabitate?)
- Speleotourism in Slovenia: balancing between mass tourism and geoheritage protection
- Attractiveness of protected areas for geotourism purposes from the perspective of visitors: the example of Babiogórski National Park (Poland)
- Implementation of Heat Maps in Geographical Information System – Exploratory Study on Traffic Accident Data
- Mapping War Geoheritage: Recognising Geomorphological Traces of War
- Numerical limitations of the attainment of the orientation of geological planes
- Assessment of runoff nitrogen load reduction measures for agricultural catchments
- Awheel Along Europe’s Rivers: Geoarchaeological Trails for Cycling Geotourists
- Simulation of Carbon Isotope Excursion Events at the Permian-Triassic Boundary Based on GEOCARB
- Morphometry of lunette dunes in the Tirari Desert, South Australia
- Multi-spectral and Topographic Fusion for Automated Road Extraction
- Ground-motion prediction equation and site effect characterization for the central area of the Main Syncline, Upper Silesia Coal Basin, Poland
- Dilatancy as a measure of fracturing development in the process of rock damage
- Error-bounded and Number-bounded Approximate Spatial Query for Interactive Visualization
- The Significance of Megalithic Monuments in the Process of Place Identity Creation and in Tourism Development
- Analysis of landslide effects along a road located in the Carpathian flysch
- Lithological mapping of East Tianshan area using integrated data fused by Chinese GF-1 PAN and ASTER multi-spectral data
- Evaluating the CBM reservoirs using NMR logging data
- The trends in the main thalweg path of selected reaches of the Middle Vistula River, and their relationships to the geological structure of river channel zone
- Lithostratigraphic Classification Method Combining Optimal Texture Window Size Selection and Test Sample Purification Using Landsat 8 OLI Data
- Effect of the hydrothermal activity in the Lower Yangtze region on marine shale gas enrichment: A case study of Lower Cambrian and Upper Ordovician-Lower Silurian shales in Jiangye-1 well
- Modified flash flood potential index in order to estimate areas with predisposition to water accumulation
- Quantifying the scales of spatial variation in gravel beds using terrestrial and airborne laser scanning data
- The evaluation of geosites in the territory of National park „Kopaonik“(Serbia)
- Combining multi-proxy palaeoecology with natural and manipulative experiments — XLII International Moor Excursion to Northern Poland
- Dynamic Reclamation Methods for Subsidence Land in the Mining Area with High Underground Water Level
- Loess documentary sites and their potential for geotourism in Lower Silesia (Poland)
- Equipment selection based on two different fuzzy multi criteria decision making methods: Fuzzy TOPSIS and fuzzy VIKOR
- Land deformation associated with exploitation of groundwater in Changzhou City measured by COSMO-SkyMed and Sentinel-1A SAR data
- Gas Desorption of Low-Maturity Lacustrine Shales, Trassic Yanchang Formation, Ordos Basin, China
- Feasibility of applying viscous remanent magnetization (VRM) orientation in the study of palaeowind direction by loess magnetic fabric
- Sensitivity evaluation of Krakowiec clay based on time-dependent behavior
- Effect of limestone and dolomite tailings’ particle size on potentially toxic elements adsorption
- Diagenesis and rock properties of sandstones from the Stormberg Group, Karoo Supergroup in the Eastern Cape Province of South Africa
- Using cluster analysis methods for multivariate mapping of traffic accidents
- Geographic Process Modeling Based on Geographic Ontology
- Soil Disintegration Characteristics of Collapsed Walls and Influencing Factors in Southern China
- Evaluation of aquifer hydraulic characteristics using geoelectrical sounding, pumping and laboratory tests: A case study of Lokoja and Patti Formations, Southern Bida Basin, Nigeria
- Petrography, modal composition and tectonic provenance of some selected sandstones from the Molteno, Elliot and Clarens Formations, Karoo Supergroup, in the Eastern Cape Province, South Africa
- Deformation and Subsidence prediction on Surface of Yuzhou mined-out areas along Middle Route Project of South-to-North Water Diversion, China
- Abnormal open-hole natural gamma ray (GR) log in Baikouquan Formation of Xiazijie Fan-delta, Mahu Depression, Junggar Basin, China
- GIS based approach to analyze soil liquefaction and amplification: A case study in Eskisehir, Turkey
- Analysis of the Factors that Influence Diagenesis in the Terminal Fan Reservoir of Fuyu Oil Layer in the Southern Songliao Basin, Northeast China
- Gravity Structure around Mt. Pandan, Madiun, East Java, Indonesia and Its Relationship to 2016 Seismic Activity
- Simulation of cement raw material deposits using plurigaussian technique
- Application of the nanoindentation technique for the characterization of varved clay
- Verification of compressibility and consolidation parameters of varved clays from Radzymin (Central Poland) based on direct observations of settlements of road embankment
- An enthusiasm for loess: Leonard Horner in Bonn and Liu Tungsheng in Beijing
- Limit Support Pressure of Tunnel Face in Multi-Layer Soils Below River Considering Water Pressure
- Spatial-temporal variability of the fluctuation of water level in Poyang Lake basin, China
- Modeling of IDF curves for stormwater design in Makkah Al Mukarramah region, The Kingdom of Saudi Arabia